
Temporal and Spatial Water Quality Assessment of the Geumho River, Korea, Using Multivariate Statistics and Water Quality Indices


Abstract
1. Introduction
2. Materials and Methods
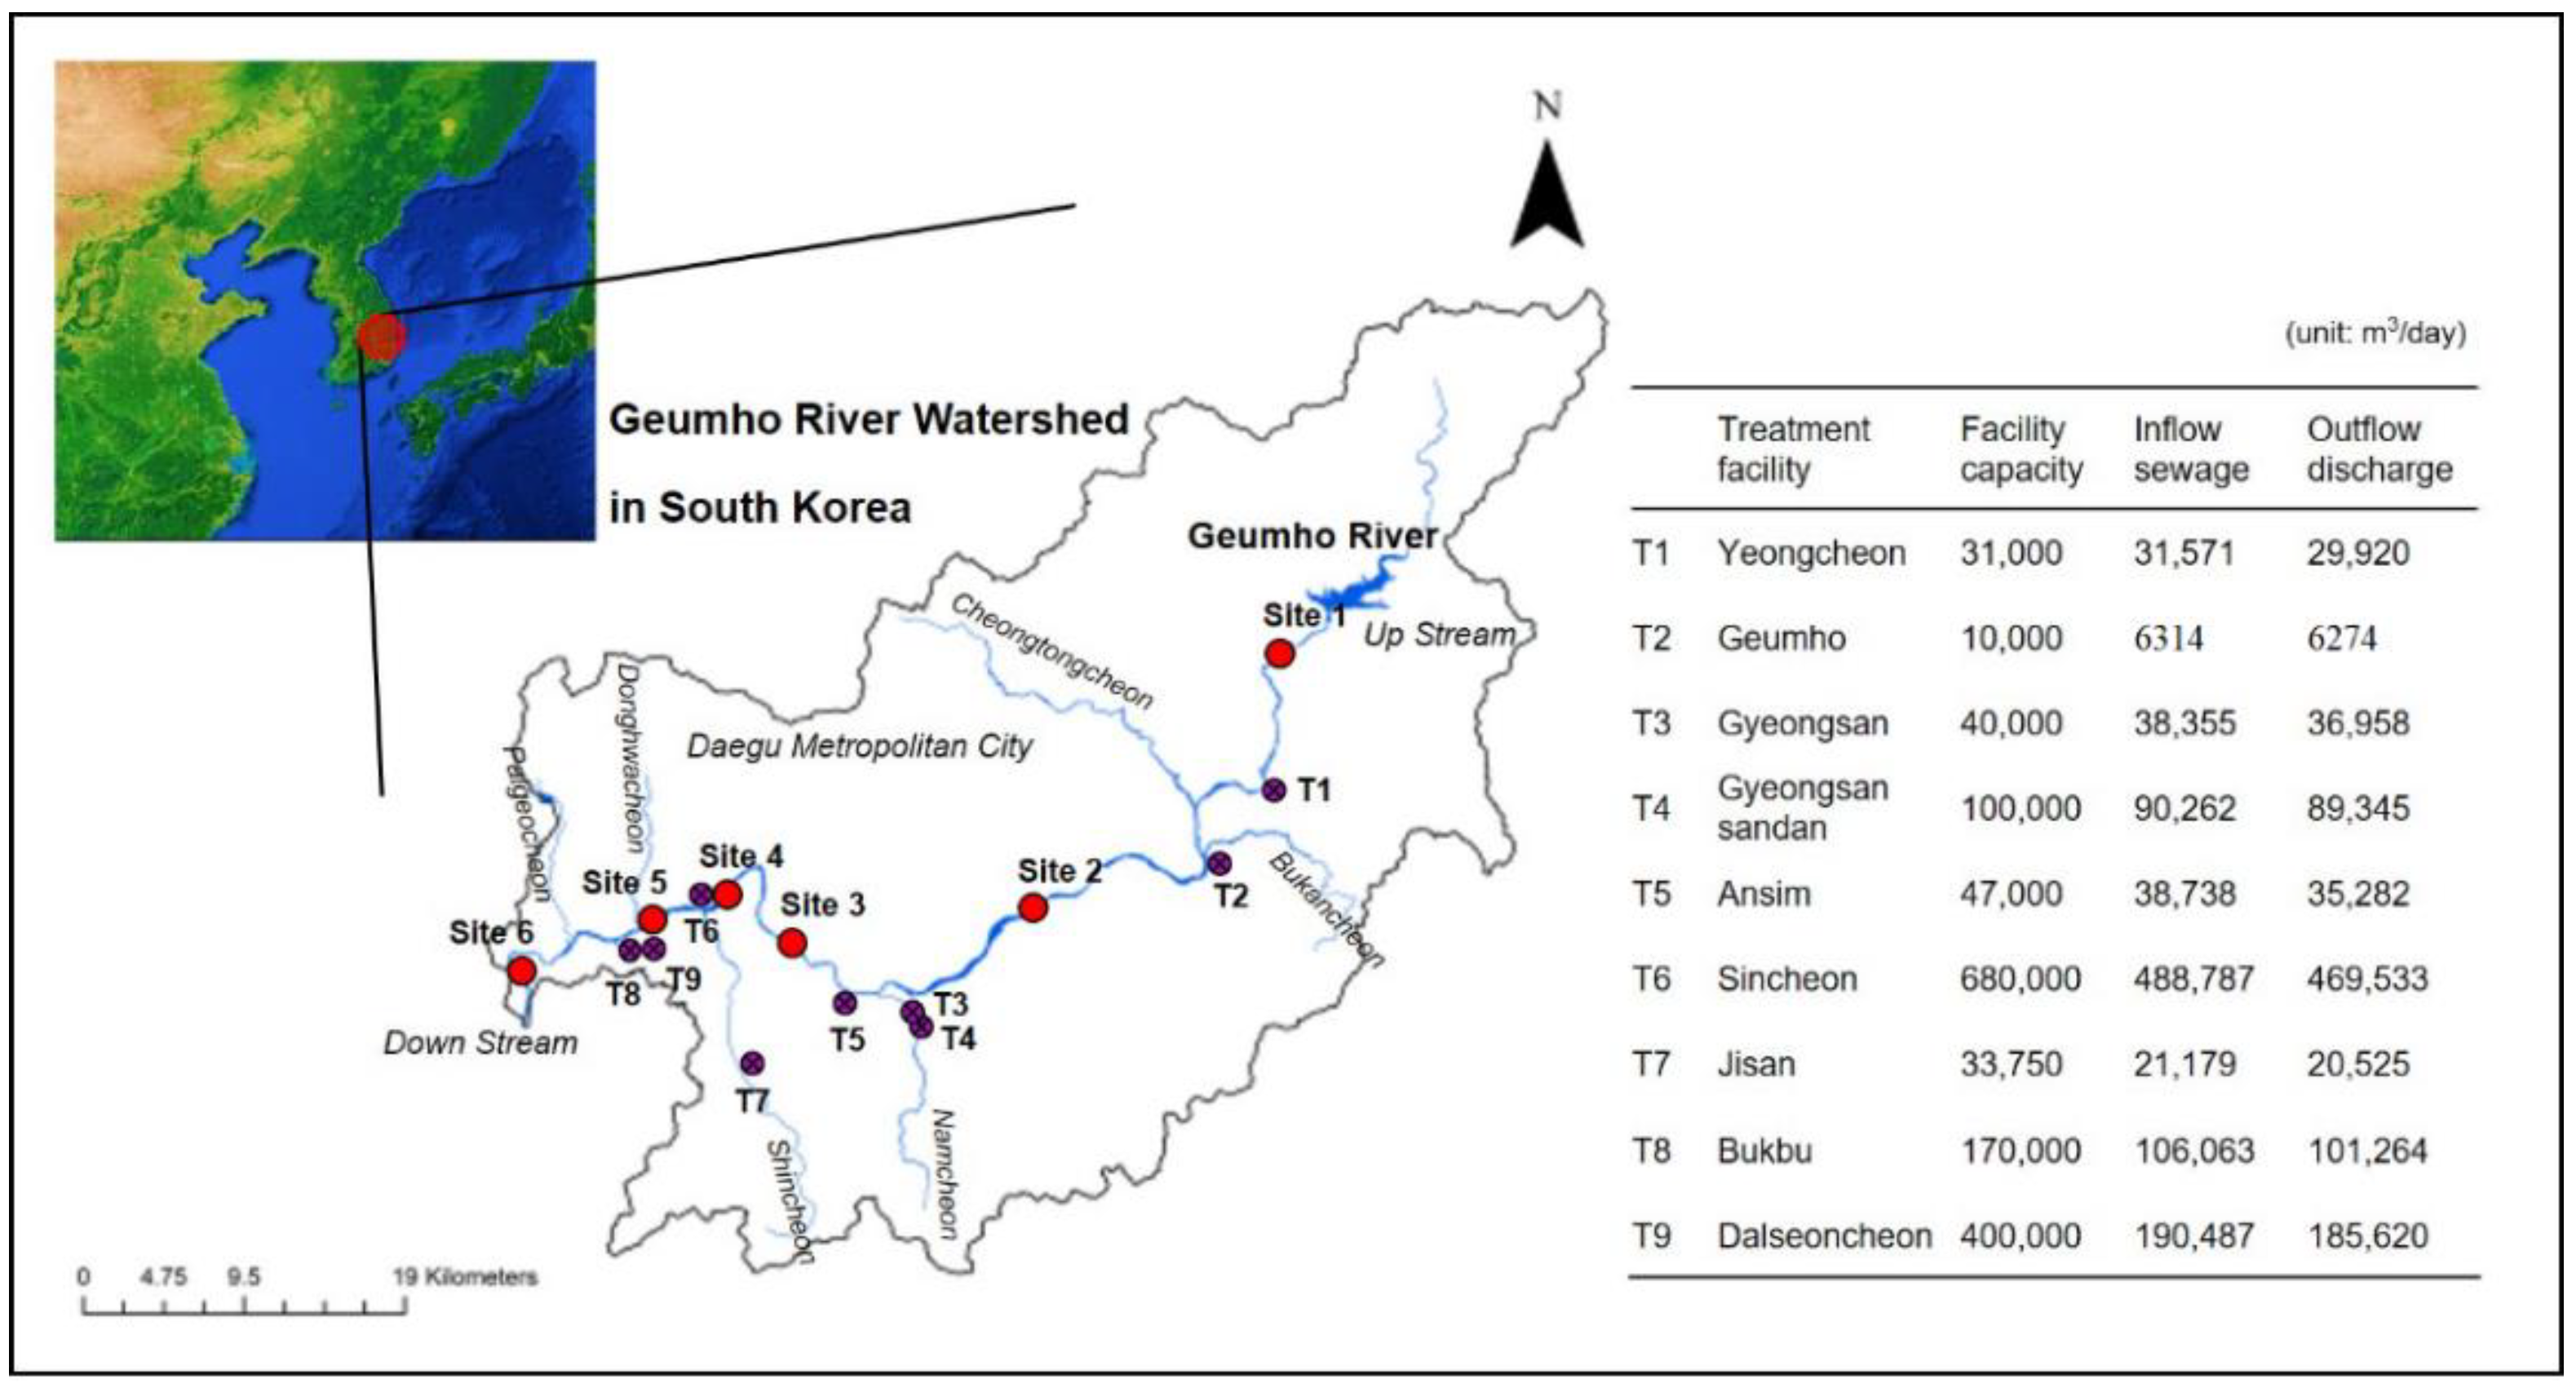
2.1. Study Watershed
2.2. Water Quality Analysis
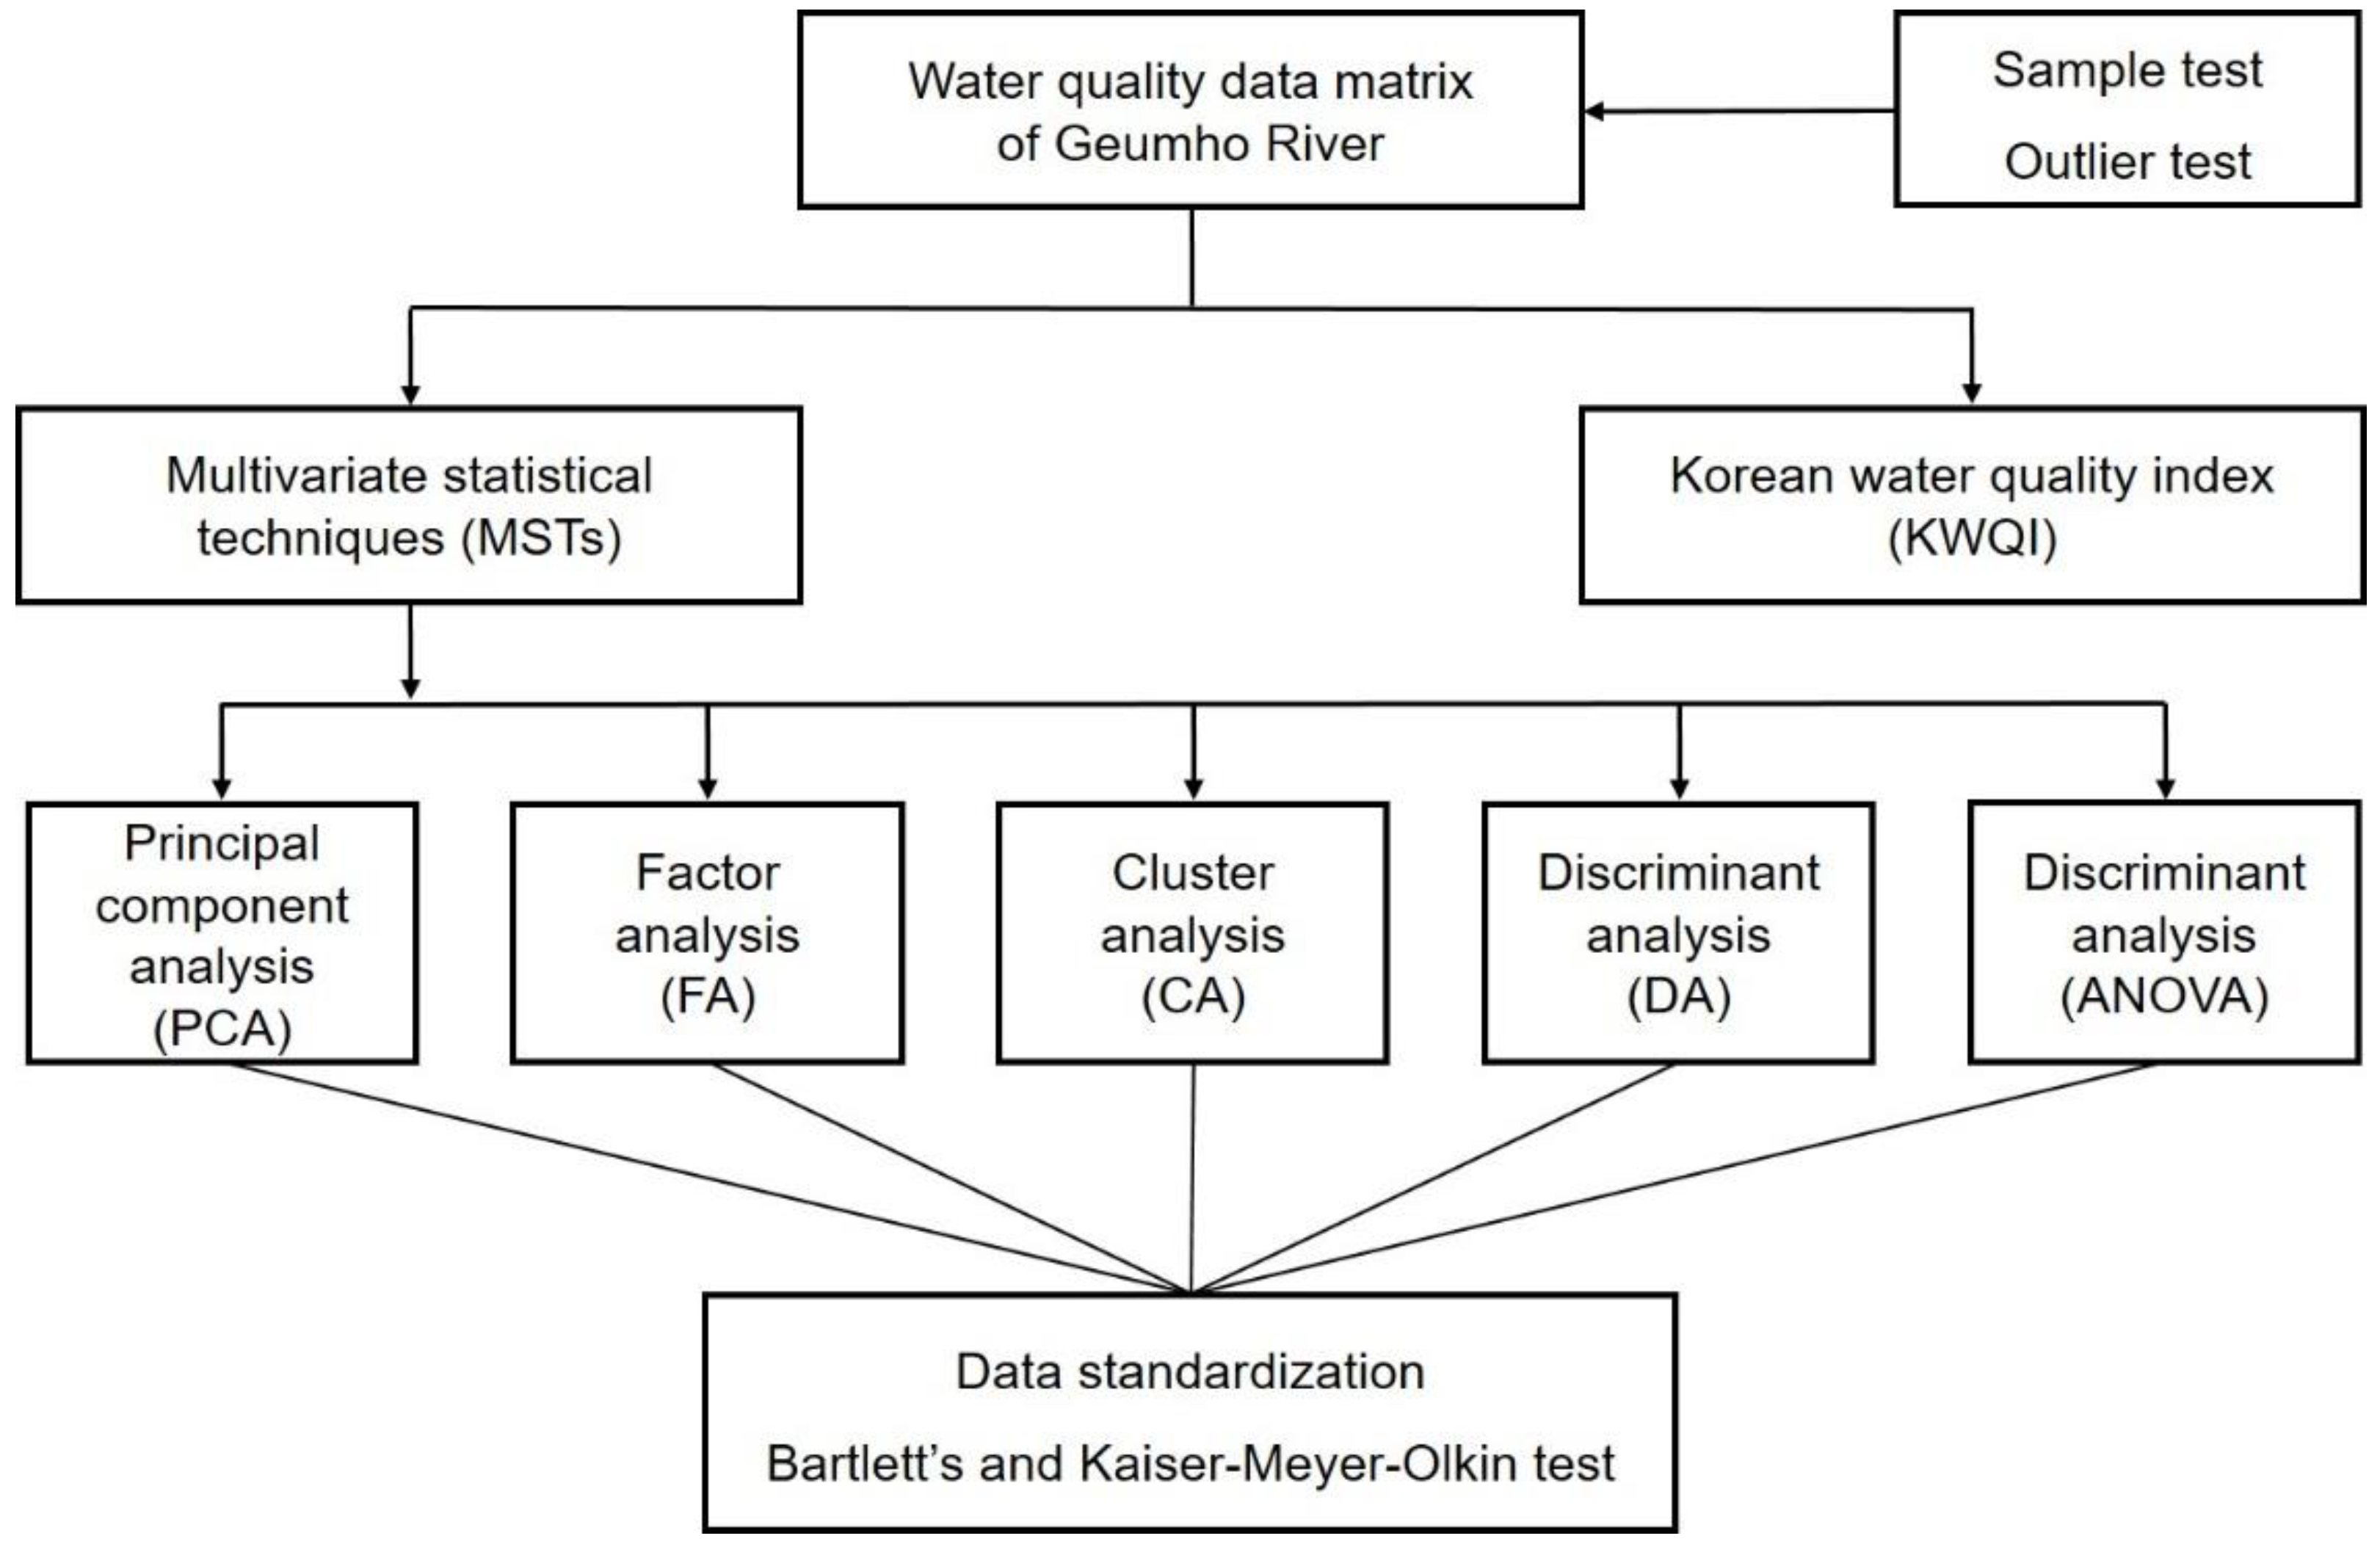
2.3. Statistical Analysis
2.4. PCA and FA
2.5. CA
2.6. DA and ANOVA
2.7. KWQI
3. Results and Discussion
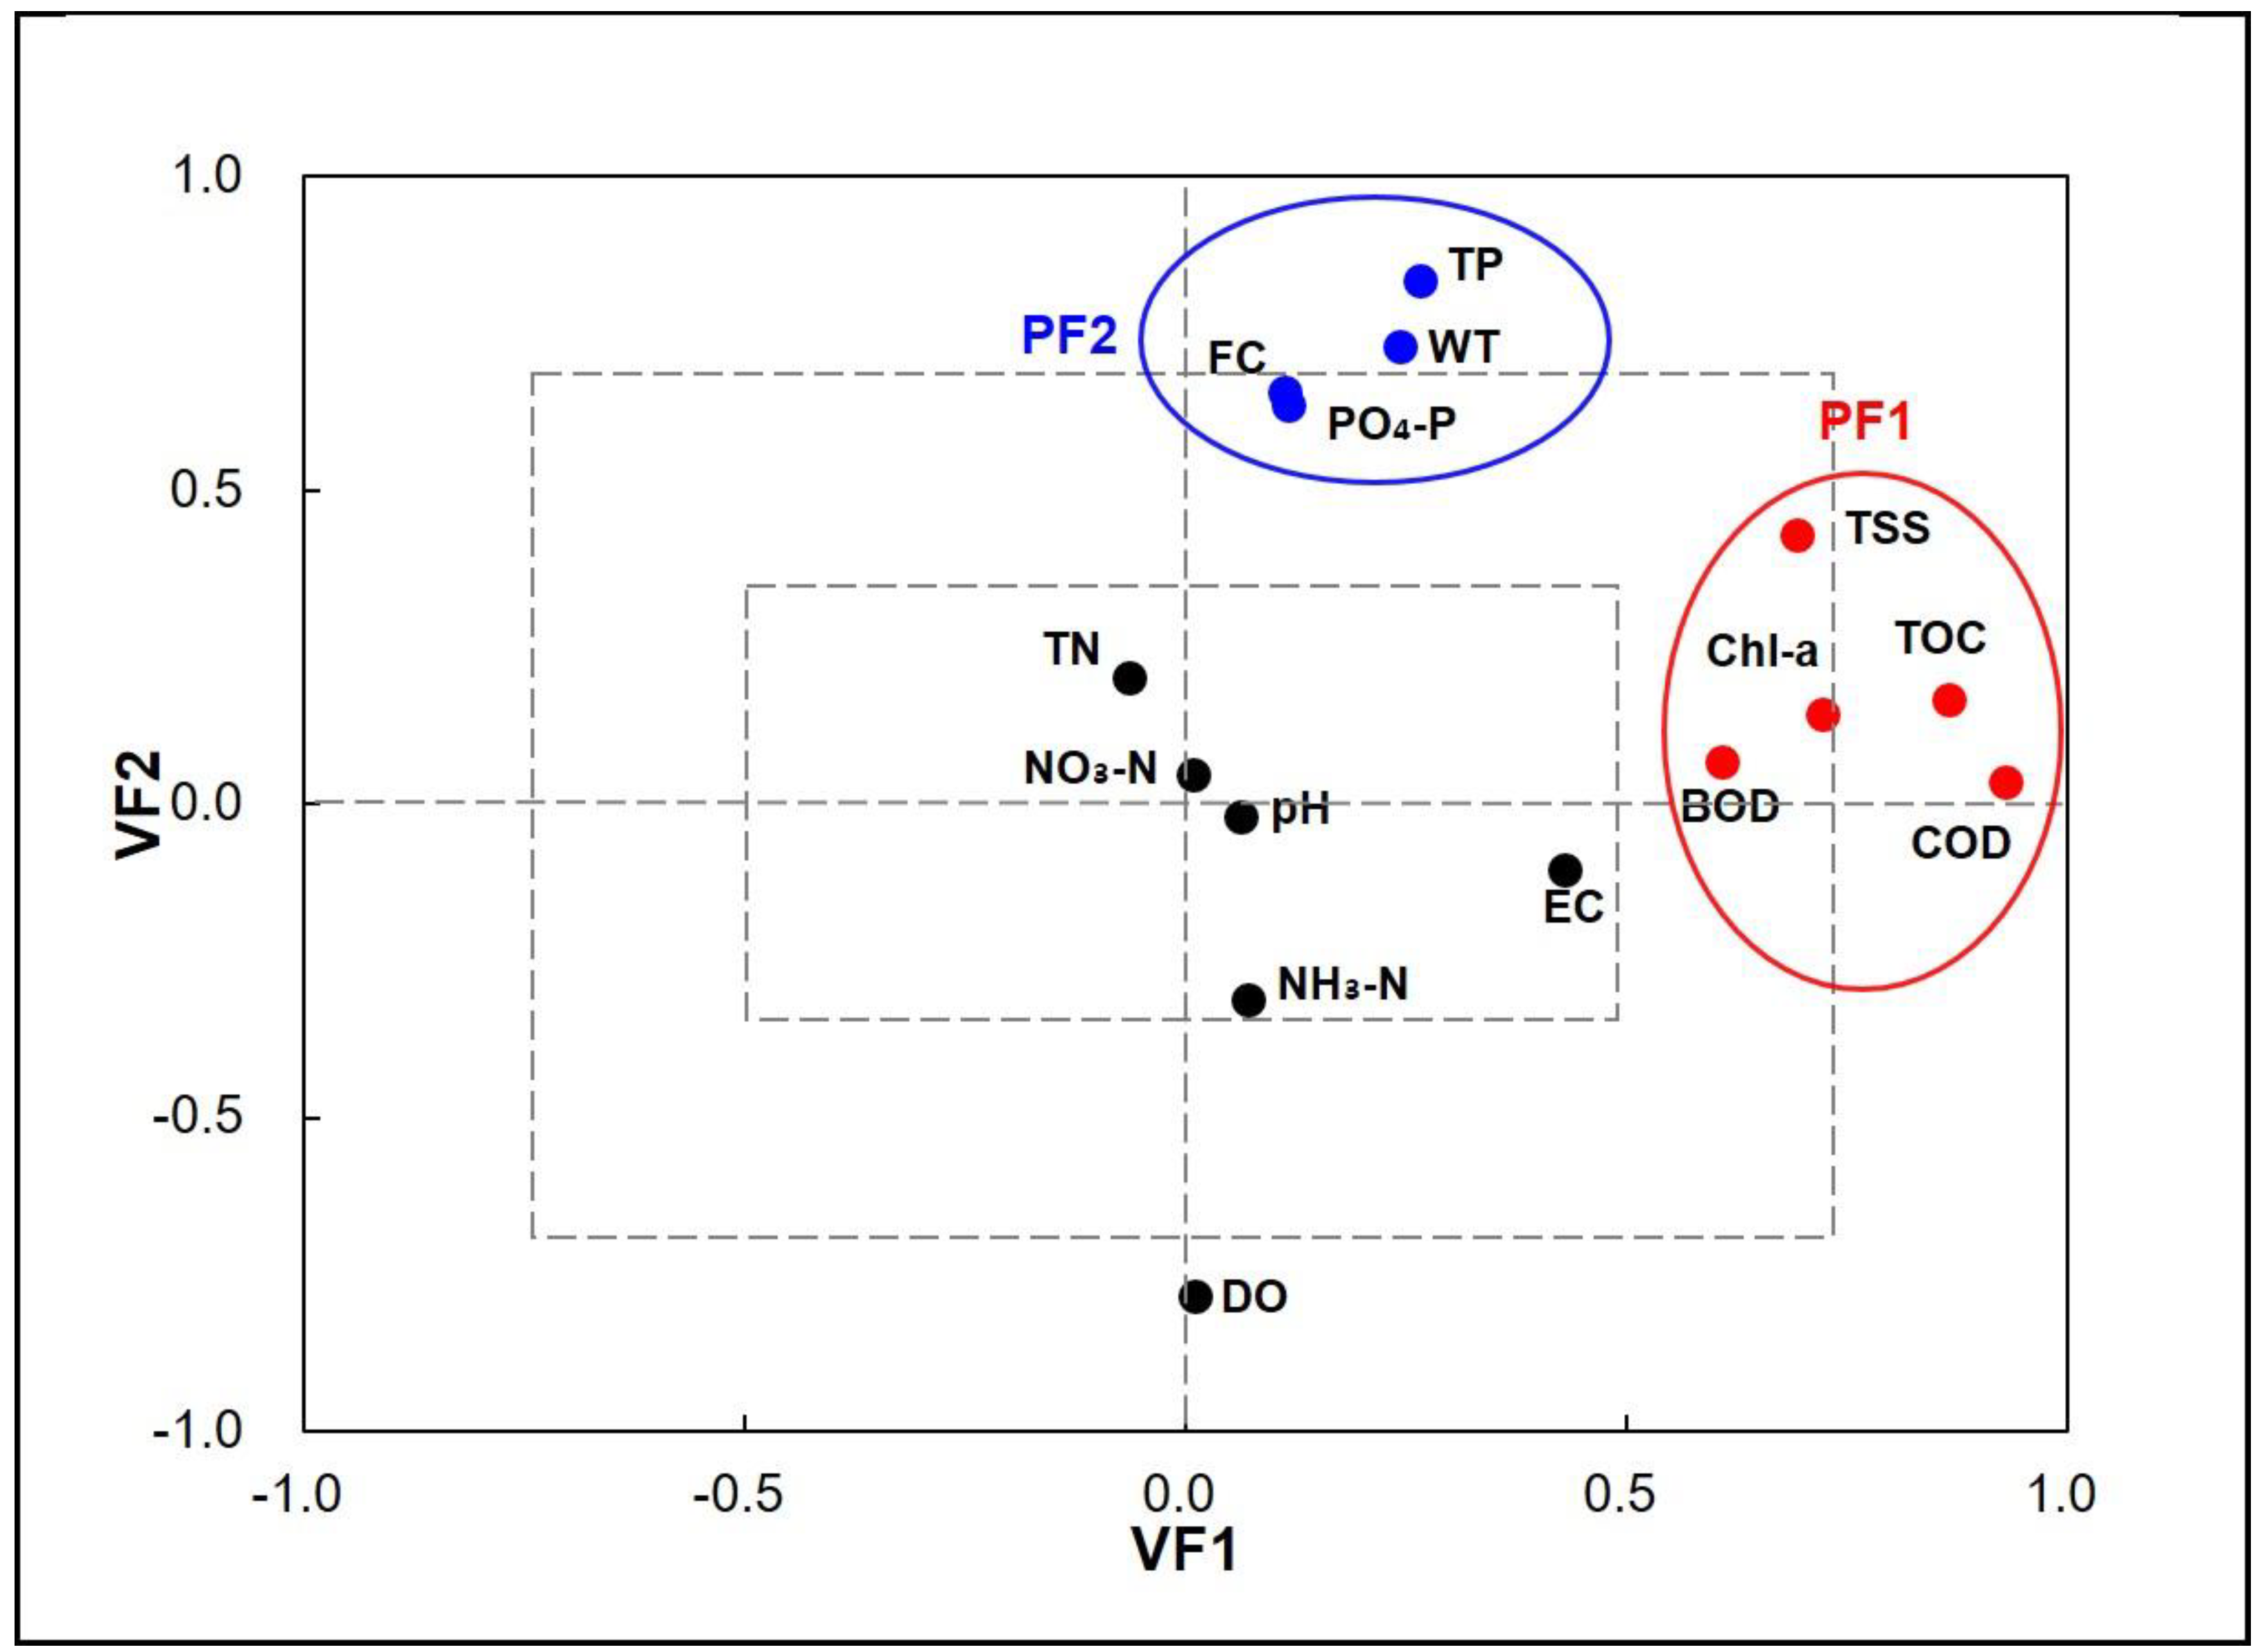
3.1. PCA and FA
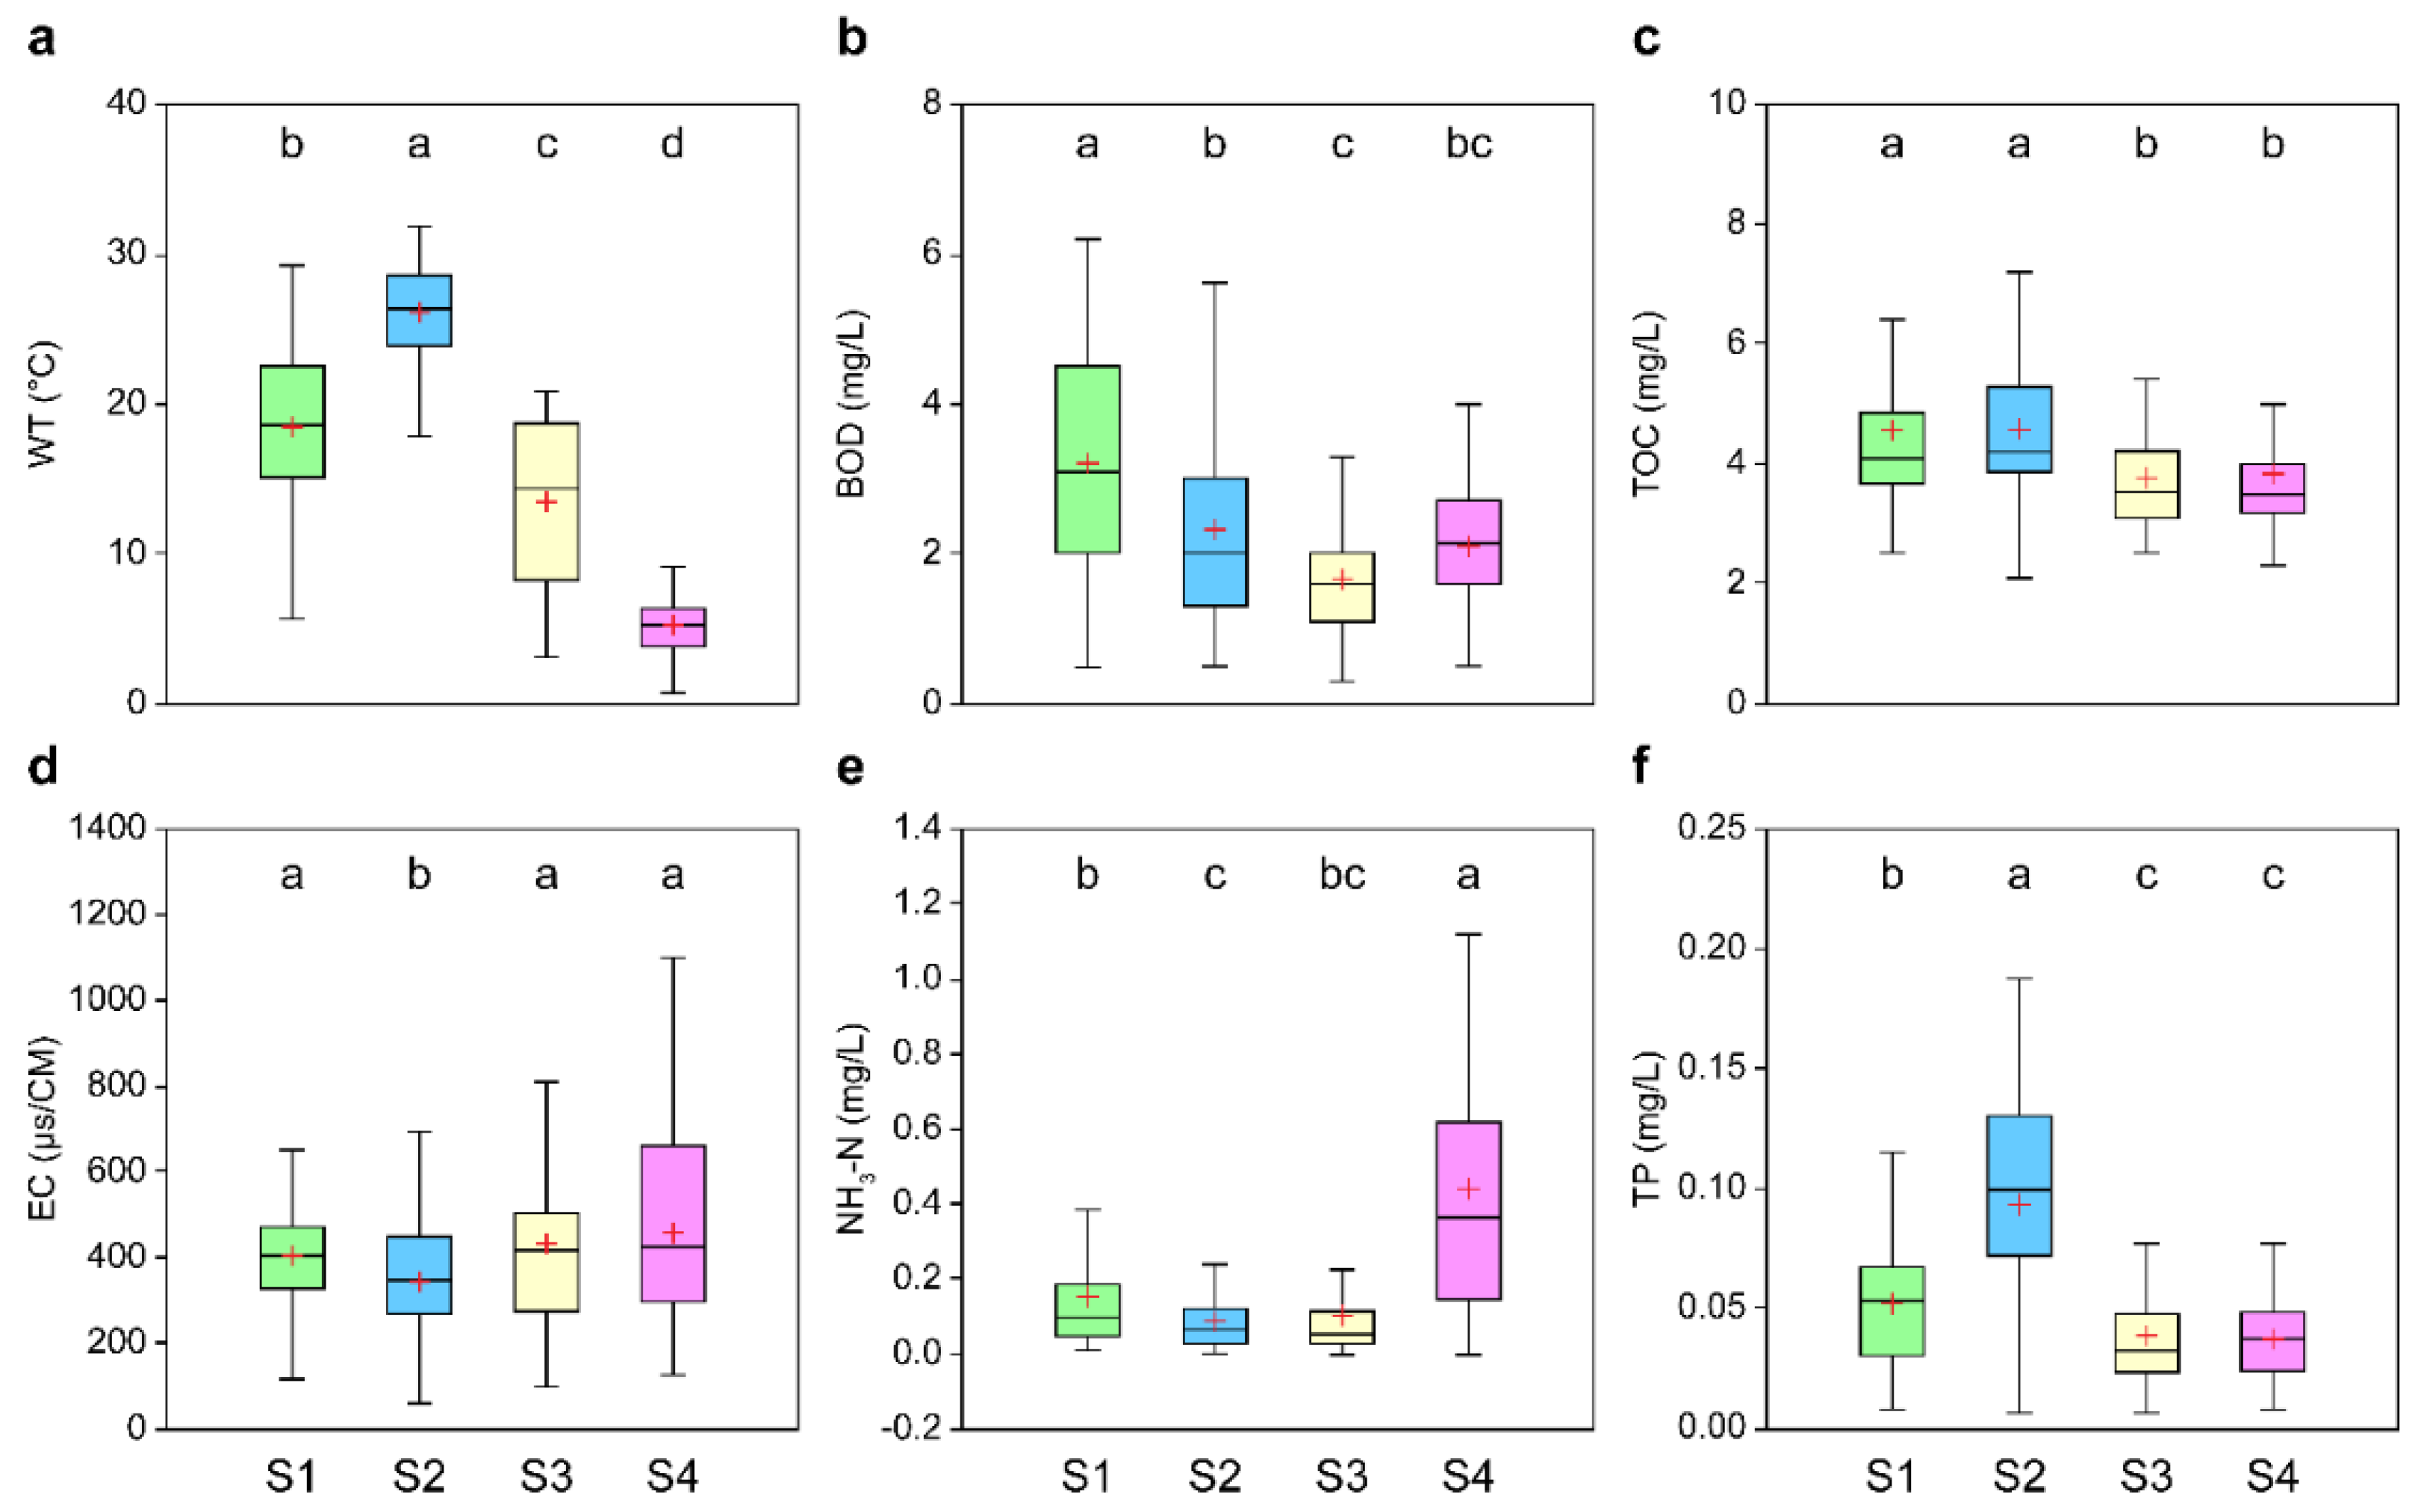
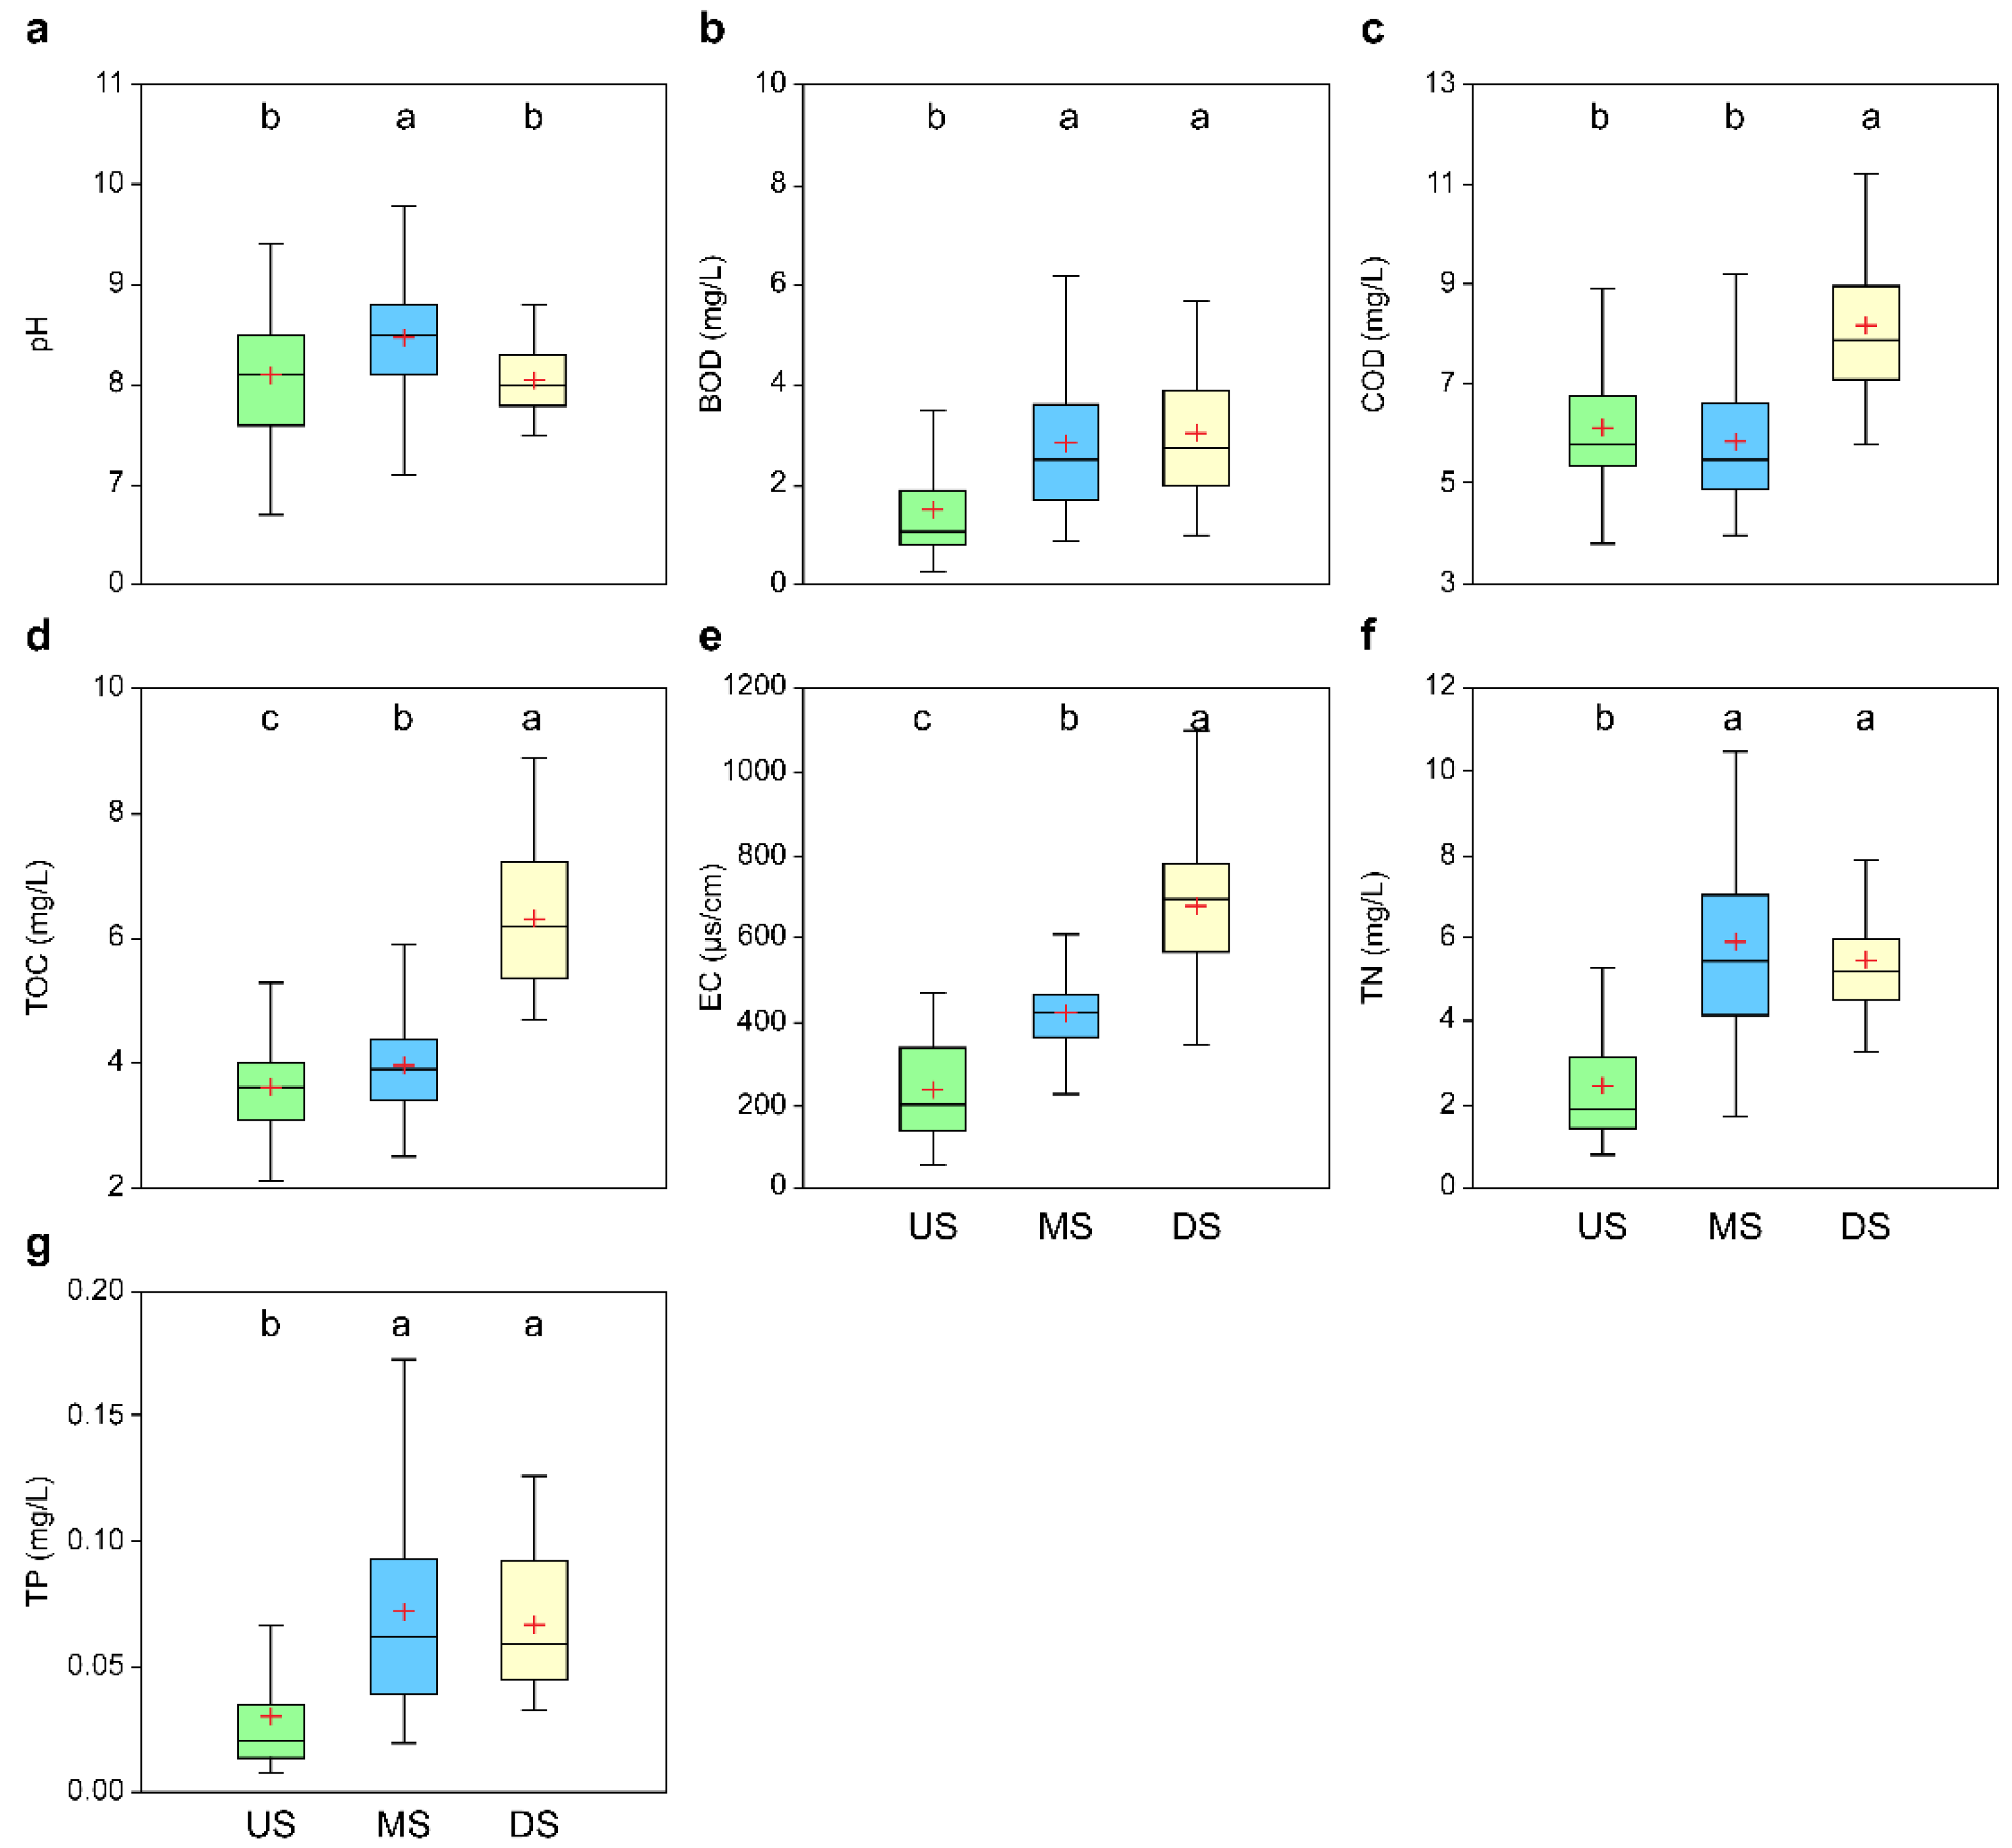
3.2. Water Quality Assessment
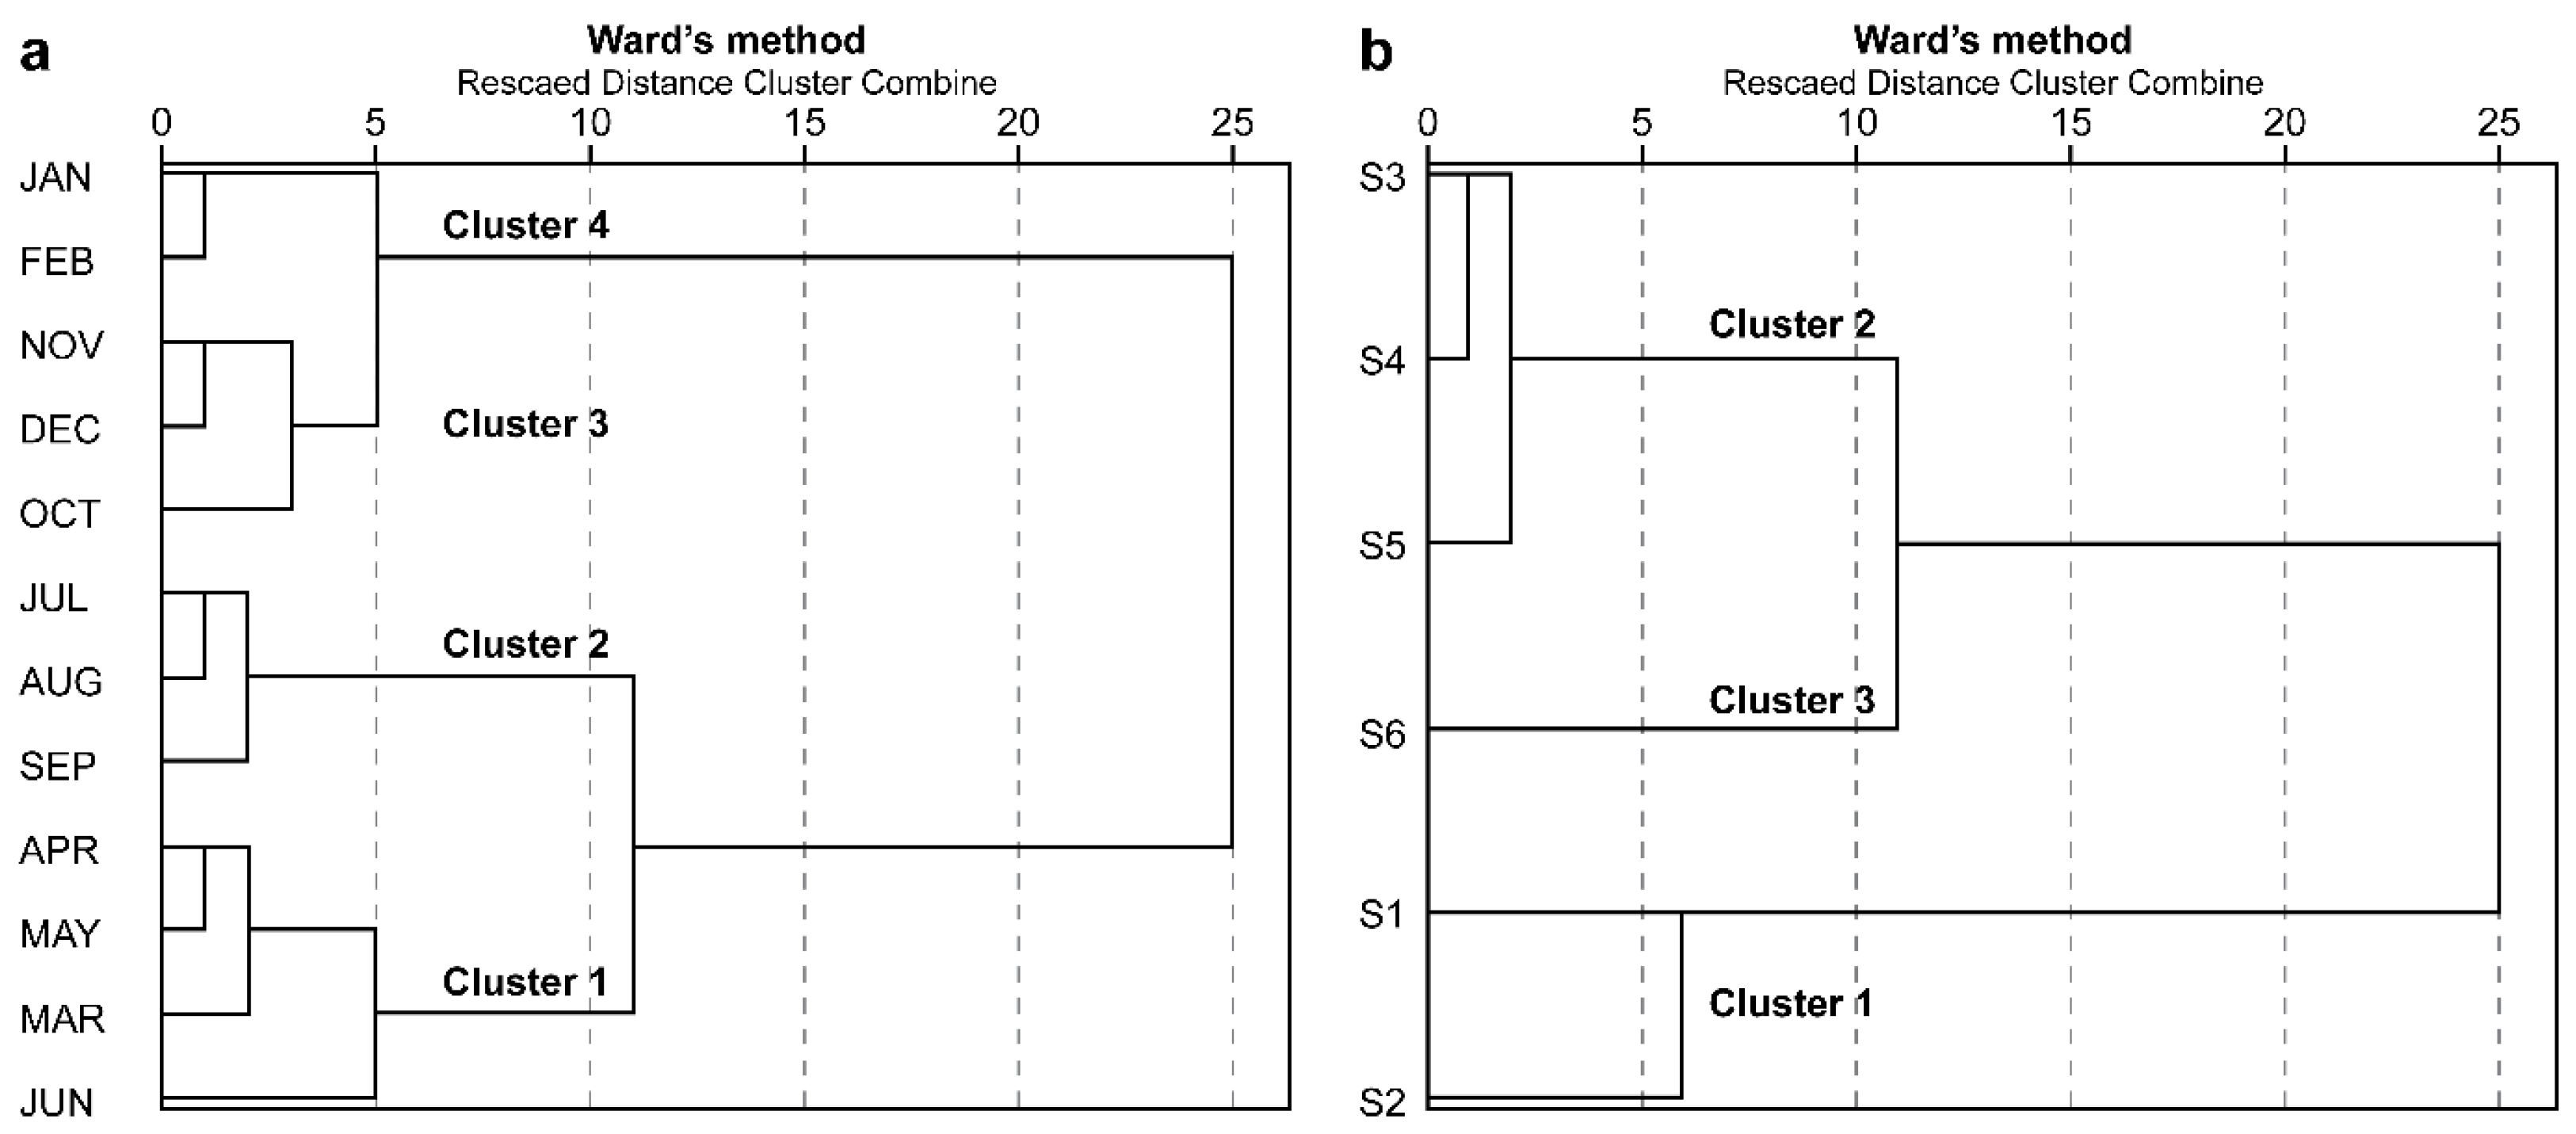
3.3. Temporal and Spatial Cluster Analysis
3.4. Temporal and Spatial DA
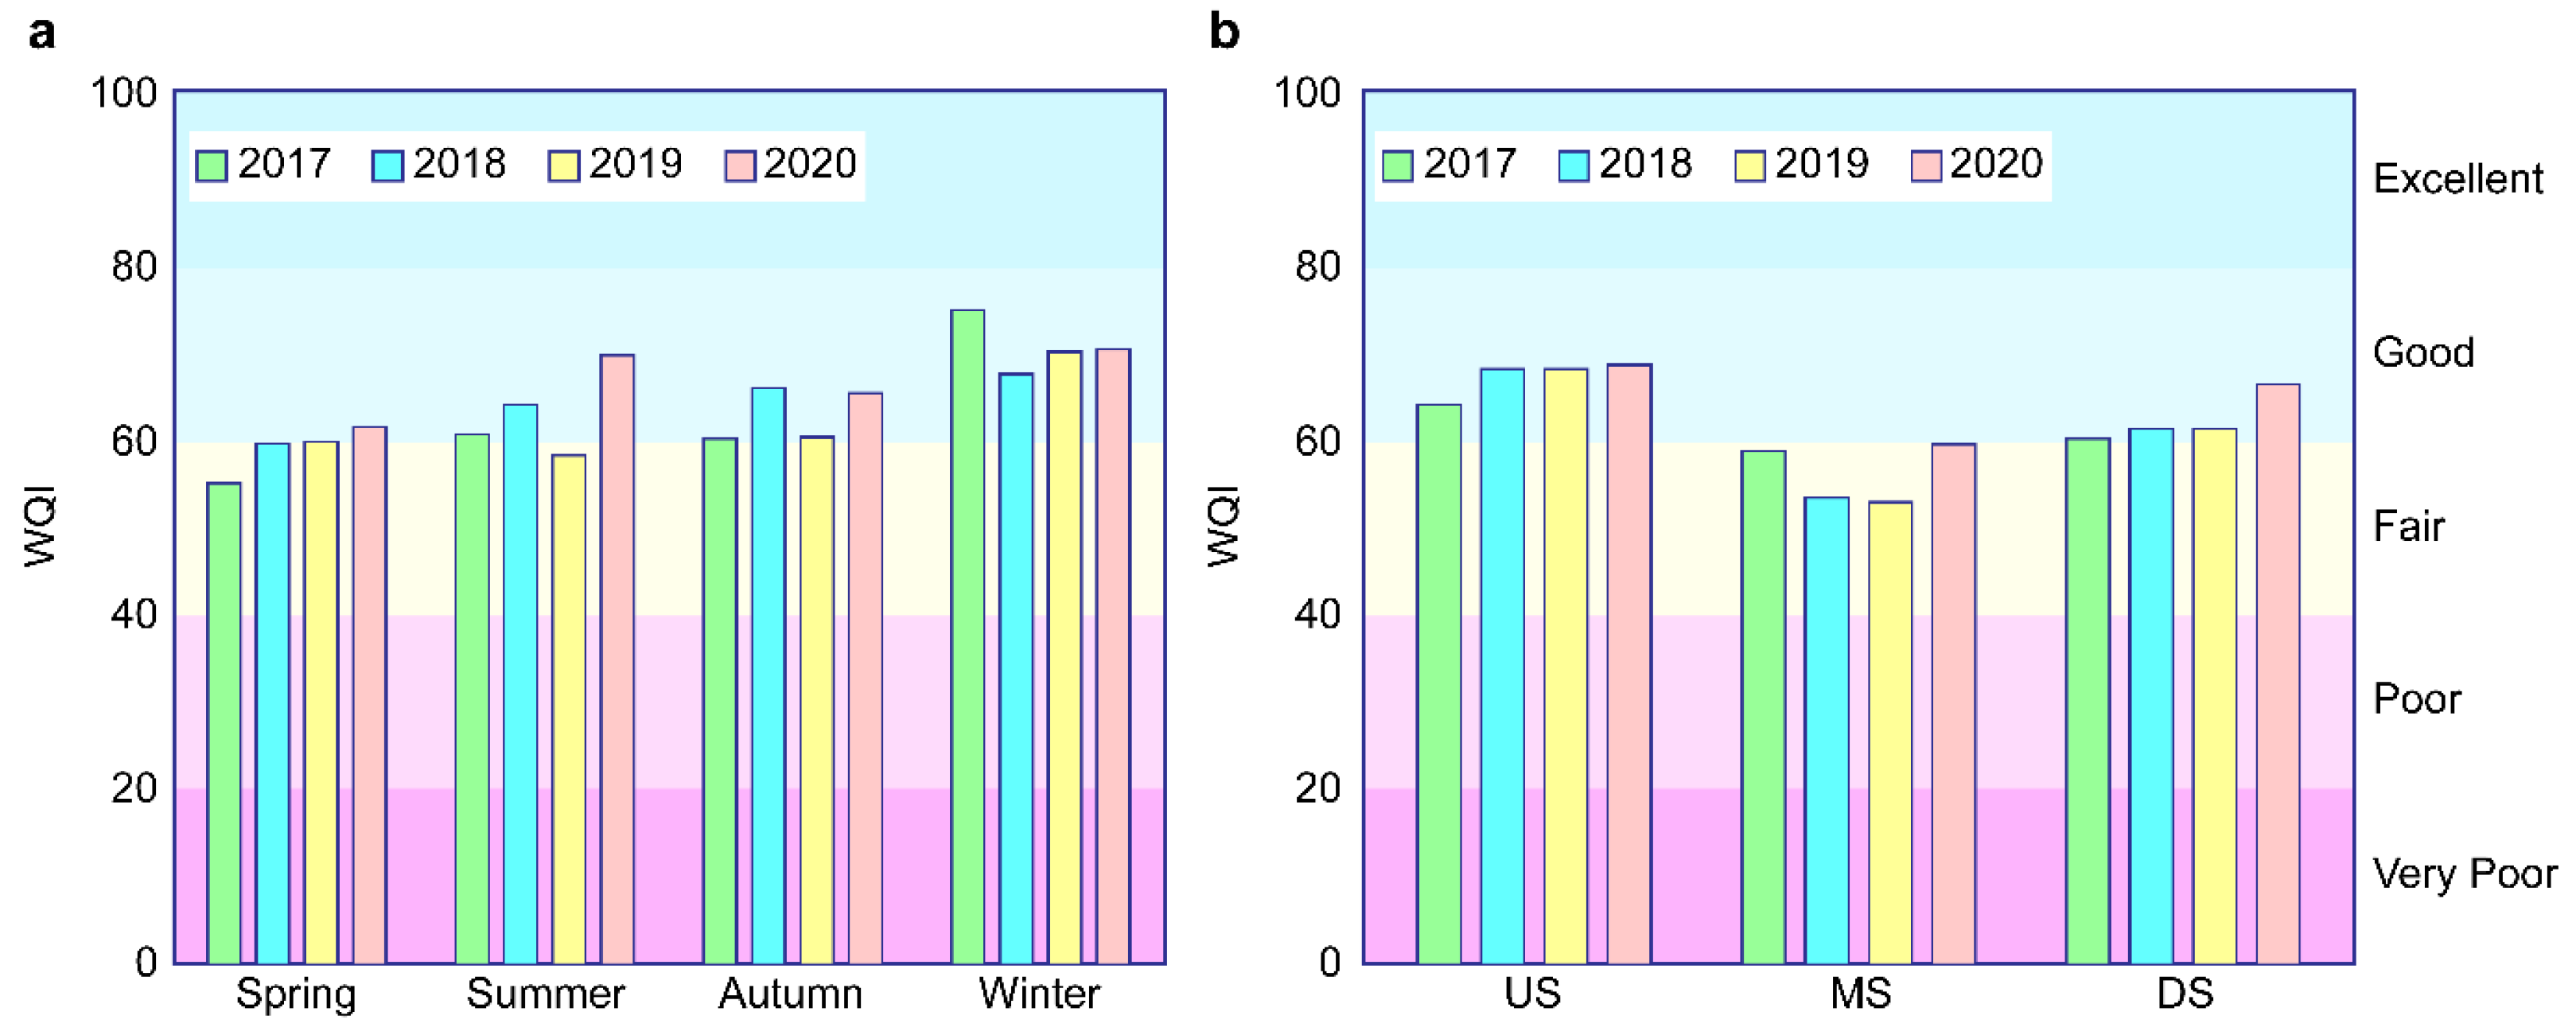
3.5. Water Quality Assessment Using the KWQI
4. Conclusions
Author Contributions
Funding
Institutional Review Board Statement
Informed Consent Statement
Data Availability Statement
Acknowledgments
Conflicts of Interest
References
- Li, D.; Huang, D.; Guo, C.; Guo, X. Multivariate statistical analysis of temporal-spatial variations in water quality of a constructed wetland purification system in a typical park in Beijing, China. Environ. Monit. Assess. 2015, 187, 4219. [Google Scholar] [CrossRef] [PubMed]
- Zeinalzadeh, K.; Rezaei, E. Determining spatial and temporal changes of surface water quality using principal component analysis. J. Hydrol. Reg. Stud. 2017, 13, 1–10. [Google Scholar] [CrossRef]
- Wu, Z.; Wang, X.; Chen, Y.; Cai, Y.; Deng, J. Assessing river water quality using water quality index in Lake Taihu Basin, China. Sci. Total Environ. 2018, 612, 914–922. [Google Scholar] [CrossRef] [PubMed]
- Mishra, A.P.; Khali, H.; Singh, S.; Pande, C.B.; Singh, R.; Chaurasia, S.K. An assessment of in-situ water quality parameters and its variation with Landsat 8 level 1 surface reflectance datasets. Int. J. Environ. Anal. Chem. 2021, 1–23. [Google Scholar] [CrossRef]
- Salla, M.R.; Ferreira, A.M.; Pereira, C.E.; Schmidt, M.A.R. Self-cleaning ability of the middle and lower courses of the Uberaba River, Upgrh-GD8. J. Urban Environ. Eng. 2014, 8, 118–133. [Google Scholar] [CrossRef][Green Version]
- Wen, Y.; Schoups, G.; van de Giesen, N. Organic pollution of rivers: Combined threats of urbanization, livestock farming and global climate change. Sci. Rep. 2017, 7, srep43289. [Google Scholar] [CrossRef]
- Park, J.H.; Park, B.K.; Lee, J.K.; Rhew, D.H. Necessity of refractory organic matter management in total maximum daily loads (TMDLs). J. Korean Soc. Water Environ. 2013, 29, 393–399. [Google Scholar]
- Jung, K.Y.; Ahn, J.-M.; Lee, K.-L.; Lee, I.-J.; Yu, J.-J.; Cheon, S.-U.; Kim, K.-S.; Han, K.-Y. Temporal and spatial analysis of non-biodegradable organic pollutants in the Geumho River system. J. Environ. Sci. Int. 2015, 24, 1343–1362. [Google Scholar] [CrossRef]
- Tian, Y.; Jiang, Y.; Liu, Q.; Dong, M.; Xu, D.; Liu, Y.; Xu, X. Using a water quality index to assess the water quality of the upper and middle streams of the Luanhe River, northern China. Sci. Total Environ. 2019, 667, 142–151. [Google Scholar] [CrossRef]
- Nong, X.; Shao, D.; Zhong, H.; Liang, J. Evaluation of water quality in the South-to-North Water Diversion Project of China using the water quality index (WQI) method. Water Res. 2020, 178, 115781. [Google Scholar] [CrossRef]
- Varol, M. Spatio-temporal changes in surface water quality and sediment phosphorus content of a large reservoir in Turkey. Environ. Pollut. 2020, 259, 113860. [Google Scholar] [CrossRef] [PubMed]
- Pande, C.B.; Moharir, K.N.; Singh, S.K.; Dzwairo, B. Groundwater evaluation for drinking purposes using statistical index: Study of Akola and Buldhana districts of Maharashtra, India. Environ. Dev. Sustain. 2020, 22, 7453–7471. [Google Scholar] [CrossRef]
- Jo, C.D.; Lee, C.G.; Kwon, H.G. Effects of multifunctional weir construction on key water quality indicators: A case study in Nakdong River, Korea. Int. J. Environ. Sci. Technol. 2022, 1–14. [Google Scholar] [CrossRef]
- Shrestha, S.; Kazama, F. Assessment of surface water quality using multivariate statistical techniques: A case study of the Fuji river basin, Japan. Environ. Modell. Softw. 2007, 22, 464–475. [Google Scholar] [CrossRef]
- Fan, X.; Cui, B.; Zhao, H.; Zhang, Z.; Zhang, H. Assessment of river water quality in Pearl River Delta using multivariate statistical techniques. Procedia Environ. Sci. 2010, 2, 1220–1234. [Google Scholar] [CrossRef]
- Barakat, A.; Baghdadi, M.E.; Rais, J.; Aghezzaf, B.; Slassi, M. Assessment of spatial and seasonal water quality variation of Oum Er Rbia River (Morocco) using multivariate statistical techniques. Int. Soil Water Conserv. Res. 2016, 4, 284–292. [Google Scholar] [CrossRef]
- Chai, Y.; Xiao, C.; Li, M.; Liang, X. Hydrogeochemical characteristics and groundwater quality evaluation based on multivariate statistical analysis. Water 2020, 12, 2792. [Google Scholar] [CrossRef]
- Li, T.; Li, S.; Liang, C.; Bush, R.T.; Xiong, L.; Jiang, Y. A comparative assessment of Australia’s Lower Lakes water quality under extreme drought and post-drought conditions using multivariate statistical techniques. J. Clean. Prod. 2018, 190, 1–11. [Google Scholar] [CrossRef]
- Gurjar, S.K.; Tare, V. Spatial-temporal assessment of water quality and assimilative capacity of river Ramganga, a tributary of Ganga using multivariate analysis and QUEL2K. J. Clean. Prod. 2019, 222, 550–564. [Google Scholar] [CrossRef]
- Ustaoğlu, F.; Tepe, Y.; Taş, B. Assessment of stream quality and health risk in a subtropical Turkey river system: A combined approach using statistical analysis and water quality index. Ecol. Indic. 2020, 113, 105815. [Google Scholar] [CrossRef]
- Elbeltagi, A.; Pande, C.B.; Kouadri, S.; Islam, A.R.M. Applications of various data-driven models for the prediction of groundwater quality index in the Akot basin, Maharashtra, India. Environ. Sci. Pollut. Res. 2022, 29, 17591–17605. [Google Scholar] [CrossRef] [PubMed]
- Alberto, W.D.; Pilar, D.D.; Valeria, A.M.; Fabiana, P.S.; Cecilia, H.A.; De, B.M. Pattern recognition techniques for the evaluation of spatial and temporal variations in water quality. A case study: Suquía River Basin (Córdoba-Argentina). Water Res. 2001, 35, 2881–2894. [Google Scholar] [CrossRef]
- Adimalla, N.; Li, P.; Venkatayogi, S. Hydrogeochemical evaluation of groundwater quality for drinking and irrigation purposes and integrated interpretation with water quality index studies. Environ. Process. 2018, 5, 363–383. [Google Scholar] [CrossRef]
- Alver, A. Evaluation of conventional drinking water treatment plant efficiency according to water quality index and health risk assessment. Environ. Sci. Pollut. Res. 2019, 26, 27225–27238. [Google Scholar] [CrossRef] [PubMed]
- Suratman, S.; Sailan, M.I.M.; Hee, Y.Y.; Bedurus, E.A.; Latif, M.T. A preliminary study of water quality index in Terengganu River Basin, Malaysia. Sains Malays. 2015, 44, 67–73. [Google Scholar]
- Sun, W.; Xia, C.; Xu, M.; Guo, J.; Sun, G. Application of modified water quality indices as indicators to assess the spatial and temporal trends of water quality in the Dongjiang River. Ecol. Indic. 2016, 66, 306–312. [Google Scholar] [CrossRef]
- Ren, J.; Liang, J.; Ren, B.; Zheng, X.; Guo, C. New patterns of temporal and spatial variation in water quality of a highly artificialized urban river-course—A case study in the Tongzhou section of the Beiyun River. Water 2018, 10, 1446. [Google Scholar] [CrossRef]
- Xu, Z.; Xu, J.; Yin, H.; Jin, W.; Li, H.; He, Z. Urban river pollution control in developing countries. Nat. Sustain. 2019, 2, 158–160. [Google Scholar] [CrossRef]
- Yang, S.; Liang, M.; Qin, Z.; Qian, Y.; Li, M.; Cao, Y. A novel assessment considering spatial and temporal variations of water quality to identify pollution sources in urban rivers. Sci. Rep. 2021, 11, 8714. [Google Scholar] [CrossRef]
- MOE. Sewerage Statistics; Ministry of Environment: Sejong, Korea, 2019. [Google Scholar]
- Choi, B.D. The function or urban river and sustainable reginal development: The case of Kumho River. J. Korean Assoc. Reg. Geogr. 2004, 10, 757–774. [Google Scholar]
- Yang, D.S.; Bae, H.K. The effect of branches on Kumho River’s water quality. J. Environ. Sci. Int. 2012, 21, 1245–1253. [Google Scholar] [CrossRef]
- Nkomozepi, T.; Chung, S.O. The effects of climate change on the water resources of the Geumho River basin, Republic of Korea. J. Hydro-Environ. Res. 2014, 8, 358–366. [Google Scholar] [CrossRef]
- Jung, K.Y.; Lee, I.J.; Lee, K.-L.; Cheon, S.-U.; Hong, J.Y.; Ahn, J.-M. Long-term trend analysis and exploratory data analysis of Geumho River based on seasonal Mann-Kendall test. J. Environ. Sci. Int. 2016, 25, 217–229. [Google Scholar] [CrossRef]
- MOE. Yesterday, Today, and Future of the Geumho River; Ministry of Environment: Sejong, Korea, 2000. [Google Scholar]
- MOE. Geumho River Alive; Ministry of Environment: Sejong, Korea, 2005. [Google Scholar]
- Park, K.O.; Lee, C.H.; Cha, I.G. Water pollution source tracing using FDC and correlation analysis in Geumho River basin. J. Wetl. Res. 2016, 18, 232–243. [Google Scholar] [CrossRef]
- Shin, S.H.; Im, T.H.; Kim, S.H.; Shin, D.S.; Kwon, H.G. Consideration in applying Korean-comprehensive water quality index (K-CWQI) to assessement of water quality in the major tributaries of Gumho-River Basin. J. Korean Soc. Hazard Mitig. 2018, 18, 455–465. [Google Scholar] [CrossRef]
- MOE. Official Test Method for Water Pollution; Ministry of Environment: Sejong, Korea, 2008. [Google Scholar]
- Sârbu, C.; Pop, H.F. Principal component analysis versus fuzzy principal component analysis A case study: The quality of Danube water (1985–1996). Talanta 2005, 65, 1215–1220. [Google Scholar] [CrossRef]
- Dominick, D.; Juahir, H.; Latif, M.T.; Zain, S.M.; Aris, A.Z. Spatial assessment of air quality patterns in Malaysia using multivariate analysis. Atmos. Environ. 2012, 60, 172–181. [Google Scholar] [CrossRef]
- Liu, L.; Dong, Y.; Kong, M.; Zhou, J.; Zhao, H.; Tang, Z.; Zhang, M.; Wang, Z. Insights into the long-term pollution trends and sources contributions in Lake Taihu, China using multi-statistic analyses models. Chemosphere 2020, 242, 125272. [Google Scholar] [CrossRef]
- Liu, C.W.; Lin, K.H.; Kuo, Y.M. Application of factor analysis in the assessment of ground water quality in a Blackfoot disease area in Taiwan. Sci. Total Environ. 2003, 313, 77–89. [Google Scholar] [CrossRef]
- Zhang, Q.; Li, Z.; Zeng, G.; Li, J.; Fang, Y.; Yuan, Q.; Wang, Y.; Ye, F. Assessment of surface water quality using multivariate statistical techniques in red soil hilly region: A case study of Xiangjiang watershed, China. Environ. Monit. Assess. 2009, 152, 123–131. [Google Scholar] [CrossRef]
- Azhar, S.C.; Aris, A.Z.; Yusoff, M.K.; Ramli, M.F.; Juahir, H. Classification of river water quality using multivariate analysis. Procedia Environ. Sci. 2015, 30, 79–84. [Google Scholar] [CrossRef]
- Rogerson, P.A. Statistical Methods for Geography: A Student’s Guide; Sage Publications: London, UK, 2019. [Google Scholar]
- NIER. Real Time Water Quality Data System Construction and Database Enhancement; National Institute of Environmental Research: Incheon, Korea, 2013. [Google Scholar]
- Choi, Y.Y.; Baek, S.-R.; Kim, J.-I.; Choi, J.-W.; Hur, J.; Lee, T.-U.; Park, C.-J.; Lee, B.J. Characteristics and biodegradability of wastewater organic matter in municipal wastewater treatment plants collecting domestic wastewater and industrial discharge. Water 2017, 9, 409. [Google Scholar] [CrossRef]
- MOE. Basic Policy for Total Maximum Daily Loads in Nakdong River; Ministry of Environment: Sejong, Korea, 2009. [Google Scholar]
- MOE. Framework Act on Environmental Policy; Ministry of Environment: Sejong, Korea, 2019. [Google Scholar]
- Han, S.H.; Kim, Y.-Y.; Sung, Y.-G.; Park, I.-B.; Cho, D.-H.; Nam, W.-K.; Kim, C.-G.; Oh, J.-K. Characteristics of organics and ammonia nitrogen discharged by pollution source from human living. J. Korean Soc. Water Environ. 2015, 31, 377–386. [Google Scholar] [CrossRef][Green Version]
- Sawyer, C.N.; McCarty, P.L.; Parkin, G.F. Chemistry for Environmental Engineering and Science; McGraw-Hill: New York, NY, USA, 2003. [Google Scholar]
- Mbuligwe, S.E.; Kaseva, M.E. Pollution and self-cleansing of an urban river in a developing country: A case study in Dar es Salaam, Tanzania. Environ. Manag. 2005, 36, 328–342. [Google Scholar] [CrossRef]
- Li, X.; Lu, M.Y.; Huang, Y.; Yuan, Y.; Yuan, Y. Influence of seasonal temperature change on autotrophic nitrogen removal for mature landfill leachate treatment with high-ammonia by partial nitrification-anammox process. J. Environ. Sci. 2021, 102, 291–300. [Google Scholar] [CrossRef]
- Vajravelu, M.; Martin, Y.; Ayyappan, S.; Mayakrishnan, M. Seasonal influence of physico-chemical parameters on phytoplankton diversity, community structure and abundance at Parangipettai coastal waters, Bay of Bengal, South East Coast of India. Oceanologia 2018, 60, 114–127. [Google Scholar] [CrossRef]


| Variable | Abbreviation | Unit | Analysis Method |
|---|---|---|---|
| Biochemical oxygen demand | BOD | mg/L | Winkler-azide method (5-day) |
| Chemical oxygen demand | COD | mg/L | Potassium permanganate (KMnO4) |
| Total organic carbon | TOC | mg/L | High-temperature combustion method |
| Total nitrogen | TN | mg/L | Continuous flow analysis (UV/visible spectrometry) |
| Ammonia-nitrogen | NH3-N | mg/L | Continuous flow analysis (UV/visible spectrometry) |
| Nitrate-nitrogen | NO3-N | mg/L | Continuous flow analysis (ion chromatography) |
| Total phosphorus | TP | mg/L | Continuous flow analysis (UV/visible spectrometry) |
| Phosphate-phosphorus | PO4-P | mg/L | Continuous flow analysis (ion chromatography) |
| Chlorophyll-a | Chl-a | mg/m3 | UV/visible spectrometry |
| Total suspended solids | SS | mg/L | Filtration methods (GF-C) |
| Fecal coliform | FC | CFU/100 mL | Membrane filter |
| Variable | Component | |||
|---|---|---|---|---|
| VF1 | VF2 | VF3 | VF4 | |
| WT | 0.242 | 0.729 | −0.377 | 0.316 |
| pH | 0.062 | −0.019 | −0.018 | 0.787 |
| DO | 0.009 | −0.784 | 0.188 | −0.288 |
| BOD | 0.606 | 0.068 | 0.324 | 0.474 |
| COD | 0.928 | 0.035 | −0.071 | −0.005 |
| TOC | 0.864 | 0.167 | 0.111 | −0.008 |
| TSS | 0.692 | 0.428 | −0.044 | −0.153 |
| EC | 0.429 | −0.104 | 0.708 | 0.174 |
| TN | −0.066 | 0.201 | 0.873 | 0.157 |
| NH3-N | 0.007 | 0.047 | 0.854 | −0.032 |
| NO3-N | 0.070 | −0.312 | 0.604 | −0.186 |
| TP | 0.265 | 0.835 | 0.221 | −0.01 |
| PO4-P | 0.111 | 0.656 | −0.084 | −0.484 |
| Chl-a | 0.721 | 0.144 | 0.156 | 0.489 |
| FC | 0.116 | 0.636 | 0.156 | −0.235 |
| Eigenvalue | 3.326 | 3.068 | 2.764 | 1.669 |
| Total variance (%) | 22.17 | 20.45 | 18.43 | 11.13 |
| Cumulative variance (%) | 22.17 | 42.62 | 61.05 | 72.18 |
| Parameter | S1 (n = 48) | S2 (n = 48) | S3 (n = 48) | S4 (n = 48) | S5 (n = 48) | S6 (n = 48) | |
|---|---|---|---|---|---|---|---|
| BOD (mg/L) | R | 0.3–5.9 | 0.5–5.8 | 1.1–5.0 | 0.9–6.2 | 1.0–5.7 | 1.0–5.7 |
| M ± SD | 1.0 ± 0.8 | 2.1 ± 1.3 | 2.4 ± 0.9 | 3.0 ± 1.5 | 3.1 ± 1.3 | 3.0 ± 1.3 | |
| COD (mg/L) | R | 3.0–7.8 | 3.8–10.3 | 4.3–8.6 | 4.3–9.2 | 4.0–9.8 | 5.8–11.2 |
| M ± SD | 5.6 ± 1.0 | 6.7 ± 1.4 | 5.7 ± 0.9 | 5.9 ± 1.2 | 5.9 ± 1.4 | 8.2 ± 1.5 | |
| TOC (mg/L) | R | 1.7–4.7 | 2.3–5.4 | 2.6–5.9 | 2.5–6.1 | 2.5–5.8 | 4.7–8.9 |
| M ± SD | 3.4 ± 0.6 | 3.8 ± 0.7 | 3.9 ± 0.7 | 4.1 ± 0.8 | 4 ± 0.8 | 6.3 ± 1.2 | |
| TSS (mg/L) | R | 0.6–13.4 | 0.4–23.6 | 1.4–32.8 | 1.8–24.2 | 1.4–26.7 | 2.6–55.0 |
| M ± SD | 3.3 ± 3.0 | 6.4 ± 5.0 | 4.4 ± 4.5 | 5.0 ± 3.6 | 8.6 ± 5.5 | 10.3 ± 8.3 | |
| Chl-a (mg/m3) | R | 0.2–18.4 | 1.9–45.9 | 2.8–37.1 | 2.3–78.6 | 2.8–96.7 | 6.7–135.8 |
| M ± SD | 4.4 ± 3.0 | 10.3 ± 8.2 | 11.5 ± 9.9 | 25.0 ± 20.6 | 27.6 ± 20.9 | 36.3 ± 26.2 | |
| TP (mg/L) | R | 0.01–0.08 | 0.01–0.18 | 0.02–0.19 | 0.02–0.16 | 0.02–0.18 | 0.03–0.13 |
| M ± SD | 0.02 ± 0.01 | 0.04 ± 0.03 | 0.07 ± 0.04 | 0.07 ± 0.04 | 0.08 ± 0.04 | 0.07 ± 0.03 | |
| PO4-P (mg/L) | R | 0.00–0.07 | 0.00–0.09 | 0.00–0.11 | 0.00–0.12 | 0.00–0.1 | 0.00–0.1 |
| M ± SD | 0.01 ± 0.01 | 0.02 ± 0.03 | 0.02 ± 0.03 | 0.01 ± 0.03 | 0.01 ± 0.03 | 0.02 ± 0.03 | |
| WT (°C) | R | 3.2–27.6 | 3.8–30.5 | 0.8–30.5 | 2.2–31.9 | 3.6–31.6 | 5.1–29.4 |
| M ± SD | 14.7 ± 6.8 | 17.0 ± 8.2 | 16.8 ± 8.8 | 17.5 ± 8.9 | 18.1 ± 8.6 | 17.4 ± 7.9 | |
| FC (CFU/100 mL) | R | 0–165 | 0–560 | 0–48,000 | 0–20,000 | 0–57,000 | 3–28,963 |
| M ± SD | 22 ± 40 | 65 ± 133 | 4137 ± 8789 | 2143 ± 4459 | 5559 ± 11,989 | 4224 ± 6497 |
| Grade | BOD (mg/L) | COD (mg/L) | TOC (mg/L) | TSS (mg/L) | TP (mg/L) | FC (CFU/100 mL) |
|---|---|---|---|---|---|---|
| Very good | 1.0 or less | 2.0 or less | 2.0 or less | 25 or less | 0.02 or less | 10 or less |
| Good | 1.0–2.0 | 2.0–4.0 | 2.0–3.0 | 25 or less | 0.02–0.04 | 10–100 |
| Slightly good | 2.0–3.0 | 4.0–5.0 | 3.0–4.0 | 25 or less | 0.04–0.1 | 100–200 |
| Moderate | 3.0–5.0 | 5.0–7.0 | 4.0–5.0 | 25 or less | 0.1–0.2 | 200–1000 |
| Slightly bad | 5.0–8.0 | 7.0–9.0 | 5.0–6.0 | 100 or more | 0.2–0.3 | - |
| Bad | 8.0–10.0 | 9.0–11.0 | 6.0–8.0 | - | 0.3–0.5 | - |
| Very bad | Over 10.0 | Over 11.0 | Over 8.0 | - | Over 0.5 | - |
| Variable | Standard Mode | Stepwise Mode | ||||||
|---|---|---|---|---|---|---|---|---|
| Spring | Summer | Autumn | Winter | Spring | Summer | Autumn | Winter | |
| WT | 1.403 | 1.835 | 1.245 | 0.832 | 0.839 | 1.153 | 0.618 | 0.24 |
| pH | 30.538 | 29.493 | 30.018 | 30.593 | ||||
| DO | 4.33 | 4.58 | 4.534 | 4.707 | ||||
| BOD | −0.539 | −1.394 | −1.974 | −2.142 | 0.918 | −0.156 | −0.334 | −0.257 |
| COD | 4.336 | 4.012 | 3.849 | 4.315 | ||||
| TOC | 3.706 | 3.533 | 2.887 | 3.138 | 2.63 | 2.639 | 1.93 | 2.402 |
| TSS | −0.28 | −0.306 | −0.199 | −0.309 | ||||
| EC | −0.023 | −0.024 | −0.015 | −0.018 | −0.004 | −0.005 | 0.004 | 0.001 |
| TN | 0.977 | 0.838 | 0.956 | 0.978 | ||||
| NH3-N | 2.342 | 2.842 | 2.574 | 2.226 | 5.91 | 6.678 | 3.798 | 12.755 |
| NO3-N | 11.22 | 11.992 | 9.251 | 18.392 | ||||
| TP | 10.849 | 30.924 | 7.444 | 37.27 | −26.276 | 17.998 | −15.883 | −8.094 |
| PO4-P | 23.452 | 62.642 | 41.274 | 38.946 | ||||
| Chl-a | −0.467 | −0.436 | −0.425 | −0.415 | ||||
| FC | 0.000 | 0.000 | 0.000 | 0.000 | ||||
| (Constant) | −183.986 | −185.44 | −174.56 | −181.562 | −15.585 | −22.645 | −9.746 | −9.174 |
| Monitoring Clusters | Correct (%) | Regions Assigned by DA | |||||
|---|---|---|---|---|---|---|---|
| Spring | Summer | Autumn | Winter | Total | |||
| Standard mode | Spring | 76.0 | 73 | 6 | 12 | 5 | 96 |
| Summer | 87.6 | 7 | 63 | 2 | 0 | 72 | |
| Autumn | 72.2 | 9 | 4 | 52 | 7 | 72 | |
| Winter | 89.6 | 1 | 0 | 4 | 43 | 48 | |
| Total | 80.2 | ||||||
| Stepwise mode | Spring | 74.0 | 71 | 9 | 13 | 3 | 96 |
| Summer | 81.9 | 12 | 59 | 1 | 0 | 72 | |
| Autumn | 75.0 | 9 | 4 | 54 | 5 | 72 | |
| Winter | 89.6 | 0 | 0 | 5 | 43 | 48 | |
| Total | 78.8 | ||||||
| Variable | Standard Mode | Stepwise Mode | ||||
|---|---|---|---|---|---|---|
| US | MS | DS | US | MS | DS | |
| WT | 1.174 | 0.868 | 0.908 | |||
| pH | 31.435 | 34.117 | 29.45 | 30.331 | 32.07 | 28.173 |
| DO | 4.516 | 3.268 | 3.639 | |||
| BOD | −2.012 | −1.379 | −2.893 | −4.808 | −4.121 | −5.55 |
| COD | 3.587 | 1.51 | 1.918 | 2.926 | 0.933 | 1.163 |
| TOC | 1.177 | 2.96 | 7.835 | 0.065 | 1.552 | 6.727 |
| TSS | −0.168 | −0.16 | −0.231 | |||
| EC | −0.021 | −0.011 | 0.016 | −0.004 | 0.009 | 0.032 |
| TN | 1.042 | 1.394 | 1.097 | 2.234 | 2.802 | 2.575 |
| NH3-N | 2.467 | 3.275 | 3.911 | |||
| NO3-N | 11.52 | 14.103 | 8.392 | |||
| TP | 38.524 | 103.418 | 17.876 | 69.724 | 131.491 | 98.784 |
| PO4-P | 25.941 | 17.324 | 92.628 | |||
| Chl-a | −0.438 | −0.396 | −0.305 | |||
| FC | 0.000 | 0.000 | 0.000 | |||
| (Constant) | −176.379 | −186.667 | −189.161 | −132.62 | −151.867 | −153.374 |
| Period | Monitoring Clusters | Correct (%) | Regions Assigned by DA | |||
|---|---|---|---|---|---|---|
| US | MS | DS | Total | |||
| Standard mode | US | 96.9 | 93 | 3 | 0 | 96 |
| MS | 97.9 | 3 | 141 | 0 | 144 | |
| DS | 100 | 0 | 0 | 48 | 48 | |
| Total | 97.9 | |||||
| Stepwise mode | US | 89.6 | 86 | 10 | 0 | 96 |
| MS | 91.7 | 8 | 132 | 4 | 144 | |
| DS | 97.9 | 0 | 1 | 47 | 48 | |
| Total | 92.0 | |||||
| Year | Seasonal | Spatial | |||||
|---|---|---|---|---|---|---|---|
| Spring | Summer | Autumn | Winter | US | MS | DS | |
| 2017 | 55.2 | 60.8 | 60.4 | 75.1 | 64.4 | 58.9 | 60.3 |
| 2018 | 59.9 | 64.2 | 66.3 | 67.7 | 68.3 | 53.5 | 61.6 |
| 2019 | 60.1 | 58.4 | 60.4 | 70.3 | 68.5 | 53.3 | 61.4 |
| 2020 | 61.6 | 70.1 | 65.6 | 70.6 | 69.0 | 59.8 | 66.6 |
| Mean | 59.2 | 63.4 | 63.1 | 70.9 | 67.5 | 56.4 | 62.5 |
Publisher’s Note: MDPI stays neutral with regard to jurisdictional claims in published maps and institutional affiliations. |
© 2022 by the authors. Licensee MDPI, Basel, Switzerland. This article is an open access article distributed under the terms and conditions of the Creative Commons Attribution (CC BY) license (https://creativecommons.org/licenses/by/4.0/).
Share and Cite
Jo, C.; Kwon, H.; Kim, S. Temporal and Spatial Water Quality Assessment of the Geumho River, Korea, Using Multivariate Statistics and Water Quality Indices. Water 2022, 14, 1761. https://doi.org/10.3390/w14111761
Jo C, Kwon H, Kim S. Temporal and Spatial Water Quality Assessment of the Geumho River, Korea, Using Multivariate Statistics and Water Quality Indices. Water. 2022; 14(11):1761. https://doi.org/10.3390/w14111761
Chicago/Turabian StyleJo, Changdae, Heongak Kwon, and Seongmin Kim. 2022. "Temporal and Spatial Water Quality Assessment of the Geumho River, Korea, Using Multivariate Statistics and Water Quality Indices" Water 14, no. 11: 1761. https://doi.org/10.3390/w14111761
APA StyleJo, C., Kwon, H., & Kim, S. (2022). Temporal and Spatial Water Quality Assessment of the Geumho River, Korea, Using Multivariate Statistics and Water Quality Indices. Water, 14(11), 1761. https://doi.org/10.3390/w14111761