
A Prediction Model of Labyrinth Emitter Service Duration (ESD) under Low-Quality (Sand-Laden Water) Irrigation

Abstract
:1. Introduction
2. Materials and Method
2.1. Materials and Devices
2.2. Experimental Design
2.3. Evaluation Index and Determination Method
- (1)
- Flow and relative average flow
- (2)
- Christiansen uniformitywhere, is the average deviation of flow, L/h; is the average flow rate, L/h; qi is the flow rate, L/h. In actual field irrigation, the irrigation uniformity coefficient Cu should not be less than 0.8.
- (3)
- Gradating and particle size composition of clogging substance
2.4. Index of ESD
2.5. Data Analysis
3. Results
3.1. Evaluation Based on EDS
3.2. Direct Estimation of ESD
3.3. Influencing Factors of ESD
3.3.1. Structural Characteristics of Emitters
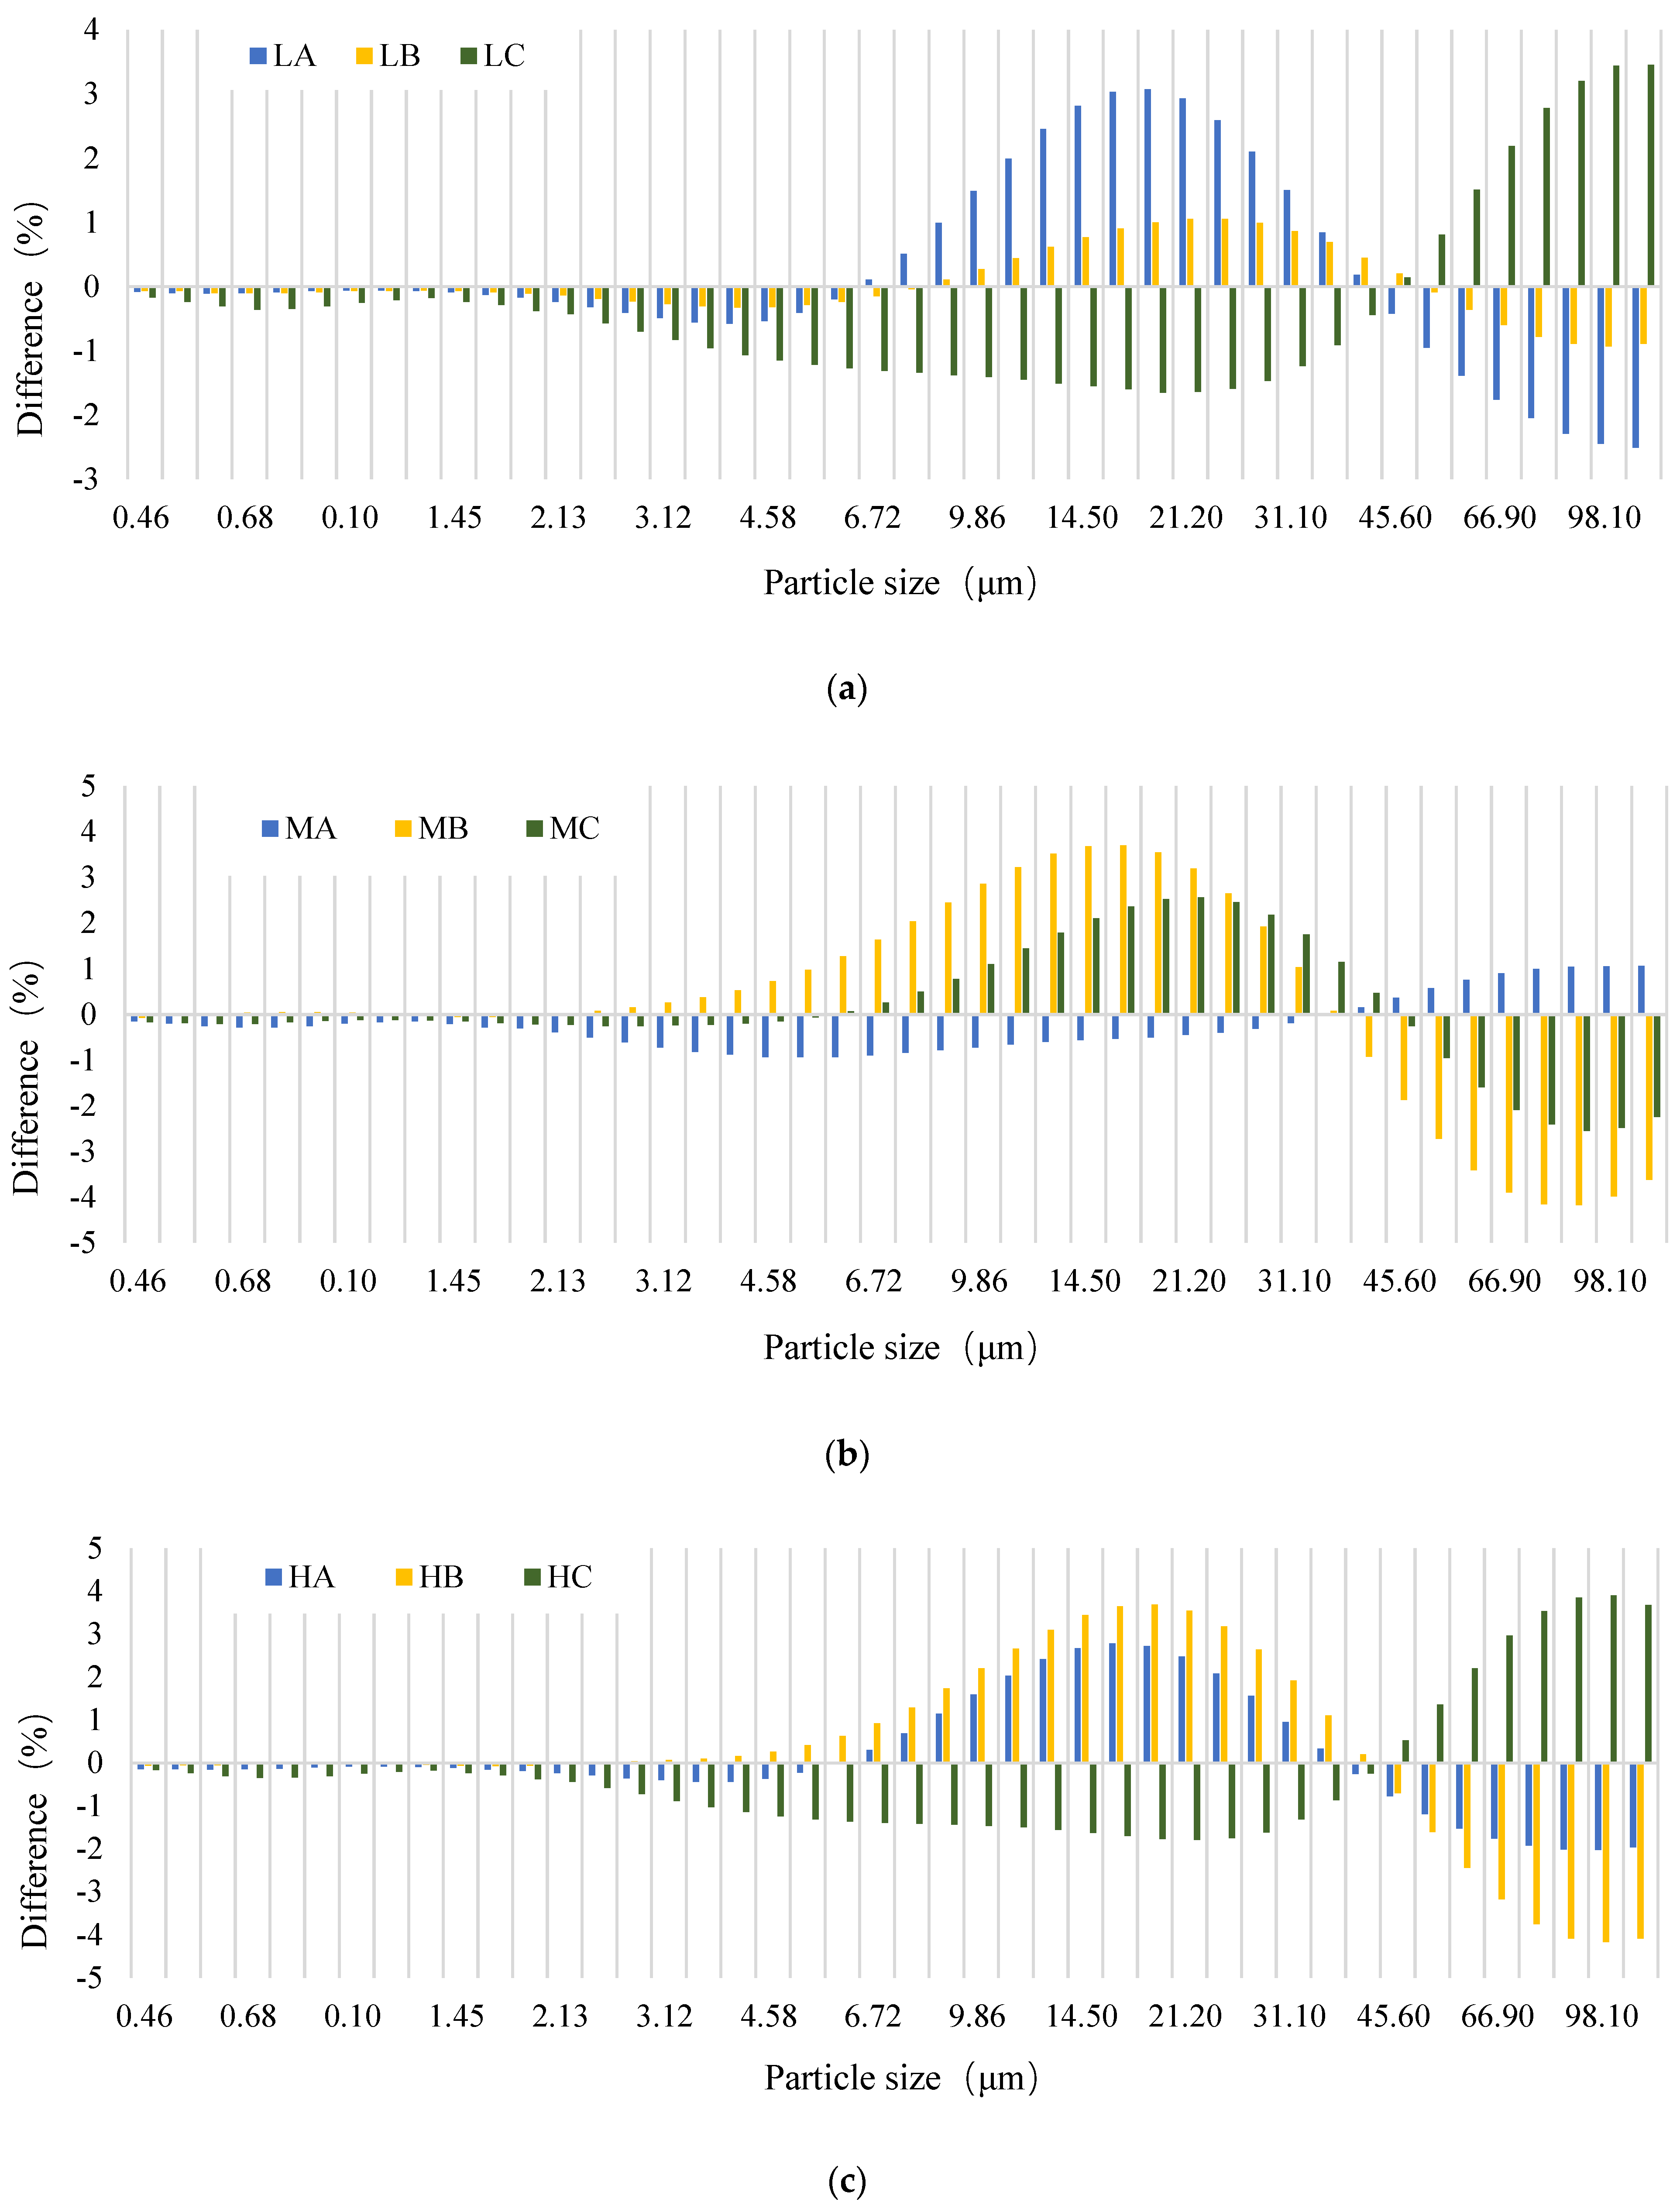
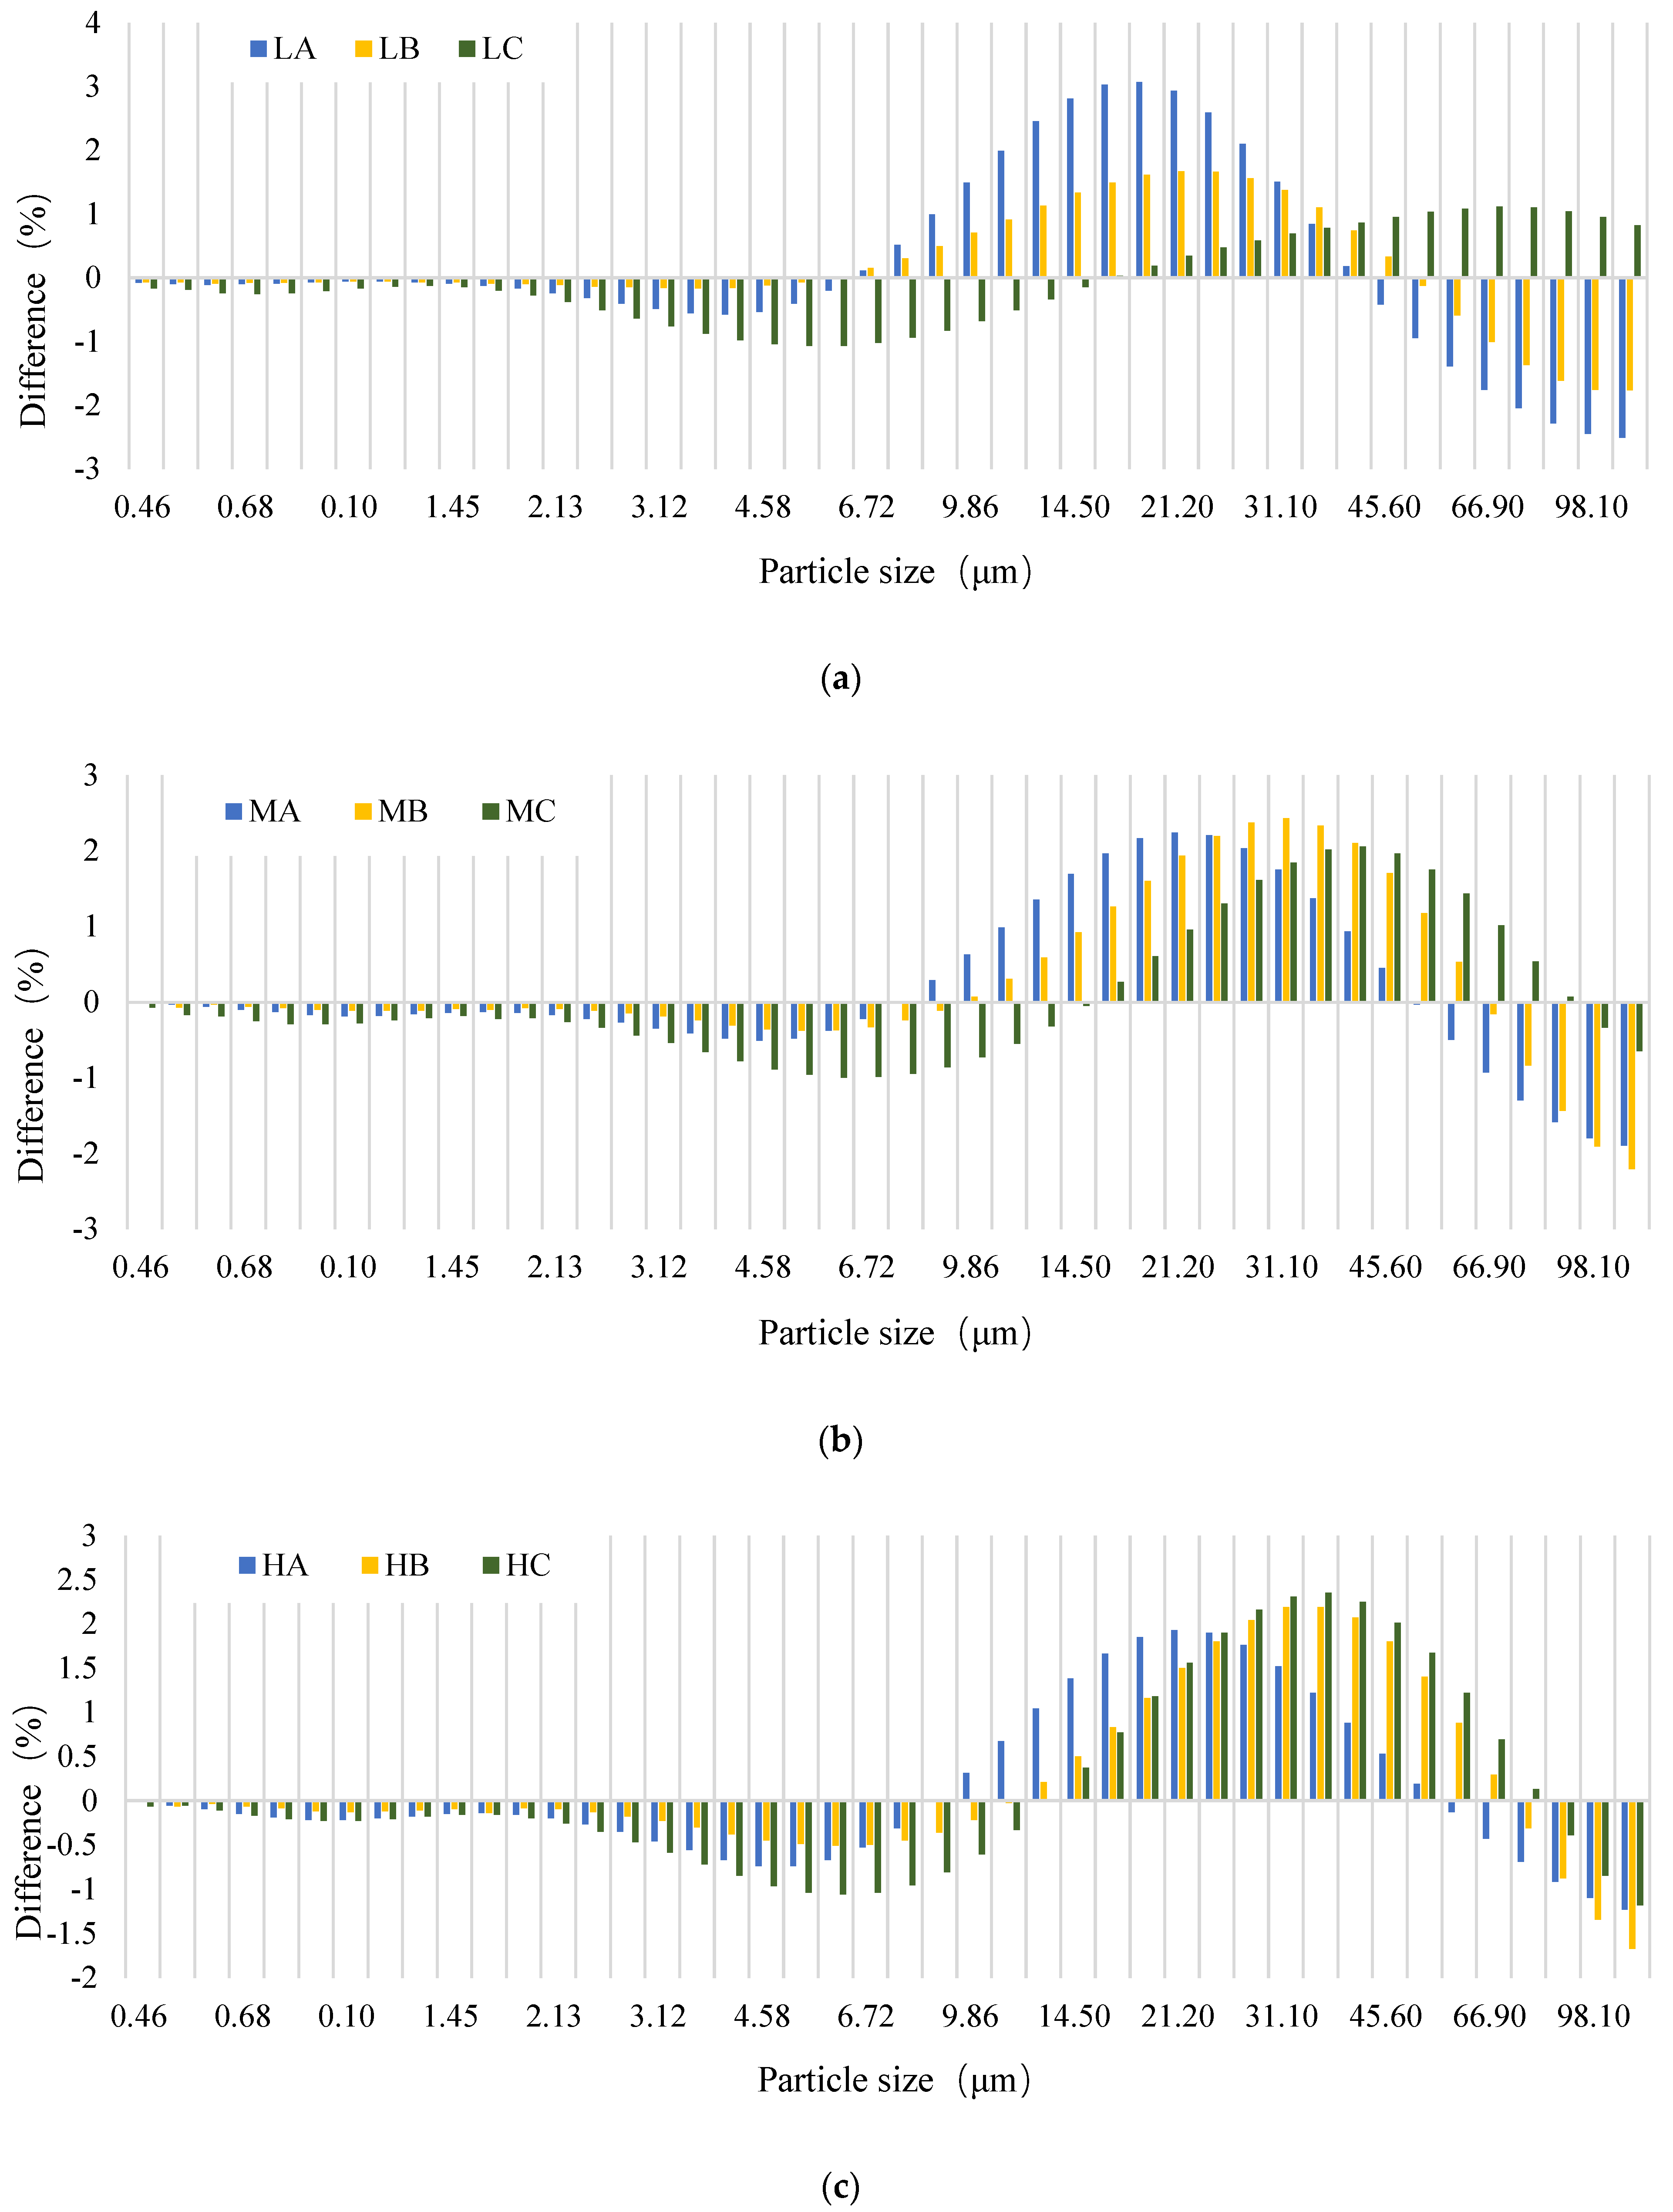
3.3.2. Sediment Concentration and Gradation
4. Discussion
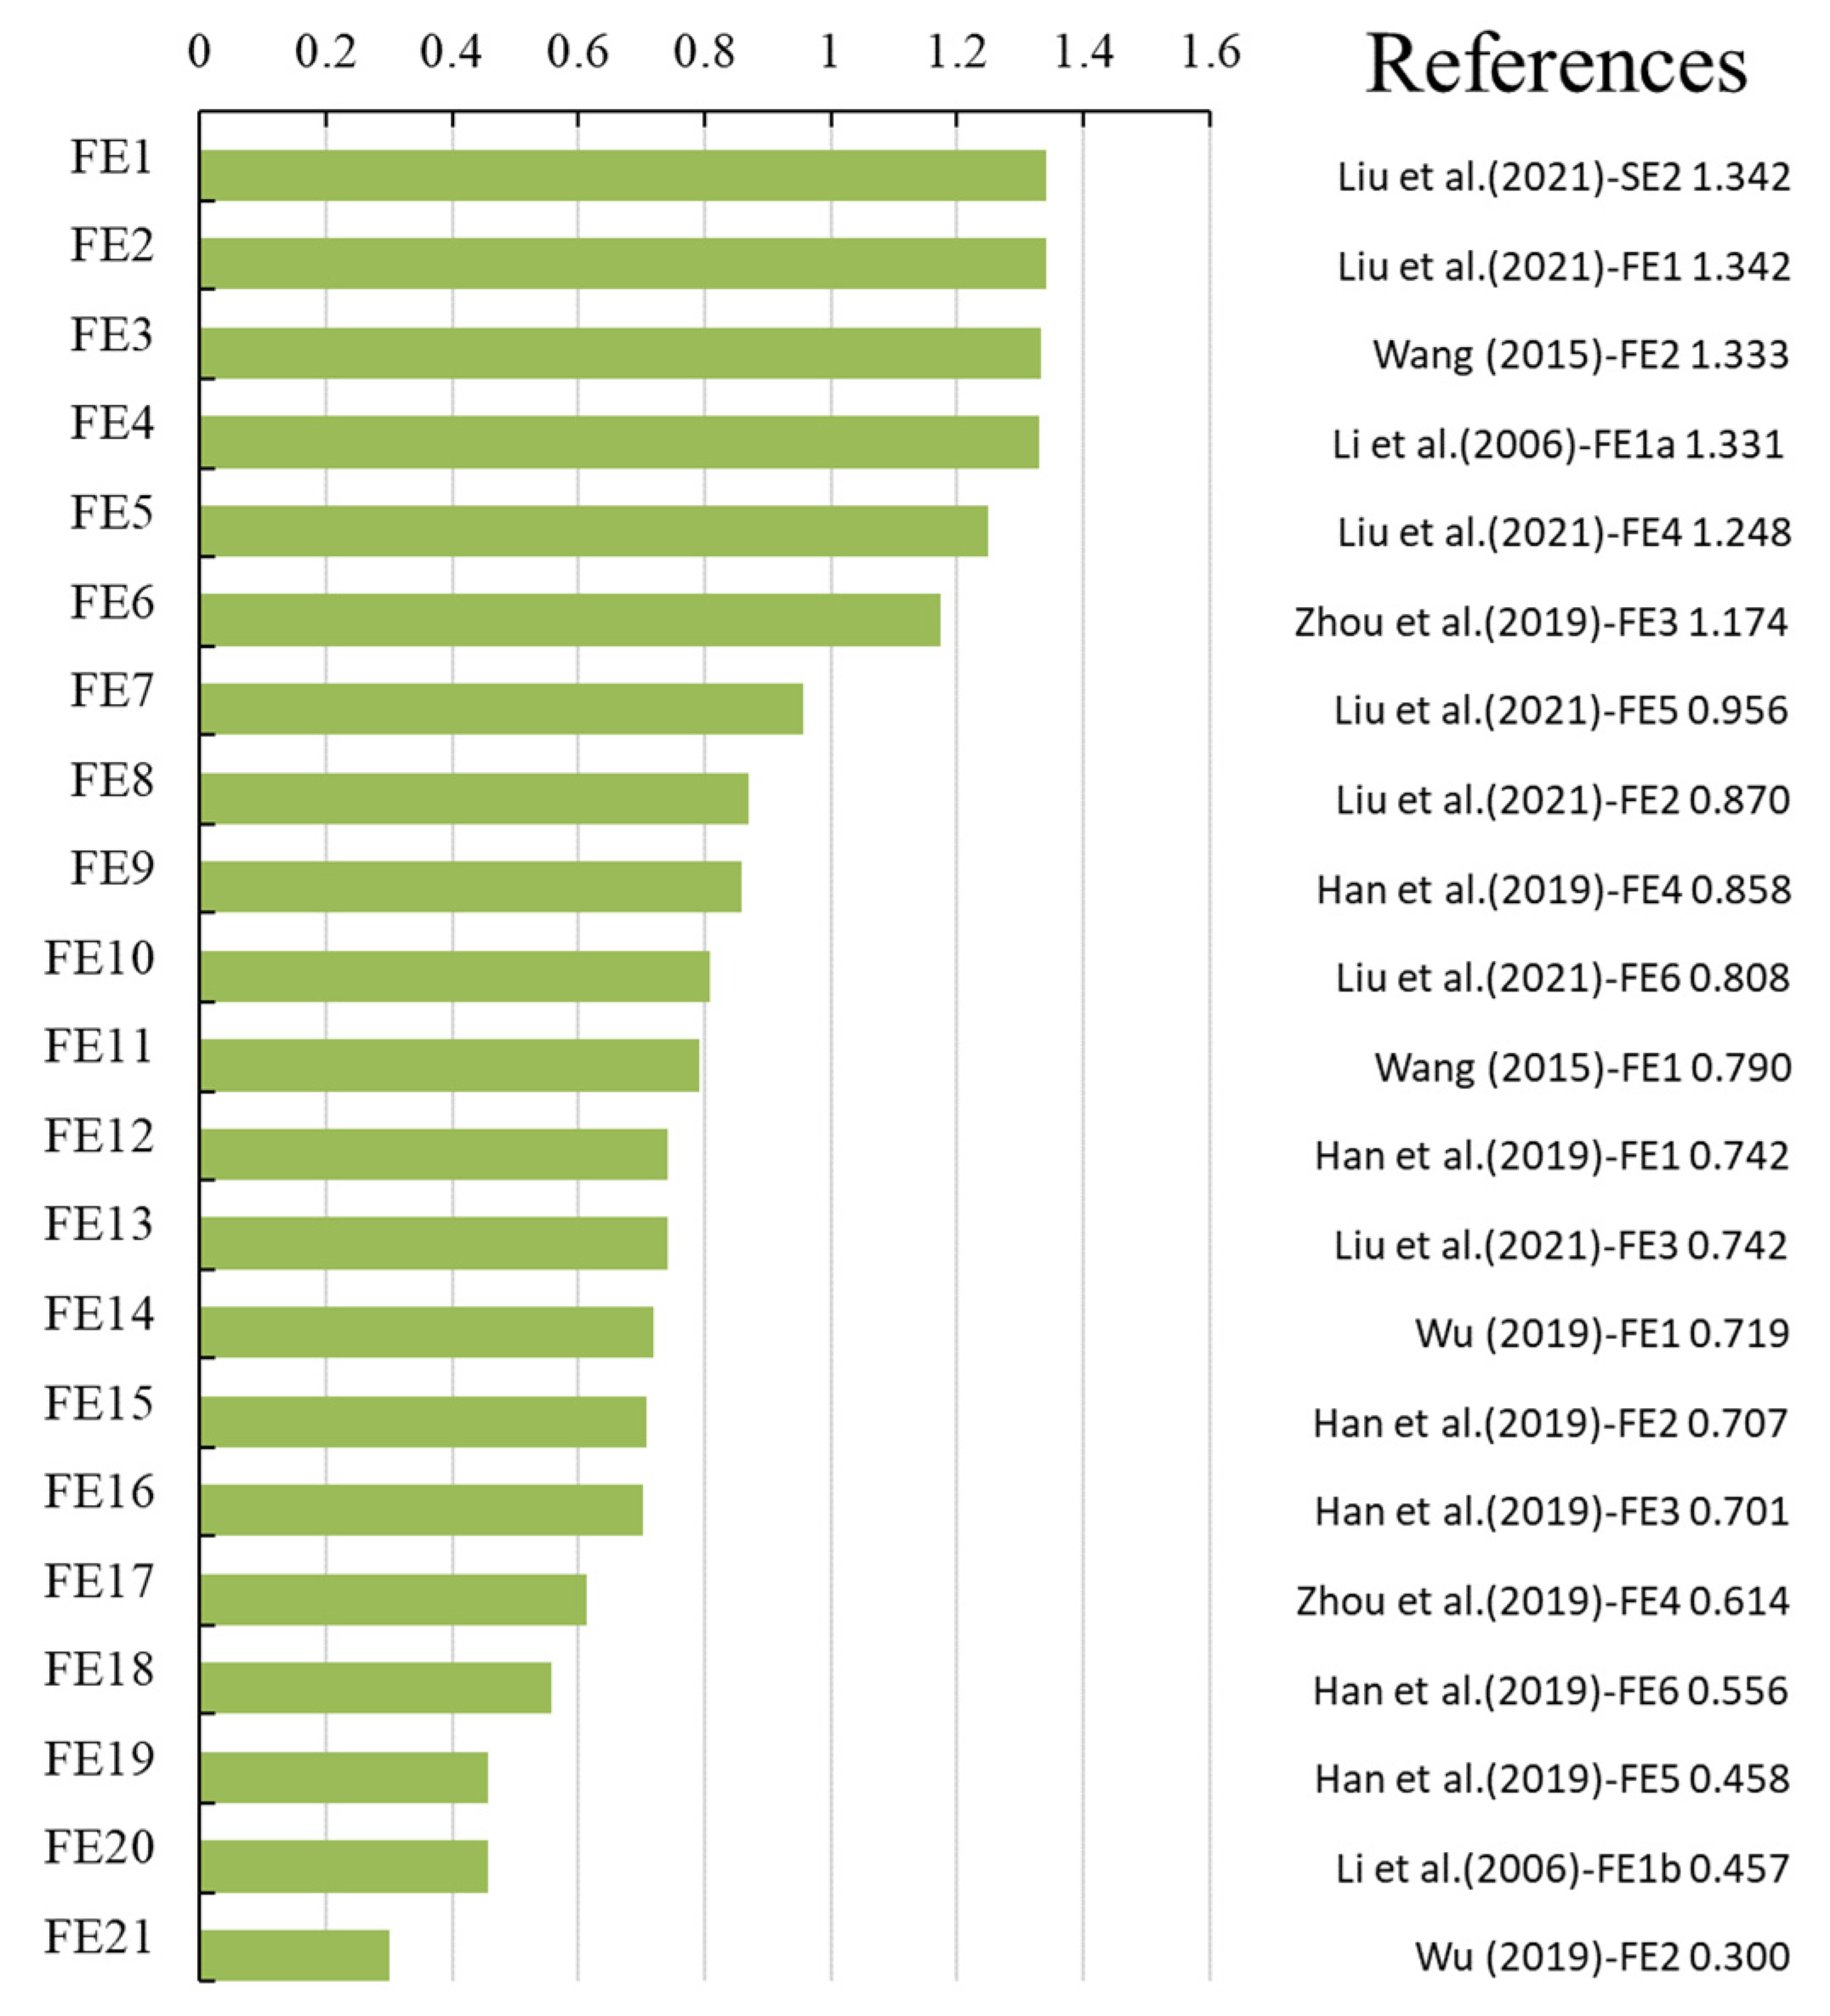
4.1. ESD Estimation Based on Characteristic Parameters and Irrigation Water Source
4.2. Feasibility and Accuracy of the ESD Model
5. Conclusions
Author Contributions
Funding
Institutional Review Board Statement
Informed Consent Statement
Data Availability Statement
Conflicts of Interest
References
- Çetin, O.; Kara, A. Assesment of water productivity using different drip irrigation systems for cotton. Agric. Water Manag. 2019, 223, 105693. [Google Scholar] [CrossRef]
- Çolak, Y.B.; Yazar, A.; Gönen, E.; Eroğlu, E.Ç. Yield and quality response of surface and subsurface drip-irrigated eggplant and comparison of net returns. Agric. Water Manag. 2018, 206, 165–175. [Google Scholar] [CrossRef]
- Li, J.; Li, Y.; Zhang, H. Tomato Yield and Quality and Emitter Clogging as Affected by Chlorination Schemes of Drip Irrigation Systems Applying Sewage Effluent. J. Integr. Agric. 2012, 11, 1744–1754. [Google Scholar] [CrossRef]
- Wójcik, P. Response of ‘Red Delicious’ apple trees drip-fertigated with ammonium nitrate to application of silicic acid. Sci. Hortic. Amst. 2019, 249, 15–21. [Google Scholar] [CrossRef]
- Şahin, Ü.; Anapalı, Ö.; Dönmez, M.F.; Şahin, F. Biological treatment of clogged emitters in a drip irrigation system. J. Environ. Manag. 2005, 76, 338–341. [Google Scholar] [CrossRef]
- Capra, A.; Scicolone, B. Recycling of poor quality urban wastewater by drip irrigation systems. J. Clean. Prod. 2007, 15, 1529–1534. [Google Scholar] [CrossRef]
- Leverenz, H.L.; Tchobanoglous, G.; Darby, J.L. Clogging in intermittently dosed sand filters used for wastewater treatment. Water Res. 2009, 43, 695–705. [Google Scholar] [CrossRef]
- Liu, H.; Huang, G. Laboratory experiment on drip emitter clogging with fresh water and treated sewage effluent. Agric. Water Manag. 2009, 96, 745–756. [Google Scholar] [CrossRef]
- Chen, M.; Kang, Y.; Wan, S.; Liu, S. Drip irrigation with saline water for oleic sunflower (Helianthus annuus L.). Agric. Water Manag. 2009, 96, 1766–1772. [Google Scholar] [CrossRef]
- Yu, Y.; Shihong, G.; Xu, D.; Jiandong, W.; Ma, X. Effects of Treflan injection on winter wheat growth and root clogging of subsurface drippers. Agric. Water Manag. 2010, 97, 723–730. [Google Scholar] [CrossRef]
- Gilbert, R.G.; Nakayama, F.S.; Bucks, D.A.; French, O.F.; Adamson, K.C. Trickle irrigation: Emitter clogging and other flow problems. Agric. Water Manag. 1981, 3, 159–178. [Google Scholar] [CrossRef]
- Gilbert, R.G.; Ford, H.W. 3.1—Emitter Clogging; Nakayama, F.S., Bucks, D.A., Eds.; Elsevier: Amsterdam, The Netherlands, 1986; pp. 142–163. [Google Scholar]
- Nakayama, F.S.; Bucks, D.A. Water quality in drip/trickle irrigation: A review. Irrig. Sci. 1991, 12, 187–192. [Google Scholar] [CrossRef]
- Zhao, Q. Flood diversion irrigation has great effect on agricultural production and Yellow River governance in northwest soil and water loss area. Yellow River Constr. 1964, 03, 15–17. [Google Scholar]
- Du, H.; Ma, T.; Yu, J.; Wang, L.; Lu, J.; Zhao, L. Experimental study on the clogging of drip irrigation system for Yellow River diversion. Yellow River 2019, 41, 149–151. [Google Scholar]
- Muhammad, T.; Zhou, B.; Liu, Z.; Chen, X.; Li, Y. Effects of phosphorus-fertigation on emitter clogging in drip irrigation system with saline water. Agric. Water Manag. 2021, 243, 106392. [Google Scholar] [CrossRef]
- Xiao, Y.; Liu, Y.; Ma, C.; Muhammad, T.; Zhou, B.; Zhou, Y.; Song, P.; Li, Y. Using electromagnetic fields to inhibit biofouling and scaling in biogas slurry drip irrigation emitters. J. Hazard. Mater. 2021, 401, 123265. [Google Scholar] [CrossRef] [PubMed]
- Li, Y.; Yang, P.; Ren, S.; Xu, T. Hydraulic Characterizations of Tortuous Flow in Path Drip Irrigation Emitter Project supported by the National Natural Science Foundation of China (Grant No: 50379053) and the National High Technology Development Key Project (863) (Grant No: 2002AA6Z3091). J. Hydrodyn. Ser. B 2006, 18, 449–457. [Google Scholar] [CrossRef]
- Taylor, H.D.; Bastos, R.K.X.; Pearson, H.W.; Mara, D.D. Drip irrigation with waste stabilisation pond effluents: Solving the problem of emitter fouling. Water Sci. Technol. 1995, 31, 417–424. [Google Scholar] [CrossRef]
- Chamba, D.; Zubelzu, S.; Juana, L. Determining hydraulic characteristics in laterals and drip irrigation systems. Agric. Water Manag. 2019, 226, 105791. [Google Scholar] [CrossRef]
- Juana, L.; Rodríguez-Sinobas, L.; Sánchez, R.; Losada, A. Evaluation of drip irrigation: Selection of emitters and hydraulic characterization of trapezoidal units. Agric. Water Manag. 2007, 90, 13–26. [Google Scholar] [CrossRef]
- Jackson, R.C.; Kay, M.G. Use of pulse irrigation for reducing clogging problems in trickle emitters. J. Agric. Eng. Res. 1987, 37, 223–227. [Google Scholar] [CrossRef]
- Eroglu, S.; Sahin, F.; Sahin, U.; Anapalı, O. Bacterial application for treatment of clogged emitters in drip irrigation systems as an environmentally friendly method. New Biotechnol. 2009, 25, S271–S272. [Google Scholar] [CrossRef]
- Zhangzhong, L.; Yu, P.; Zhang, W.; Yu, L.; Gao, M.; Yu, F. Effects of Drip Irrigation Frequency on Emitter Clogging using Saline Water for Processing Tomato Production. Irrig. Drain. 2019, 68, 464–475. [Google Scholar] [CrossRef]
- Najafzadeh, M.; Noori, R.; Afroozi, D.; Ghiasi, B.; Hosseini-Moghari, S.; Mirchi, A.; Torabi-Haghighi, A.; Kløve, B. A comprehensive uncertainty analysis of model-estimated longitudinal and lateral dispersion coefficients in open channels. J. Hydrol. 2021, 603, 126850. [Google Scholar] [CrossRef]
- Najafzadeh, M.; Oliveto, G. Scour Propagation Rates around Offshore Pipelines Exposed to Currents by Applying Data-Driven Models. Water 2022, 14, 493. [Google Scholar] [CrossRef]
- Liu, Y.; Li, D.; Wu, P.; Zhang, L.; Zhu, D.; Chen, J. Clogging characteristic of different emitters in drip irrigation with hard water. Trans. Chin. Soc. Agric. Eng. 2018, 34, 96–102. [Google Scholar]
- Zhang, J.; Zhao, W.; Tang, Y.; Lu, B. Anti-clogging performance evaluation and parameterized design of emitters with labyrinth channels. Comput. Electron. Agric. 2010, 74, 59–65. [Google Scholar] [CrossRef]
- Zhou, B.; Li, Y.; Song, P.; Xu, Z.; Bralts, V. A kinetic model for biofilm growth inside non-PC emitters under reclaimed water drip irrigation. Agric. Water Manag. 2016, 168, 23–34. [Google Scholar] [CrossRef]
- Han, S.; Li, Y.; Zhou, B.; Liu, Z.; Feng, J.; Xiao, Y. An in-situ accelerated experimental testing method for drip irrigation emitter clogging with inferior water. Agric. Water Manag. 2019, 212, 136–154. [Google Scholar] [CrossRef]
- Zhou, H.; Li, Y.; Wang, Y.; Zhou, B.; Bhattarai, R. Composite fouling of drip emitters applying surface water with high sand concentration: Dynamic variation and formation mechanism. Agric. Water Manag. 2019, 215, 25–43. [Google Scholar] [CrossRef]
- Li, Z.; Chen, G.; Yang, X. Experimental Study of Physical Clogging Factor of Labyrinth Emitter Caused by Muddy Water. J. Xi’an Univ. Technol. 2006, 4, 395–398. [Google Scholar]
- Liu, L.; Hou, P.; Liu, Z.; Wu, N.; Li, W.; Wu, R.; Wang, H.; Ma, Y.; Li, Y. Selection of suitable drip-emitters for Yellow River water drip irrigation. Trans. Chin. Soc. Agric. Eng. 2021, 37, 99–107. [Google Scholar]
- Wang, X. Affecting Factors Aboutanti-Clogging Performance on Emitter Withlabyrinth Channel; Northwest A&F University: Xianyang, China, 2015; p. 73. [Google Scholar]
- Wu, W. Affecting Factors about Clogging of Irrigation Emitter and Fertilizer Efficiency under Fertigation in Shiyang River Basin; Northwest A&F University: Xianyang, China, 2019; p. 67. [Google Scholar]


| Types | Rated Pressure (kpa) | Rated Discharge (L/h) | Length Width Depth (mm) | Internal Flow Channel Structure |
|---|---|---|---|---|
| E1 | 100 | 3 | 224 × 0.63 × 1 | 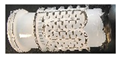 |
| E2 | 100 | 1.5 | 100 × 0.68 × 0.33 |  |
| E3 | 100 | 3.5 | 170 × 1.2 × 0.5 |  |
| Types | Emitter Manufacture Deviation (%) | Pressure–Flow Relation Equation (L/h-kpa) | Correlation Index (R2) | Flow Index/x | Flow Coefficients/k |
|---|---|---|---|---|---|
| E1 | 4.07 | y = 0.2909x0.5245 | 0.9872 | 0.5245 | 0.2909 |
| E2 | 4.63 | y = 0.1687x0.4842 | 0.9826 | 0.4842 | 0.1687 |
| E3 | 3.21 | y = 0.2433x0.5995 | 0.9922 | 0.5995 | 0.2433 |
| Parameters | Values | Parameters | Values | Parameters | Values | Parameters | Values | Parameters | Values |
|---|---|---|---|---|---|---|---|---|---|
| pH | 7.89 | NH4+ (mg/L) | 0.218 | CO32− (mg/L) | 60.817 | K+ (mg/L) | 1.09 | Cl− (mg/L) | 11 |
| Conductivity (uS/cm) | 243 | Mg2+ (mg/L) | 2.89 | PO43− (mg/L) | 0.02 | Na+ (mg/L) | 5.70 | Ca2+ (mg/L) | 28.80 |
| Factors and Levels | Sediment Grain Size (mm) | Sediment Concentration (g/L) | Grading (%) | |||
|---|---|---|---|---|---|---|
| Numbers | Levels | Codes | Levels | Codes | Levels | Codes |
| 1 | 0–0.054 mm | a | 1.8 | L | 35b-65a | A |
| 2 | 0.054–0.075 mm | b | 2.8 | M | 35c-65a | B |
| 3 | 0.075–0.1 mm | c | 3.8 | H | 35c-65b | C |
| Irrigation Life | Based on Average Relative Flow | Based on Irrigation Uniformity | ||||||
|---|---|---|---|---|---|---|---|---|
| Parameters | Pearson Coefficient | p | T | Significance | Pearson Coefficient | p | T | Significance |
| Rated flow (Q) | 0.154 | 0.444 | −3.044 | No correlation | 0.231 | 0.247 | 5.551 | No correlation |
| Flow channel length (L) | 0.496 | 0.009 | 16.662 | Significant correlation | 0.474 | 0.012 | 4.026 | Significant correlation |
| Average section velocity (v) | −0.198 | 0.322 | 5.825 | No correlation | −0.503 | 0.007 | 5.512 | Extremely significant correlation |
| Min (W, D) | 0.495 | 0.009 | −5.737 | Significant correlation | 0.474 | 0.013 | 5.573 | Significant correlation |
| Min (W, D)/L | −0.419 | 0.030 | −6.243 | Correlation | −0.425 | 0.027 | 5.577 | Significant correlation |
| W/D | −0.604 | 0.001 | −3.750 | Extremely significant correlation | −0.487 | 0.010 | 5.555 | Significant correlation |
| Cross section area A = W × D | 0.332 | 0.090 | −5.739 | No correlation | 0.365 | 0.010 | 5.573 | Significant correlation |
| A1/2/L | −0.601 | 0.001 | 6.241 | Extremely significant correlation | −0.519 | 0.006 | 5.577 | Extremely significant correlation |
| Treatments | ESD and Characteristic Parameter Equation |
|---|---|
| LA | LA = 4.236 × (A1/2/L)3/2 − 12.505 × W/D (R2 = 0.77) |
| LB | LA = 6.057 × (A1/2/L)3/2 − 23.775 × W/D (R2 = 0.94) |
| LC | LA = 2.035 × (A1/2/L)3/2 − 7.230 × W/D (R2 = 0.94) |
| MA | LA = 0.051 × (A1/2/L)3/2 + 2.96 × W/D (R2 = 0.99) |
| MB | LA = 1.025 × (A1/2/L)3/2 − 1.864 × W/D (R2 = 0.99) |
| MC | LA = 1.812 × (A1/2/L)3/2 − 5.104 × W/D (R2 = 0.97) |
| HA | LA = 0.046 × (A1/2/L)3/2 + 1.520 × W/D (R2 = 0.72) |
| HB | LA = 0.407 × (A1/2/L)3/2 − 0.943 × W/D (R2 = 0.99) |
| HC | LA = 0.866 × (A1/2/L)3/2 − 3.294 × W/D (R2 = 0.96) |
Publisher’s Note: MDPI stays neutral with regard to jurisdictional claims in published maps and institutional affiliations. |
© 2022 by the authors. Licensee MDPI, Basel, Switzerland. This article is an open access article distributed under the terms and conditions of the Creative Commons Attribution (CC BY) license (https://creativecommons.org/licenses/by/4.0/).
Share and Cite
Wang, H.; Ling, G.; Wang, W.; Hu, X.; Gao, X. A Prediction Model of Labyrinth Emitter Service Duration (ESD) under Low-Quality (Sand-Laden Water) Irrigation. Water 2022, 14, 1690. https://doi.org/10.3390/w14111690
Wang H, Ling G, Wang W, Hu X, Gao X. A Prediction Model of Labyrinth Emitter Service Duration (ESD) under Low-Quality (Sand-Laden Water) Irrigation. Water. 2022; 14(11):1690. https://doi.org/10.3390/w14111690
Chicago/Turabian StyleWang, Hui, Gang Ling, Wene Wang, Xiaotao Hu, and Xijian Gao. 2022. "A Prediction Model of Labyrinth Emitter Service Duration (ESD) under Low-Quality (Sand-Laden Water) Irrigation" Water 14, no. 11: 1690. https://doi.org/10.3390/w14111690
APA StyleWang, H., Ling, G., Wang, W., Hu, X., & Gao, X. (2022). A Prediction Model of Labyrinth Emitter Service Duration (ESD) under Low-Quality (Sand-Laden Water) Irrigation. Water, 14(11), 1690. https://doi.org/10.3390/w14111690