Article

Placed Riprap Deformation Related to Axial Load at Toe Support: Physical Modelling

by
Théo Dezert
1,*,
Ganesh Hiriyanna Rao Ravindra
2 and
Fjóla Guðrún Sigtryggsdóttir
1
1
Department of Civil and Environmental Engineering, Norwegian University of Science and Technology (NTNU), S.P. Andersens veg 5, 7491 Trondheim, Norway
2
Department of Water and Wastewater, Kommunalteknikk, Trondheim Kommune, Erling Skakkes Gate 14, 7013 Trondheim, Norway
*
Author to whom correspondence should be addressed.
Water 2022, 14(10), 1581; https://doi.org/10.3390/w14101581
Submission received: 25 April 2022 / Revised: 11 May 2022 / Accepted: 12 May 2022 / Published: 16 May 2022
(This article belongs to the Section Hydraulics and Hydrodynamics)

Abstract

:
Rockfill dams are hydraulic structures of major importance. They can be exposed to extreme flood events, in turn leading to overtopping. These phenomena erode and affect structural and geotechnical integrity, which in turn can cause dam breach. Ripraps are broadly used for rockfill dam protection against such erosion processes. For steep slopes, as the one considered in this study (S = 1:1.5, vertical: horizontal), understanding the riprap behavior during overtopping is an important issue to improve dam design and reinforcement techniques. In this work, datasets are obtained from five experimental models of placed riprap built on a rock filter layer in a flume, at the hydraulic laboratory of the Norwegian University of Science and Technology, Trondheim. The riprap stones were placed in an interlocking pattern with a metallic support at the toe. The models were subjected to successive and incremental overtopping discharges until their complete failure. A laser traverse system was used to measure the coordinates (3D) of individual marked riprap stones between each discharge increase. Six load cells located at the toe measured the imposed loads during the entire procedure. From the total load values, two different types of load contributions could be distinguished: the self-weight of the stones and the hydraulic load depending on the discharge level of the overflow. This article highlights the strong relation in each of the five tests between riprap stone displacements, axial reaction load values measured at the toe and overtopping discharges. Moreover, as demonstrated in previous works, a buckling deformation of the riprap layer was observed and described. The results demonstrate that as the hydraulic load induces 2D deformations of the riprap, a larger part of the riprap weight is supported at the toe. Thus, the measured axial load during overtopping arises both from the hydraulic load and from the load imparted due to the compaction of the riprap layer. This compaction effect induces an even greater load than the one imposed due to the hydraulic contribution. The results from this study are finally put into perspective with the Norwegian Water Resources and Energy Directorate recommendations for full scale dams and suggest the great resistance of supported riprap at the toe.

1. Introduction

Ripraps are commonly used to protect various civil engineering structures such as dams, levees, spillways, bridge piers, channel beds [1,2,3,4,5]. They are protection structures against erosion and scouring composed of large quantity of rocks. In Norway, understanding riprap stability in the context of rockfill dams is a major issue. Specifically, ripraps are used on downstream slopes to resist against overtopping phenomena, responsible for external erosion processes. Being able to detail and understand the rupture mechanisms of the exposed riprap to overtopping is of importance since these events are responsible for most structural failure cases [6]. Moreover, a better understanding could help improving the construction and reinforcement techniques of ripraps.
In the field, two main types of riprap structures can be encountered on rockfill dams: dumped riprap and placed riprap. The difference between these two structures lies in the construction technique. While dumped riprap are composed of stones placed randomly on the dam shoulder, placed riprap correspond to an arrangement of stones that follow an interlocking pattern. Owing to this specific arrangement, placed riprap is more resistant against overtopping events [2,7] even though setting up such structures remains more expensive than dumped riprap from an economic standpoint.
Abt and Thornton [8] detailed the advances in research on riprap design for overtopping, mentioning important authors and works such as [5,9,10,11,12], and many more. Moreover, Najafzadeh and Oliveto [13] used experimental datasets from many authors to assess the performance of artificial intelligence techniques to predict critical overtopping discharge values for riprap failure. Their results demonstrate that the stone-related Froude number is mainly controlled by the dam slope. However, most of these works only display research on dumped riprap on moderate slopes (S < 0.5). As detailed in Ravindra [14], failure mechanisms differ a lot from dumped to placed riprap exposed to overtopping, especially if they are supported at the toe. Therefore, it is important to also consider scientific publications on placed riprap design with toe support such as [2,15,16,17,18,19,20].
In the hydraulic laboratory of the Norwegian University of Science and Technology (NTNU), Trondheim, experimental models have been set up to study the failure mechanisms of placed riprap on a steep downstream slope. First, Hiller et al. [2] described the 1D failure process of placed riprap stones on a ramp, exposed to successive overtopping, and with a support at the toe section. Then, Ravindra et al. [20] investigated the displacement of riprap stones (2D) according to the overtopping water discharge level. They displayed the existence of a deformation of such riprap layer that could be compared to the buckling deformation of a slender-long column, free at one end and maintained at the other. Ravindra et al. [7] also investigated the sliding failure mechanism of ripraps unsupported at the toe.
In this new research work, five similar models as the ones built in Hiller et al. [2] and Ravindra et al. [20] are set up and the same experimental procedure of overtopping is considered. Although, in addition to the laser system used to record the displacement of individual stones, six load cells were added on the metallic toe support structure to measure axial load values during the construction and the experimental testing phases. In this article, one of the objectives is to understand the relation between axial loads measured at the toe, 2D riprap stone displacements, and overtopping water discharge levels on a placed riprap model with toe support. Another goal is to explain the different contributions of the total loads measured at the toe, from the water contribution and from the self-weight of the riprap stones. To do so, the experimental model structure, the followed overtopping procedure and the acquisition methods are first introduced. Then, the axial load values recorded during the building of the riprap layer as well as their values during overtopping testing are displayed. Moreover, their relationship with discharge values and individual riprap stone displacements are presented. Before discussing the results and comparing them to the previous study from Ravindra et al. [20], a scaling of water discharge and axial load values is proposed to put into perspectives these results with the recommendations from the Norwegian Water Resources and Energy Directorate [21] for full-scale dams.

2. Experimental Set-Up and Methodology

2.1. Model

The experimental set-up considered in this research article is nearly the same as the ones used in Hiller et al. [2] and in Ravindra et al. [20]. Thus, for the reader eager to get more details, complement of information can be found in these previous published works. Still, an overview of the set-up and experimental procedure is introduced in this section. The experimental tests were carried out at the hydraulic laboratory of NTNU, Trondheim in a horizontal flume (25 m long, 2 m high and 1 m wide). The considered model is a 1:10 scale model of a single riprap layer on the downstream section of a dam designed by Hiller et al. [2], constructed assuming Froude similarity. The riprap layer is built on a filter layer placed on a ramp inclined at 1:1.5 (vertical: horizontal, S = 0.67, Figure 1). The elements of the model are placed across the total width of the flume (1 m) and with a total chute length of Ls = 1.75 m. The chute length has been slightly shortened compared to previous models [2,20] to accommodate the load cells at the bottom of the riprap layer. The horizontal crest length remains the same with 0.55 m. A metallic sheet perpendicular to the chute was fixed at the toe section to support the riprap and the complete model was elevated from the bottom of the flume to avoid backwater effects. Indeed, the aim of this study is only to focus on erosion and rupture of riprap when exposed to overtopping events.
Five tests (A, B, C, D, and E) were carried out with placed ripraps placed on a filter layer composed of a geotextile and a layer (0.1 m thick) of angular stones with nominal diameter of d50,F = 0.025 m and density of ρs,F = 3050 kg.m−3. The nominal diameter being d = (abc)1/3 [22], with a, b, and c respectively standing for the longest, intermediate, and shortest axes. The riprap layer consisted of rhyolite stones with nominal diameter of d50 = 0.053 m (a = 0.088 m, b = 0.049 m, and c = 0.036 m) and density of ρs = 2710 kg.m−3. The riprap layer was built by manually placing approximately 1100 stones from the toe section to the crest in an interlocking fashion. The riprap stones on the slope were placed with an inclination of β ≈ 60° (Figure 1) between the a-axis and the chute bottom while the crest stones were placed with β ≈ 90° [23]. The dimensioning of the stones comprising the riprap and the filter layers were carried out in accordance with the Norwegian Water Resources and Energy Directorate guidelines [21]. Six riprap stones were selected and marked for each test. They were located in the center of the model (with a distance of 0.5 m to both sides of the flume) at the following positions of x = 0, 0.35, 0.75, 1.15, 1.55, and 1.75 m and were identified as MS0, MS1, MS2, MS3, MS4, and MS5 respectively (Figure 1).
As proposed in previous works from Hiller et al. [2] and Ravindra et al. [20], the packing factor parameter defined by Olivier [9] can be considered as:
P c = 1 N   d 50 2
With N defining the quantity of riprap stones per m2 and d50 the median stone dimension. Pc provides information on the density of the placement of riprap stones, so that low Pc values indicate densely packed stones while higher values stand for loosely packed stones. The Pc values for each of the five tests are displayed in Table 1.

2.2. Overtopping Procedure

The experimental models were exposed to successive overtopping events (Figure 2), starting at an initial discharge ranging between 50 and 65 l.s−1. The pumps supplying discharge to the flume had a combined maximum delivery capacity of q = 400 l.s−1. The models were located far enough from the inflow section to guarantee calm flow conditions upstream. Under overtopping conditions, the models are inundated with laminar flow on the crest and by turbulent surface flow on the downstream slope (Figure 2). After the initial load period, the discharge level q was successively increased with a range of q = 25–40 l.s−1 and maintained constant for a fixed time interval (Δt = 1800 s) until ultimate rupture of the model was achieved. The water flow was stopped between each discharge increment to measure the 3D positions of the marked riprap stones. The critical discharge value qc corresponds to the value for which a complete failure of the riprap occurs. For each of the five tests, qc values are displayed in Table 1 and varied over the range qc = 150–350 l.s−1. These values can vary according to placement of stones as well as to the skills of the workers.

2.3. Measuring Devices and Data Acquisition

Position of the specific marked riprap stones were recorded by employing an automated 3D-traverse laser placed above the model. It allowed their precise positioning in a 3D Cartesian coordinate system with x-axis parallel to the chute and pointing in the upstream direction (Figure 1) and with z-axis perpendicular to the chute. The origin of the system was located at the toe section and the accuracy of the measurements were about 0.1 mm in x direction and 1 mm in z-direction. The displacements were only considered along x and z axes but not in the y-direction. Recording of the positions were completed before each discharge increment.
In this work, the use of 6 load cells (S9M force transducer manufactured by HBM) to record axial load values, Fi, is completely new. These cells were placed at the toe section of the model (Figure 1) and the sensors had a combined capacity of 3 × 10³ N. They were positioned between two metallic frames (one fixed and one movable) so that the riprap layer could be directly placed on them and to take into account only the load from riprap stones and not the one from the filter layer (Figure 3). The recording of the data was made possible during the riprap construction and throughout the five tests (between each overtopping and while the water was flowing). The value for which a complete failure of the riprap occurs is called the critical load value, Fc.

3. Data Analysis

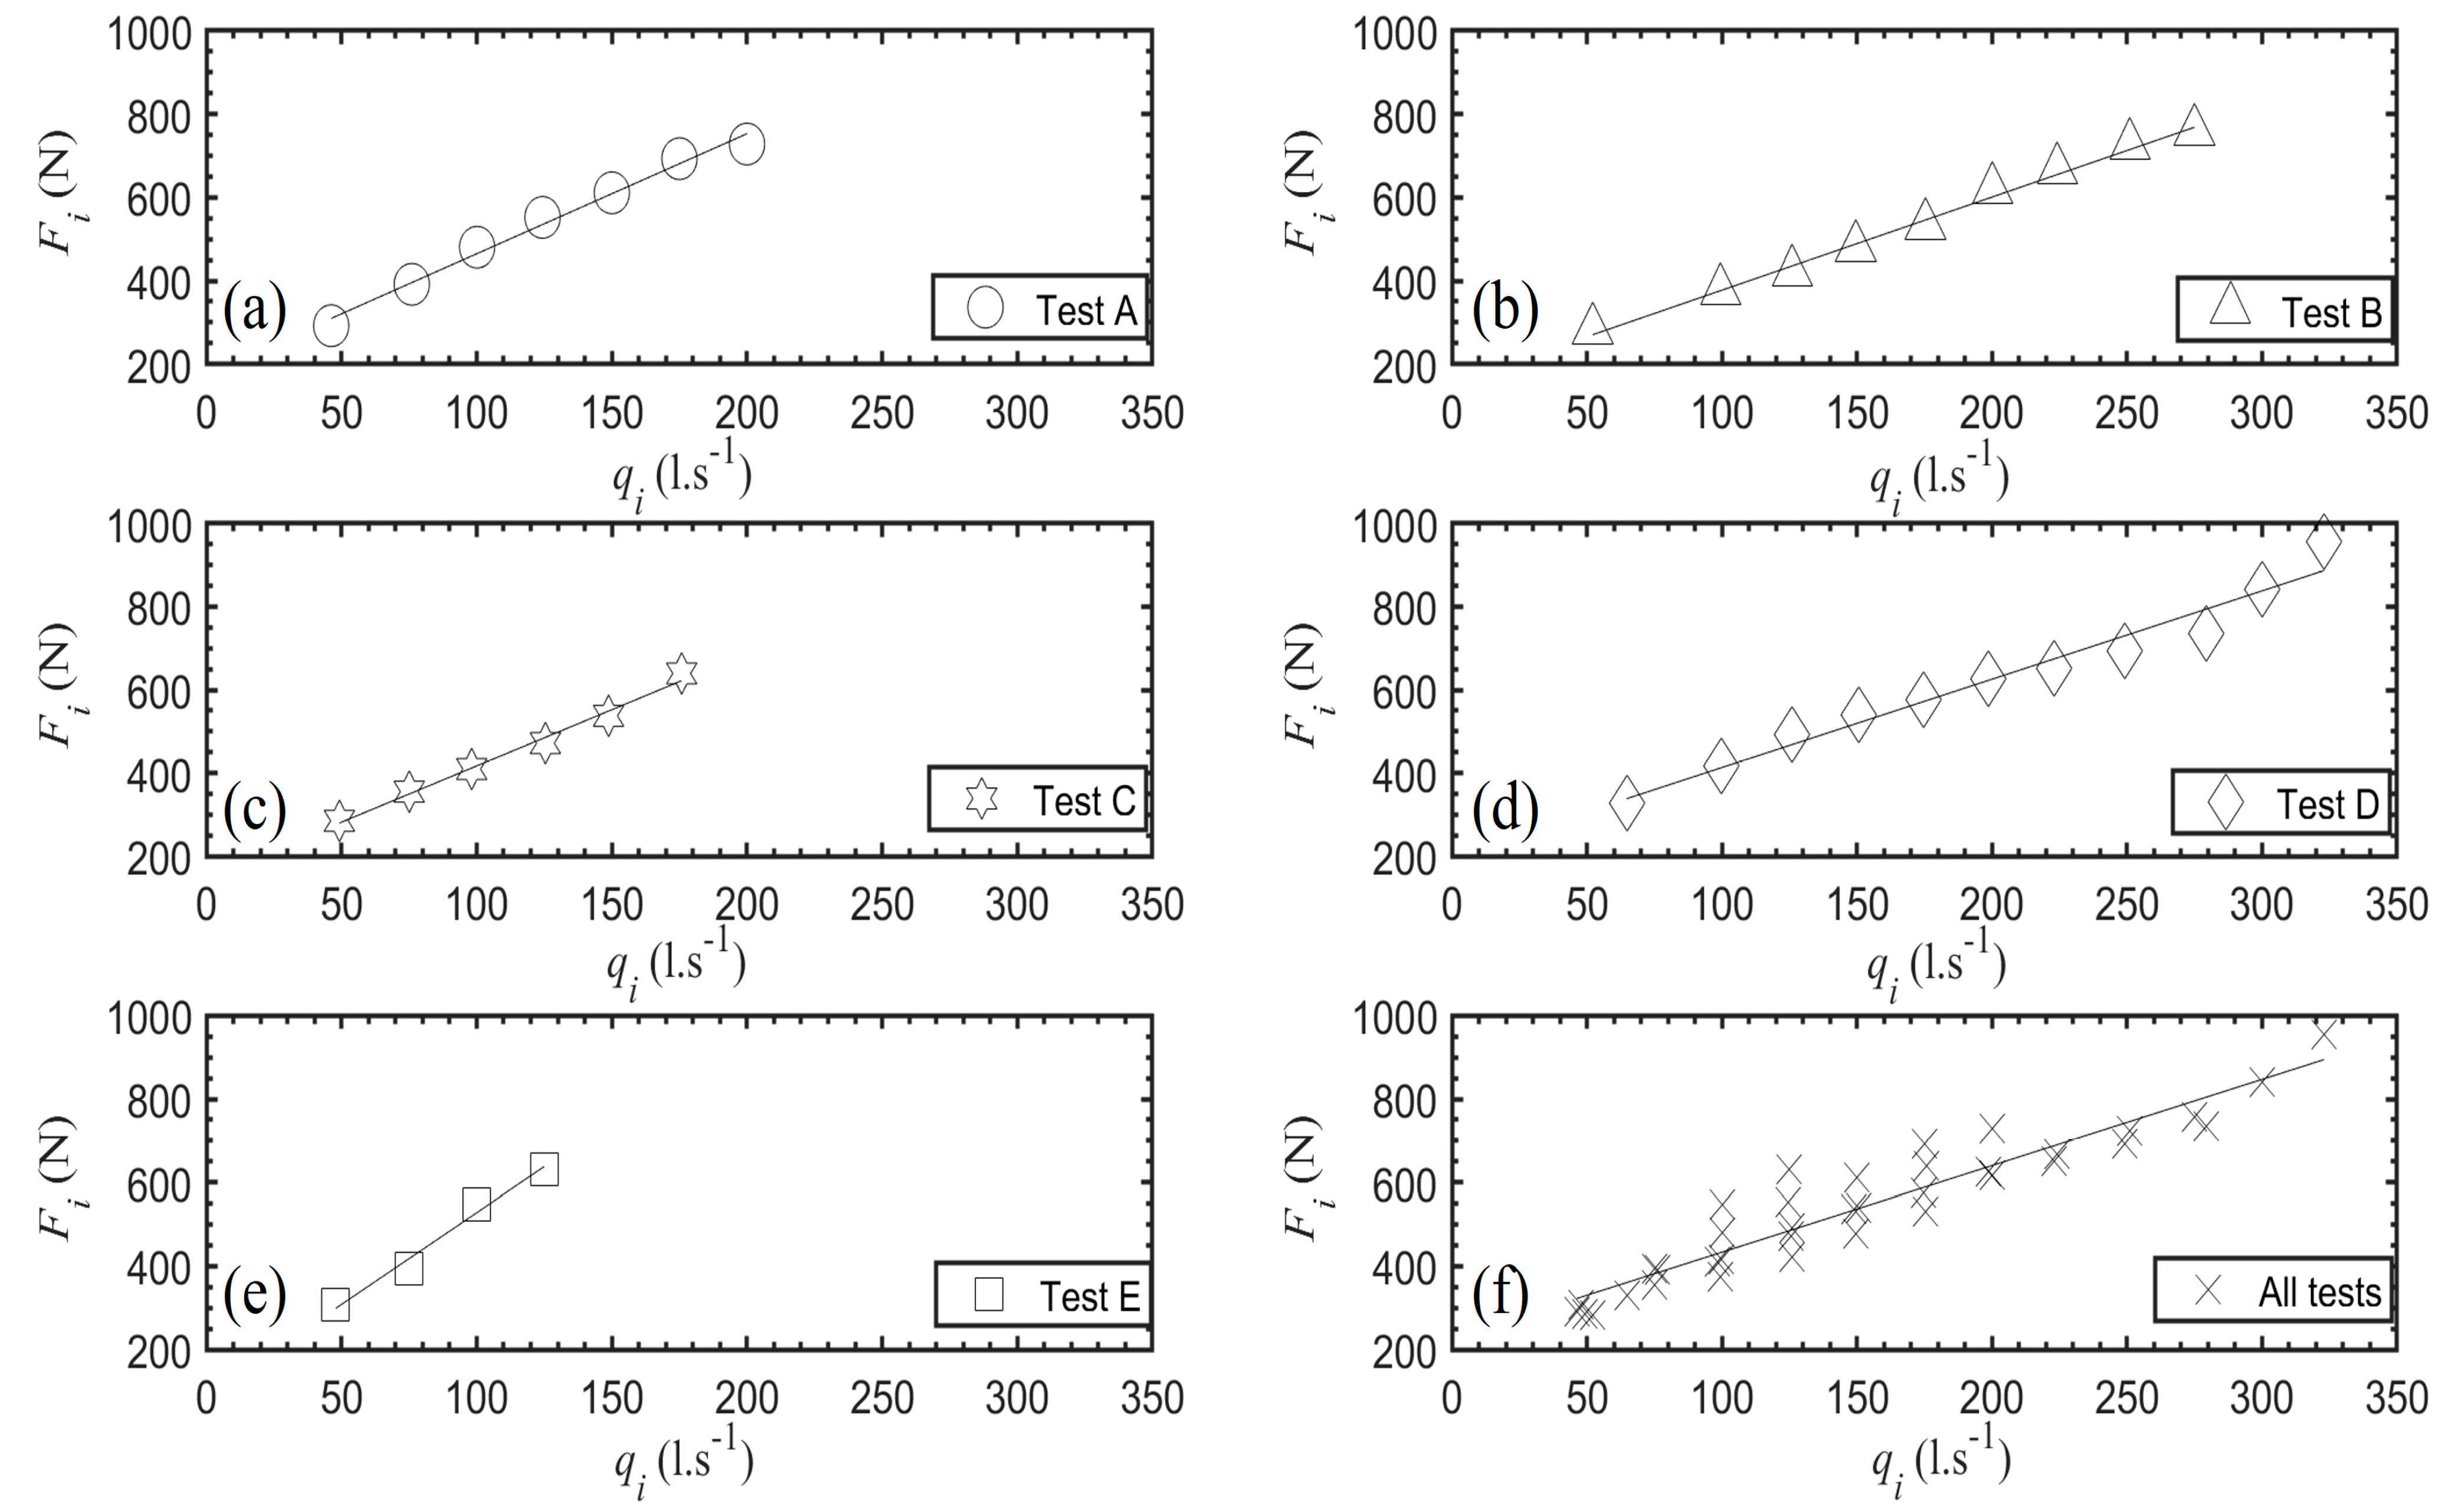
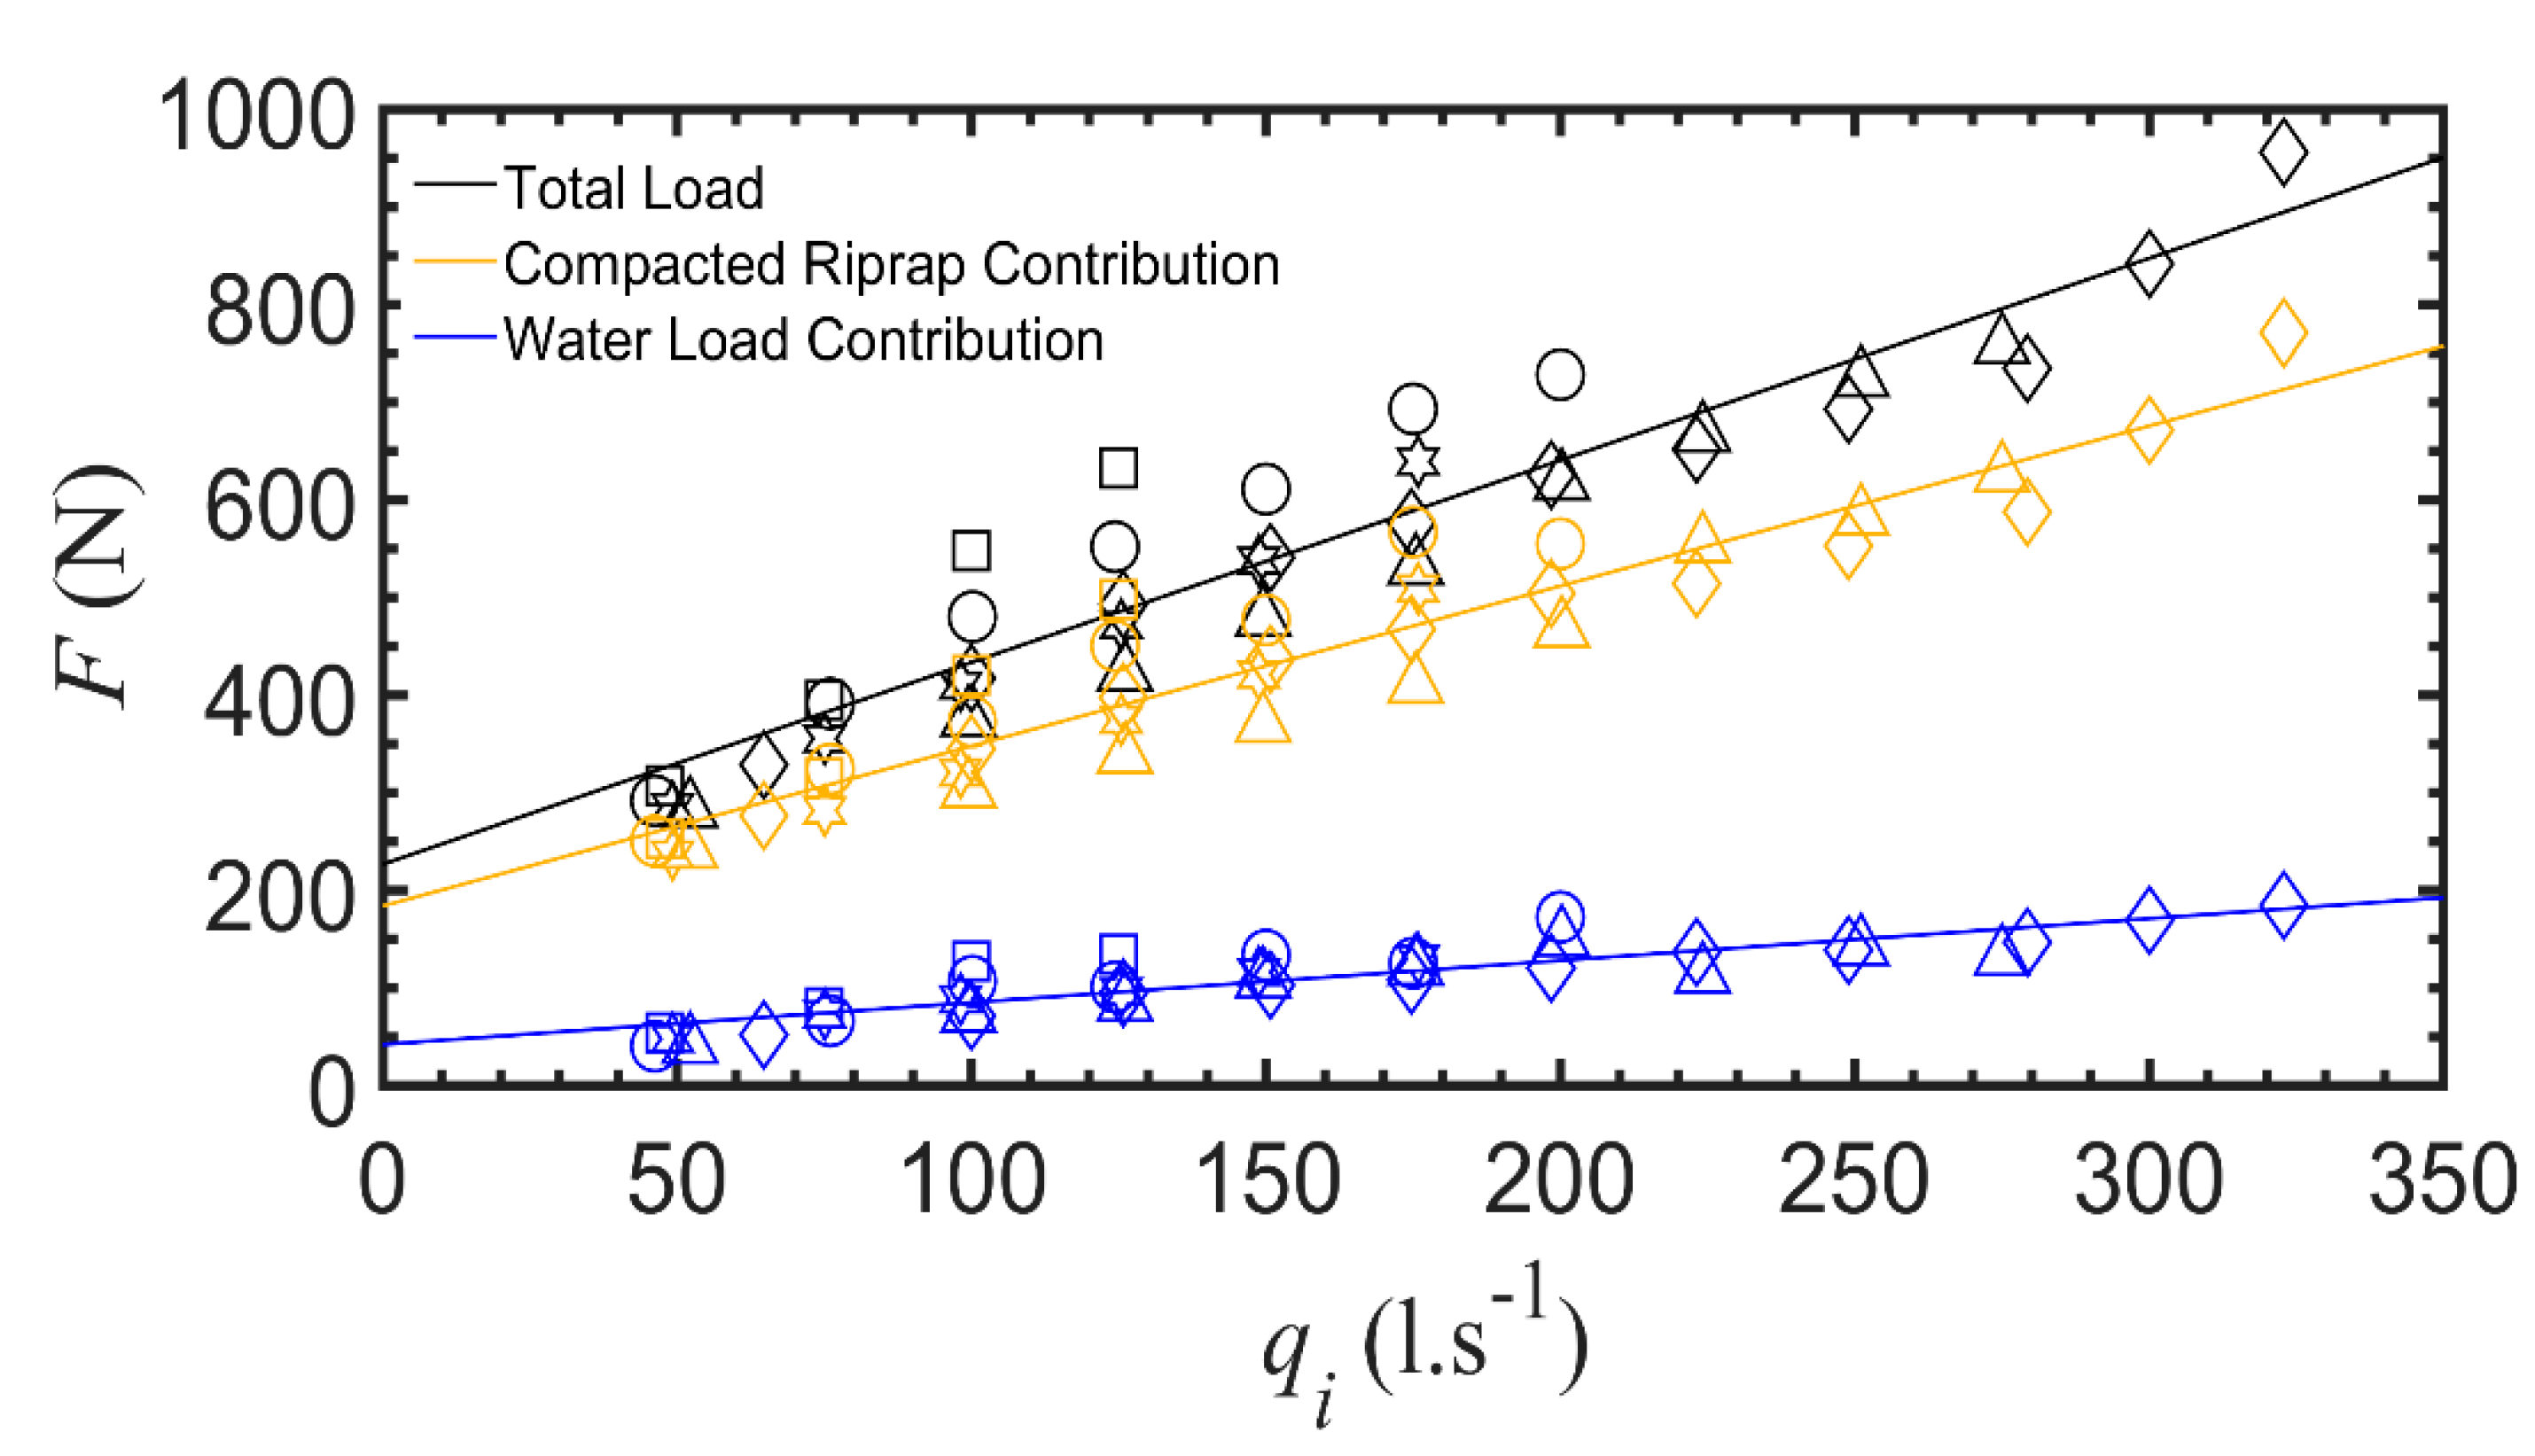
3.1. Axial Reaction Loads at Riprap Toe

The axial reaction loads at the toe were monitored while the riprap model was being built, recorded after placement of every 50 stones. These measured values are displayed for each test, according to the length from the toe, in Figure 4. These data highlight that the reaction axial load increases rapidly during the first 0.5 m but then stabilizes to a load value between 100 and 130 N, with test A displaying the greatest axial load values. These data suggest that the weight of the stones have no influence on the axial load at the toe once a certain threshold length is reached.
After the construction stage and the opening of the pumps, the water flow overtops the model and generates a load increase at the toe section. An example of the load data and discharge values from the pumps for test D is displayed in Figure 5. During overtopping stages, the axial reaction load value Fi was recorded for each test and is displayed in Figure 6 according to discharge value. That axial load then decreases (Figure 5a) when the water flow is stopped between each discharge incrementation (Figure 5b), the stable value reached after cutting off the overtopping flow corresponds to the axial load contribution from the compaction of the riprap, FRi (Figure 7).
Figure 6 highlights the strong linear relation existing between axial loads at the toe section and discharge values for individual testing (Nash–Sutcliffe coefficients R2 close to (1), but also for the complete dataset (R2 = 0.95) (Figure 6f). A relation (Equation (2)) can thus be proposed to describe the relation between these two parameters:
F i F c = 0.77 q i q c + 0.226
Even though the axial load at the toe increases along with the discharge rates (Figure 6), Figure 7 displays an increase of the compaction load contribution FRi (in yellow) between each discharge step break, when no water is flowing over the model. These loads increase after each discharge step and do not come back to their primary value. These data suggest that stone displacement and riprap compaction, imputed to overtopping, induce an increase of the axial load at the toe section. The waterflow contribution FWi (in blue, Figure 7) appears to have less impact on the axial load at the toe than the compaction load contribution. From Figure 7, it can be observed that Fi = FRi + FWi.

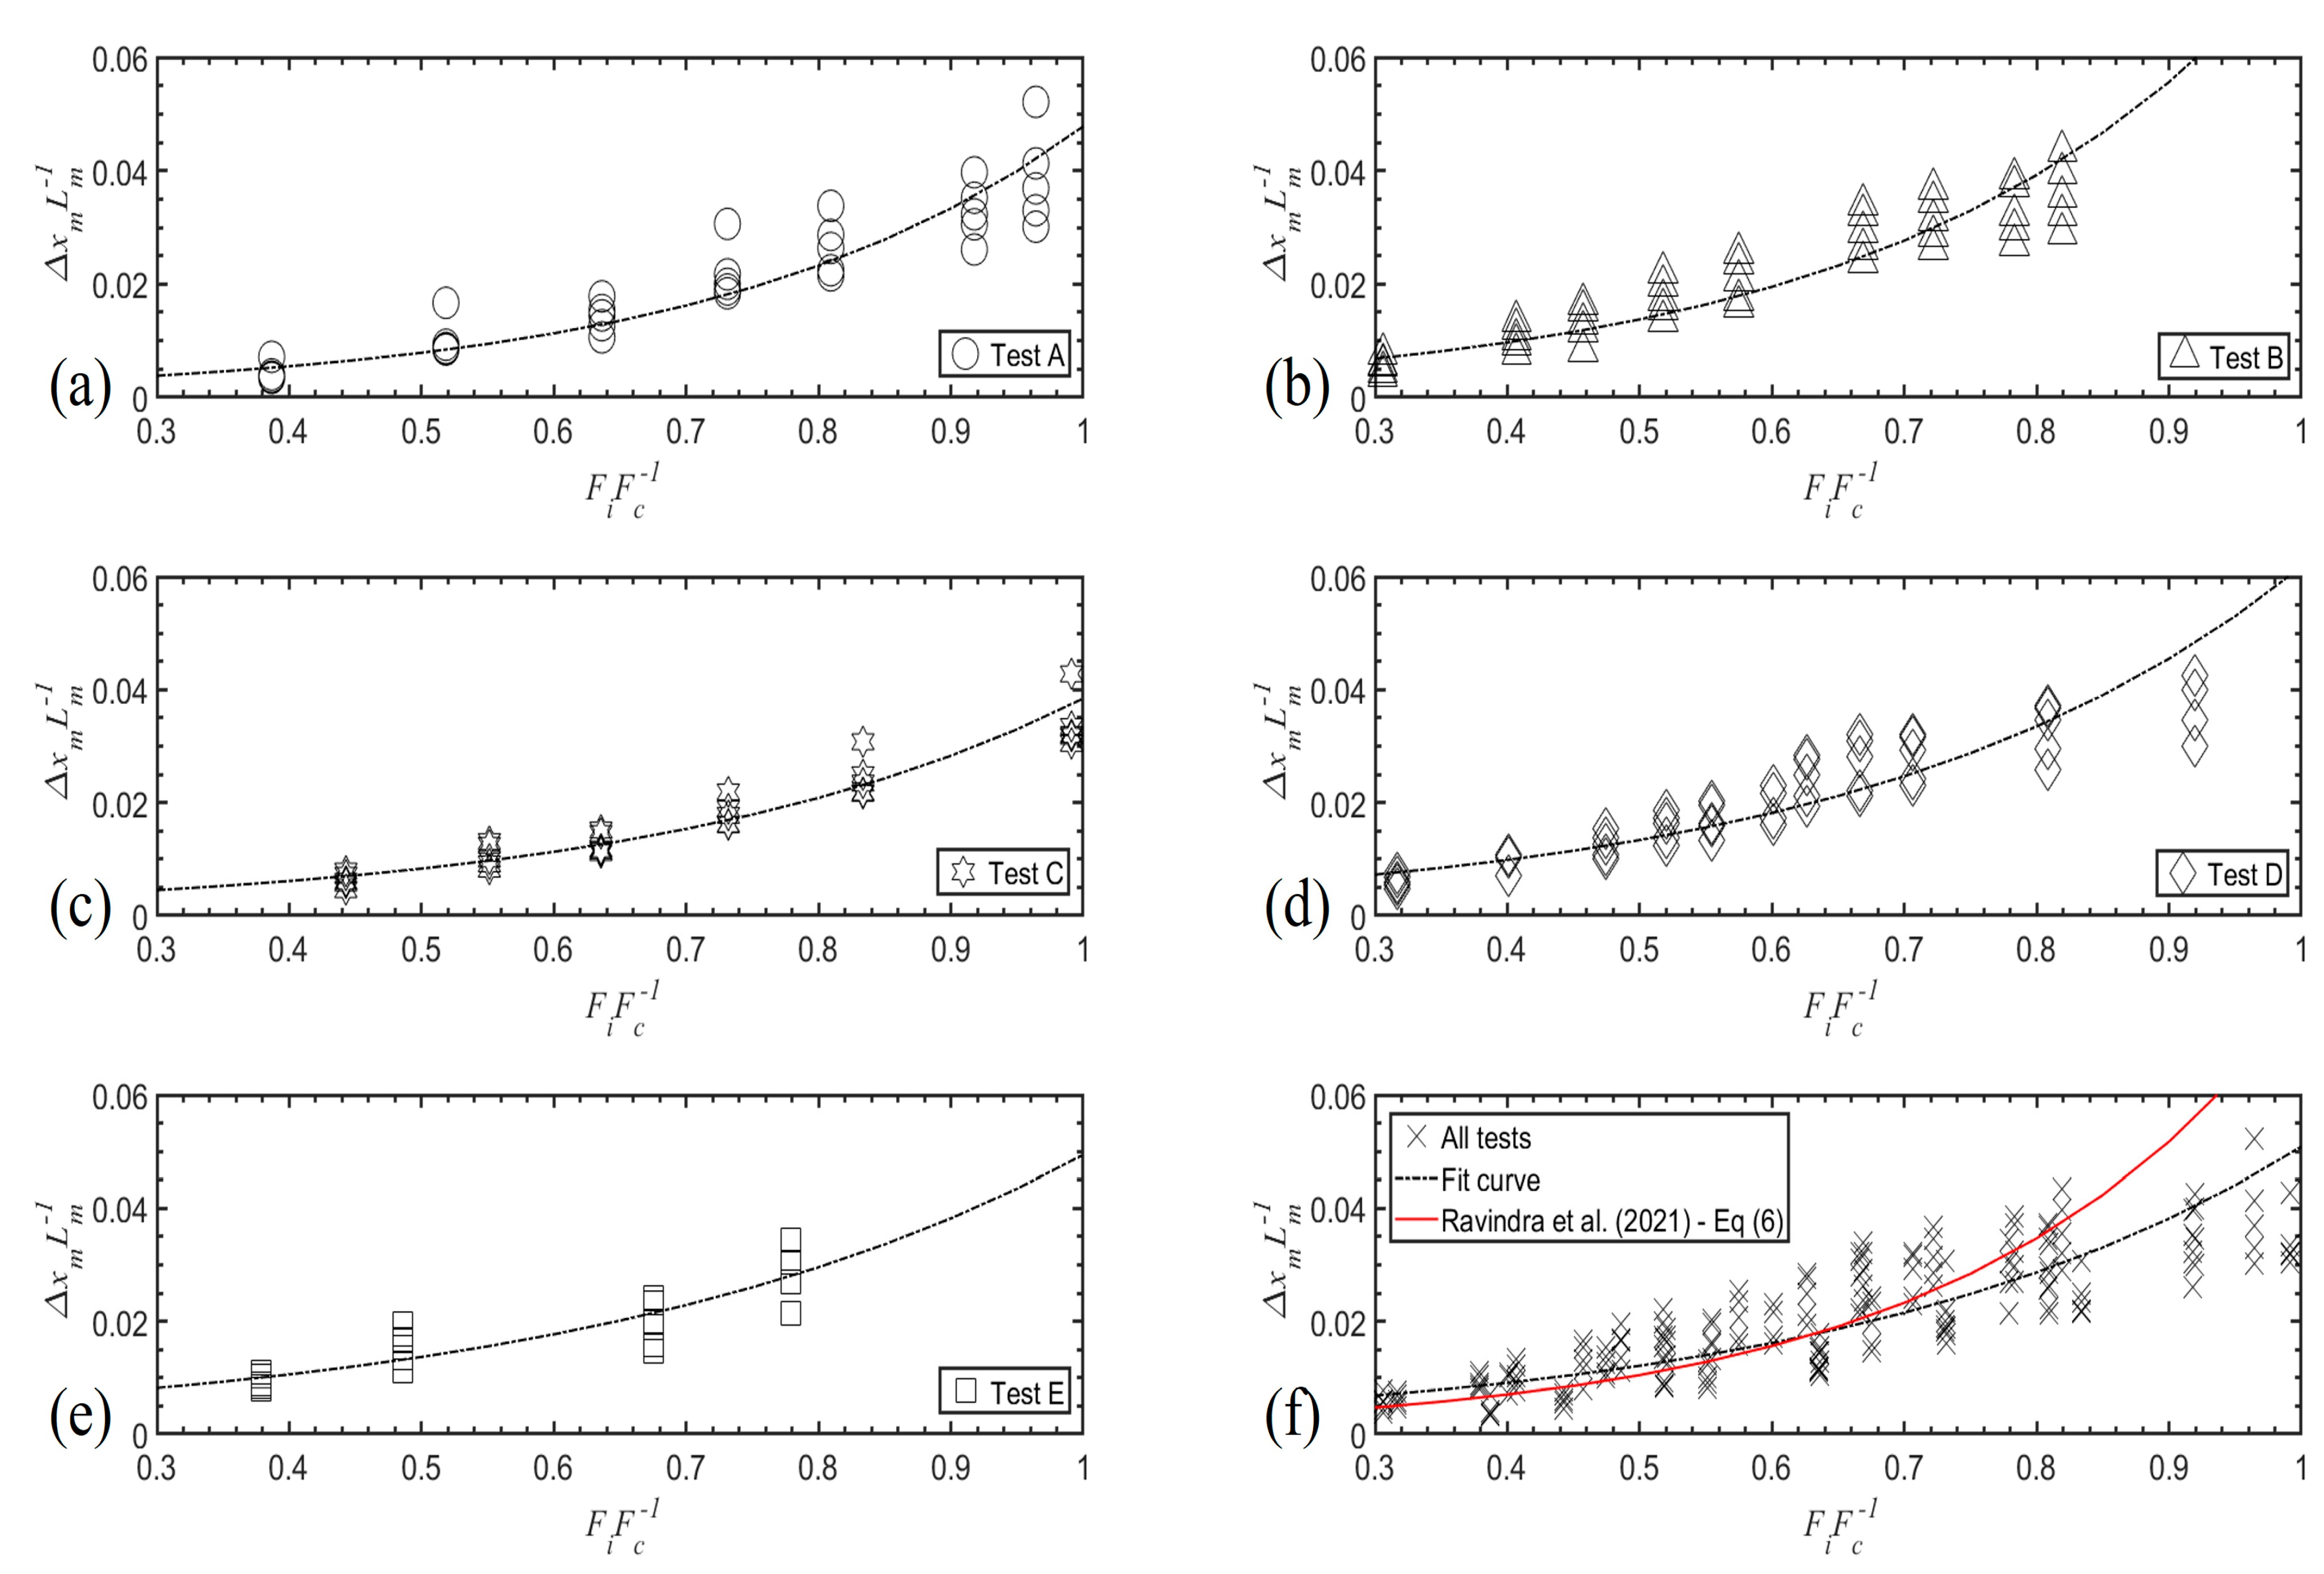
3.2. 1D Stone Displacements According to Axial Reaction Loads

The displacements of the riprap stones alongside x-axis can be plotted according to axial load values, as it was done by Hiller et al. [2] and Ravindra et al. [20] as a function of the applied discharge level. The displacement of individual stones is normalized according to [16] as ΔxmLm−1 where Lm = xm − x0, with m denoting the position of a marked riprap stone along x-axis. The displacement Δxm corresponds to the difference in stone positions with their initial position before the first overtopping. In Figure 8, the 1D stone displacements were analyzed according to the critical unit load (Fi Fc−1). As in [20], the stone displacements were considered according to the position of the riprap stone identified as MS0. Indeed, this stone undergoes a moderate displacement since it is maintained by the fixed toe support. The displayed results suggest a good exponential relationship (R2 ranging from 0.78 to 0.91) between these two parameters, for each test. The respective fitting curves are displayed in black in Figure 8. The stone displacements along x-axis increase along with the axial load measured at the toe. As a comparison, using the relation between ΔxmLm−1 and qi qc−1 proposed in [20] (cf Equation (6) of that article), the respective fitting curve is displayed in red (Figure 8f). This relation was adapted considering the previous relation from Equation (2). It appears that the fitting of this exponential curve is not optimal and the corresponding equation from these data sets (black dotted curve, Figure 8f) should rather be:
( x m d 50 ) i = 0.0029   e ( 2.86   F i F c )

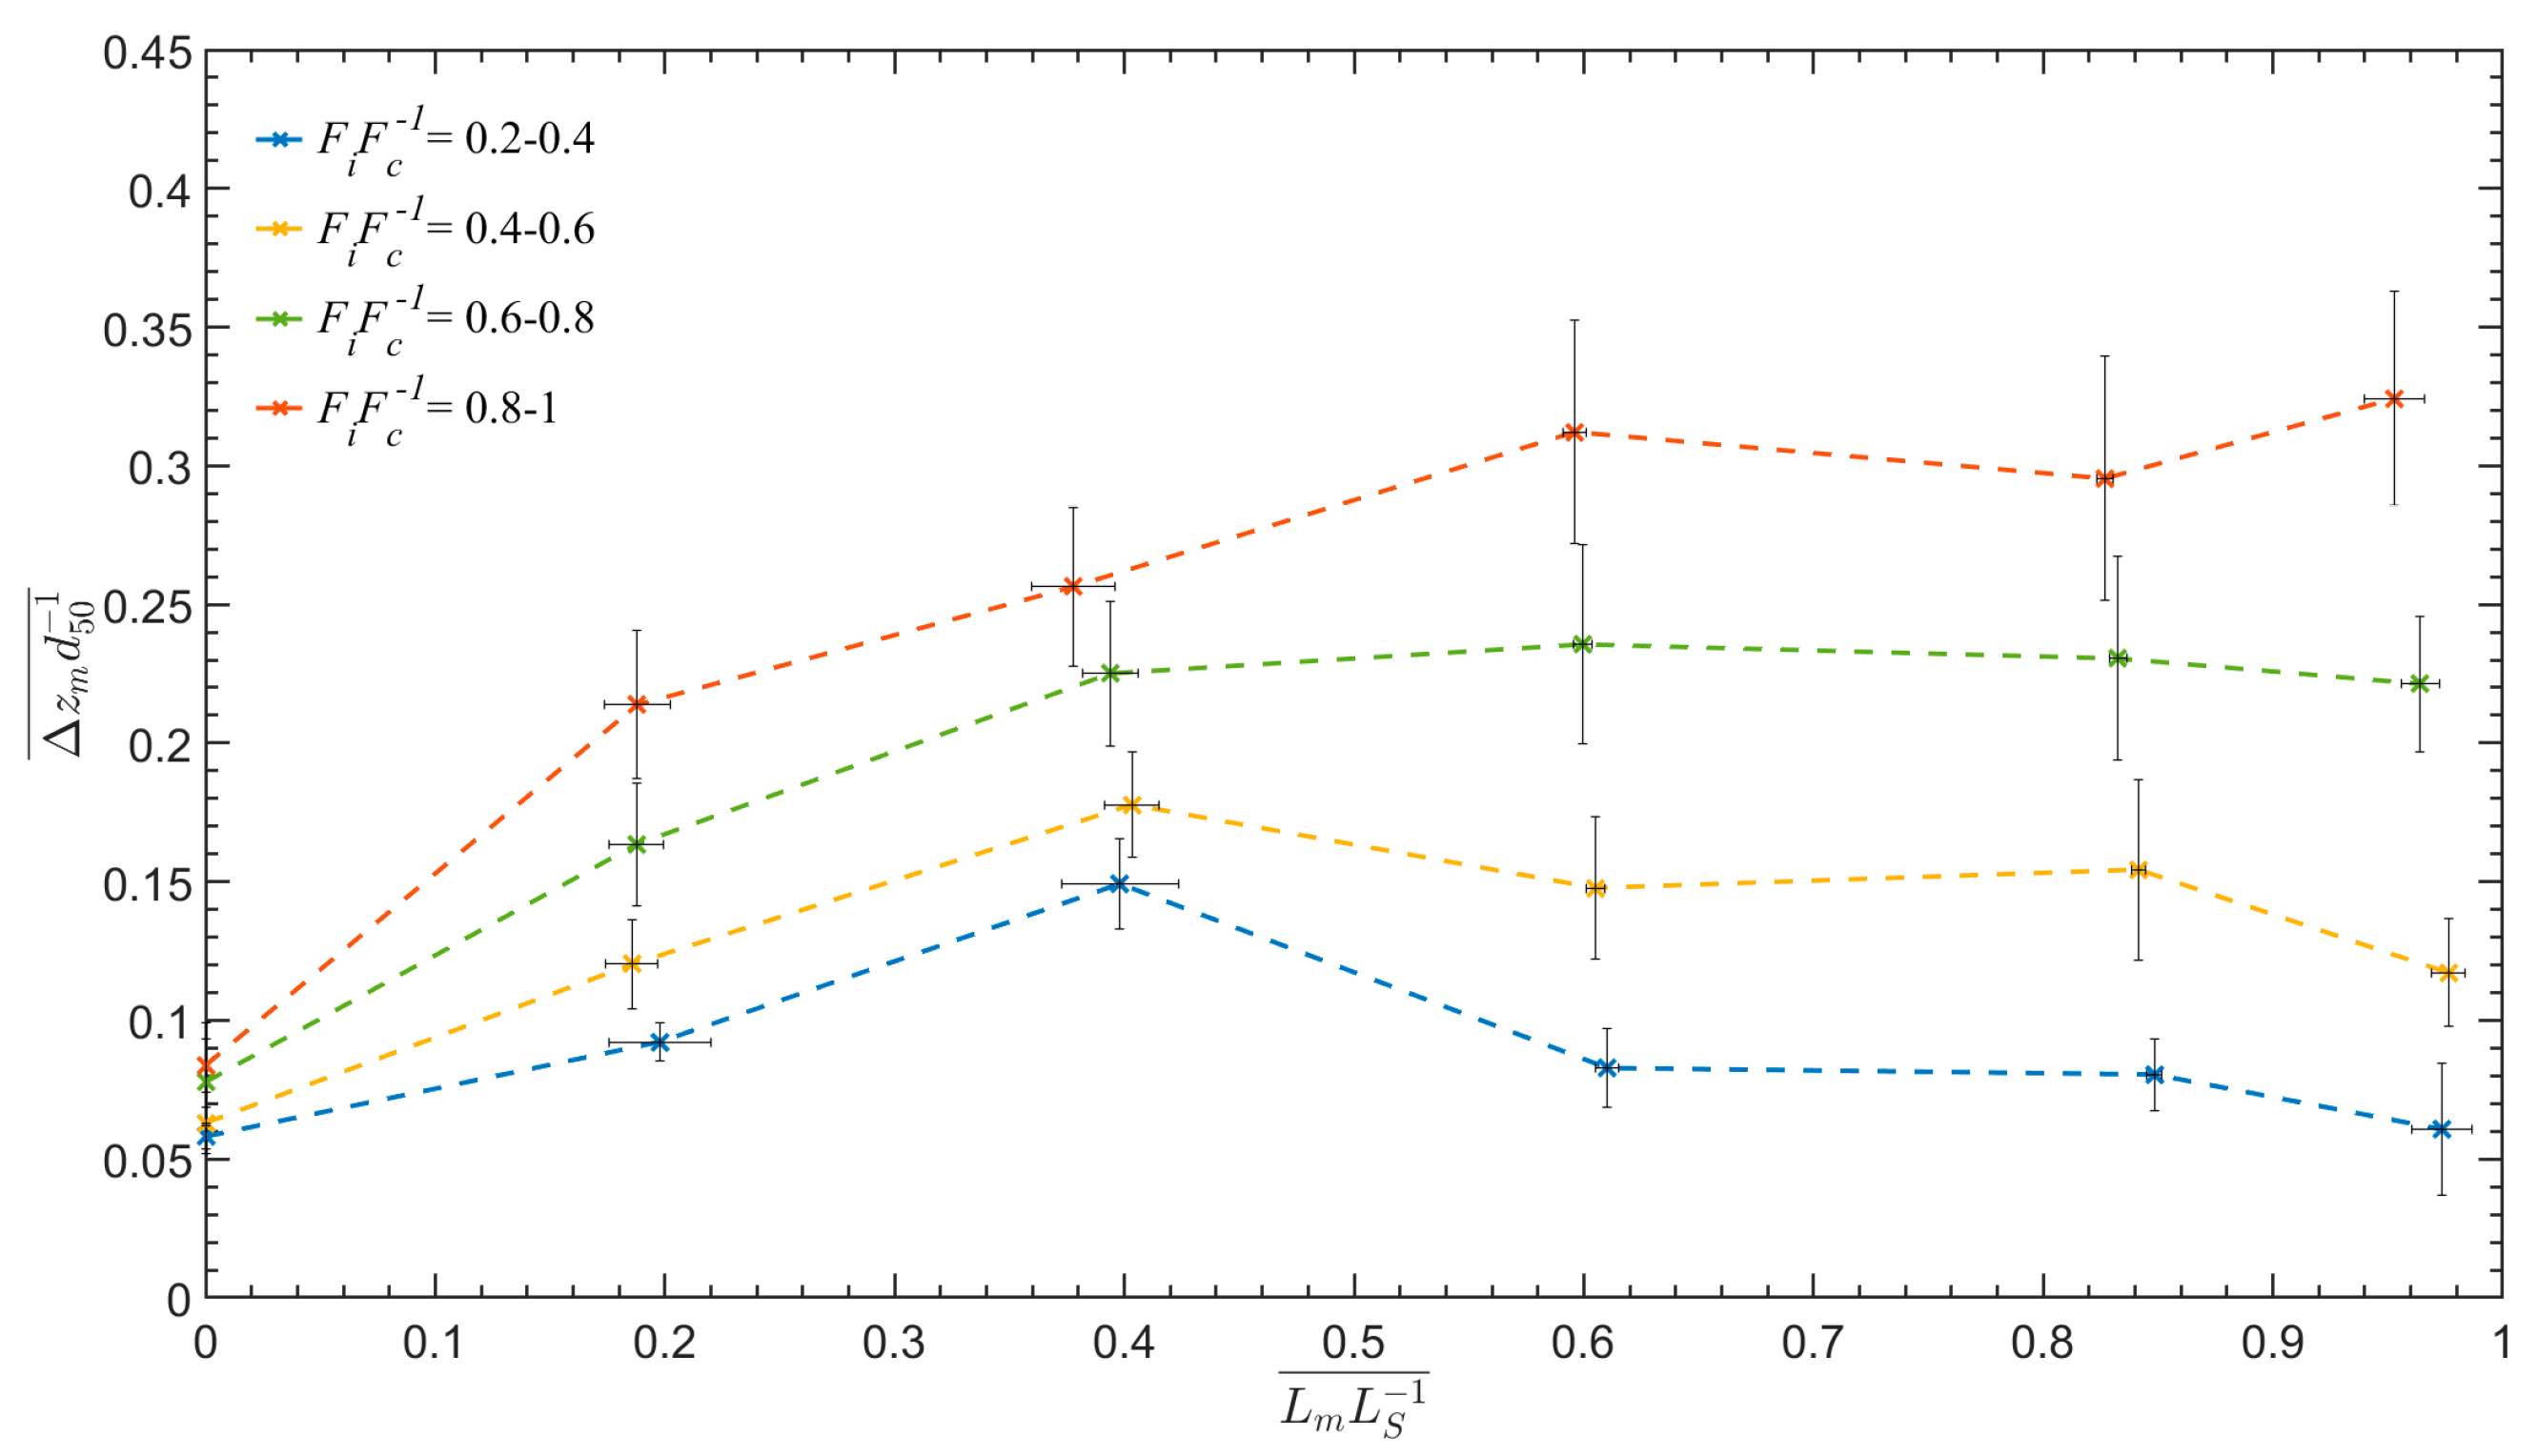
3.3. 2D Stone Displacements According to Axial Reaction Loads

Owing to the laser measurements, 2D displacements of marked riprap stones could also be computed according to the axial load values measured at the toe of the model. The results from test B data are displayed in Figure 9, with the vertical axis Δzmd50−1 standing for the stone displacements along the z-axis (Figure 1) over the nominal stone diameter and the horizontal axis standing for Lm normalized over the total riprap length Ls. They display a progressive displacement in both x and z directions such as the axial load increases. The marked riprap stones tend to go downstream in the x-direction but also to elevate themselves in the z-direction. These displacements are directly related to the magnitude of axial load measured at the toe section. These results are in agreements with the findings from [2,20]. It appears that the magnitude of elevation in the z-direction depends on the position of the riprap stone, suggesting a buckling process. The compaction of the riprap layer provokes the creation of a gap at the upstream part of the model. This mechanism combined with the buckling leads to the complete breakage of the structure.
Results from cumulative analysis with data from tests A, B, C, D, and E are displayed in Figure 10, with uncertainty in displacements being shown as 95% confidence intervals. The represented data points are average values for specific F i F c 1 intervals (0.2–0.4, 0.4–0.6, 0.6–0.8 and 0.8–1). These results attest the ones obtained from Figure 9 (Test B) and echo the one from [20].
From Figure 11, these cumulative results can be compared to the predictive curves obtained by the buckling equation issued from [20]:
( Δ z m d 50 ) i = A q i q c sin ( k π f ( L m L s ) i )
With k standing for the buckling mode (k = 1), and A and f parameters for calibration (with respectively A = 0.3 and f = 0.7). Here, Equation (4) is adapted owing to the established relation between axial load and discharge in Equation (2), so that one gets the buckling equation displayed in Equation (5):
( Δ z m d 50 ) i = ( Δ z m d 50 ) M S 0 ¯ + A ( F i F c 0.225 0.74 ) sin ( k π f ( L m L s ) i )
With ( Δ z m d 50 ) M S 0 ¯ the mean relative elevation value of the marked riprap stone MS0, equal to 0.0707 in this work. The displayed results are consistent with the ones from [20]. It also appears that the fitting of the data is not optimal for smaller loads.

3.4. Scaling for Full Scale Dam According to NVE Recommendations

Generally accepted principles to evaluate and model the flow through and over a riprap on steep slopes are not yet formulated. Due to high turbulence and a free water surface, Froude’s model law can be used. To compare the different studies, a stone-related Froude number Frs, introduced in Equation (6), is used. The critical discharge and the stone diameter are respectively qc and ds while the gravity acceleration is noted as g = 9.81 m.s−2.
F r s = q c g · d s 3
In these tests, the riprap stone diameter ds = d50 = 0.053 m is considered and the stone-related Froude number for each test is displayed in Table 2.
For the 4 dam classes defined by the NVE, specific recommendations [21] are proposed for the sizing of riprap stones used as erosion protection on the downstream slopes of embankment dams in Norway. Placed ripraps need to be constructed on rockfill dam slopes with stones of volume of minimum 0.15 m3 (Dmin = 0.64 m) for dams classified within consequence class 4. To determine the stone size for dams in class 3 and 2, Equation (7) can be used assuming a minimum unit discharge q of 0.5 m3.s−1 for Class 3 and Class 2 and 0.3 m3.s−1 for Class 1 (Table 3).
D m i n = S 0.43 · q 0.78
With the slope value S = 0.67 in the tests and Dmin the riprap size for full scale dams. Dmin values for each dam class and associated discharge scaling factor, Sf, are displayed in Table 3 such as:
S f = ( D m i n d 50 ) 3
From Equation (6), with these Dmin (Table 3) values and stone-related Froude numbers (Table 2), the critical discharge values scaled for each consequence class dam from the experimental tests can be computed and are displayed in Table 4.
As a comparison, from the previous study with placed riprap unsupported at the toe [7], the associated critical discharge values obtained were 0.84 m3.s−1 for consequence class 1, 1.51 m3.s−1 for consequence class 2 and 3, 2.26 m3.s−1 for consequence class 4. Safety factors (Table 5) can be computed as ratios of the scaled discharge levels (Table 4) and the NVE recommended design discharge magnitudes (Table 3). The safety factors enhance to evaluate the critical discharges against the recommendations proposed by the NVE (Table 3). The scaled discharges for all 4 dam consequence classes from the 5 tested models were found to exceed the NVE recommended design discharge values and display a resistance almost five times superior to the resistance of unsupported placed riprap (Table 5).
From the critical axial load values acquired on the model and displayed in Table 2, it is also possible to estimate the critical load values that would correspond to full scale dams of different classes from the experimental tests. Considering the scaling law expressed in Equation (9), the critical axial load values (N) are displayed in Table 6.
F c , p r o t o t y p e = F c , m o d e l ( D m i n d 50 ) 3
Considering that the model built in the flume is a 1:10 scale model of a dam, it is also possible to compute the qi (l.s−1) and Fi (N) values from the scaling laws introduced above, Equation (9). Such values for a full-scale dam are ten times bigger than the experimental model (considering d50,fullscale dam= 0.53 m), as displayed in Figure 12.

4. Discussion

4.1. Axial Reaction Loads at Riprap Toe

First, from all the axial load values measured at the toe section in this study, it is important to point out that a stabilization of these values is observed (Figure 4) quite soon during the building of the riprap layer (around 0.5 m from the toe). Such behavior could be explained by the compensation of the self-weight of the riprap stones by both the friction with the filter layer and the interlocking pattern of the placed riprap. Indeed, Hiller et al. [2] depicted that the interlocking of the riprap stones induces the transfer of longitudinal forces within the whole layer. Once a threshold value of building length is reached for the riprap layer, adding more stones has no significative impact on the measured axial load at the toe. Such value is a function of the considered interlocking pattern and can vary according to the configuration of the stones at the toe. For example, Khor [24] specifically displays the variability of the mechanical and structural properties of different interlocking patterns. Moreover, from studies on experimental model without toe support [7], the specificity of the pattern of placed riprap explains why it can resist up to 1.5 times greater discharge values than dumped riprap.
Further, the results display a very strong linear relation between critical water discharge and critical axial load values measured at the toe. This relation can be observed for each individual test (Figure 6a–e) but also for the global dataset (Figure 6f). It is important to highlight the fact that even though the building and testing procedures were supposed to be similar, the five experimental models underwent a breakage for different critical discharge and axial load values (Table 2). The variability of values can be imputed to the variability in the construction stage where axial load values are already slightly different from one test to another (Figure 4). Still, the relation described in Equation (2) between the two physical parameters appears pertinent when used for the buckling deformation analogy (Equation (5)). However, this relation must be put into perspective with the multiple contributions of axial load. Figure 7 points out that even though the discharge level plays an important role in the total axial load measured at the toe, the load increase imputed to the deformation of the riprap layer, FRi, is greater than the contribution from the waterflow, FWi. Indeed, between each discharge step when the waterflow is stopped, the measured axial load does not come back to its initial value (Figure 5a). This means that both the compression (Figure 8) and the elevation (Figure 9) of the riprap stones induce an additional load.

4.2. Deformation Behavior Related to Buckling Process

As Ravindra et al. [20] demonstrated the relation between overtopping discharge level and deformation of the riprap layer, the results displayed in this study demonstrate a very strong relation between axial load at the toe section and deformation of the placed riprap. The deformation of the riprap layer can be observed in 2D owing to the measurement of specific riprap stone positions. It appears that the rocks undergo a compression along the x-axis (Figure 8) that can be imputed to both the gravity as well as to the hydraulic drag and lift forces during the successive overtopping events. The stones also undergo a progressive elevation (Figure 9 and Figure 10) because of the hydraulic lift forces that tend to elevate the stones along the z-axis. However, the interlocking forces tend to counter that effect vertically and generate a bearing structure that can resist important loads owing to the possible deformation of the whole riprap layer. The compression in the x-direction of the layer can be related to the axial load values (Equation (3)), as it was previously done by Ravindra et al. [20] for discharge values. The exponential increase of the horizontal compaction according to axial load values is common to all tests but quite important differences can be observed between each test. Furthermore, the dispersion of the dataset around the exponential regression curve (Figure 8f) implies to carefully consider the relation (Equation (3)) between these two parameters. Still, the relation between discharge value and displacement in x-direction established by Ravindra et al. [20], once adapted from Equation (2), is quite close to the results.
Ravindra et al. [20] first pointed out a buckling analogy for 2D deformation of placed riprap supported at the toe when exposed to overtopping. Considering a similar experimental procedure, a buckling process can also be observed from the results displayed in Figure 9 and Figure 10. The buckling analogy consists in comparing the riprap layer to a slender-long column, free at one end and maintained at the other. Here, the free end would correspond to the top part of the riprap layer while the pinned end would be the stones lying on the metallic support at the toe. The riprap stones located in the center of the riprap layer globally undergo a relative elevation greater than the one undergone by the stones at both ends of the layer (Figure 9 and Figure 10). In this work, the buckling process can also be observed when the displacement values are put in perspective with axial load values and not only discharge values. When organized together, regarding load intervals from each of the five tests, the displacement of riprap stones can be characterized using Equation (5) (Figure 11). This relation was made possible from the relation defined by Ravindra et al. [20] and by the relation between axial load and discharge values from Equation (2). The fitting of the data is not optimal for smaller loads (Figure 11) as it was observed in Ravindra et al. [20]. This can be explained by the gaps present in the structure because of some loosely placed stones. The initial displacements of the riprap stones during the initial overtopping are then more complicated to predict. It achieves a stable buckling profile at higher discharges.
These displacement data and this buckling observation make this study consistent with previous research works but also enables the understanding of the load contribution, FRi, from Figure 7. Indeed, the relative elevation of the riprap stones from the center of the structure compared to the riprap stones from the toe (Figure 10) corresponds to an increase in the slope of the riprap column. Moreover, the elevation of riprap stones induces less friction with the filter layer. These two processes together result in that a larger of the riprap weight (component parallel to the slope) is carried by the support as well as compaction of the riprap against the toe support, and thus induce an increase of the axial load in the x-direction, perpendicular to the metallic toe support, where the load cells are located.

4.3. Recommendations and Limitations

The placed riprap slope supported at the toe, withstands, the design discharge values given by the NVE regulations [21] for sizing of riprap (Table 3) with Equation (7), with a high safety factor of 14.0 on the average (Table 5), while unsupported riprap have a factor of safety of 3.0 on the average (Table 5). The scaling of axial load values (Table 6 and Figure 12) enables to understand the axial load that the respective consequence classes dams could withstand before breakage if supported at the toe. However, it is worth noting that from a field survey carried out by Ravindra et al. [25], most Norwegian dams are not supported at the toe. Such information may be useful to establish new recommendations for the future.
Owing to the five experimental tests carried out, the good repeatability of the results can be discussed. The range of critical discharge values goes from 150 to 350 l.s−1, which is quite comparable to the range of critical discharge values Ravindra et al. [20] display in their previous study (120 to 300 l.s−1). The range of critical axial load values goes from 645 to 1040 N. The variability of Fi values (Figure 4 and Figure 6) between each test shows that even though the building procedure is the same, the perfect repeatability of each experiment cannot be granted. The construction of the model cannot be repeated the same way according to the experience of the builder and to the exact arrangement of the materials. Thus, the position of individual placed riprap stone is different from one model to another. Even though the riprap shoulder is built so as riprap stones are interlocked as well as possible, it is more likely that if some stones are locally badly interlocked together in a model, they can collapse at middle discharge levels. Then, a part of the dam is left unprotected, generating the sliding of the riprap stones above and the complete failure of the work. Nonetheless, it is important to indicate than no relation can be established between the packing factor values (Table 1) and the critical discharge values. But even though each model is slightly different, the relation described between the studied physical parameter displays the same trends (Figure 4, Figure 6, Figure 7 and Figure 8 and Figure 11).
In future research, it could be pertinent to change some of the experimental parameters such as the slope value and the nature of the stones to understand the limitations of the studied structural behavior. Adding a rockfill dam shoulder below the filter layer instead of a solid ramp would also be of great interest to understand the impact of the throughflow on the relation between riprap stone displacement and axial load values. Such study could be a valuable contribution to the recent work from Kiplesund et al. [26] focused on throughflow properties of rockfill dams, using particle image velocimetry and pore pressure values.

5. Conclusions

In this paper, to enhance the understanding of placed riprap failure mechanism, five experimental models built in the hydraulic laboratory of the Norwegian University of Science and Technology are introduced. These models consist of a placed riprap layer supported at the toe by a metallic support and lying on a rock filter layer built on a ramp with steep slope (S = 0.67). The models were then exposed to successive and increasing overtopping water discharge until complete failure of the structure, while measuring the axial load at the toe section and the displacement (2D) of individual marked riprap stones.
The results and their interpretation demonstrated a strong relation in each test between axial loads measured at the toe, individual riprap stone displacements and water discharge level. When discriminating the contribution of load from the water and from the riprap stones, it also appeared that the contribution of the load induced by the deformation of the riprap layer is greater than the contribution from the hydraulic load. Furthermore, the deformation qualified as a buckling by Ravindra et al. [20] has also been observed. This phenomenon tends to increase the axial load measured at the toe after every overtopping stage. Moreover, the interlocking pattern of the placed riprap stones acts as a bearing structure and induced a stabilization of the axial load measured at the toe during the building stage.
These results were also put into perspective with NVE recommendations for full scale dams. They suggest that all consequence class dams could resist the overtopping discharge level requested by the texts, except consequence class 3 for a 1 m width overtopping or leakage. However, these results still must be considered carefully since the experiments only rely on testing on a riprap layer lying on a ramp and not on a complete rockfill dam shoulder.
These results and associated scientific discussion, when corroborated by additional data on complementary tests, could be valuable to improve the understanding of riprap stability on rockfill dams as well as to provide suggestions for dam design and reinforcement techniques.

Author Contributions

Conceptualization, F.G.S. and G.H.R.R.; methodology, G.H.R.R. and F.G.S.; validation, T.D., G.H.R.R. and F.G.S.; formal analysis, T.D. and G.H.R.R.; investigation, T.D., G.H.R.R. and F.G.S.; writing—review and editing, T.D., G.H.R.R. and F.G.S.; visualization, T.D.; supervision, F.G.S.; project administration, F.G.S.; funding acquisition, F.G.S. All authors have read and agreed to the published version of the manuscript.

Funding

The experimental work presented was carried out as a part of Work Package 1, Project 1.2 Dam construction and Dam safety within HydroCen, Norway. The writing of this article is made possible with the financial support offered by the Norwegian Water Resources and Energy Directorate, Hafslund E-CO Vannkraft, Hydro Energi, NEAS, SFE Produksjon, Sira-Kvina, Skagerak Kraft AS, Statkraft, Tafjord Kraftproduksjon, and Trønder Energi, all in Norway. The project number for this research is: 90634900.

Institutional Review Board Statement

Not applicable.

Informed Consent Statement

Not applicable.

Data Availability Statement

Data presented in this study can be made available upon request from the corresponding author.

Acknowledgments

The authors gratefully thank the master student Kofi Ntow Opare and Malin F. Asbølmo for the assistance offered during the experimental testing program and Priska Hiller for the original design of the model.

Conflicts of Interest

The authors declare no conflict of interest.

References

  1. Abt, S.R.; Thornton, C.I.; Scholl, B.A.; Bender, T.R. Evaluation of overtopping riprap design relationships. J. Am. Water Resour. Assoc. 2013, 49, 923–937. [Google Scholar] [CrossRef]
  2. Hiller, P.H.; Aberle, J.; Lia, L. Displacements as failure origin of placed riprap on steep slopes. J. Hydraul. Res. 2018, 56, 141–155. [Google Scholar] [CrossRef] [Green Version]
  3. Johnson, E.B.; Testik, F.Y.; Ravichandran, N.; Schooler, J. Levee scour from overtopping storm waves and scour counter measures. Ocean. Eng. 2013, 57, 72–82. [Google Scholar] [CrossRef]
  4. Najafzadeh, M.; Rezaie-Balf, M.; Tafarojnoruz, A. Prediction of riprap stone size under overtopping flow using data-driven models. Int. J. River Basin Manag. 2018, 16, 505–512. [Google Scholar] [CrossRef]
  5. Siebel, R. Experimental investigations on the stability of riprap layers on overtoppable earthdams. Environ. Fluid Mech. 2007, 7, 455–467. [Google Scholar] [CrossRef]
  6. Jandora, J.; Říha, J. The Failure of Embankment Dams Due to Overtopping; Vutium: Brno, Czec Republic, 2008. [Google Scholar]
  7. Ravindra, G.H.; Gronz, O.; Dost, J.B.; Sigtryggsdóttir, F.G. Description of failure mechanism in placed riprap on steep slope with unsupported toe using smartstone probes. Eng. Struct. 2020, 221, 111038. [Google Scholar] [CrossRef]
  8. Abt, S.R.; Thornton, C.I. Riprap Design for Overtopping—Man Do I Need a Martini! World Environ. Water Resour. Congr. 2014, 191–1198. [Google Scholar]
  9. Olivier, H. Through and Overflow Rockfill Dams-New Design Techniques. Proc. Inst. Civ. Eng. 1967, 36, 433–471. [Google Scholar] [CrossRef]
  10. Stephenson, D.J. Rockfill in Hydraulic Engineering; Elsevier: Amsterdam, The Netherlands, 1979. [Google Scholar]
  11. Abt, S.R.; Johnson, T.L. Riprap design for overtopping flow. J. Hydraul. Eng. 1991, 117, 959–972. [Google Scholar] [CrossRef]
  12. Khan, D.; Ahmad, Z. Stabilization of Angular-Shaped Riprap under Overtopping Flows. World Academy of Science, Engineering and Technology. Int. J. Civ. Environ. Struct. Constr. Archit. Enfineering 2011, 5, 550–554. [Google Scholar]
  13. Najafzadeh, M.; Oliveto, G. Riprap incipient motion for overtopping flows with machine learning models. J. Hydroinformatics 2020, 22, 749–767. [Google Scholar] [CrossRef]
  14. Ravindra, G.H.R. Hydraulic and Structural Evaluation of Rockfill Dam Behavior When Exposed to Throughflow and Overtopping Scenarios. Ph.D. Thesis, Norwegian University of Science and Technology, Trondheim, Norway, 2020. [Google Scholar]
  15. Knauss, J. Computation of maximum discharge at overflow rockfill dams (a comparison of different model test results). In 13th Congress on Large Dams; International Comission on Large Dams: New Delhi, India, 1979; Volume Q50, pp. 143–159. [Google Scholar]
  16. Larsen, P.; Bernhart, H.H.; Schenk, E.; Blinde, A.; Brauns, J.; Degen, F.P. Uberstrombare Damme, Hochwasserentlastung Uber Dammscharten/Overtoppable Dams, Spillways over Dam Notches. Prepared for Regierungsprasidium Karlsruhe, Universita. Unpublished Report. 1986. [Google Scholar]
  17. Sommer, P. Uberstrombare Deckwerke/Overtoppable Erosion Protections. No. DFG-Forschungsbericht La 529/8-1, Universit. Unpublished Report. 1997. [Google Scholar]
  18. Dornack, S. Uberstrombare Damme-Beitrag zur Bemessung von Deckwerken aus Bruchsteinen/ Overtopping Dams-Design Criteria for Riprap. Ph.D. Thesis, Technische Universitat Dresden, Dresden, Germany, 2001. [Google Scholar]
  19. Peirson, W.L.; Jens, F.; Steven, E.P.; Ronald, J.C. Placed Rock as Protection against Erosion by Flow down Steep Slopes. J. Hydraul. Eng. 2008, 134, 1370–1375. [Google Scholar] [CrossRef]
  20. Ravindra, G.H.; Sigtryggsdottir, F.G.; Lia, L. Buckling analogy for 2D deformation of placed ripraps exposed to overtopping. J. Hydraul. Res. 2021, 59, 109–119. [Google Scholar] [CrossRef]
  21. NVE. Veileder for fyllingsdammer. Report n. 4/2012. Nor. Water Resour. Energy Dir. 2012, 21–25. Available online: https://publikasjoner.nve.no/veileder/2012/veileder2012_04.pdf (accessed on 23 April 2022).
  22. Bunte, K.; Abt, S.R. Sampling Surface and Subsurface Particle-Size Distributions in Wadable Gravel and Cobble-Bed Streams for Analyses in Sediment Transport, Hydraulics, and Streambed Monitoring; US Department of Agriculture, Forest Service, Rocky Mountain Research Station: Fort Collins, CO, USA, 2001. [Google Scholar]
  23. Lia, L.; Vartdal, E.A.; Skoglund, M.; Campos, H.E. Riprap protection of downstream slopes of rockfill dams-a measure to increase safety in an unpredictable future climate. In Proceedings of the European Club Symposium of the International Comission on Large Dams, Venice, Italy, 10–12 April 2013. [Google Scholar]
  24. Khor, H.C. Mechanical and Structural Properties of Interlocking Assemblies. Ph.D. Dissertation, University of Western Australia, Perth, Australia, 2008. [Google Scholar]
  25. Ravindra, G.H.; Sigtryggsdottir, F.G.; Asbølmo, M.F.; Lia, L. Toe support conditions for placed ripraps on rockfill dams-A field survey. Vann 2019, 3, 185–199. [Google Scholar]
  26. Kiplesund, G.H.; Ravindra, G.H.; Rokstad, M.M.; Sigtryggsdóttir, F.G. Effects of toe configuration on throughflow properties of rockfill dams. J. Appl. Water Eng. Res. 2021, 9, 277–292. [Google Scholar] [CrossRef]
Figure 1. Representation of the experimental set-up with positions of marked riprap stones (MS 0–5) and lengths, adapted from Ravindra et al. [20].
Water 14 01581 g001
Figure 2. Picture of the experimental model during overtopping.
Water 14 01581 g002
Figure 3. Load cell positioning against the riprap layer between two metallic frames with dimensions in centimeters.
Water 14 01581 g003
Figure 4. Measured axial load at the toe section of the experimental models during riprap layer building.
Water 14 01581 g004
Figure 5. Example of load values (a) issued from test D for the six combined cells and associated discharge values (b) from the pumps.
Water 14 01581 g005
Figure 6. Axial load at the toe section during overtopping event for each of the five tests (a–e) and for all the tests (f) according to discharge values.
Water 14 01581 g006
Figure 7. Contribution of the compacted riprap and water loads in the measured total axial load for all tests. The different symbols stand for the five different tests and correspond to the ones displayed in Figure 6a–e.
Water 14 01581 g007
Figure 8. (ae) Riprap marked stone displacement along x-axis according to normalized axial load values at the toe section for each of the five tests with exponential fitting curve representation. (f) Data for all tests put into perspective with the fitting curve from [20], in red, and the exponential fitting curve for all data, in dotted black line.
Water 14 01581 g008
Figure 9. Example of values issued from test B displaying the riprap marked stone displacement along x-axis and z-axis according to normalized axial load values at the toe section.
Water 14 01581 g009
Figure 10. Results of the analysis from the five experimental tests, displaying the average normalized stone displacements along the z-axis ( Δ z m d 50 1 ¯ ) and along the x-axis ( L m L s 1 ¯ ). The displacements are presented for incremental normalized load values ( F i F c 1 ) during overtopping. The uncertainties are displayed according to 95% confidence intervals.
Water 14 01581 g010
Figure 11. Observed 2D stone displacements from Figure 10 with predicted values from Equation (5) in dotted lines. The average normalized stone displacements are displayed along the z-axis ( Δ z m d 50 1 )   and along the x-axis ( L m L s 1 ). The displacements are presented for incremental normalized load values ( F i F c 1 ) during overtopping and the uncertainties are displayed according to 95% confidence intervals.
Water 14 01581 g011
Figure 12. Scaling of the axial load at the toe section during overtopping event according to discharge values. Data extracted from Figure 6f and scaled for a dam ten times bigger (i.e., 10 m width) than the experimental model considered in this work.
Water 14 01581 g012
Table 1. Discharge range, critical discharge, and packing factor values for each of the five tests.
Testqi (l.s−1)Pcqc (l.s−1)
A50–2250.58225
B50–3250.56325
C50–2000.53200
D65–3500.53350
E50–1500.56150
Table 2. Critical discharge, critical load and stone-related Froude number values for each experimental test.
Test ATest BTest CTest DTest E
qc(l.s−1)225325200350150
Frs5.898.55.239.163.93
Fc(N)7559246451040812
Table 3. Computed minimum riprap size values for each consequence class dam.
Class 1Class 2Class 3Class 4
Design discharge (m3.s−1.m−1)0.30.50.50.7
Dmin(m) (NVE)0.330.490.490.64
Sf15.5328.1128.1141.96
Table 4. Critical discharge values (m3.s−1) per meter, from each individual test corresponding to the four consequence class dams using Froude scaling law, with associated mean and standard deviation values.
Test   A   ( q c ) Test   B   ( q c ) Test   C   ( q c ) Test   D   ( q c ) Test   E   ( q c ) q c ¯ σ q c
Class 13.485.033.095.412.323.871.17
Class 26.339.145.629.844.227.032.13
Class 36.339.145.629.844.227.032.13
Class 49.4413.648.3914.696.2910.493.18
Table 5. Details of safety factors computations for 4 consequence classes for placed riprap with toe support and unsupported at the toe [7].
Class 1Class 2Class 3Class 4
Placed riprap with fixed toe support12.8914.0614.0614.99
Placed riprap unsupported at the toe [7]2.8333.2
Table 6. Critical axial load values (N) from each individual test corresponding to the four consequence class dams after scaling, with associated mean and standard deviation values.
Test   A   ( F c ) Test   B   ( F c ) Test   C   ( F c ) Test   D   ( F c ) Test   E   ( F c ) F c ¯ σ F c
Class 1181 × 103221 × 103154 × 103249 × 103194 × 103200 × 10333 × 103
Class 2598 × 103731 × 103510 × 103823 × 103643 × 103661 × 103108 × 103
Class 3598 × 103731 × 103510 × 103823 × 103643 × 103661 × 103108 × 103
Class 41329 × 1031627 × 1031136 × 1031831 × 1031430 × 1031471 × 103240 × 103
Publisher’s Note: MDPI stays neutral with regard to jurisdictional claims in published maps and institutional affiliations.

