Abstract
Huixian karst wetland is the largest karst wetland in the subtropical low-altitude areas in China, which is known as the kidney of Lijiang River. This study was focused on researching the NO3− source and N cycling in Huixian karst wetland using multi-isotope, hydro-chemical data, and stable isotope analysis in R model, including 7 groundwater samples, 6 fish pond water samples, and 17 surface river water samples, respectively. Hydro-chemical data showed that the maximum concentrations of NO3− (49.3 mg·L−1) and NH4+ (0.6 mg·L−1) in the groundwater exceeded the limit of Groundwater Quality Standard Class III Standard by 2.5 and 1.2 times, respectively; the maximum concentration of NH4+ (8.2 mg·L−1) in fish pond water exceeded the limit of the Groundwater Quality Standard Class III Standard by 16.3 times; the maximum concentrations of NO3− (24.5 mg·L−1), NO2− (7.3 mg·L−1), and NH4+ (2.4 mg·L−1) in surface river water were 1.2, 7.3, and 17.3 times higher than the limit of the limit of Groundwater Quality Standard Class III Standard, respectively. All water samples were in an aerobic environment with the range of dissolved oxygen (2.6–14.8 mg·L−1). Therefore, nitrification mainly occurred in the process of nitrate transformation, significant denitrification did not. Multi-isotope (δ15N-NO3, δ18O-NO3, and 13CDIC) and stable isotope analysis in R model revealed that manure sewage, ammonium nitrogen fertilizer, and soil nitrogen were the three dominant NO3− sources, contributing to (39.8 ± 6.4)%, (33.4 ± 5.1)%, and (26.8 ± 3.9)%, respectively.
1. Introduction
Wetlands are important water resources and have the laudatory name of “the kidney of the earth”. Similarly, karst wetlands are called “the kidneys of karst areas”. In recent years, in order to pursue economic benefits, man-made unreasonable use of wetlands caused a sharp decline in wetland water environment quality: wetland water quality deteriorated and disappeared [1]. The eutrophication of wetland water has become an ecological problem of great concern in our country and even the whole world [2,3,4]. Nitrogen pollution in water is one the best representations of eutrophication [5]. Nitrogen is soluble and highly mobile in a water environment. Once exceeding the standard, it is very difficult to control nitrogen pollution [6]. There were many reports that karst water being polluted by NO3− due to man-made factors [7,8]. Drinking groundwater with a high concentration of nitrogen for a long time can cause cancer, teratogenicity, and mutagenesis, which is seriously harmful to health. Because of the sensitivity and fragility of karst water, when a karst aquifer is polluted by NO3− it not only seriously threatens the drinking water source in karst areas but also harms the surrounding ecological environment [9].
Therefore, it is necessary to effectively prevent and control NO3− pollution in karst areas, and the core of solving the problem is to study the transformation process and source of NO3−. In complex systems, however, where overlapping isotopic ranges of NO3− source end-numbers occur together with interference caused by nitrification, denitrification, ammonia volatilization, anammox, and/or other unknown processes, the apportionment of sources is complicated [10,11]. The identification of NO3− sources has been identified as the first step to mitigate NO3− pollution in aquatic environments. Given its inherent advantages, nitrate isotopes (15N-NO3 and 18O-NO3) have been widely used to trace NO3− sources in the past two decades [12,13,14,15]. In addition, previous studies have successfully used 15N-NO3 and 18O-NO3 combining with NO3− concentrations to quantify NO3− sources within several karst watersheds [16,17]. Therefore, a traceability study using nitrate nitrogen and oxygen isotopes is the most extensive research method to identify nitrate pollution sources in water. It has been confirmed that there was a positive correlation between man-made input of nitric acid and 13CDIC in karst areas [18,19,20].
In recent years, the enrichment ratio of δ15N-NO3 to δ18O-NO3 and the relationship between δ13CDIC and NO3− have been successfully applied to identify the transformation process of NO3− in water [21,22]. Predecessors have successfully used the method of combining hydrochemistry with nitrate nitrogen and oxygen isotopes (δ15N-NO3 and δ18O-NO3) to trace the sources of NO3− in various types of water bodies, and many results have been achieved [23,24]. At present, the most effective method for tracing the source of nitrate is the stable isotope analysis in R model [25], which makes it possible for quantitative research on the NO3− source [26]. Therefore, multi-isotope qualitative analysis and stable isotope analysis in R model are the most effective means of analysis of NO3− source distribution characteristics, pollution status, and pollution causes in water [11,27].
Huixian karst wetland, known as “the kidney of the Lijiang River”, is the largest subtropical low-altitude karst ecological wetland in China, which is located in Guilin, the most beautiful landscape in the world. In recent decades, in order to pursue economic benefits, human beings have increased the demand for Huixian wetland. Excessive reclamation of wetlands, excessive use of pesticides, fertilizers, and livestock breeding resulted in serious eutrophication of wetlands, which has attracted great attention of government departments and scholars. Peng et al. [28] determined the NO3− source and the linear relationship between groundwater runoff conditions and NO3− concentration in the core area of Huixian wetland by multi-isotopes means. Li et al. [29] analyzed the present situation of surface lake water quality in Huixian wetland and found that the concentration of TN and NH3-N decreased from upstream to downstream of the wetland. Wan et al. [30] analyzed the temporal and spatial differences in nitrogen and phosphorus emissions from the main surface water systems of wetlands by using ArcGIS software and a SWAT model (Environmental Systems Research Institute, Redlands, CA, USA). The results showed that total nitrogen (TN) was less affected by spatio-temporal factors, but greatly affected by land use types, industrial wastewater, aquaculture sewage, and domestic sewage. Xie [31] analyzed nitrate nitrogen and total nitrogen in surface water, soil, and groundwater of Huixian wetland, and revealed the temporal and spatial difference characteristics and influencing factors of nitrogen pollution. By using grey correlation analysis and correlation analysis, it was concluded that there was a close relationship between nitrogen concentration and pH, and there was a certain correlation between underlying surface properties and nitrogen and phosphorus emission concentration in the test area.
The previous studies have mainly focused on the water quality characteristics and influencing factors in a small area (about 20 km2) in the core area of the wetland. However, the Huixian karst wetland is a wetland with karst groundwater recharge. It was not systematic enough to study only within the wetland core area. On the other hand, the area of fish ponds in the wetland is about 2 km2, accounting for about 1/10 of the wetland area. Changing part of the wetlands into fish ponds, in order to ensure that there is enough water in the fish ponds, fishermen cut off the original surface water, resulting in flooding in the wetlands near the fish ponds during the rainy season and serious water shortage in the dry season. As a result, the ecological environment of the wetland is seriously affected, and the discharge of water from fish ponds also has an important impact on the water quality of the wetland. However, most scholars have conducted sampling research on groundwater and surface river water, while ignoring fish pond water research in wetlands. In addition, the dense population, cultivated land, and agricultural activities in wetlands have a huge influence on groundwater. Therefore, only by carrying out research on the hydrochemical characteristics of various types of water in the whole basin can we better and comprehensively grasp the causes of wetland hydrochemical formation. This study systematically sampled groundwater, surface rivers, and fish ponds in the entire catchment area of the wetland (about 90 km2), and using hydrochemistry, multi-isotope (δ15N-NO3, δ18O-NO3) methods, and δ13CDIC to analyze the NO3− transformation process in Huixian wetland water, and using the stable isotope analysis in R model to quantitatively calculate the contribution rates of different NO3− inputs.
This study took the whole Huixian wetland basin as the research object, which has not been done before. Secondly, this study not only discussed the surface river water and groundwater in the study area, but also the artificial fish ponds which have a great impact on the wetlands. Thus, reasonable suggestions are put forward for water pollution control and water resources protection of Huixian wetland and similar wetlands. This study focused on: (1) revealing the characteristics of nitrogen pollution in Huixian wetland; (2) exploring the NO3− transformation of nitrogen in the study area; and (3) calculating the contribution ratio of different inputs of NO3− in Huixian wetland.
2. Materials and Methods
2.1. Study Area
Huixian karst wetland is located in the area of Sitang Town and Huixian Town, Lingui District, Guilin City, about 21 km away from the southwest of Guilin City. Geographical location: east longitude 110°09′23″–110°14′36″, north latitude 25°04′58″–25°08′25″, the altitude is between 150 and 170 m. It is located in the subtropical monsoon climate, with the average annual precipitation of 1886 mm. The rainy season is from April to August, and the precipitation accounts for 70% of the whole year. The dry season is from September to March of the next year, and the precipitation accounts for 30% of the whole year [32]. According to the hydrological observation data for many years, June to August is the wet season, and September to November is the monthly average water period, and the dry season is March to May and December to February of the following year.
The stratigraphic lithology in the study area is Donggangling (D2d) Formation limestone and dolomite, Dongcun (D3d) Formation limestone, Guilin (D3g) Formation limestone, Yanguan (C1y) Formation limestone and Datang (C1d) Formation limestone [32]. In addition, a small amount of Xindu (D2x) Formation siltstone is developed (Figure 1). The water-bearing rock groups are mainly Quaternary loose rock pore aquifers, medium to thick pure carbonate rock aquifers and impure carbonate rock aquifers.
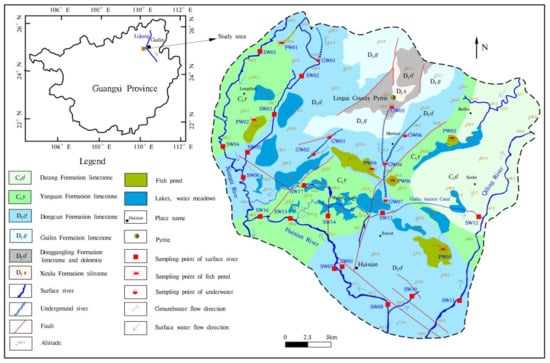
Figure 1.
Hydrogeological sketch and sampling point distribution map of the study area.
The groundwater hydrological system of Huixian karst wetland is regulated by meteorology, hydrology, and underlying surface, and the recharge sources include atmospheric precipitation, swamp water infiltration recharge, and external water lateral recharge. Groundwater flow is comprehensively controlled by topography and structure, with fan-shaped runoff from the north and south to the west, middle, and east. There are many forms of groundwater discharge, mainly undercurrent, springs, and molten pools. Surface water is the main source of recharge to groundwater in wet seasons, and surface water is mainly supplied by groundwater in dry seasons [24].
The wetland water system is developed under the effect of rivers including the Taiping River and Qingshui River in the west, which eventually merge into the Acacia River, and the tributaries in the east merge into the Liangfeng River. According to the survey, most of the original natural lakes and wasteland have been converted into fish farms, etc., which seriously damaged the original hydrological cycle conditions of the wetland. There are a large number of village residential areas in the study area, and the main sources of income for the villagers are crop cultivation on arable land, fish farming, and aquaculture in fish ponds. Therefore, arable land and fish ponds are the most widely distributed in the area, which are almost all over the study area.
2.2. Water Sampling and Testing
The sampling campaign of the entire watershed in Huixian wetland was performed from 13 to 15 January 2021, including 7 groundwater samples (GW01–GW07), 6 fish pond water samples (PW01–PW06), and 17 surface river water samples (SW01–SW17). Moreover, the groundwater is collected from the outlet of the underground river and the karst pool water. The distribution of sampling points is shown in Figure 1.
The pH, dissolved oxygen (DO), temperature (T), oxidation reduction potential (Eh), and electrical conductivity of the water body were tested with a hand-held water quality meter (WTW3430, GER) on site, and the resolutions was 0.01, 0.01 mg·L−1, and 0.01 °C, respectively. Ca2+ and HCO3− were tested with a hardness tester and alkalinity meter on site, respectively. The samples for testing conventional ions of water chemistry were collected with a 500 mL polyethylene plastic bottle, and the samples for testing cations, heavy metals, and trace elements were acidified with high-grade pure nitric acid (HNO3) to pH < 2 on site. The δ15N-NO3, δ18O-NO3, and δ13CDIC samples were collected in 50 mL brown polyethylene plastic bottles, and 3–5 drops of saturated HgCl2 were added to the δ13CDIC samples. The sampling bottle was rinsed 3–4 times with filtered (0.45 μm) water before loading the sample. All water samples were refrigerated at 4 °C for testing. The NO3− and Cl− were measured by ion chromatograph (DionexICS-1100) with the resolutions of 0.05 and 0.1 mg·L−1, respectively. The NO2− and NH4+ were measured by T6 Xinyue visible spectrophotometer with the accuracy of 0.002 mg·L−1 and 0.02 mg·L−1, respectively. The carbon isotope of DIC (δ13CDIC) was measured by GasBench II (Thermo Fisher Scientific Corp., Waltham, MA, USA) after being acidified by phosphoric acid. The value of δ13CDIC was calibrated using three international standards (NBS-18, NBS-19, and NBS-30) and four internal standards (GBW04405, GBW04406, GBW04416, and GBW04417), and the analytical precision was generally better than 0.2‰. The above sample determination work was completed in the Karst Geological Resources and Environmental Supervision and Testing Center of the Ministry of Natural Resources.
Nitrate isotopes (15N-NO3 and 18O-NO3) were determined using the bacterial denitrifier method after NO2 removal with sulfamic acid [33,34]. The isotopic compositions of produced N2O (NO3−→ N2O) were determined on Delta-plus (Thermo-Finnigan Corp, Silicon Valley, CA, USA) fitted to auto-sampler equipment (CTC Analytics AG, Zwingen, Basel, Switzerland) and a Trace Gas Pre-concentrator unit. The analytical quality was controlled by blanks and four international standards (USGS-32, USGS-34, USGS-35, and IAEA-N3) and the analytical precision was generally better than 0.1‰ for δ15N-NO3 and 0.5‰ for 18O-NO3, respectively. The relative ratio of N and O isotopes in nitrate is expressed by δ:
δ sample(‰) = [(Rsample − Rstandard)/Rstandard] × 1000
In the Equation (1), R represents the ratio of 15N/14N or 18O/16O in the sample and the standard sample, namely δ 15N and δ 18O. The N isotope takes atmospheric nitrogen (N2) as the reference standard, and the O isotope takes Vienna Standard mean seawater (Vienna standard mean ocean water, V-SMOW) as the reference standard. The δ15N-NO3 and δ18O-NO3 samples were tested in the Institute of Agricultural Environment and Sustainable Development, Chinese Academy of Agricultural Sciences.
2.3. Stable Isotope Analysis in R Mixing Model
The Stable Isotope Analysis in R (SIAR) model is a stable isotope mixture model based on R statistical software developed by Parnell et al. Its application makes the source analysis of pollutants change from qualitative to quantitative [11]. The premise of the stable isotope analysis in R model is that there is no obvious denitrification in the water body. By defining j isotopes of n mixtures from k sources, and considering the influence of isotopic fractionation, it is expressed as Equation (2):
In the Equation, Xij is the δ value of the mixture isotope, where: I = 1, 2, 3… n, j = 1, 2, 3… J; Sjk is the j isotope value of the kth endmember (k = 1, 2, 3…), μjk is the mean, ωjk is the standard deviation; Pk is the contribution ratio of endmember k, which needs to be predicted according to the stable isotope analysis in R model; Cjk is the fractionation factor of endmember k on the j isotope, λjk is the mean of the fractionation factor, τjk is the standard deviation; εjk is the residual error, representing the undetermined variable between different individual mixtures, the mean is 0, and the standard deviation is σi. The R Programming Language was used to calculate the contribution ratio of each pollution source by running the package of Stable Isotope Analysis in R.
Therefore, the steps of the methodology in study are shown in Figure 2.
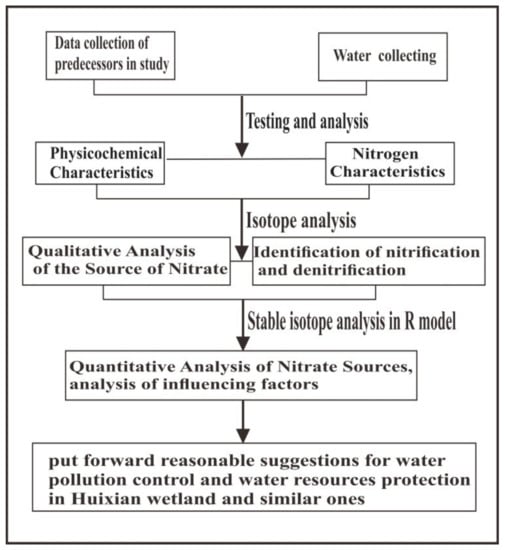
Figure 2.
The flow chart illustrating the steps of the methodology in the study.
3. Results
3.1. Physicochemical Characteristics
All sample water chemistry and isotopic test results are shown in Table 1. The DO concentration of groundwater in the study area was in the range of 2.6–14.8 mg·L−1 with an average value of 6.8 mg·L−1, the DO concentration of fish pond water was in the range of 2.2–10.1 mg·L−1 with an average value of 6.5 mg·L−1, the DO concentration in surface river water ranged from 6.3 to 14.2 mg·L−1 with an average value of 10.0 mg·L−1. It showed that the three water bodies in the study area were all in an aerobic environment. Compared with groundwater and fish pond water, surface water has a higher DO concentration, which was mainly because surface river water has better fluidity and openness, and was closely related to atmospheric exchange.

Table 1.
Water chemistry and isotopic characteristic values of Huixian wetland.
The Cl− concentration in groundwater was at a low concentration level (1.1–7.4 mg·L−1), with an average value of 5.4 mg·L−1; the concentration range in fish ponds was 3.4–18.6 mg·L−1, with an average value of 7.6 mg·L−1; except for the higher concentrations of SW02, SW05, and SW06 (147.2 1, 198.8, and 104.4 mg·L−1, respectively), the surface river water was generally at a low level. The concentration level was 2.0–24.4 mg·L−1, with an average value of 9.3 mg·L−1. There were two main reasons for the increase in Cl− concentration at the SW02, SW05, and SW06 sampling points: firstly, the three sampling points are located in residential cultivated areas and are subject to the use of artificial chlorine-containing fertilizers. It has been confirmed that the concentration is in direct proportion; the second is the dissolution of salt rock. It has been confirmed that the dissolution of rock salt is one of the main sources of Cl− in karst water [35]. Through statistical analysis of data, it was concluded that the order of Cl− concentration in three water bodies was surface river water > fish pond water > groundwater. This was mainly because the use of man-made chlorine-containing fertilizers increased the concentration of Cl− into surface river water and fish ponds, while the concentration of Cl− into groundwater is relatively small.
The DIC concentration in groundwater was in the range of 18.8–35.2 mg·L−1, with an average value of 27.3 mg·L−1; the concentration range in fish ponds was 31.6–55.0 mg·L−1, with an average value of 47.9 mg·L−1; the concentration in river water was generally was in the range of 17.8–51.8 mg·L−1, with an average value of 35.7 mg·L−1. It was concluded that the order of DIC concentration in three water bodies was fish pond water > surface river water > groundwater.
3.2. Nitrogen Characteristics
According to the concentration data of NO3−, NO2−, and NH4+, the concentration box of three nitrogen elements in water is shown in Figure 3. The maximum concentrations of NO3− and NH4+ in underground water were 49.3 and 0.6 mg·L−1, which were 2.5 and 1.2 times the limit.
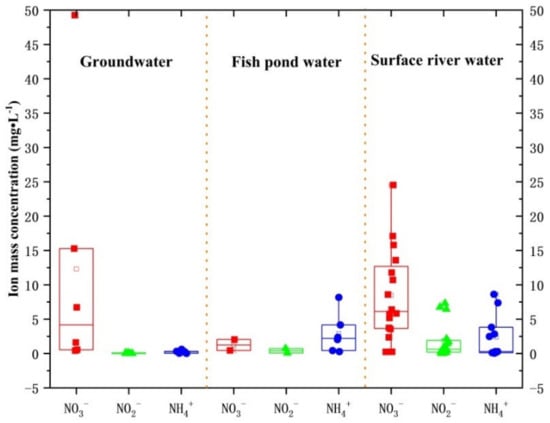
Figure 3.
Nitrogen concentration box diagram of three types of water bodies.
Among the six fish pond samples, a higher concentration of NH4+ was detected. The maximum mass concentration of NH4+ in fish pond water was 8.2 mg·L−1, which was 16.3 times the limit. The maximum concentrations of NO3−, NO2−, and NH4+ were 24.5, 7.3, and 8.6 mg·L−1 in surface river water, respectively, which were 1.2, 7.3, and 17.3 times the limit.
To sum up, the order of the average concentration of nitrate was groundwater > surface river water > fish pond water, and the order of the average concentration of nitrite and ammonium ion was fish pond > surface river water > groundwater. In the three types of water bodies, the nitrogen concentrations in some sampling sites exceeded the limits of Class III water in the groundwater quality Standard (GB/T14848-2017) and the Sanitary Standard for drinking Water (GB5749-2006). Among them, the maximum concentration of NO3− and NH4+ in groundwater exceeded the limit standard, the concentration of NH4+ in fish pond water exceeded the limit by nearly one order of magnitude, and the concentration of NO3−, NO2−, and NH4+ in surface river water exceeded the limit standard, among which the concentration of NH4+ has exceeded the limit standard by more than 10 times. In the study area, the long-term use of these three types of water by humans and organisms will pose potential health hazards. The over-standard points of water samples were mainly located in residential, cultivated land, and orchards. On the one hand, the topography was flat, the hydrodynamic condition was poor, and the concentration of pollutants was easy to gather, which led to the increase in concentration. On the other hand, the orchard and cultivated land used a large number of chemical fertilizers, resulting in the increase in NO3− through infiltration and surface runoff. The high concentrations of NO2− and NH4+ were mainly in surface river water and fish pond water, while the concentration of NO3− was relatively low. According to the two stages of nitrification, it can be concluded that the first stage of nitrification mainly occurs in fish pond water and surface river water (the initial stage of nitrification), while the second stage (nitrification) has not occurred obviously, indicating that fish pond water and surface river water were polluted by nitrogen. Fishermen may have fed too much nitrogenous feed to fish and nearby villagers used nitrogen fertilizer on fruit trees [36]. Surface river water and fish pond water play an important role in the transformation of the three waters. As important water resources in the study area, relevant departments should strengthen prevention and control. Among them, the water area of fish ponds accounts for about 10% of the water area of Huixian wetlands. During the high and low water periods, the polluted fish pond water seeps into the groundwater, which seriously affects the quality of groundwater, harms the health, and hinders the sustainable development of the ecosystem. Fishermen should reduce the use of nitrogenous feed, feed it reasonably, and apply fertilizer scientifically in agricultural activities to ensure that the water in fish ponds is not polluted.
3.3. Isotopic Analysis
The range of δ 15N-NO3 of groundwater was 6.8–20.8‰, with the average value of 13.71‰; the δ 18O-NO3 norm circumference was −0.8–14.3‰, with the average value of 8.1‰; the δ 13CDIC range was −13.5–−3.3‰, with the average value of −10.6‰. δ 15N-NO3 of fish pond water ranged from −15.8 to −1.0‰, with an average of −8.4‰; δ 18O-NO3 ranged from −2.3 to 9.6‰, with an average of 3.6‰, and δ 13CDIC ranged from −4.6 to 0.1‰, with an average of −2.5‰. δ15N-NO3 of surface river water ranged from −10.0 to 10.6‰, with an average of 3.3‰; δ 18O-NO3 ranged from −6.9 to 6.1‰, with an average of −1.1‰, and δ 13CDIC ranges from −11.6 to −2.4‰, with an average of −8.9‰.
It can be concluded from Figure 4 that, in three different types of water bodies, the order of δ 15N-NO3 was groundwater > surface river water > fish pond water; the order of δ 18O-NO3 was groundwater > fish pond water > surface river water; and the order of δ13CDIC was fish pond water > surface river water > groundwater.
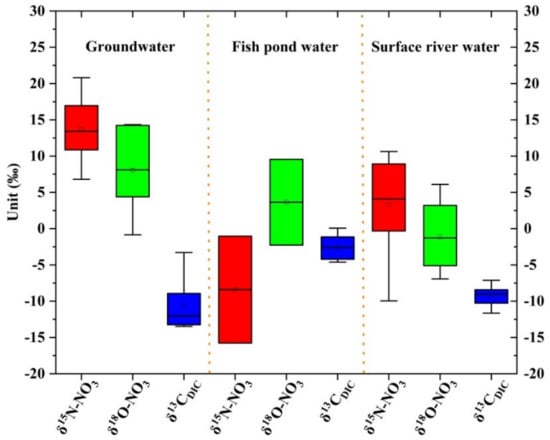
Figure 4.
Characteristics of carbon, nitrogen, and oxygen isotopes in the study area.
4. Discussion
4.1. Qualitative Analysis of the Source of Nitrate
The characteristics of the concentration of Cl− and TN can identify the source of groundwater pollution [37]. According to the concentration of Cl− and TN of three kinds of water samples in the study area, the relation diagram was drawn (Figure 5). The maximum concentration of TN among samples in the study area did not exceed 60 mg·L−1 and did not exceed the concentration limit of groundwater seriously polluted by human/animal excreta [38]. However, the concentrations of Cl− and TN in some samples were higher than 7 and 10 mg·L−1, respectively, and the concentrations exceed the limits of Cl− and TN concentrations of man-made pollution sources of groundwater in karst areas [39,40], indicating that the three types of water bodies in the study area were affected by human activities, and the sources of nitrogen and Cl− were diversified, including nitrogen fertilizer, mixed source, and manure sewage. Individual samples had the characteristics of high Cl− and low TN, and Cl− may come from chlorine-containing fertilizers, such as KCl used by crops in the watershed.
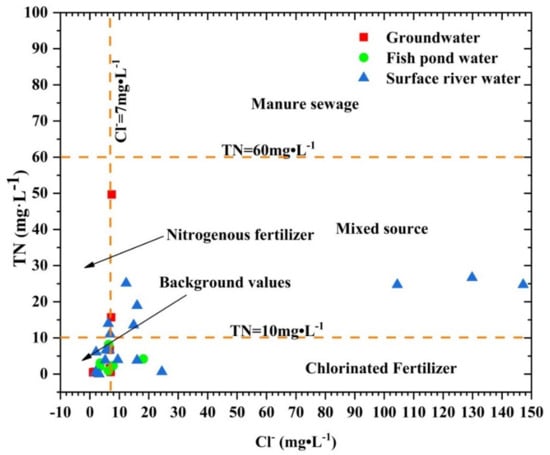
Figure 5.
Relationship between CI- and TN in three kinds of water bodies in the study area.
In order to further identify the source of NO3−, the relationship between δ 15N-NO3~ NO3− and δ 15N-NO3~ δ 18O-NO3 was interpreted [23,41]. It is pointed out that when the water body has the characteristics of high δ 15N-NO3 value and high NO3− concentration, NO3− comes from manure, when there is low δ 15N-NO3 value and high NO3− concentration, NO3− comes from chemical fertilizer, and when there is medium δ 15N-NO3 value and medium NO3− concentration, NO3− comes from domestic sewage [42]. The variation ranges of δ 15N-NO3 and NO3− in different water bodies are large (Figure 6), indicating that they did not have the characteristics of unique sources, and the sources of NO3− in water bodies were complex, which was consistent with the sources of nitrogen interpreted by the characteristics of the concentration of Cl− and TN.
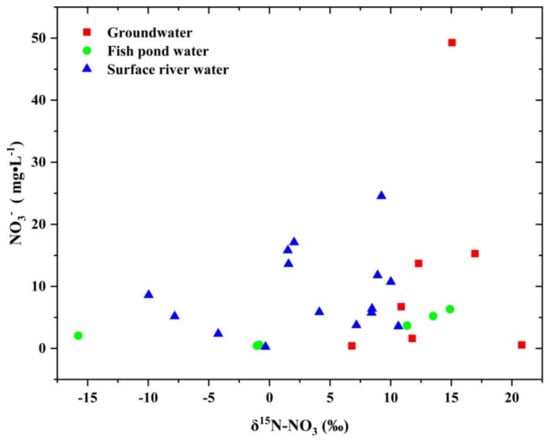
Figure 6.
The relationship between δ 15N-NO3 and NO3−.
The physical, chemical, and biological processes of nitrogen in nature will lead to the fractionation of nitrogen isotopes. The main processes of nitrogen isotope fractionation are ammonia fixation, assimilation, mineralization, nitrification, denitrification, and ammonia volatilization. Among them, the fractionation effects of nitrification, denitrification, and assimilation are obvious, and the fractionation coefficients are between −12 and 29‰, −40–5‰, and −27–0‰, respectively [43,44]. However, the fractionation effects caused by biogeochemical processes of nitrogen and oxygen are also different under different conditions, and the fractionation effects of different forms of nitrogen in the process of assimilation are also different. Conditions such as light and dissolved oxygen can also affect the isotope fractionation effect by affecting biogeochemical reactions [45]. Because of the overlap of δ15N-NO3 value distribution in atmospheric nitrogen deposition and soil, chemical fertilizer, and organic fertilizer, the source of nitrogen cannot be accurately determined by nitrogen isotopes alone. Therefore, the source of nitrogen can be determined more accurately by using δ15 N and δ 18O bistable isotope tracer technique [46]. Previous studies have shown that the δ 15N and δ 18O values of nitrate produced by inorganic chemical fertilizers are −6–+6‰ and +17–+25‰, respectively [47]; the δ 15N and δ 18O values of nitrate produced by animal manure are +5–+25‰ and +5–+7‰, respectively [48]; the δ 15N and δ 18O values of nitrate produced by domestic sewage are +4–+19‰ and −5–+10‰, respectively [49]; the δ 15N and δ 18O values of nitrate produced by organic nitrogen mineralization in soil are 0–+8‰ and −10–+10‰, respectively [50]. According to the relationship between δ 15N-NO3 and δ 18O-NO3, it can be seen from Figure 7 that almost all the groundwater, fish pond water, and surface river water samples in the study area fall within the range of ammonium nitrogen fertilizer, soil nitrogen, and manure sewage, indicating that ammonium nitrogen fertilizer, soil nitrogen, and manure sewage were the main input sources of NO3− in the study area, and the effects of rainfall and nitrate fertilizer were not obvious. In addition, it can also be seen from the distribution areas of different types of water points that groundwater was more distributed in animal manure and domestic sewage areas, fish pond water was more in chemical fertilizer areas, and surface river water was more in soil nitrogen, animal manure, and domestic sewage areas. Generally speaking, the groundwater, fish pond water, and surface river water in the study area were affected by chemical fertilizer, animal manure, and domestic sewage.
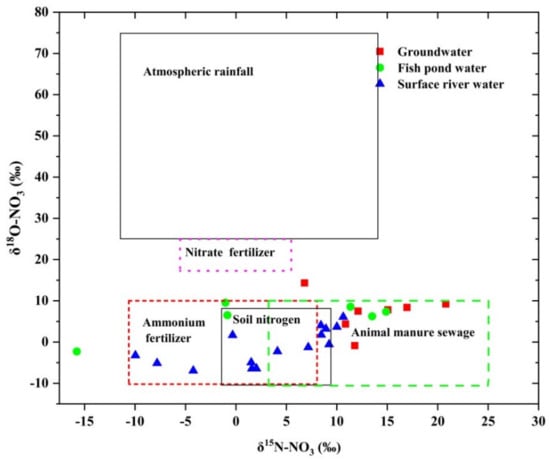
Figure 7.
The relationship between δ 15N-NO3 and δ 18O-NO3 in three kinds of water bodies.
4.2. Conversion Process of Nitrate
4.2.1. Nitrification
The nitrification process is mainly completed by two stages: the first stage is nitrosation that is NH4+ oxidation to NO2− (Equation (3)), and the second stage is nitrification that is NO2− oxidation to NO3− (Equation (4)). Nitrification will lead to an increase in NO3− in groundwater (Equation (5)). In the process of nitrification, nitrifying bacteria absorb NH4+, and release protons (H+) in order to maintain the charge balance, and the pH of groundwater decreases. The acid (H+) produced during nitrification will accelerate the weathering of carbonate rocks (Equation (4)), making more old carbon from carbonate rocks enter into groundwater, resulting in a deviation of δ13CDIC value in groundwater [12]. If nitrification occurs in the karst aquifer, there should be a negative correlation between δ 15N-NO3 and δ 13CDIC and a positive correlation between NO3− and δ 13CDIC in groundwater.
NH4+ + 3/2O2 → NO2− + 2H+ + H2O
NO2− + 1/2O2 → NO3−
CaMg(CO3)2 + 2H+ → 2HCO3− + Ca2+ + Mg2+
There was a significant negative correlation between δ15N-NO3 and δ13CDIC in the three types of water bodies in the study area (Figure 8a), which proved that nitrification was the main controlling factor of the nitrogen cycle in the whole basin. The positive correlation between NO3− and δ13CDIC in the three types of water bodies was not very obvious (Figure 8b), but the overall indication was that nitrification occurred obviously.
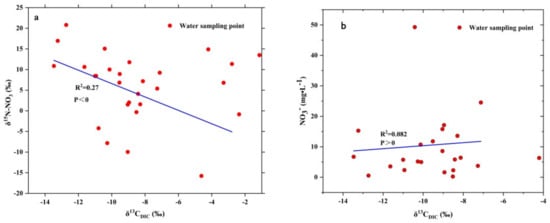
Figure 8.
The relationship between δ 13CDIC and δ 15N-NO3 (a) and NO3− (b) in the water body study area.
In the NO3− produced by nitrification, about 2/3 of the oxygen comes from the surrounding water, and the remaining 1/3 of the oxygen comes from the oxygen dissolved in the water (23.5‰) [12]. Therefore, the nitrification process in water can be indicated by the measured δ 18O-NO3 value [51]:
δ18O − NO3 = 2/3 δ18O − H2O + 1/3 δ18Oair
The δ 18O-NO3 values of most sampling sites in the study area (Figure 7) fall in the range of typical δ 18O-NO3 values produced by nitrification (−10–10%) [12], which shows that nitrification in study area played a leading role in the source of nitrate. Only one point in groundwater has δ 18O-NO3 values greater than 10‰, which may be caused by higher δ 18O-H2O atmospheric precipitation input, isotope fractionation, or denitrification of δ 18O-H2O in the surrounding water during nitrification.
4.2.2. Denitrification
The process of denitrification causes significant isotope fractionation, which leads to the enrichment of heavy δ 15N-NO3 and δ 18O-NO3 in groundwater residues. The ratio of δ 15N-NO3 to δ 18O-NO3 is usually between 1.3 and 2.1 [52,53,54]. As can be seen from Figure 9, only two spots in all samples were within the range of denitrification and the fitting formula of δ 15N-NO3 and δ 18O-NO3 was y = 0.857x + 3.26. In addition, it is generally believed that denitrification will occur when the concentration of DO is less than 2 mg·L−1 [44], while the range of DO of each sampling in the study area was 2.24~14.80 mg·L−1, and the average value was greater than 6 mg·L−1. It was an aerobic environment, which also showed that significant denitrification does not easily occur. It showed that nitrification is the dominant process of the whole study area.
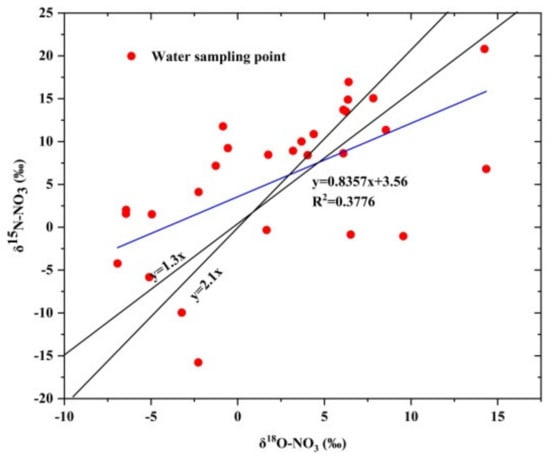
Figure 9.
The relationship between δ 15N-NO3 and δ18O-NO3 in the water body of the study area.
4.3. Quantitative Analysis of Nitrate Sources
The previous analysis showed that nitrification dominated the nitrogen cycle in the water body, and denitrification was not obvious. The analysis confirmed that the main pollution of wetland water nitrate came from ammonia fertilizer, soil nitrogen, animal manure, and domestic sewage. The stable isotope analysis in R model can be used to quantitatively analyze the contribution ratio of different NO3− inputs in the water body. Combined with the hydrogeological conditions and human activities in the study area, the typical isotopic values of ammonium nitrogen fertilizer, soil nitrogen, and manure sewage were taken from the literature [5], and the fractionation factor Cjk was taken as 0.
According to the calculation results of stable isotope analysis in R model (Figure 10), the order of the contribution of different pollution sources to NO3− in the study area was manure sewage > ammonium nitrogen fertilizer > soil nitrogen, the average contribution rate of animal manure and domestic sewage was (39.8 ± 6.4)%, the average contribution rate of ammonia fertilizer was (33.4 ± 5.1)%, while soil nitrogen was relatively low, the average contribution rate was (26.8 ± 3.9)%. The main reason was that the Huixian wetland mainly consisted of cultivated land, mainly vegetable cultivation and aquaculture, producing a large amount of excess fertilizer and manure, which flowed into the surrounding surface water through rainfall and seeped into the ground through leaching; thus affecting the quality of surface water and groundwater.
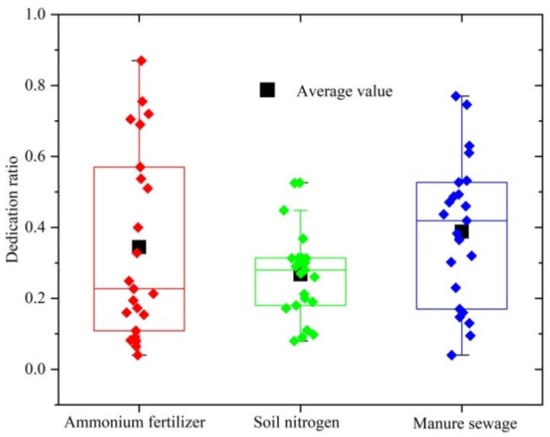
Figure 10.
The contribution ratio of three types of pollution sources to water bodies in the study area.
5. Conclusions
- The maximum concentration of NO3− and NH4+ in groundwater exceeded the limit standard by 2.5 and 1.2 times, the maximum concentration of NH4+ in fish pond water exceeded the limit by 16.3 times, and the maximum concentration of NO3−, NO2−, and NH4+ in surface river water exceeded the limit standard 1.2, 7.3, and 17.3 times, respectively. It showed that groundwater, fish pond, and surface river water were polluted by nitrogen to varying degrees. The δ 15N-NO3 values in the water bodies of the study area ranged from −15.7 to 20.8‰, with an average of 5‰; the δ 18O-NO3 values ranged from −6.9 to 14.3‰, with an average of 1.7‰; the δ 13CDIC values ranged from −13.5 to 0.1‰, with an average of −8.3‰.The concentrations of Cl− and TN in some samples of three kinds of water bodies in the study area were higher than 7 and 10 mg·L−1, respectively, indicating that the three types of bodies in the study area were affected by human activities. It suggested ammonium nitrogen fertilizer, soil nitrogen, and manure sewage were the main input sources of NO3− in the study area by the relationship of Cl−~ TN, the relationship of δ 15N-NO3~ NO3−, and the relationship of δ 15N-NO3~δ 18O-NO3.
- The significant negative correlation between δ15N-NO3 and δ13CDIC proved that nitrification was the main controlling factor of the nitrogen cycle in the study area. Meanwhile, the δ 18O-NO3 values of most sampling sites in the study area fall in the range of typical δ 18O-NO3 values produced by nitrification (−10–10%), which also showed that nitrification played a leading role in the source of nitrate. Only two points in groundwater have δ 18O-NO3 values greater than 10‰, which may be caused by higher δ 18O-H2O atmospheric precipitation input, isotope fractionation, or denitrification of δ 18O-H2O in the surrounding water during nitrification. In addition, the range of dissolved oxygen at each sampling point in the study area was 2.3~14.8 mg·L−1, and the average value was greater than 6 mg·L−1. It was an aerobic environment. Therefore, nitrification mainly occurred in the process of nitrate conversion in the study area, and significant denitrification did not occur.
- The order of the contribution of NO3− sources to the water body in the study area: the contribution rate of manure and sewage was (39.8 ± 6.4)%, the contribution rate of ammonium nitrogen fertilizer was (33.4 ± 5.1)%, and the contribution rate of soil nitrogen was (26.8 ± 3.9)%. In the prevention and control of nitrogen pollution in Huixian wetland, we should focus on three kinds of pollution sources: manure sewage, ammonium nitrogen fertilizer, and soil nitrogen, and reduce the discharge of fecal sewage and apply fertilizer scientifically and quantitatively, so as to reduce the supply of nitrogen sources in wetlands in the study area and cause good results for the control of nitrogen pollution in the study area.
Author Contributions
Z.J. and H.Z.: Conceptualization, reviewing and editing the manuscript, supervision; H.L.: writing the original draft of the manuscript, visualization; X.Q.: analyzing the hydro-chemical data and multi-isotopes data; Q.H.: plotting the figures and funding acquisition. All authors have read and agreed to the published version of the manuscript.
Funding
This work was supported by the Key Research and Development Program of Nation (2019YFC0507502), the Key Projects of Guangxi (300021000001804022), the Key Projects of Guangxi Natural Science Foundation (No. 2018GXNSFDA281036), and the China Geological Survey’s Project (DD20190343).
Institutional Review Board Statement
Not applicable.
Informed Consent Statement
Not applicable.
Data Availability Statement
Not applicable.
Acknowledgments
The authors are thankful to Karst Geological Resources and Environmental Supervision and Testing Center of the Ministry of Natural Resources for all their support and encouragement. Thanks to the staff of the Institute of Agricultural Environment and Sustainable Development for stable isotope analysis.
Conflicts of Interest
The authors declare no conflict of interest.
References
- Yan, C.P.; Ma, Y.J. Research progress on impact of human industrial activities on wetland environment. J. Wetland Sci. 2010, 8, 94–98. (In Chinese) [Google Scholar] [CrossRef]
- Zhao, N.F.; Li, R.F.; Hu, C.H. Spatial and temporal variability and sources of nitrate in surface water in poyang lake. Environ. Sci. Technol. 2014, 37, 93–98. (In Chinese) [Google Scholar] [CrossRef]
- Wang, J.Z.; Gu, B.H.; Ewe, S.M.L.; Wang, Y.; Li, Y.C. Stable isotope compositions of aquatic flora as indicators of wetland eutrophication. Ecol. Eng. 2015, 83, 13–18. [Google Scholar] [CrossRef]
- Liang, H.Y.; Zhai, D.Q.; Kong, X.L.; Yuan, R.Q.; Wang, S.Q. Sources, migration and transformation of nitrate in Fuhe River and Baiyangdian Lake, China. J. Chin. J. Eco-Agric. 2017, 25, 1236–1244. (In Chinese) [Google Scholar] [CrossRef]
- Zhang, Y.; Shi, P.; Li, F.; Wei, A.; Song, J.; Ma, J. Quantification of nitrate sources and fates in rivers in an irrigated agricultural area using environmental isotopes and a Bayesian isotope mixing model. Chemosphere 2018, 208, 493–501. [Google Scholar] [CrossRef]
- Négrel, P.; Pauwels, H. Interaction between Different Groundwaters in Brittany Catchments (France): Characterizing Multiple Sources through Strontium- and Sulphur Isotope Tracing. Water Air Soil Pollut. 2004, 151, 261–285. [Google Scholar] [CrossRef]
- Yang, P.; Li, Y.; Groves, C.; Hong, A. Coupled hydrogeochemical evaluation of a vulnerable karst aquifer impacted by septic effluent in a protected natural area. Sci. Total Environ. 2019, 658, 1475–1484. [Google Scholar] [CrossRef]
- Yue, F.J.; Waldron, S.; Li, S.L.; Wang, Z.J.; Zeng, J. Land us interacts with changes in catchment hydrology to generate chronic nitrate pollution in karst waters and strong seasonality in excess nitrate export. J. Sci. Total Environ. 2019, 696, 134062. [Google Scholar] [CrossRef]
- Chen, Y.D.; Cheng, Y.P.; Jiang, Y.P.; Lin, P.; Jiang, L.Z. Limitation of denitrification in karst subterranean river: A car-bonate-conduit experimental study. J. Acta Sci. Circumstantiae 2016, 36, 3629–3635. (In Chinese) [Google Scholar] [CrossRef]
- Stoewer, M.M.; Knöller, K.; Stumpp, C. Tracing freshwater nitrate sources in pre-alpine groundwater catchments using environmental tracers. J. Hydrol. 2015, 524, 753–767. [Google Scholar] [CrossRef]
- Parnell, A.C.; Inger, R.; Bearhop, S.; Jackson, A.L.; Rands, S. Source Partitioning Using Stable Isotopes: Coping with Too Much Variation. PLoS ONE 2010, 5, e9672. [Google Scholar] [CrossRef] [PubMed]
- Kendall, C. Tracing nitrogen sources and cycling in catchments. Isot. Tracers Catchment Hydrol. 1998, 1, 519–576. [Google Scholar]
- Minet, E.P.; Goodhue, R.; Meier-Augenstein, W.; Kalin, R.M.; Fenton, O.; Richards, K.G.; Coxon, C.E. Combining stable isotopes with contamination indicators: A method for improved investigation of nitrate sources and dynamics in aquifers with mixed nitrogen inputs. Water Res. 2017, 124, 85–96. [Google Scholar] [CrossRef] [PubMed] [Green Version]
- Matiatos, I. Nitrate source identification in groundwater of multiple land-use areas by combining isotopes and multivariate statistical analysis: A case study of Asopos basin. Sci. Total Environ. 2016, 541, 802–814. [Google Scholar] [CrossRef] [PubMed]
- Kendall, C.; Silva, S.R.; Chang, C.C.Y.; Bums, D.A.; Campbell, D.H.; Shanley, J.B. Use of the δ18O and δ15O of nitrate to de-termine sources of nitrate in early spring runoff in forested catchments. Isot. Water Resour. Manag. 1996, 1, 167–176. [Google Scholar]
- Husic, A.; Fox, J.; Mahoney, T.; Gerlitz, M.; Pollock, E.; Backus, J. Optimal Transport for Assessing Nitrate Source-Pathway Connectivity. Water Resour. Res. 2020, 56, e2020WR027446. [Google Scholar] [CrossRef]
- Kendall, C.; Campbell, D.H.; Bums, D.A.; Shanley, J.B.; Silva, S.R.; Chang, C.C.Y. Tracing sources of nitrate in snowmelt runoff using the oxygen and nitrogen isotopic compositions of nitrate. In Biogeochemistry of Seasonally Snow-Covered Catchments Proceedings of a Boulder Symposium; IAHS Publication: Wallingford, UK, 1995; Volume 228, pp. 339–347. [Google Scholar]
- Kendall, C.; Young, M.B.; Silva, S.R. Applications of Stable Isotopes for Regional to National-Scale Water Quality and Environmental Monitoring Programs. In Isoscapes; West, J., Bowen, G., Dawson, T., Tu, K., Eds.; Springer: Dordrecht, The Netherlands, 2010. [Google Scholar] [CrossRef]
- Kendall, C.; Elliott, E.M.; Wankel, S.D. Tracing Anthropogenic Inputs of Nitrogen to Ecosystems. In Stable Isotopes in Ecology and Environmental Science, 2nd ed.; Michener, R.H., Lajtha, K., Eds.; Blackwell Publishing: Malden, MA, USA, 2007; Chapter 12; pp. 375–449. [Google Scholar]
- Jiang, Y.J. The contribution of human activities to dissolved inorganic carbon fluxes in a karst underground river system: Evidence from major elements and δ13CDIC in Nandong, Southwest China. J. Contam. Hydrol. 2013, 152, 1–11. [Google Scholar] [CrossRef]
- Yue, F.-J.; Li, S.-L.; Liu, C.-Q.; Zhao, Z.-Q.; Hu, J. Using dual isotopes to evaluate sources and transformation of nitrogen in the Liao River, northeast China. Appl. Geochem. 2013, 36, 1–9. [Google Scholar] [CrossRef]
- Zheng, W.B.; Wang, S.Q.; Tan, K.D.; Lei, Y.P. Nitrate accumulation and leaching potential is controlled by land-use and extreme precipitation in a headwater catchment in the North China Plain. Sci. Total Environ. 2019, 707, 136168. [Google Scholar] [CrossRef]
- Kong, X.L.; Wang, S.Q.; Ding, F.; Liang, H.Y. Source of nitrate in surface water and shallow groundwater around Bai-yangdian lake area based on hydrochemical and stable isotopes. Environ. Sci. 2018, 39, 2624–2631. (In Chinese) [Google Scholar] [CrossRef]
- Duan, S.-H.; Jiang, Y.-J.; Zhang, Y.-Z.; Zeng, Z.; Wang, Z.-X.; Wu, W.; Peng, X.-Y.; Liu, J.-C. Sources of Nitrate in Groundwater and Its Environmental Effects in Karst Trough Valleys: A Case Study of an Underground River System in the Longfeng Trough Valley, Chongqing. Environ. Sci. 2019, 40, 1715–1725. [Google Scholar]
- Wu, W.Y.; He, X.J.; Wu, H.L.; Wang, X.Z.; Shen, J. Identification of sources of nitrate in the Yongan river with isotopic technology. J. Ecol. Rural. Environ. 2016, 32, 802–807. (In Chinese) [Google Scholar] [CrossRef]
- Lu, L.; Cheng, H.G.; Pu, X.; Liu, X.L.; Cheng, Q.D. Nitrate behaviors and source apportionment in an aquatic system from a watershed with intensive agricultural activities. Environ. Sci. Process. Impacts 2014, 17, 131–144. [Google Scholar] [CrossRef]
- Ryu, H.-D.; Kim, M.-S.; Chung, E.G.; Baek, U.-I.; Kim, S.-J.; Kim, D.-W.; Kim, Y.S.; Lee, J.-K. Assessment and identification of nitrogen pollution sources in the Cheongmi River with intensive livestock farming areas, Korea. Environ. Sci. Pollut. Res. 2018, 25, 13499–13510. [Google Scholar] [CrossRef] [PubMed]
- Peng, C.; Pan, X.-D.; Jiao, Y.-J.; Ren, K.; Zeng, J. Identification of Nitrate Pollution Sources Through Various Isotopic Methods: A Case Study of the Huixian Wetland. Environ. Sci. 2018, 39, 5410–5417. (In Chinese) [Google Scholar] [CrossRef]
- Li, L.X.; Li, J.C.; Wei, C.M.; Zhou, J.; Zhang, Q.; Liu, H.L.; Wang, J.; Qiao, Z.H. Analysis and evaluation of water quality status in Huixian wetland of Guangxi. J. Guilin Univ. Technol. 2019, 39, 693–699. (In Chinese) [Google Scholar] [CrossRef]
- Wan, Z.P.; Dai, J.F.; Xie, X.L.; Zhang, Z.Y.; Xu, B.L. Spatial-temporal difference analysis on nitrogen and phosphorus emissions in Huixian wetland. People’s Yangtze River 2021, 52, 55–60. (In Chinese) [Google Scholar] [CrossRef]
- Xie, X.L. Temporal and Spatial Distribution Characteristics of Nitrogen and Phosphorus Pollution and Its Impact Factors in Huixian Experimental Area of Guilin City; Guilin University of Technology: Guilin, China, 2020. (In Chinese) [Google Scholar]
- Deng, Y.; Jiang, Z.C.; Xu, Y.; Yue, X.F.; Li, X.Y.; Liang, J.T. Redistribution of precipitation by vegetation and its ecohydro-logical effects in a typical epikarst spring catchment. Carsologica Sin. 2018, 37, 714–721. (In Chinese) [Google Scholar] [CrossRef]
- Casciotti, K.L.; Sigman, D.M.; Hastings, M.G.; Bohlke, J.K.; Hilkert, A. Measurement of the oxygen isotopic composition of nitrate in seawater and freshwater using the denitrifier method. Anal. Chem. 2002, 74, 4905–4912. [Google Scholar] [CrossRef]
- Revesz, K.; Casciotti, K. Determination of the δ(15N/14N) and δ(18O/16O) of nitrate in water: RSIL. lab code 2900. In Methods of the Reston Stable Isotope Laboratory; Revde, K., Coplen, T.B., Eds.; Geological Survey: Reston, VA, USA, 2007; pp. 24–25. [Google Scholar]
- Zang, H.F. Hydrogeochemical Characteristics and Evolution Rules of Karst Groundwater in the Liulin Spring Area; Taiyuan University of Technology: Taiyuan, China, 2015. (In Chinese) [Google Scholar]
- Li, X.Z.; Wu, X.Q.; Pang, Y.F.; Qin, Z.F.; Yang, S.L.; Wu, M.Y. Assessment of pollutants on aquiculture environment in freshwater ponds in Guangxi. Guangxi Agric. Sci. 2010, 41, 987–990. (In Chinese) [Google Scholar]
- Panno, S.V.; Hackley, K.C.; Hwang, H.H.; Greenberg, S.E.; Krapac, I.G.; Landsberger, S.; O’Kelly, D.J. Characterization and Identification of Na-Cl Sources in Ground Water. Ground Water 2006, 44, 176–187. [Google Scholar] [CrossRef] [PubMed]
- Panno, S.V.; Kelly, W.R.; Martinsek, A.T.; Hackley, K.C. Estimating Background and Threshold Nitrate Concentrations Using Probability Graphs. Groundwater 2006, 44, 697–709. [Google Scholar] [CrossRef] [PubMed]
- Zhang, Y.; Kelly, W.R.; Panno, S.V.; Liu, W.-T. Tracing fecal pollution sources in karst groundwater by Bacteroidales genetic biomarkers, bacterial indicators, and environmental variables. Sci. Total Environ. 2014, 490, 1082–1090. [Google Scholar] [CrossRef] [PubMed]
- Ren, K.; Pan, X.D.; Liang, J.P.; Peng, C.; Zeng, J. Sources and fate of nitrate in groundwater in a typical karst basin: Insights from carbon, nitrogen, and oxygen isotopes. Environ. Sci. 2021, 42, 2268–2275. [Google Scholar] [CrossRef]
- Yin, C.; Yang, H.Q.; Chen, J.A.; Guo, J.Y.; Wang, J.F.; Zhang, Z.; Tang, X.Y. Tracing nitrate sources with dual isotopes and hydrochemical characteristics during wet season in Lake Caohai, Guizhou Province. Lake Sci. 2020, 32, 989–998. (In Chinese) [Google Scholar] [CrossRef]
- He, G.P.; Liu, P.B.; Mu, X.; Wu, Q.; Liu, M.Z. Identification of nitrate sources in groundwater in the Yongding River alluvial fan with isotope technology. Shuili Xuebao 2016, 47, 582–588. (In Chinese) [Google Scholar] [CrossRef]
- Li, S.L.; Liu, C.Q.; Xiao, H.Y. Microbial effect on nitrogen cycle and nitrogen isotope fractionation on the earth’s surface—A review. Geol. Geochem. 2002, 30, 40–45. [Google Scholar]
- Chen, F.J.; Li, X.H.; Jia, G.D. The application of nitrogen and oxygen isotopes in the study of nitrate in rivers. Adv. Earth Sci. 2007, 22, 1251–1257. [Google Scholar]
- Yu, Z.M. Effect of different nitrogen pools on nitrogen isotopic fractionation during the uptake by marine microalgae. Oceanol. Etlimnologia Sin. 2004, 35, 524–529. [Google Scholar]
- Silva, S.R.; Kendall, C.; Wilkison, D.H. A new method for collection of nitrate from fresh water and the analysis of nitrogen and oxygen isotope ratios. J. Hydrol. 2000, 228, 22–36. [Google Scholar] [CrossRef]
- Moore, J.W.; Semmens, B.X. Incorporating uncertainty and prior information into stable isotope mixing models. Ecol. Lett. 2008, 11, 470–480. [Google Scholar] [CrossRef] [PubMed]
- Freyer, H.D. Seasonal variation of 15N/14N ratios in atmospheric nitrate species. Tellus B Chem. Phys. Meteorol. 1991, 43, 30–44. [Google Scholar] [CrossRef]
- Heaton, T.H.E. Isotopic studies of nitrogen pollution in the hydrosphere and atmosphere: A review. Chem. Geol. Isot. Geosci. Sect. 1986, 59, 87–102. [Google Scholar] [CrossRef]
- Mayer, B.; Boyer, E.W.; Goodale, C.; Jaworski, N.A.; Breemen, N.V.; Howarth, R.W.; Seitzinger, S.P.; Billen, G.; Lajtha, K.; Nadelhoffer, K.J.; et al. Sources of nitrate in rivers draining sixteen watersheds in the northeastern U.S: Isotopic constraints. J. Biogeochem. 2002, 57/58, 171–197. [Google Scholar] [CrossRef]
- Lu, L.; Dai, E.F.; Cheng, Q.D.; Wu, Z.Z. The sources and fate of nitrogen in groundwater under different land use types: Stable isotope combined with a hydrochemical approach. Acta Geogr. Sin. 2019, 74, 1878–1889. (In Chinese) [Google Scholar]
- Xue, D.; Botte, J.; De Baets, B.; Accoe, F.; Nestler, A.; Taylor, P.; Van Cleemput, O.; Berglund, M.; Boeckx, P. Present limitations and future prospects of stable isotope methods for nitrate source identification in surface- and groundwater. Water Res. 2009, 43, 1159–1170. [Google Scholar] [CrossRef] [PubMed]
- Clague, J.C.; Stenger, R.; Clough, T.J. Evaluation of the stable isotope signafures of nitrate to detect denitrfication in a shallow groundwater system in New Zealand. Agric. Ecosyst. Environ. 2015, 202, 188–19754. [Google Scholar] [CrossRef]
- Xue, D.; De Baets, B.; Van Cleemput, O.; Hennessy, C.; Berglund, M.; Boeckx, P. Use of a Bayesian isotope mixing model to estimate proportional contributions of multiple nitrate sources in surface water. Environ. Pollut. 2011, 161, 43–49. [Google Scholar] [CrossRef]
Publisher’s Note: MDPI stays neutral with regard to jurisdictional claims in published maps and institutional affiliations. |
© 2022 by the authors. Licensee MDPI, Basel, Switzerland. This article is an open access article distributed under the terms and conditions of the Creative Commons Attribution (CC BY) license (https://creativecommons.org/licenses/by/4.0/).