Article

A New Low-Cost Technology Based on Pump as Turbines for Energy Recovery in Peripheral Water Networks Branches

by
Armando Carravetta
1,†,
Giuseppe Del Giudice
1,†,
Oreste Fecarotta
1,*,†,
Maria Cristina Morani
1,† and
Helena M. Ramos
2,†
1
Dipartimento di Ingegneria Civile, Edile e Ambientale, Università degli Studi di Napoli, Via Claudio 21, 80125 Napoli, Italy
2
Civil Engineering, Architecture and Georesources Department, CERIS, Instituto Superior Técnico, Universidade de Lisboa, 1049-001 Lisbon, Portugal
*
Author to whom correspondence should be addressed.
These authors contributed equally to this work.
Water 2022, 14(10), 1526; https://doi.org/10.3390/w14101526
Submission received: 7 April 2022 / Revised: 3 May 2022 / Accepted: 5 May 2022 / Published: 10 May 2022

Abstract

:
The recovery of excess energy in water supply networks has been a topic of paramount importance in recent literature. In pressurized systems, a pump used in inverse mode (Pump As Turbine, PAT) demonstrated to be a very economical and reliable solution, compared to traditional energy production devices (EPDs). Due to the large variability of flow rate and head drop within water distribution networks, the operation of PATs could be performed by a series-parallel regulation system based on an electronic or a hydraulic principle. Despite the low cost of the PATs and of regulation and control systems, a great barrier to the diffusion of a small hydro power plant in water distribution is represented by the necessity of additional civil works to host the whole plant. Based on laboratory and numerical experiments, the present paper proposes a new low-cost technology, overcoming most of the limitations of the present technologies when low energy is available and high discharge variation occurs. The operating conditions of the plant are properly optimized with reference to the working conditions of a case study. Despite the laboratory prototype having exhibited a significantly low efficiency (i.e., 16%), due to the use of small centrifugal pumps suitable for the analyzed case study, in larger power plants relying on more efficient semi-axial submersed pumps, the energy conversion ratio can increase up to 40%. The results of this research could be useful for network managers and technicians interested in increasing the energy efficiency of the network and in recovering energy in the peripheral branches of the network were a large variability of small flow rates are present.

1. Introduction

In the recent times, population growth, urbanization, and economic development have increased the demand for energy, water, and food. In the literature, a great number of research and applied research projects has been focused on the water-energy-food nexus stating in a definitive way the importance of energy in the rational use of water [1,2,3]. In the management of water systems, the reduction of energy use represents a key issue determined by the European and global concern for the environmental impact of the industrial activities [4,5]. As an example, the International Standard ISO ASME 14,414 sets the requirements for performing the energy assessment on pumping systems and reporting the results accordingly, in order to properly control the efficiency of systems consuming energy. In addition to the environmental aspect, the containment of the energy use can determine a reduction of the operational costs, since in water supply systems the energy consumption for water pumping represents the main portion of the supply costs [6]. Therefore, a sustainable growth of water systems based on the reduction of energy use can result in important benefits, both economical and environmental [7].
In water distribution systems several strategies have been proposed for achieving a sustainable growth of these systems [8,9], such as: the reduction of water leakages [10,11,12] by pressure management [13]; the replacement of old and buried pipes [14,15], the containment of water leakage [16,17] and the recovery of the embedded energy [18,19]; the introduction of small power plants for energy production [20,21]; the replacement of old pumps with more efficient devices [22,23]. In particular, pressure management is a key strategy for the containment of water leakage and energy use. Given a water network, the pressure can be kept under control by the use of Pressure Reducing Valves (PRVs), located in selected points to dissipate the excess energy [24,25,26]. Moreover, in recent decades, particular attention has been paid to the replacement of such valves with hydro power plants equipped with energy production devices (EPD) [25,27,28], such as turbines or Pump as Turbines (PATs) [29], in order not to dissipate the available excess pressure, but rather convert it in energy [30]. Among the EPDs, PATs are generally preferred over traditional turbines for their lower costs and large availability [31]. Despite this, PAT efficiency at the Best Efficiency Point (BEP) is much variable with pump type, reaching the maximum values around 65–75%, which are lower than the maximum efficiency achieved by traditional turbines [32,33]. To deal with the issue represented by such low efficiency values, Carravetta et al. [34] developed a method, named the Variable Operating Strategy (VOS), which allows for the geometry selection of a PAT for a given flow-head distribution pattern and network back-pressure, ensuring quite high power plant efficiency values (up to 50%).
As highlighted by many authors in the literature [35,36], when a PAT is installed within a hydropower plant, the main difficulty is represented by the need for ensuring a required head drop under variable operating conditions, i.e., head and discharge variations. Plants based on hydraulic (HR) or electrical (ER) regulation have been deeply investigated in the recent literature [37], but these would imply additional plant cost due to the cost of control valves and piping in HR, or of a variable speed drive in ER. In addition to the cost for the regulation and control system, the cost of additional civil works for hosting the hydraulic pump should be also accounted for [31]. In water networks, the hydropower potential at the dissipation nodes does not generally exceed 20 kW and the overall efficiency of hydropower plants is quite limited; thus the costs for civil works need to be properly contained in order to ensure acceptable payback periods of the investment [38]. Indeed, in the peripheral branches of the network, where the flow rates are very low, the recoverable energy can be significantly low, thus the problem of the plant cost becomes compelling [39]. Moreover, it is worth considering that the existing PRVs are generally installed in small manholes located under the street pavement. The increase in the manhole size, as well as the use of waterproof closure to host and protect the electric components, represent a further unmanageable cost. Since specific technologies reducing the incidence of civil costs have not been available up to now, a containment of the plant cost could result from relaxing the constraint on the required head drop, using a stand-alone PAT without regulation [40], or by introducing a simplified HR system based on multiple PATs and more common ON/OFF valves. This paper proposes a new technology, called Energy Booster (EB), with the aim of making hydropower plants more viable and affordable. The new plant consists of two submersible pumps, which are used in inverse mode and encapsulated in a water booster. The booster can be placed under the existing manhole by merely opening a hole under the existing manholes. The proposed solution drastically cuts down the cost of the additional civil works and represents a solution to the technical concerns about the use of electric and electronic components in an unfavorable environment. In the paper, the result of tests on the EB under controlled conditions are discussed, showing that this innovative solution would grant in real life conditions the same efficiency in terms of energy conversion as a traditional PAT-based hydro power plant.

2. Materials and Methods

2.1. Case Study

The case study concerns the design of a hydro power plant in the village of Granville, located in Normandie, France. This site was included between the possible choices for the pilot plants to be realized in the project REDAWN (Reducing Energy Dependency in Atlantic Area Water Networks). The project developed an adequate institutional, social, and technological environment to foster greater resource efficiency in the Atlantic Area (AA) water networks, including:
  • Energy recovery assessment in water networks [41];
  • Analysis of the economic/environmental impact of the PAT technology in the AA [42];
  • Development of design guidelines and tools for hydropower plants in drinking water, wastewater, irrigation and process industry sectors [43,44,45];
  • Development of support tools to enhance the implementation of projects based on energy recovery [46];
  • Assessment of the societal impacts of hydropower energy recovery in the AA water networks [47,48];
  • Widespread dissemination of energy efficiency in the AA water networks [27].
Among the results of the Redawn project, a database of a large number of pumps has been compiled, with the curves of their performance in turbine mode, in order to partially fill the leak of information about pumps operating as turbines.
A reservoir is located at 140 m a.s.l. and supplies water by a 250 mm diameter pipeline to a part of the Granville water distribution network. A PRV is placed in a rectangular manhole, approximately half the way along the pipeline. Full readings of flow rate and pressures, upstream and downstream the PRV were obtained during a week of the project period. In Figure 1, the pressure heads ( H ) upstream and downstream the PRV are reported. In Figure 2, the average daily distribution of flow rate ( Q ) is reported, together with the distribution of minimum and maximum measured values and the standard deviation band from all measurements, as well as the available stream power ( P av ) for energy recovery.
It is worth noting that the hydraulic conditions at the PRV are characterized by very low flow rates, ranging between 0 and 12 L/s, and high head drops, ranging between 60 and 70 m. The same information results from the analysis of Figure 3, where the frequency distribution of discharge ( Q ) (left) and available head drop ( Δ H av ) (right) are reported. According to the first plot of Figure 3, the discharge presents a large dispersion: the lowest values are the most frequent, then the frequency has a little variation in the range between 2 and 6 L/s; finally it decreases for increasing discharge. Conversely, the distribution of the available head drop is quasi symmetrical, with the most frequent value at about 65 m and the majority of values ranging between 60 and 70 m. The second plot of Figure 2 shows that the available stream power is also much variable between 0 and about 7 kW, with a daily average of 2.5 kW.
In Figure 4, the Cumulate Distribution Function (CDF) of the available stream power ( P av ) is plotted, showing that the 50-th percentile of power matches to a value slightly higher than 2 kW, while the maximum power exceeds 7 kW. The plot of Figure 5 shows the Cumulate Distribution Function (CDF) of the available energy, E av , versus the network discharge, Q . The black line represents the ratio between E av ( Q < Q * ) and E tot , being E tot the total available energy and E av ( Q < Q * ) the sum of the energy of all the operating points whose discharge is lower than Q * . The red line is the probability density function (pdf), i.e., the first derivative of the black line. The plot shows that the 5-th percentile of the available energy occurs when the discharge is lower than 1.8 L/s, while the 50-th percentile corresponds to a discharge equal to 6 L/s. The pdf of the available energy presents three peaks for flow rates close to 2.5 , 5.5 , and 9 L/s. Even if three peaks are present, this plot shows that the available energy can be considered quite constantly spread over the whole discharge range. This confirms that the exploiting of the hydro power needs an effective regulation system, able to regulate the plant across the whole discharge range. Nevertheless, the low available energy reduces the revenue of the plant. Thus, the purchasing and installation costs need to be contained, in order to make it profitable.

2.2. Energy Booster Design and PAT Selection

The technical solution was based on several physical and operational constraints, which have been identified by the authors during the case study:
1.
The available power on site is too low for allowing additional costs for civil waterworks;
2.
The working conditions are too severe to operate with electromechanical components directly placed in the existing manhole;
3.
The power plant noise can be an issue for the presence of a close urbanized area;
4.
The flow rate distribution is too wide to operate with a single PAT;
5.
An electric regulation of the plant is not recommended for the motors of submersible pumps used as PATs, in absence of high cost electronic filters;
6.
The cost limitation issue does not allow a full implementation of the hydraulic regulation;
7.
Compared to the available discharge, the head drop is too high to operate with a single stage pump.
Points 1 and 2 can be overcome by the layout of an Energy Booster, using submersible pumps as PATs. The booster can be placed vertically in a hole drilled in the ground beneath the manhole, in the vertical of the manhole closure. Concerning point 3, the booster configuration is already used in pumping stations in order to reduce the acoustic noise of the pumps. Point 4 led to the necessity of operating with two pumps, centered on two different flow rates. Considering point 6, a simplified hydraulic regulation was considered, derived from Carravetta et al. [37]. Finally multistage submersed borehole pumps were chosen according to point 7. The PAT regulation scheme is reported in Figure 6. On a diversion of the main pipeline, three pipe branches operate in parallel. PAT A and PAT B operate on the first two branches and can be disconnected by the ON/OFF valve, while the third branch is a bypass operated by a regulating valve. All three valves are pneumatic and electrically actuated. The hydraulic circuit allows operation with a single PAT by closing the remaining branches, to operate with two PATs in parallel by closing the bypass, or to operate with a fraction of the total flow rate by partially opening the bypass regulating valve. The two PATs were selected with their best efficiency points (BEPs) centered on the energy peaks revealed by Figure 5. The particular shapes in the pdf of Figure 5 show that the sum of the BEP discharges inside the two PATs correspond to about the third energy peak of the diagram. The PATs are 4 " centrifugal multistage submersible pumps used for groundwater extraction. PAT A is a Caprari E4XED30/5+MC405-8 and PAT B is a Caprari E4XED50/6+MCK44-8. These products have a geometrical size limited by the well diameter and are projected to grant high head drops. As in direct mode operation, also in inverse mode operation the efficiency of these centrifugal pumps is quite low. The acceptance tests of the two PATs showed a 0.31 best efficiency for PAT A and 0.32 best efficiency for PAT B. Moving to a larger size of the plant, semiaxial multistage submersible pumps will be used. This kind of pump exhibits a very high efficiency, both in direct and inverse mode operation, compared to surface pumps.
The hydraulic regulation of the hydro power plant will be based on a sequence of operating conditions activated by controlling electrically the ON/OFF and the bypass regulating valve. A specifically designed control unit was realized, shown in Figure 7, allowing all valve operation and storing all the hydraulic (flow rate and pressures) and electric data (power, current, power factor). The control unit consists of a mini computer (Raspberry Pi™), which is connected to a power meter for the acquisition of power data and a specifically designed board, which acquires and converts to digital data the analog signals from the pressure transducers and remotely control the pneumatic valves.
In particular, the possible operating conditions are the following:
1.
PAT A off, PAT B off, bypass open
2.
PAT A on, PAT B off, bypass closed
3.
PAT A on, PAT B off, bypass open
4.
PAT A off, PAT B on, bypass closed
5.
PAT A off, PAT B on, bypass open
6.
PAT A on, PAT B on, bypass closed
7.
PAT A on, PAT B on, bypass open

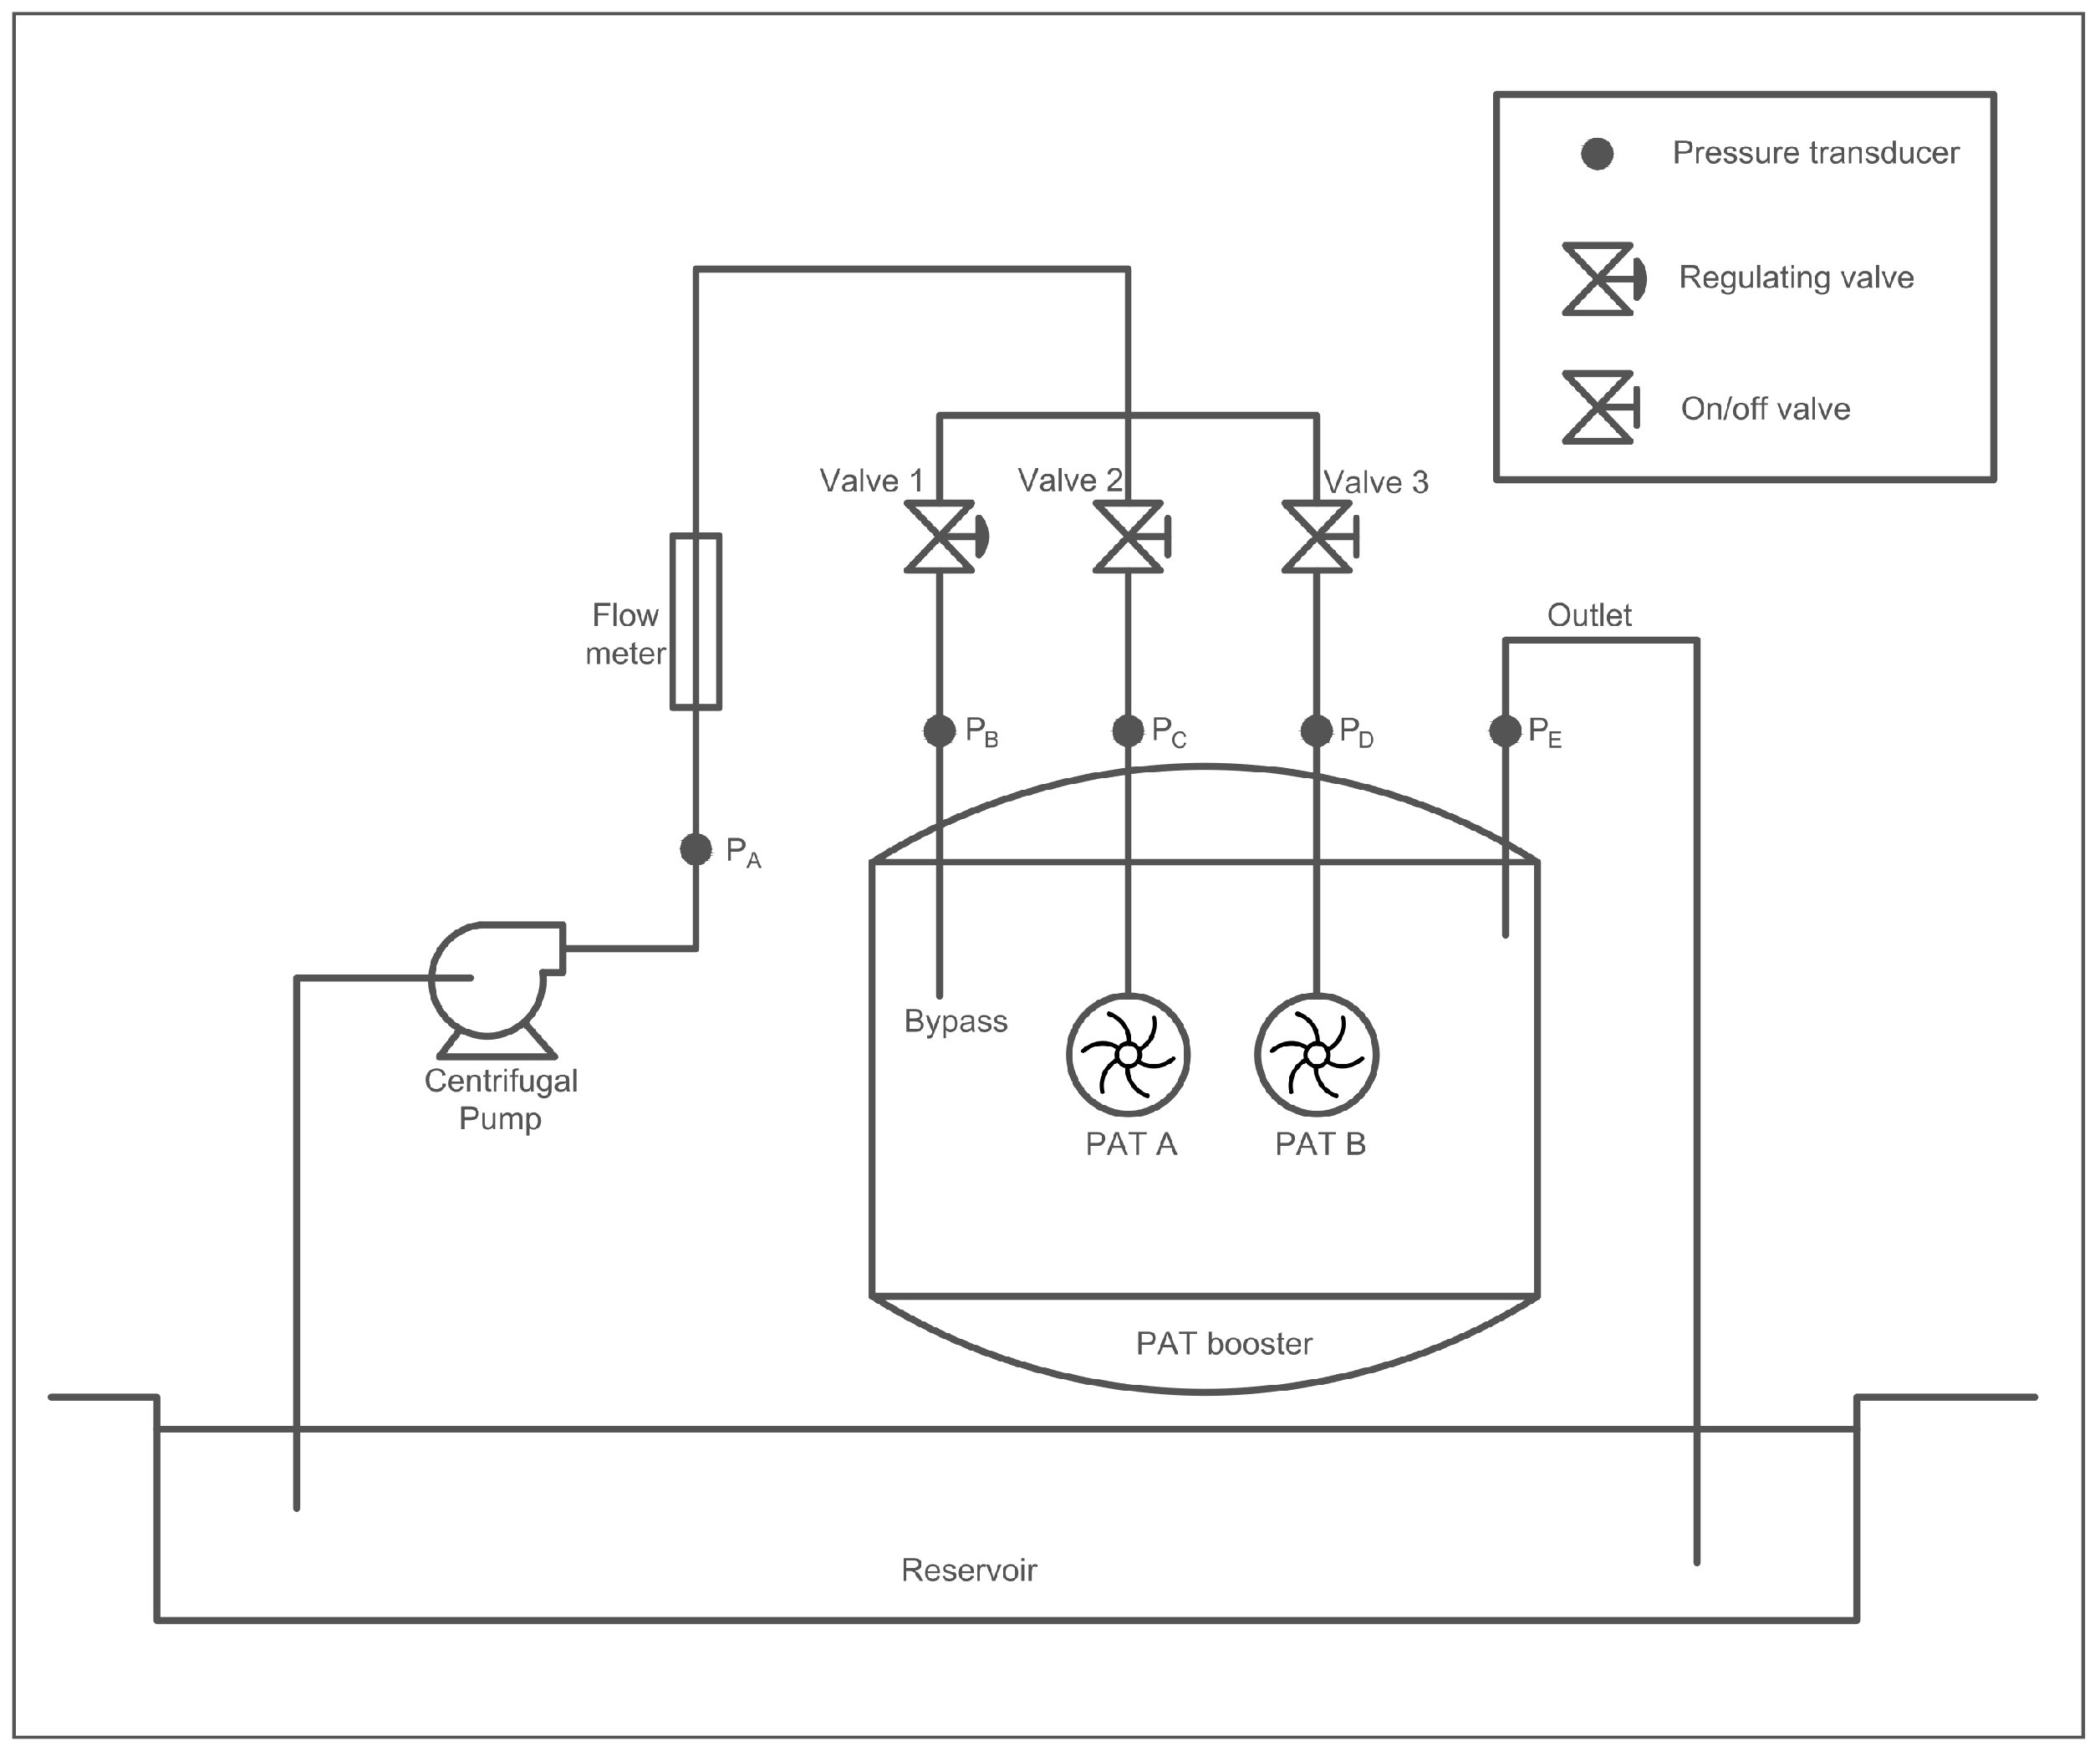
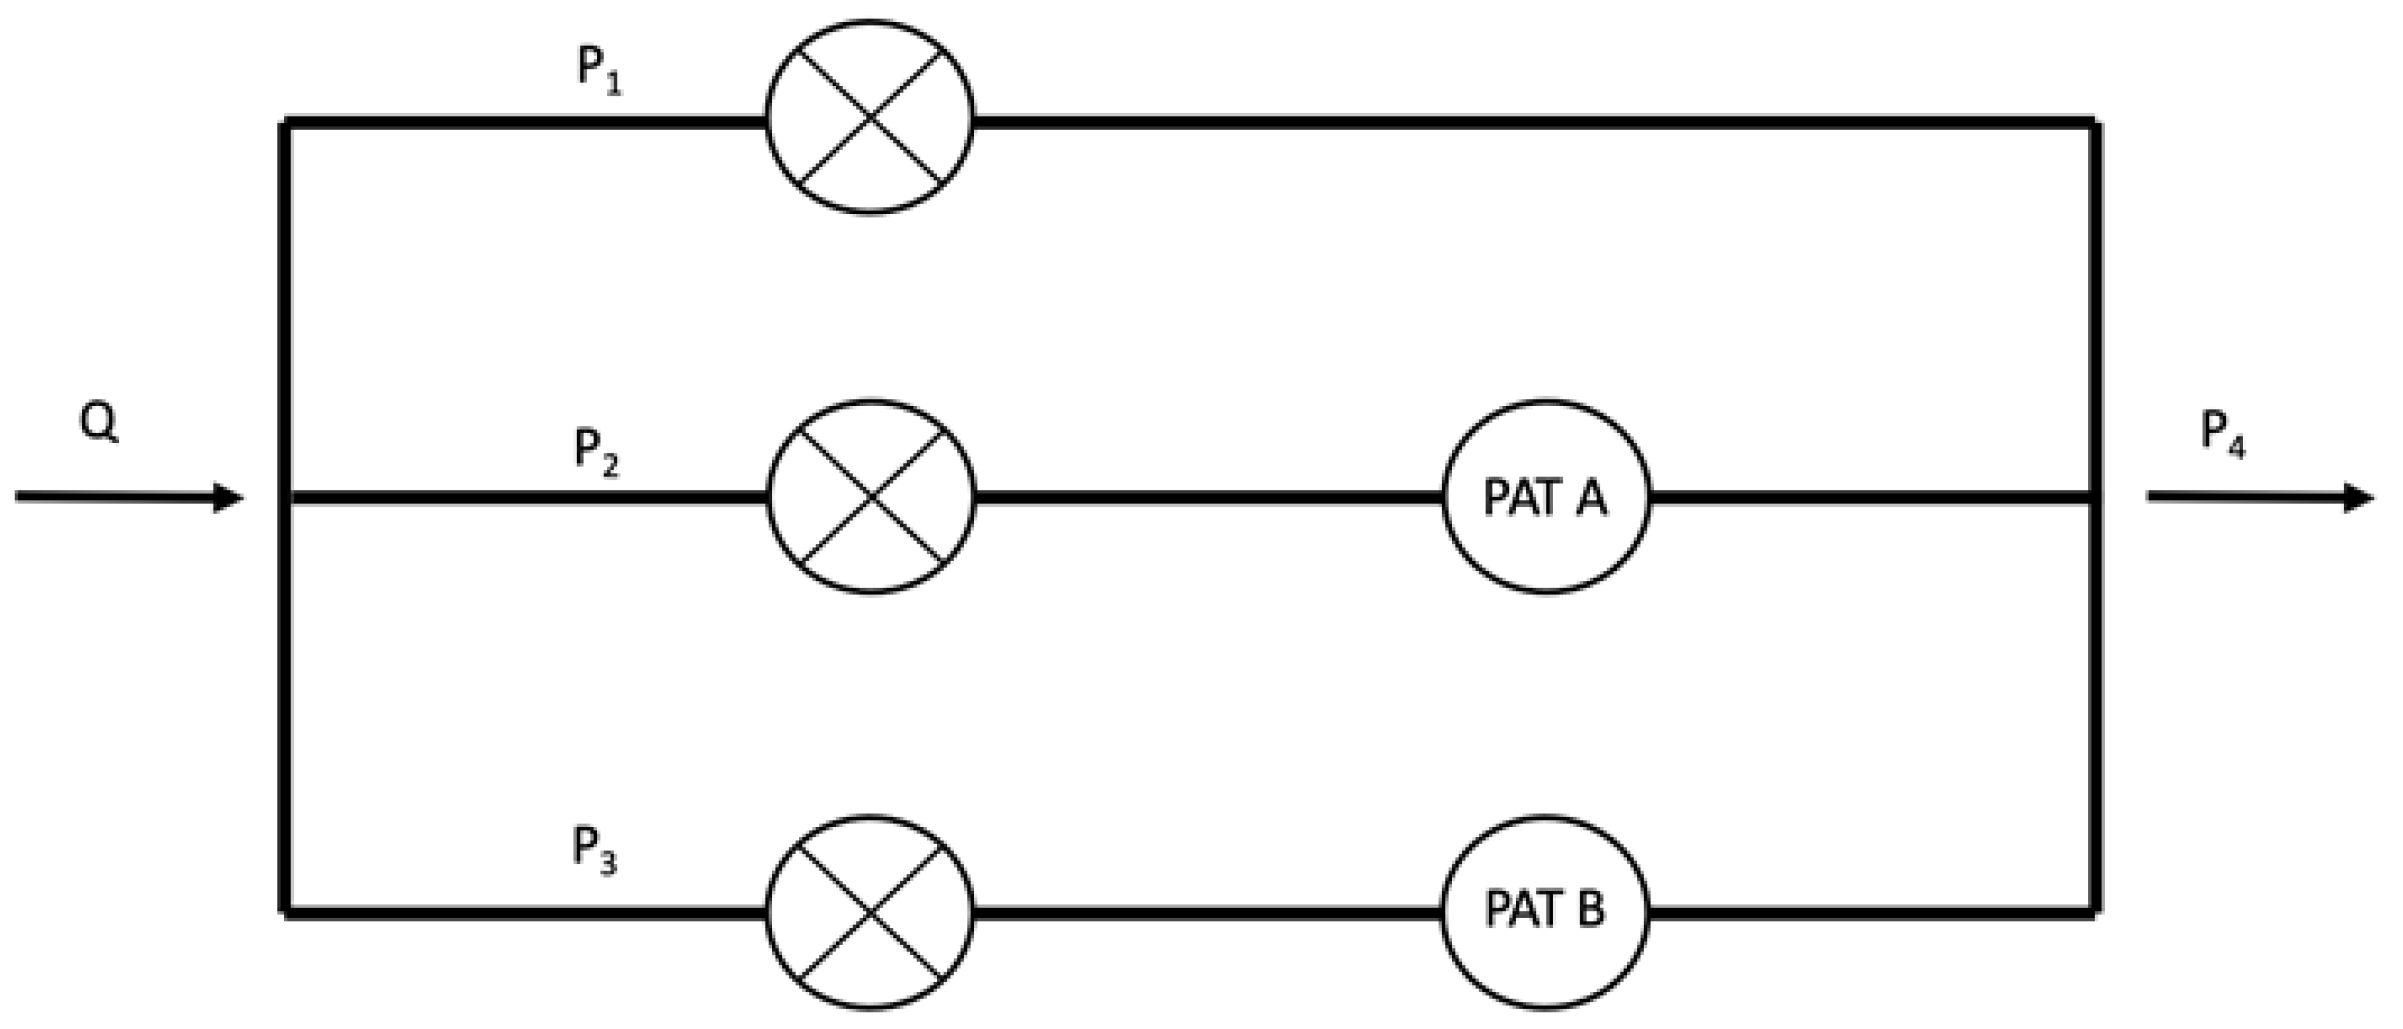
2.3. Design of the Experiments and Test Rig

The booster has been inserted in a hydraulic closed circuit, in the Hydro Energy Lab (HELab) of the University of Naples “Federico II”. The lab is equipped with a submersed water reservoir. A scheme of the test rig is shown in Figure 8, while a picture of the lab is shown in Figure 9.
A centrifugal pump was used to pump the water from the reservoir through the PAT booster. Then, at the outlet, the water is recirculated to the submersed reservoir. The pump is equipped with a speed driver, to control the flow rate. Five pressure transducers are used to monitor the pressure along the circuit: one downstream the pump ( P A ) and one for each branch of the booster (upstream the bypass— P B , upstream the PAT A— P C , upstream the PAT B— P D , outlet— P E ). A digital power meter is used to measure the power absorbed or produced by the two PATs, while a magnetic flow meter is used to measure the flowing discharge.
The system has been tested in four configurations:
1.
PAT A on, PAT B off, Valve 2 open, Valves 1 and 3 closed
2.
PAT A off, PAT B on, Valve 3 open, Valves 1 and 2 closed
3.
PAT A on, PAT B on, Valves 2 and 3 open, Valve 1 closed
4.
PAT A off, PAT B off, Valves 2 and 3 closed, Valve 1 open

3. Results

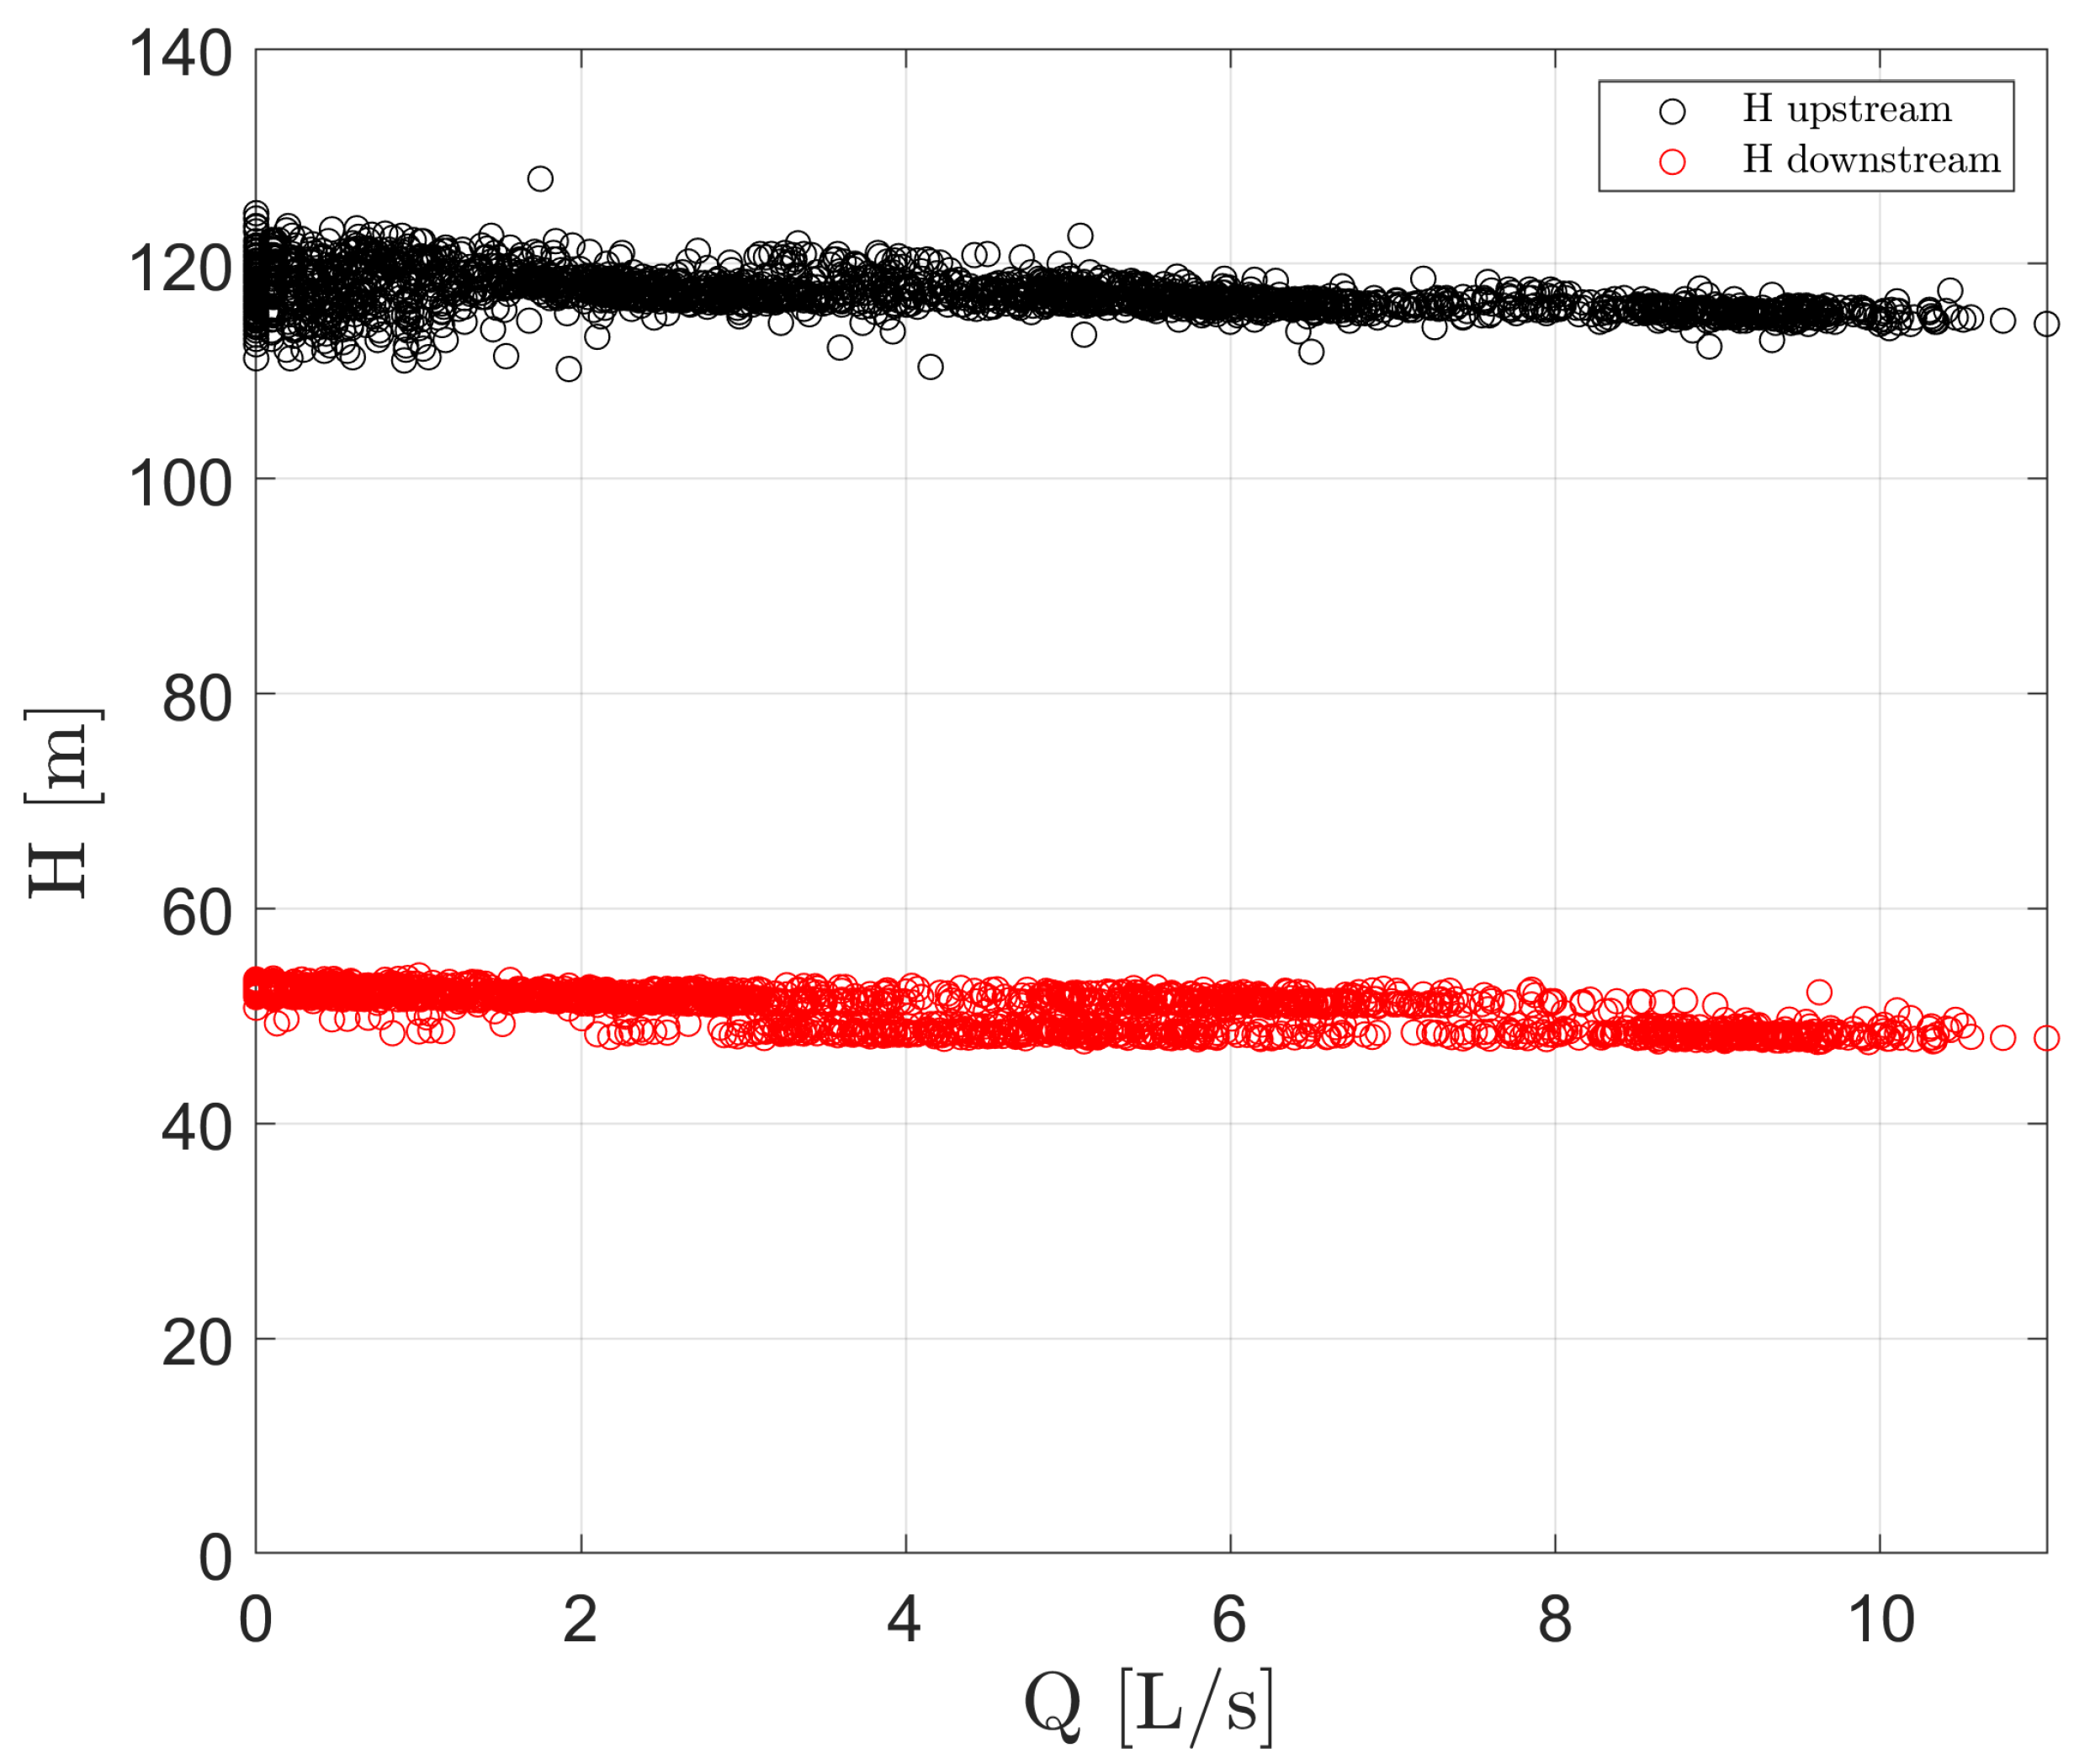
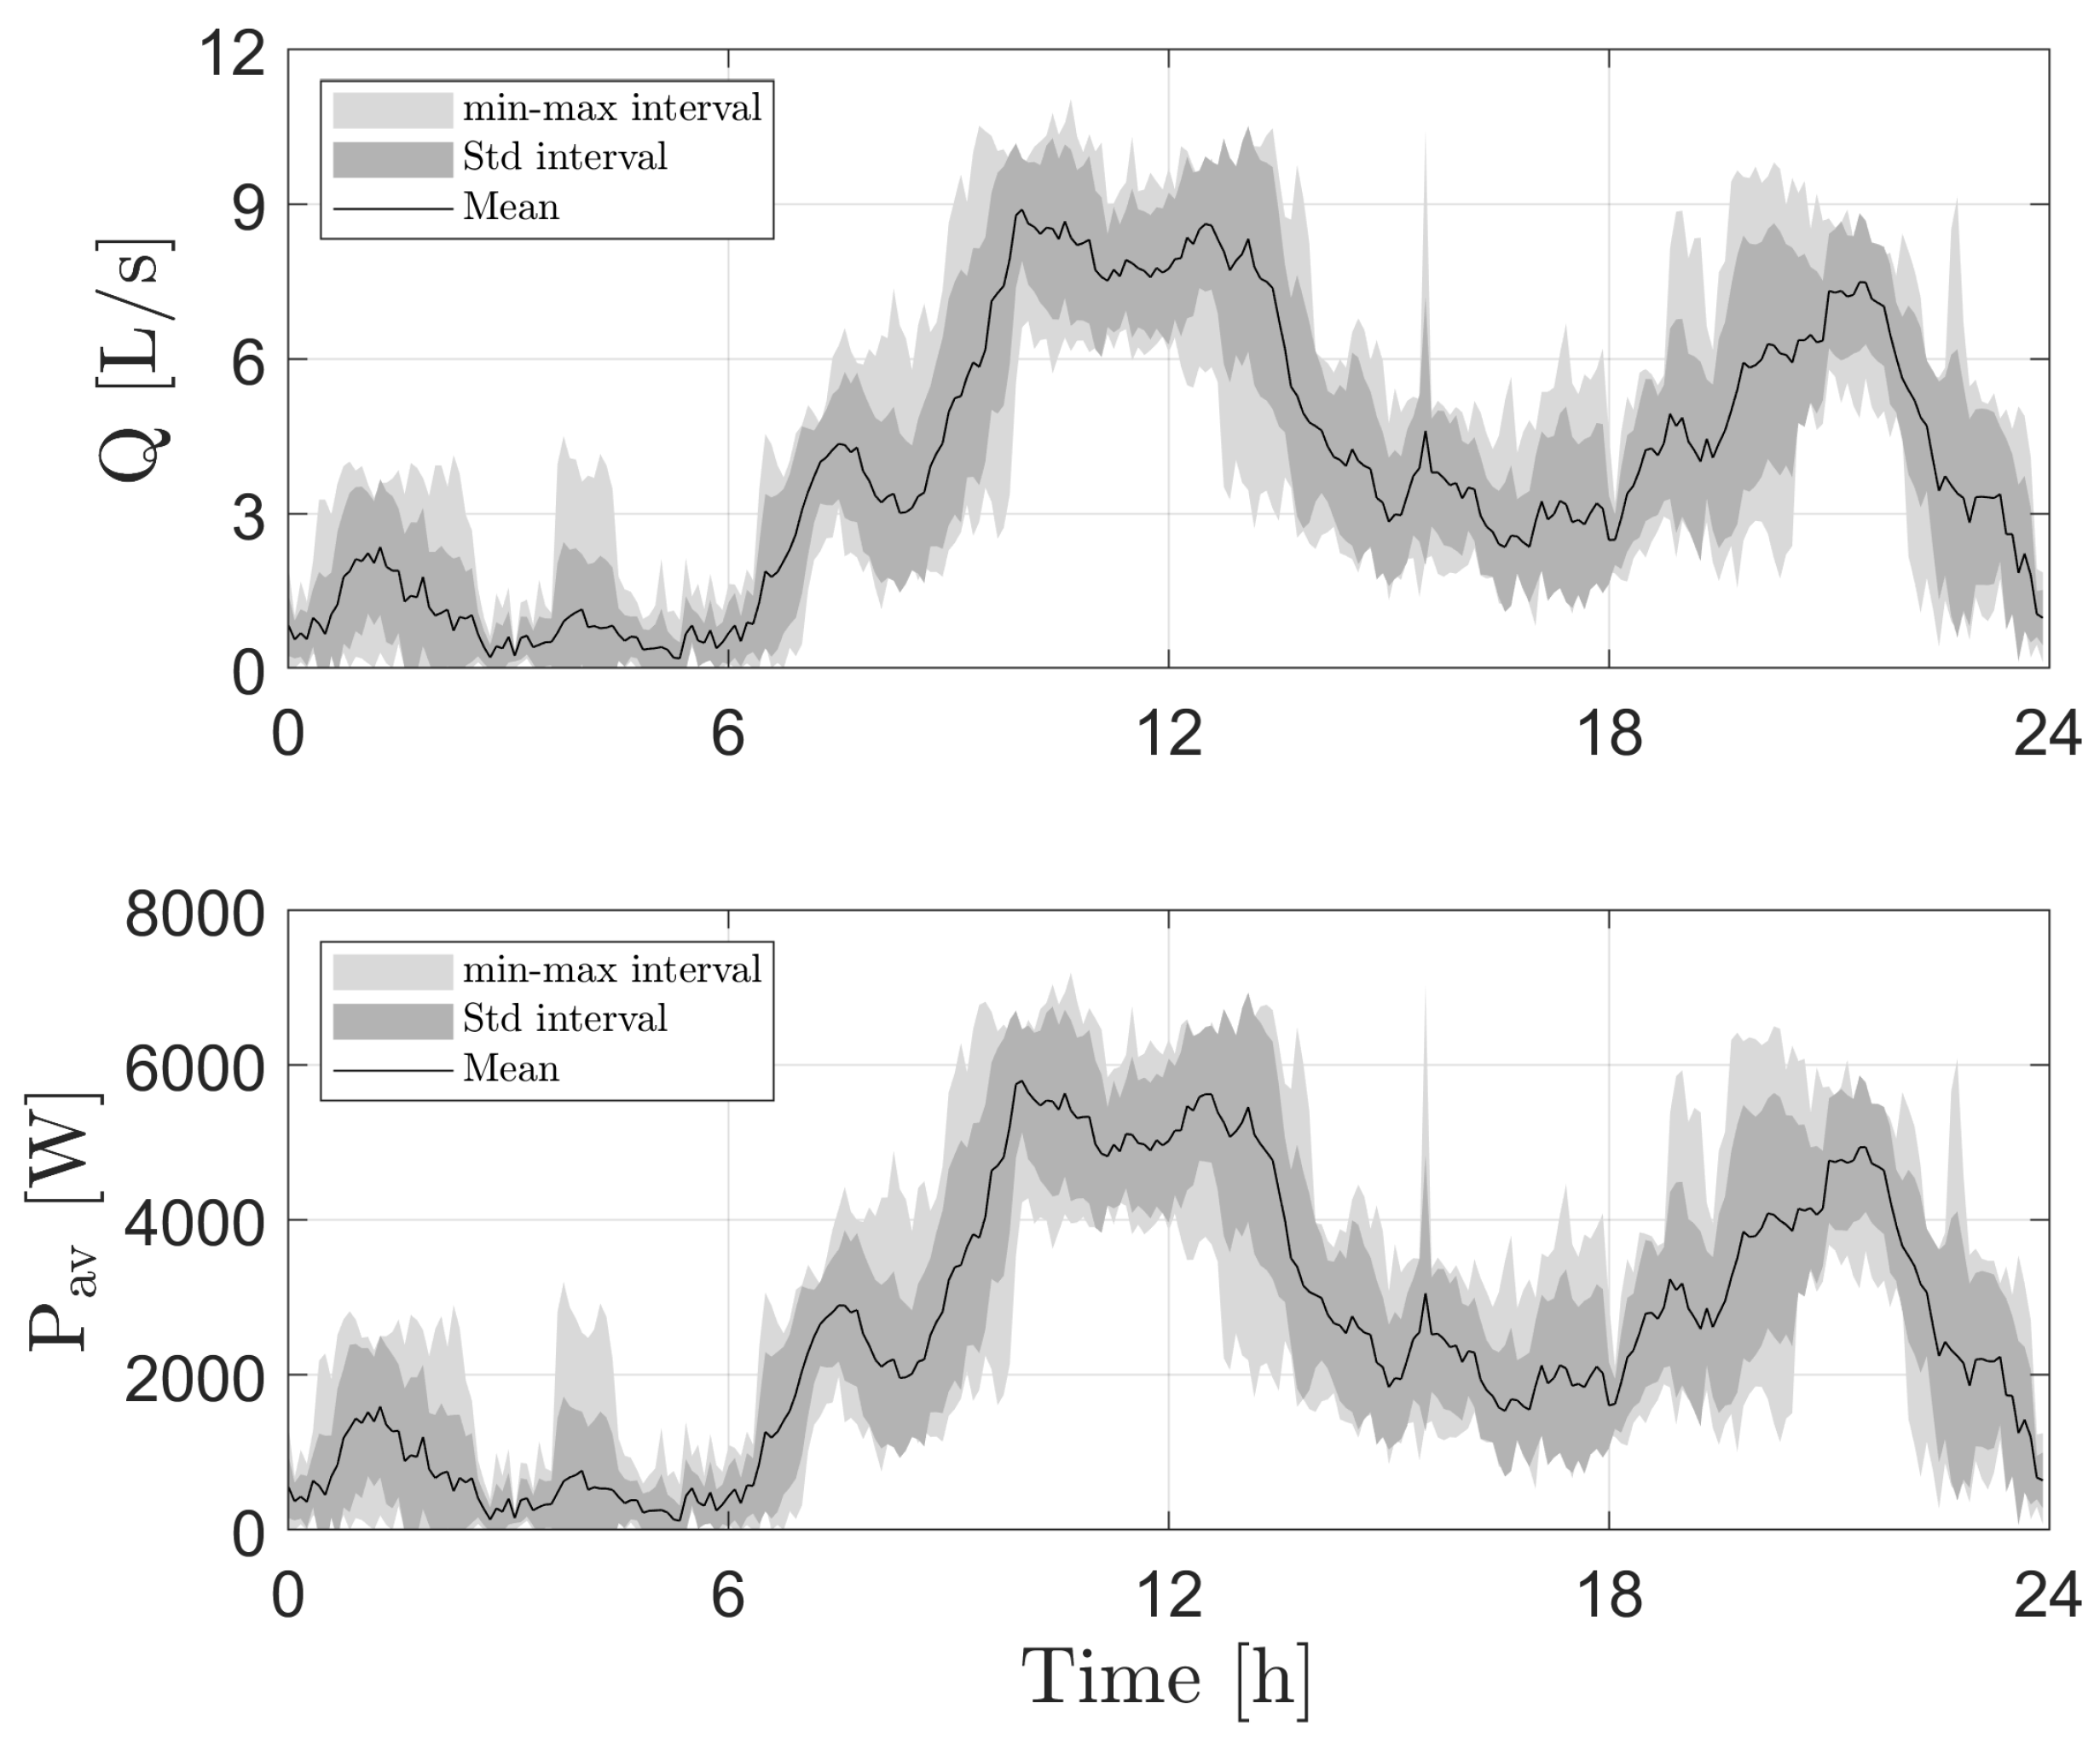
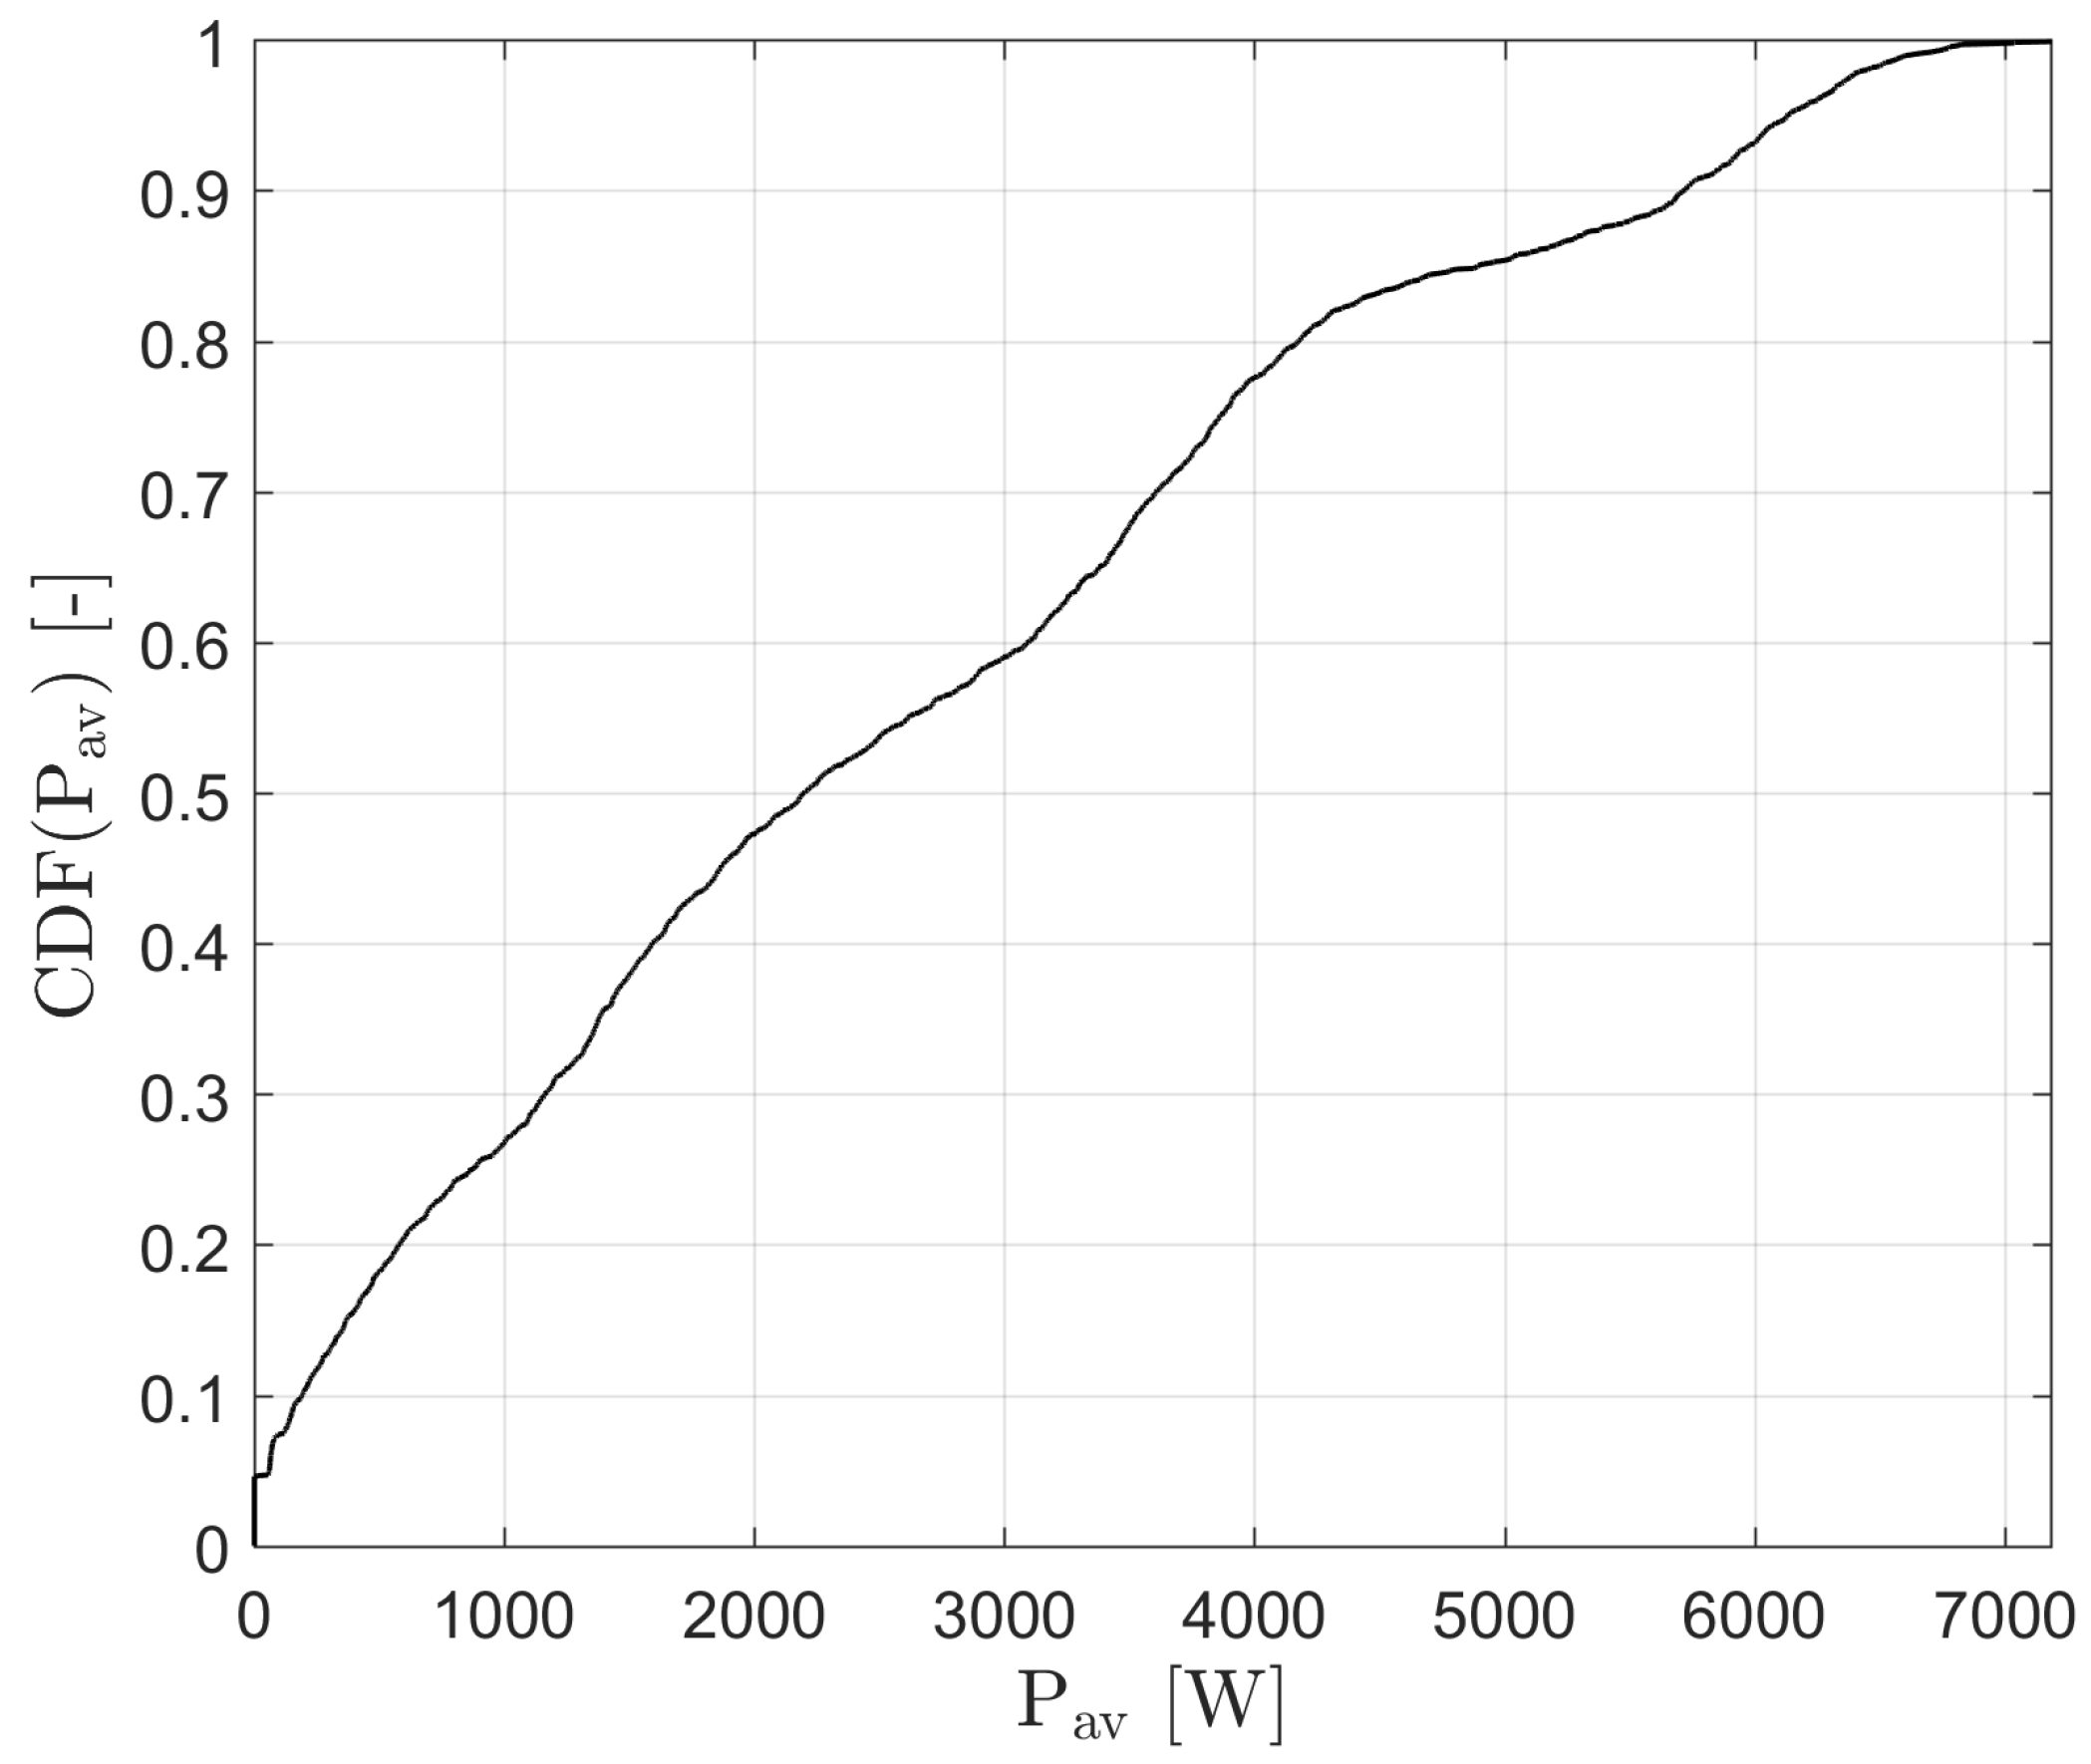
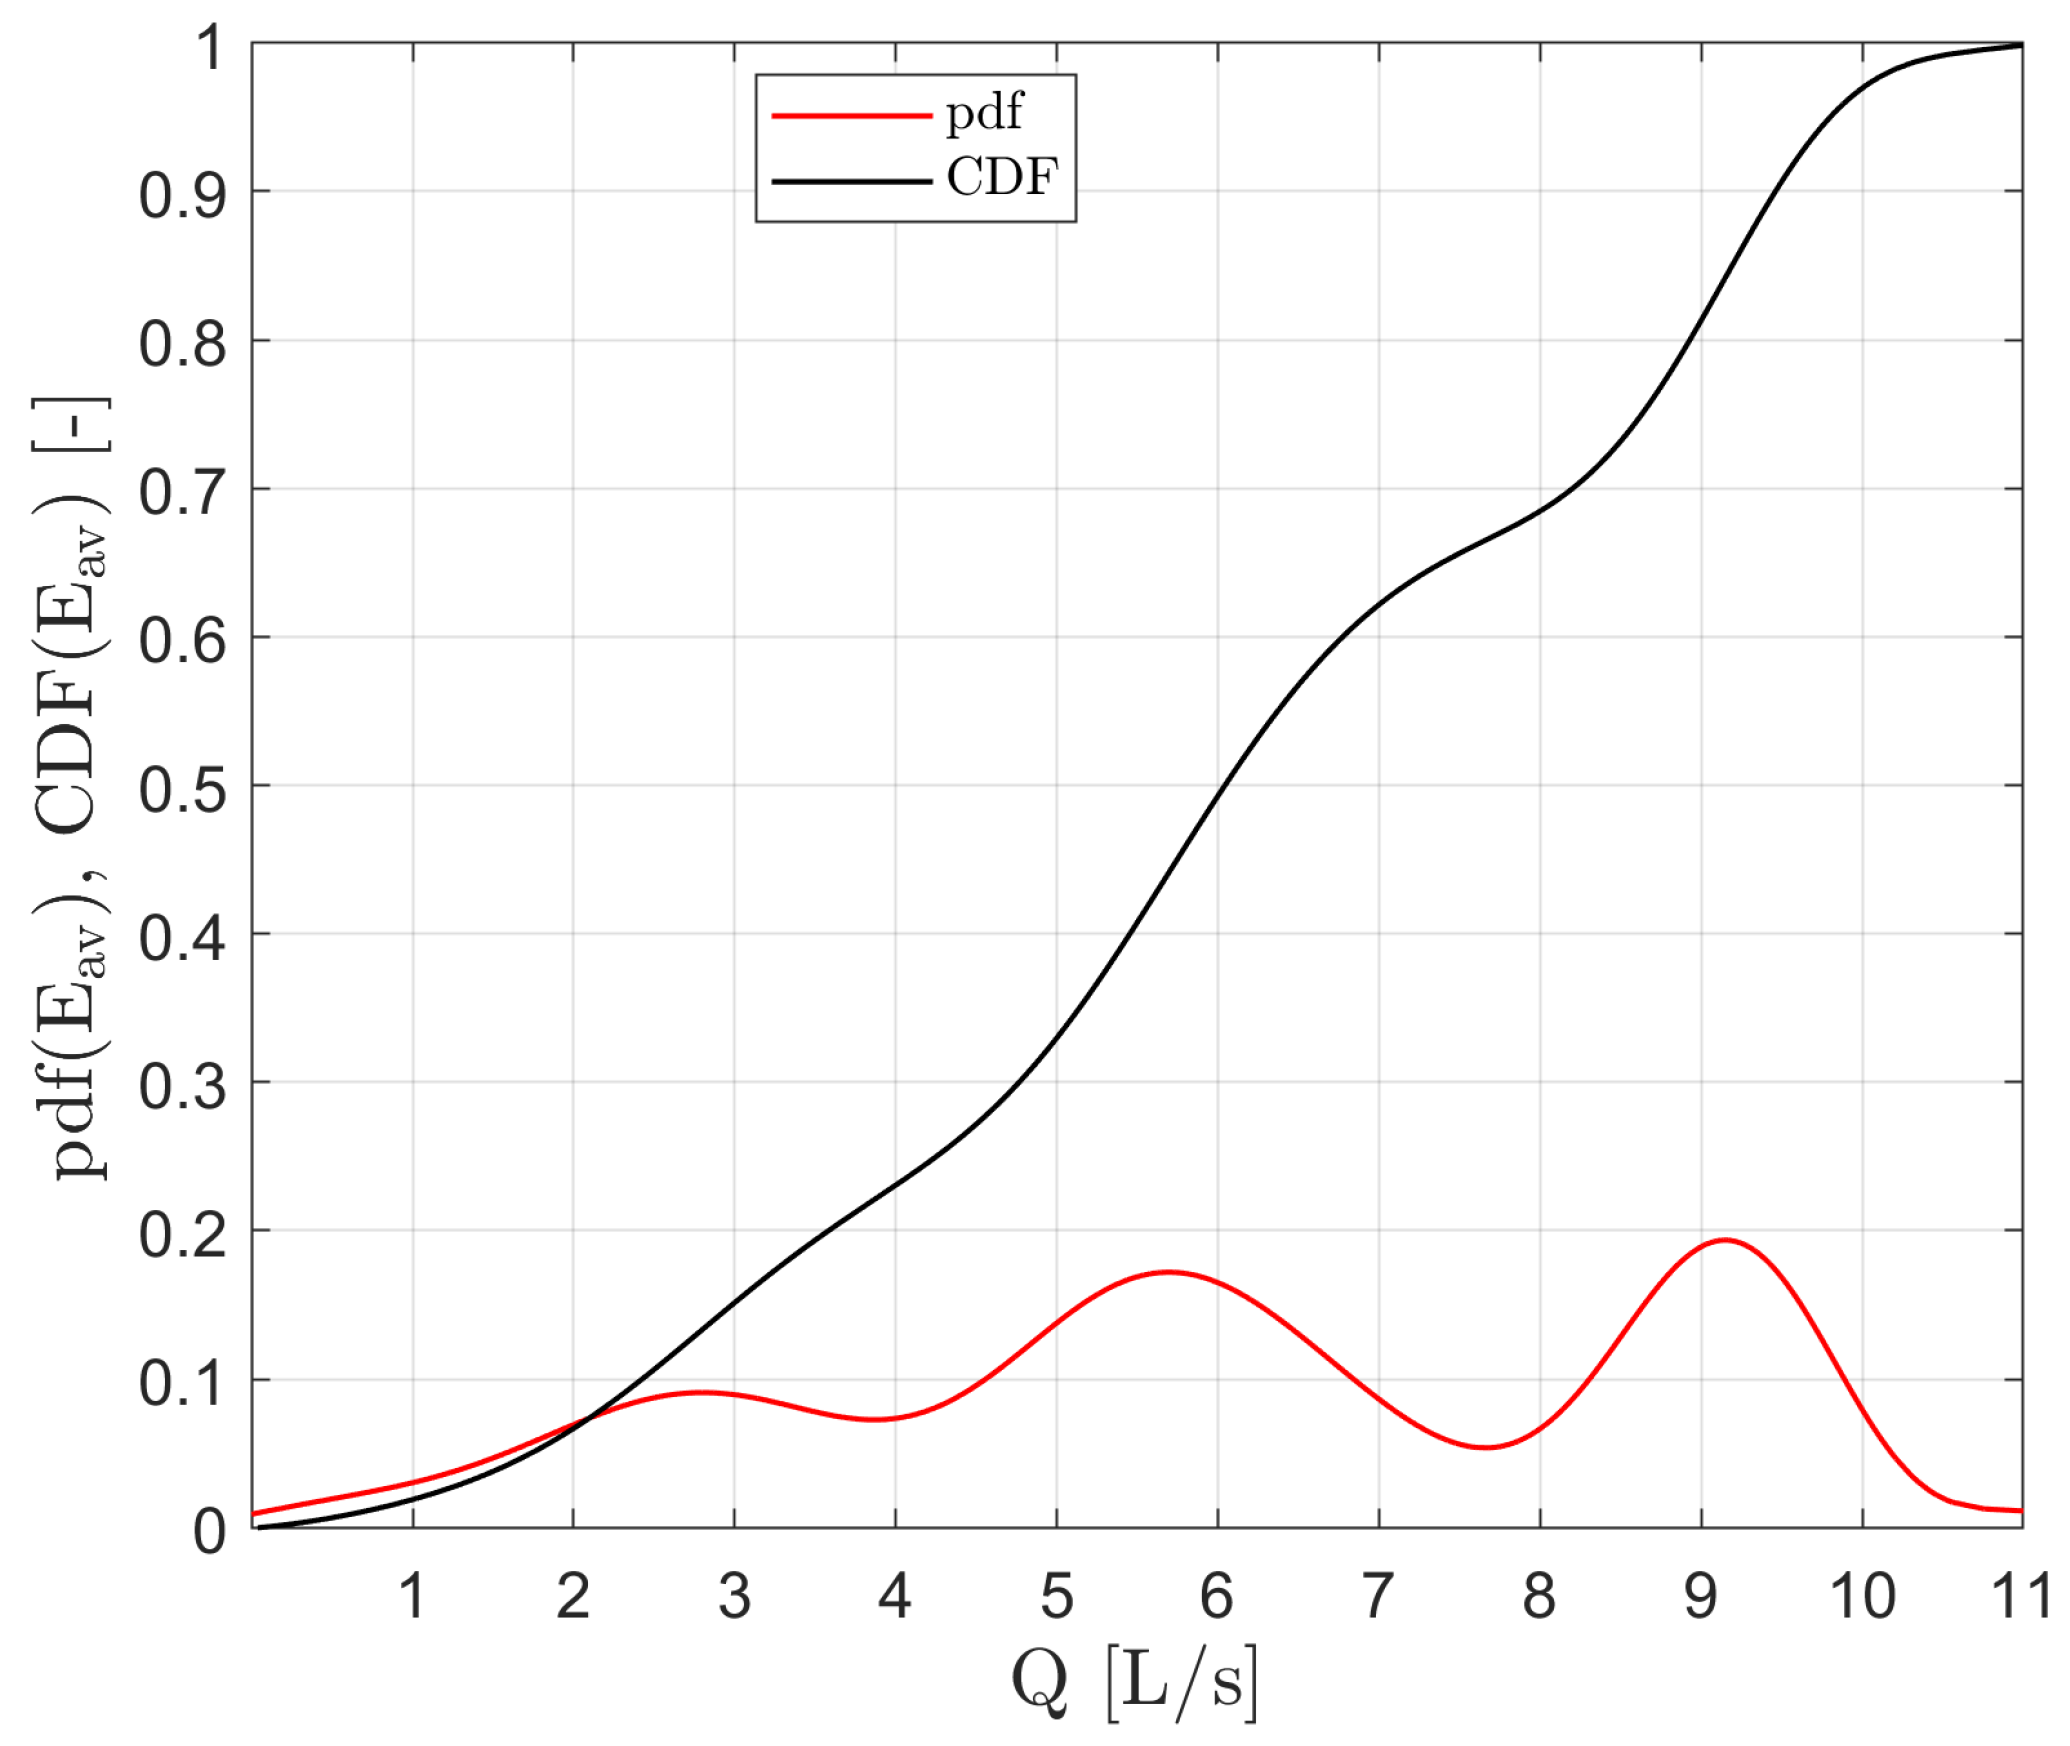
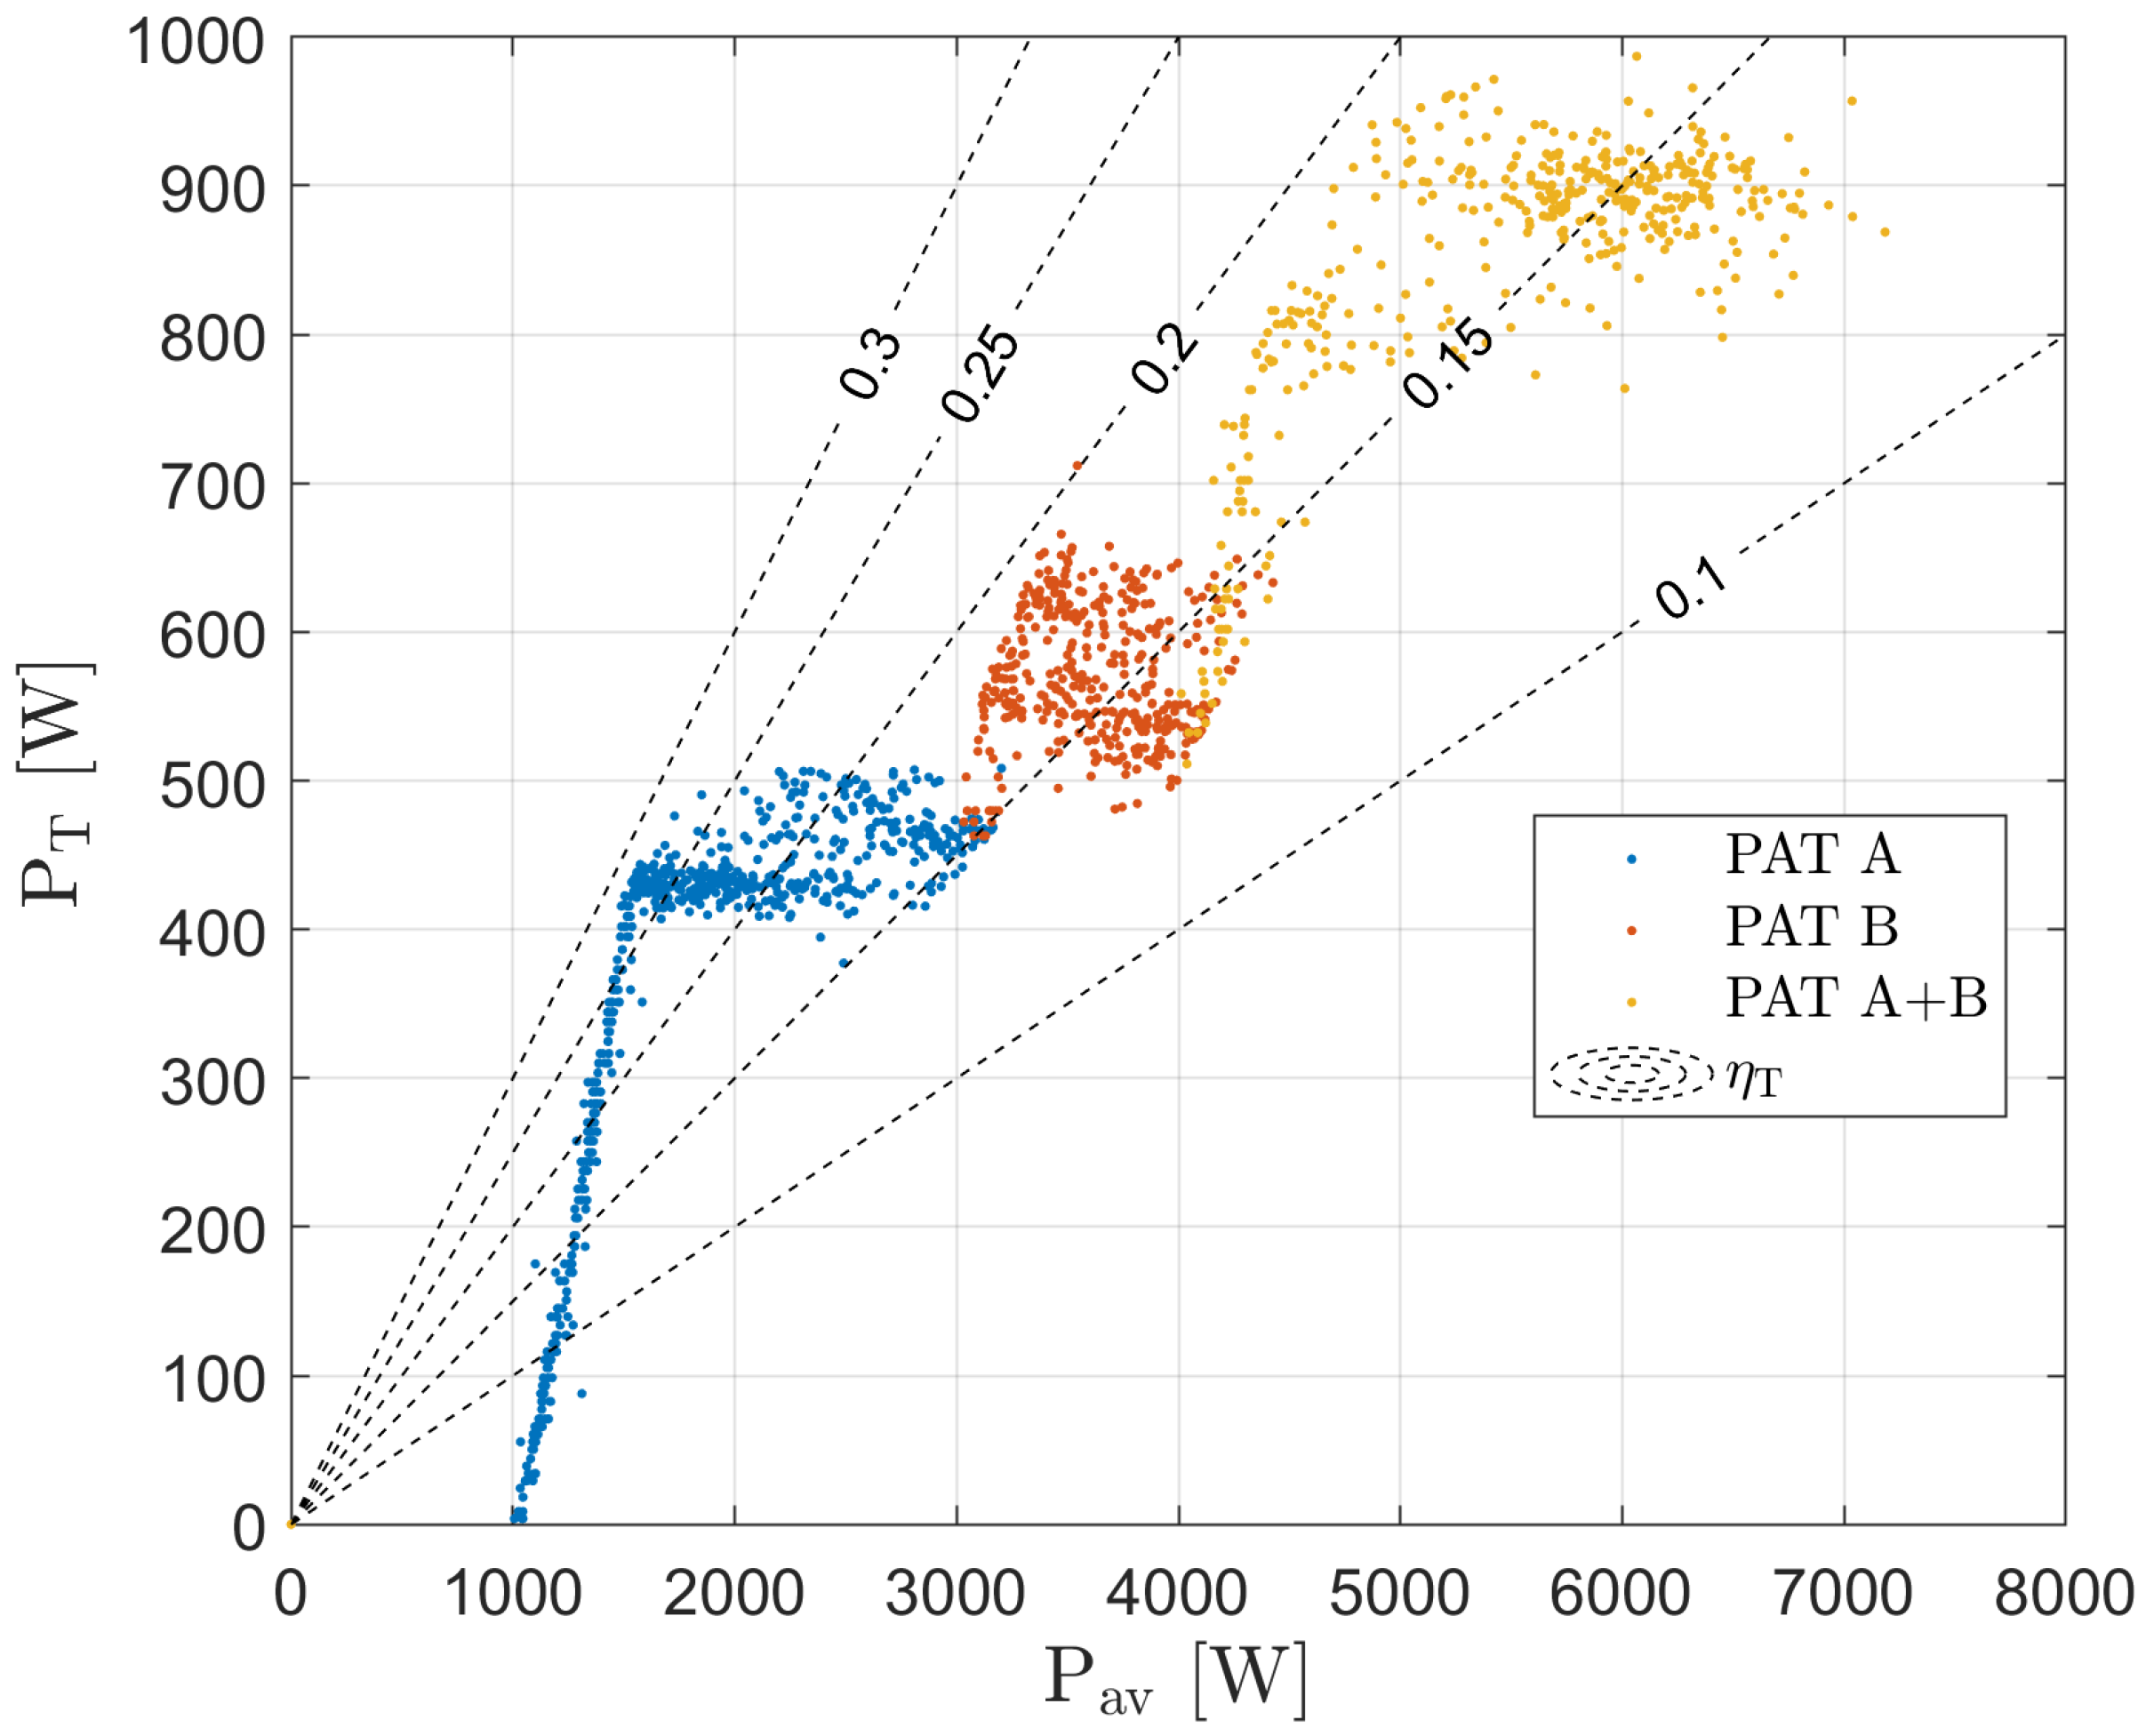
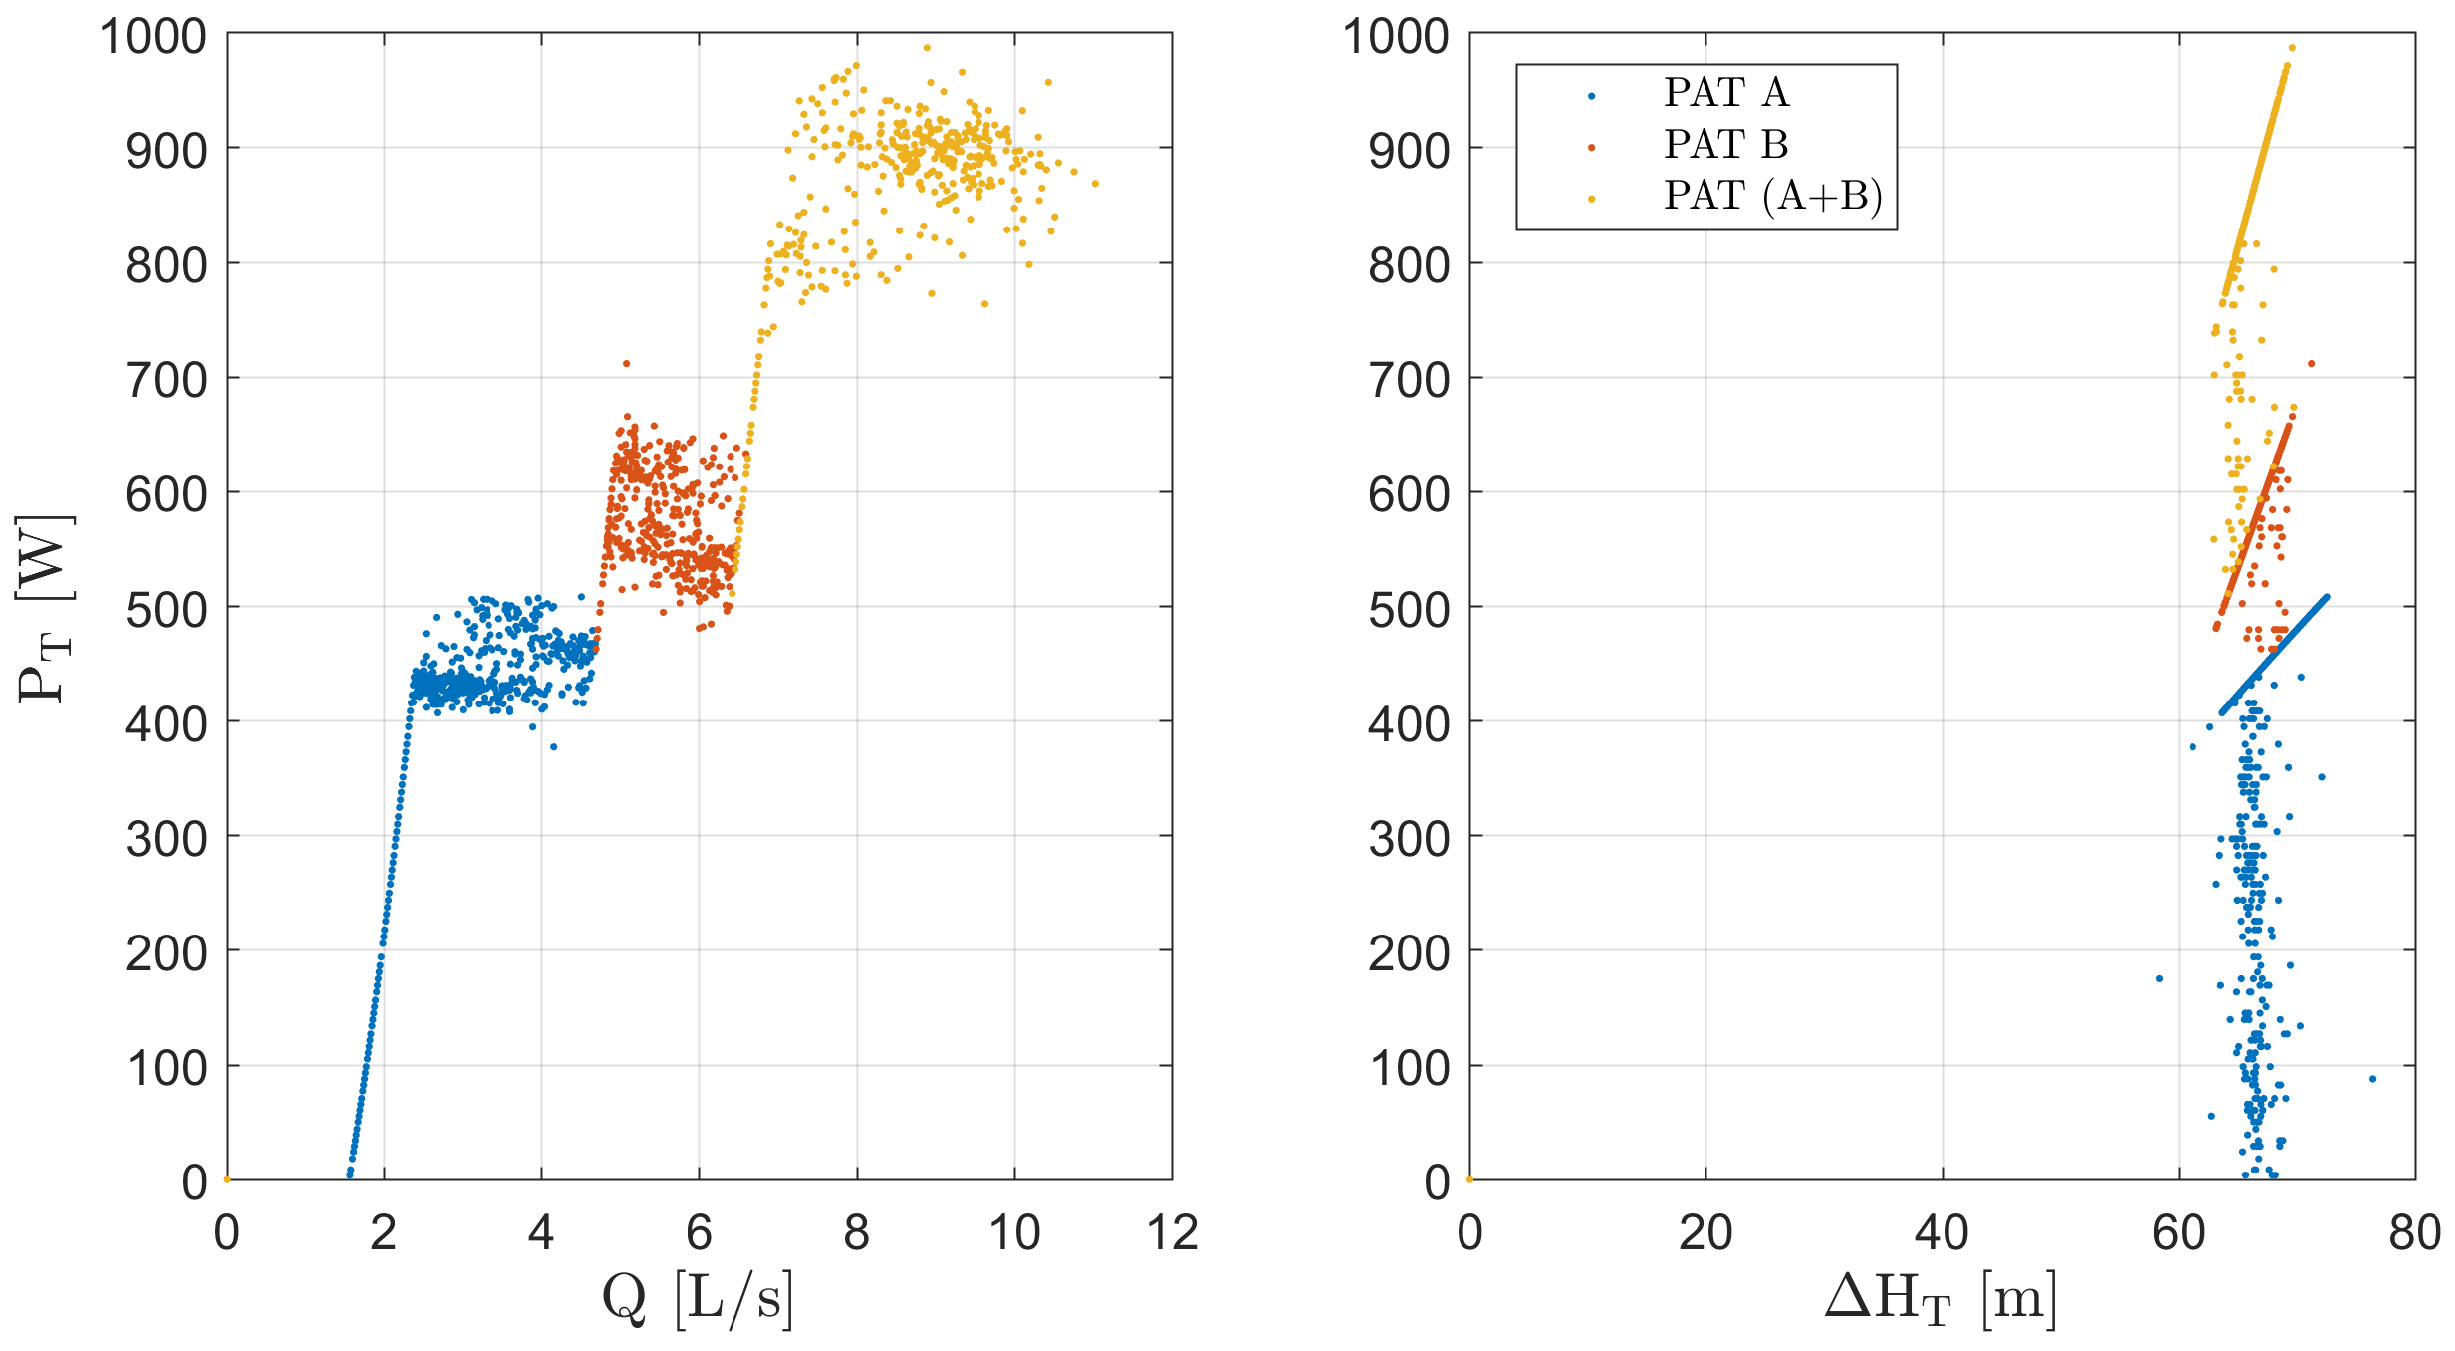
3.1. Experimental Results

The results of the experimental tests are reported in Figure 10. The different colors represents the different experimental tests that have been performed: the red line corresponds to configuration 1, the blue line to configuration 2, the magenta line to configuration 3 and the black line to configuration 4.
The values of Δ H T , i.e., the head drop produced by the booster in each of configurations 1–3, which are shown in the first of the three plots, are computed as head difference between the point downstream the pump and the outlet of the booster, i.e., point A and E of Figure 8. This means that the curves include the head drop produced by the machines as well as the head loss in the piping system from point A to the inlet of the booster and the head loss within the booster. On the same plot, also the head loss inside the bypass is shown (configuration 4), as well as the available head drop points. The second plot shows the produced/absorbed power ( P T ) in configurations 1–3. It shows that the two PATs, both in single and in parallel operation, start producing power (positive values of P T ) only after a certain value of discharge, while, for lower discharges, they behave like energy dissipators. The same behavior is visible in the third plot, where the efficiency, η T , is positive only for the upper range of discharges. The plots also show that the maximum efficiency of the system is quite low, approximately close to 0.3 .

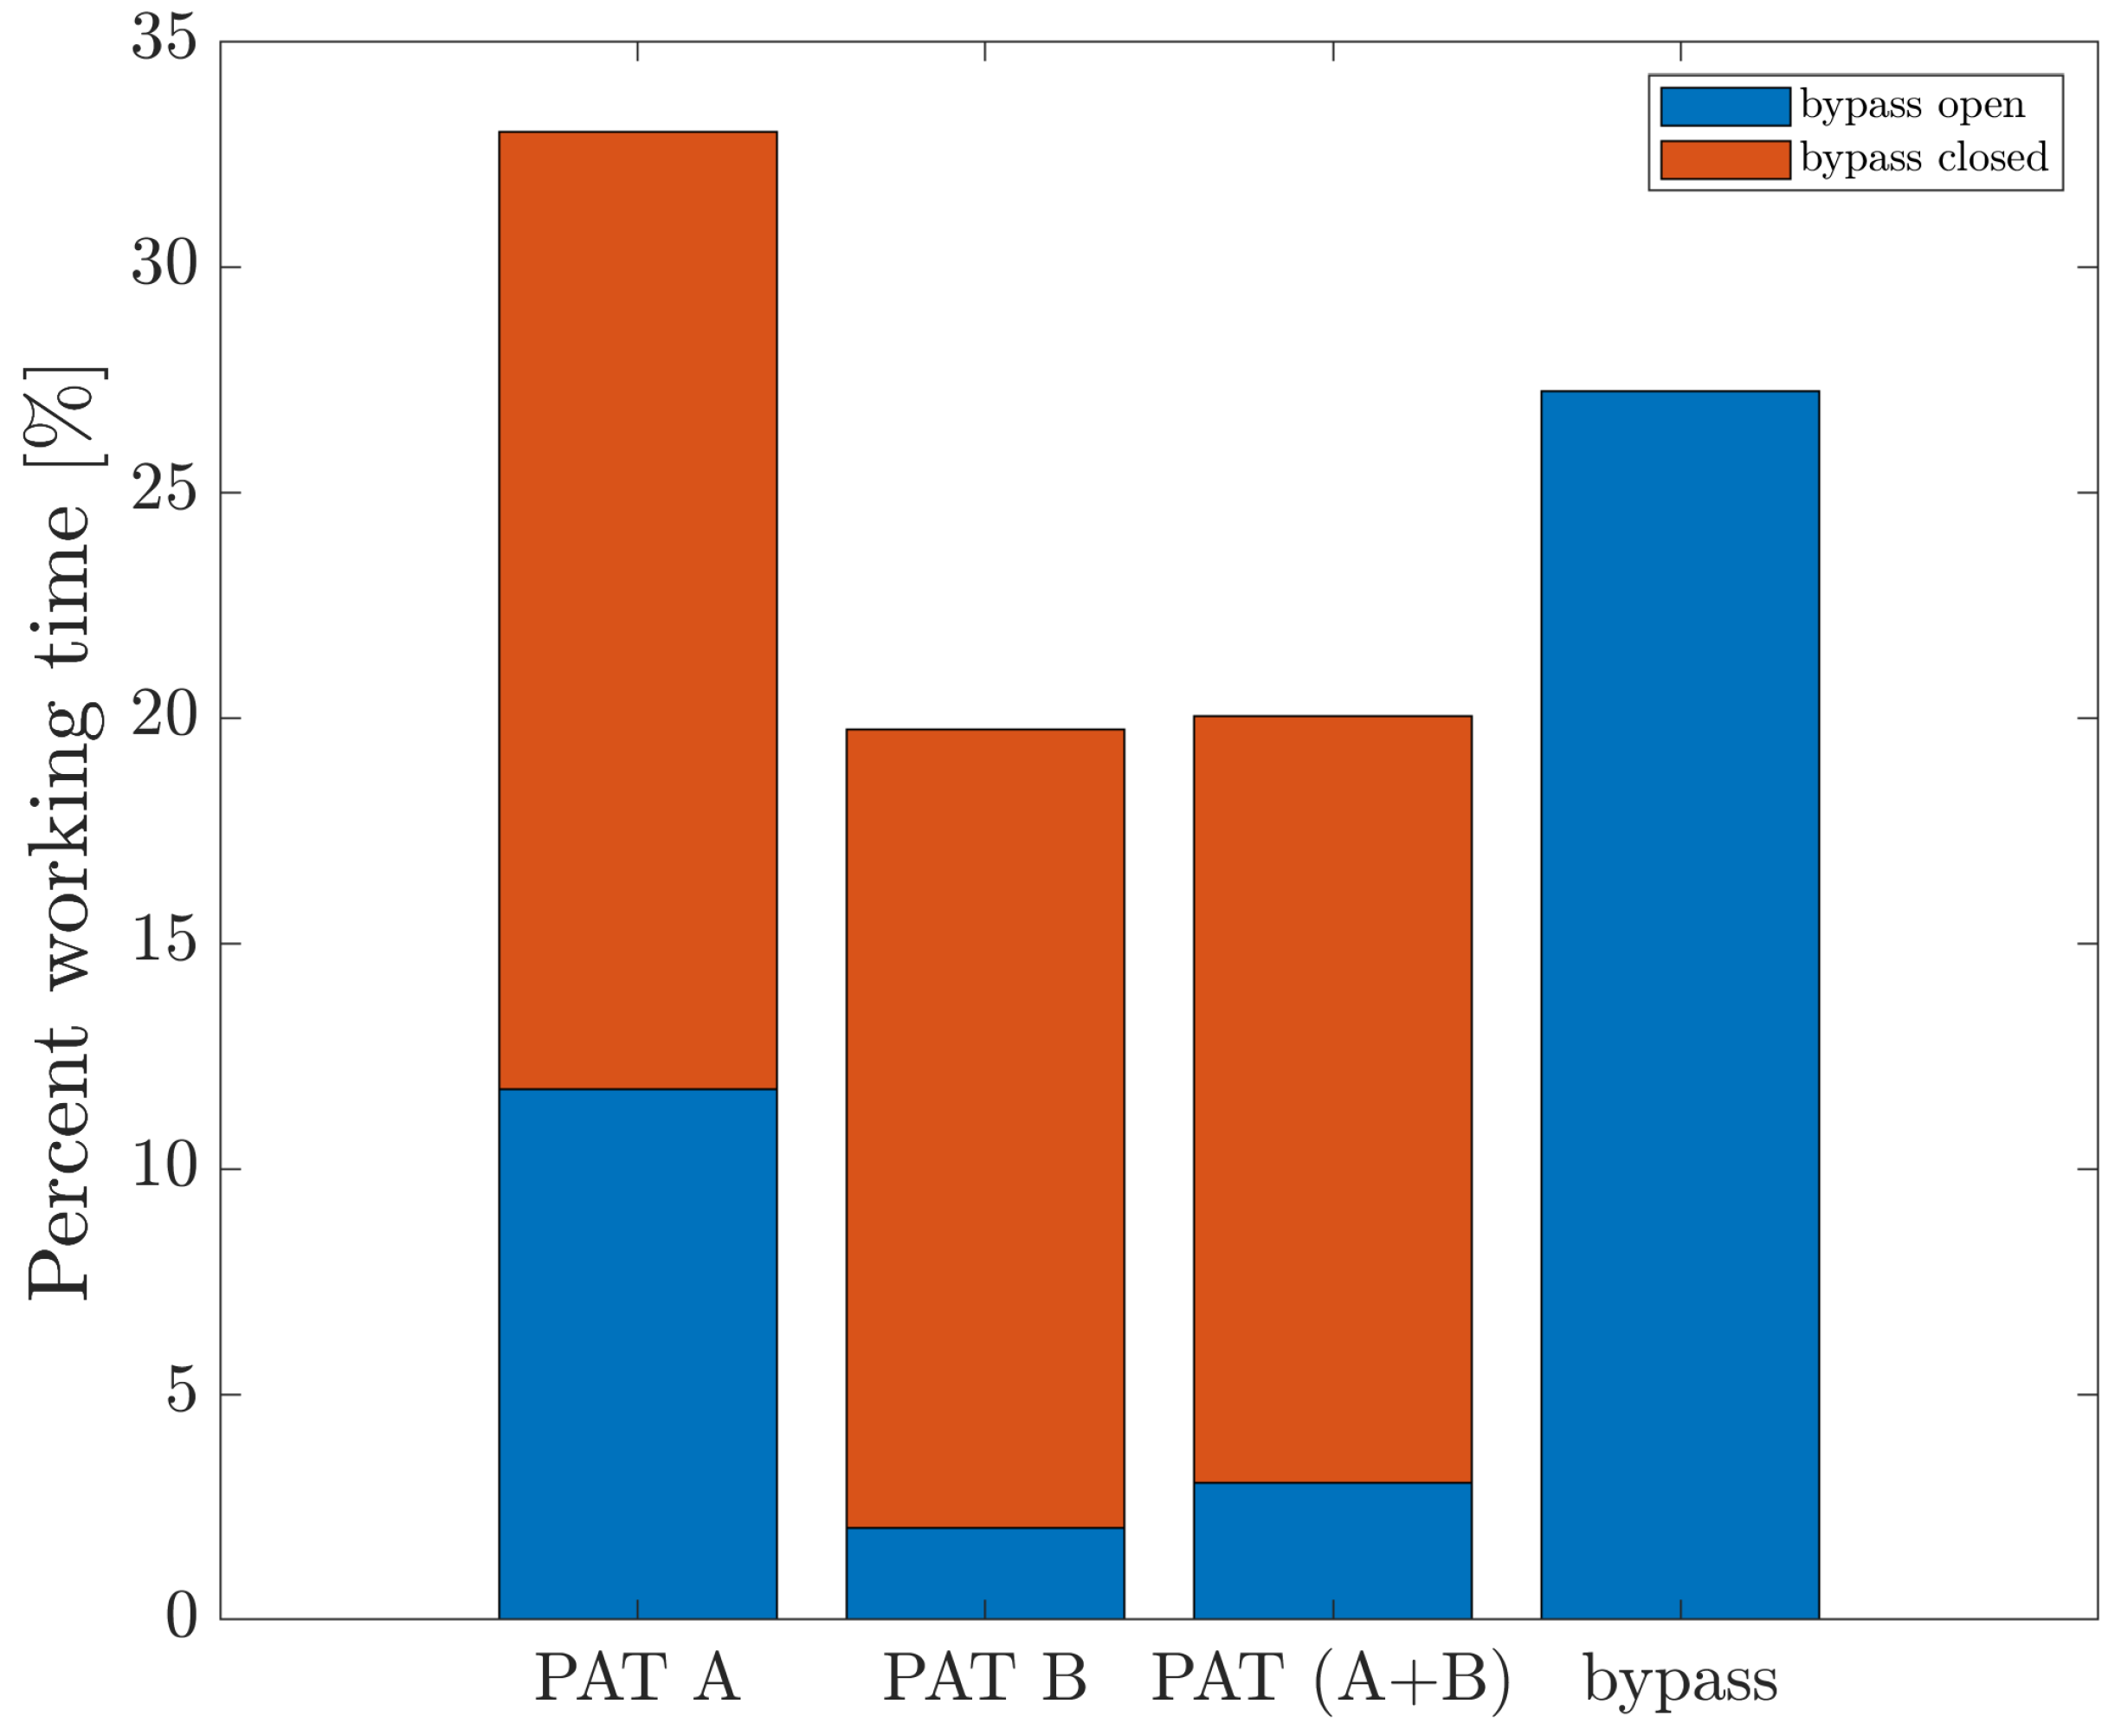
3.2. Power Plant Regulation

There are four working modes of the booster set:
1.
PAT A mode: only the PAT A is on
2.
PAT B mode: only the PAT B is on
3.
PAT (A+B) mode: both PATs are on
4.
Bypass mode: both PATs are off.
In each of the first three working modes, a part of the flow could be bypassed through Valve 1. In the fourth working mode, instead, the whole flow rate goes through the bypass, while Valves 2 and 3 are closed.
The optimal regulation of the plant is based on the identification of the MHP operating conditions that maximize the energy production for every present PRV working conditions. This means that for each working point, the operating mode was selected from the following seven different conditions, in order to maximize the power output:
  • 1.1 PAT A on, PAT B off and bypass closed
  • 1.2 PAT A on and bypass valve regulation, PAT B closed
  • 2.1 PAT B on, PAT A and bypass closed
  • 2.2 PAT B on and bypass valve regulation, PAT A closed
  • 3.1 PAT A and PAT B on, bypass closed
  • 3.2 PAT A and PAT B on, bypass valve regulation.
  • 4.0 PAT A and PAT B closed, bypass open
The results of the optimization are reported in Figure 11. In the two plots the produced electric power, P T , is plotted versus the flow rate, Q (left), and the produced head drop, Δ H T (right), respectively. Different colors refer to the operating PAT. The regulations cannot be based on a pressure drop measurement, because the plot demonstrates that the operating condition is mostly independent of the head drop. This happens because the measured pressure drop is scarcely variable for all present PRV working conditions. On the contrary, a control based on the pipeline flow rate will be very efficient and fixed settings on the valued of discharge can be used to control the system by connecting the electric actuators of the ON/OFF valves and of the bypass regulating valve to a PLC.

4. Discussion

From the plot of Figure 10, it is clear that for flow rates lower than 1.8 L/s there is no power production. This is due to the performance of the machines inside the booster: PAT A, which is the smallest one, has negative efficiency for a discharge lower than 1.8 L/s, which can be considered to be a minimum production limit. Nevertheless, as stated before (compare with Figure 5), the choice of the PAT slightly affects the performance of the hydro power plant, since only the 5 % of the available power is lost due to this discharge limit.
Figure 12 shows the produced power ( P T ) versus the available power ( P av ) for each operating point. The plot also shows the efficiency ( η T ) that can be reached for each operating point. The low η T values, mainly ranging between 0.1 and 0.3 , depend on the scarce efficiency of the prototype chosen PATs. The plot also shows that, while the BEP of PAT A is attained, the PAT B never works in the best conditions. In fact, the BEP discharge inside the PAT B is never attained, due to the need for opening the bypass as the discharge exceeds about 4.5 L/s. This happens also when the two PATs operate in parallel, where the maximum attained efficiency is less than 0.2 . This behavior occurs because, as the discharge exceeds 7 L/s, the bypass is open.
Figure 13 shows the percentage of working time among the seven different working conditions. It shows that condition 1 occurs for more than 30 % of working time, being the bypass open for about 12 % of time. Then, condition 2 is operated 20 % of the time, while condition 2.2 occurs only for about 2 % of the time. A similar behavior occurs for the conditions 3.1 and 3.2, with a slightly longer use of the bypass. Finally, condition 4 occurs for about 27 % of the working time.
In conclusion, the present solution allows the recovery approximately 9.68 kWh/day over an available energy equal to about 61.1 kWh/day. The overall efficiency of the plant is thus equal to about 16 % . This surprisingly low efficiency value is essentially due to the low efficiency of the selected machines, which is strictly related to the size of the plant and the amount of the available energy. In fact, the overall efficiency is about half of the maximum machine efficiency (that has been proven to be 30–31%), and this ratio can be considered acceptable if the high variability of the discharge and the low cost of the equipment is considered. A semi-axial submersible pump, used as PAT for higher flow rates, exhibits larger efficiency, according to REDAWN database, close to 70–75% and more. Therefore, the machine efficiency would be significantly increased. Assuming a similar behavior, a larger plant, equipped with semi-axial PATs, can easily attain an overall efficiency higher than 35–40%.

5. Conclusions

In this paper, a new approach to recover energy in the peripheral branches of the water distribution network is discussed. A branch of a real water distribution network has been adopted as a case study, serving the area Graville in Normandy (Fr) with an average daily discharge of 6 L/s and a PRV reducing the pressure head of about 70 m. In the site area, as in the most of the water net applications, only a small manhole is available for MHP installation, and the low power of the plant does not allow any civil work for hosting the electro-mechanical devices. An innovative booster set equipped with two centrifugal submersible borehole pumps acting as PATs has been described, together with the most suitable hydraulic regulation scheme of the plant coupling low installation cost and easy plant management. The design of the PATs has been made based on comprehensive site measurements and on specific tests on industrial pumps. The booster layout has been defined by the use of computational fluid computation in order to grant the best cooling of the pump motors and the minimum internal flow resistances. Finally, the optimal regulation of the MHP determining the most efficient plant operating conditions for the given network working condition was determined by optimization. A flow-based power plant control was found to be effective and several settings on the discharge will allow the instant control of the system. The results that were obtained showed a very low global efficiency, since only 16 % of the available energy can be actually converted into electricity. This very low value is strongly affected by the poor efficiency of the machines that have been chosen for the prototype design and is strictly related to the size of the plant. Higher available power and a larger available discharge would allow the use of semiaxial submersible pumps, with very high BEP efficiency and a consequent higher conversion rate. If a similar behavior of the plant is considered, an overall efficiency up to about 40% can be reached with a semiaxial pump with 70–75% BEP efficiency.
The low energy conversion ratio, together with the low efficiency of the two PATs, could be due to the fact that the machines have been chosen as they have their BEP discharges corresponding to the first two energy peaks, shown in Figure 5. A future study should investigate the effect of an optimal design of the device, trying to find the machine that maximizes the output energy.
Even if, with higher available power, the efficiency of the plant could be greater due to the use of more efficient machines, the convenience of such a low cost device should be proven: if the available energy is higher, a different and more expensive hydraulic control could be more convenient due to the higher revenue. This implies that future research should perform an economic analysis to investigate whether a cutoff energy exists that could be considered to be an upper bound for the installation of the energy booster.

Author Contributions

Conceptualization, A.C.; methodology, O.F.; Experimental tests, A.C., O.F. and M.C.M.; software, O.F. and M.C.M.; validation, H.M.R. and G.D.G.; writing—original draft preparation, A.C.; writing—review and editing, O.F. and M.C.M. All authors have read and agreed to the published version of the manuscript.

Funding

This work was supported by the European Regional Development Fund Interreg Atlantic Area Programme 2014–2020 [REDAWN Project-EAPA 198/2016].

Institutional Review Board Statement

Not applicable.

Informed Consent Statement

Not applicable.

Data Availability Statement

Not applicable.

Conflicts of Interest

The authors declare no conflict of interest.

References

  1. Olsson, G. Water, energy and food interactions-Challenges and opportunities. Front. Environ. Sci. Eng. 2013, 7, 787–793. [Google Scholar] [CrossRef]
  2. Nhamo, L.; Mabhaudhi, T.; Mpandeli, S.; Dickens, C.; Nhemachena, C.; Senzanje, A.; Naidoo, D.; Liphadzi, S.; Modi, A.T. An integrative analytical model for the water-energy-food nexus: South Africa case study. Environ. Sci. Policy 2020, 109, 15–24. [Google Scholar] [CrossRef]
  3. Cansino-Loeza, B.; Ponce-Ortega, J.M. Sustainable assessment of Water-Energy-Food Nexus at regional level through a multi-stakeholder optimization approach. J. Clean. Prod. 2021, 290, 125194. [Google Scholar] [CrossRef]
  4. Mishra, B.K.; Kumar, P.; Saraswat, C.; Chakraborty, S.; Gautam, A. Water security in a changing environment: Concept, challenges and solutions. Water 2021, 13, 490. [Google Scholar] [CrossRef]
  5. Gallagher, J.; Basu, B.; Browne, M.; Kenna, A.; McCormack, S.; Pilla, F.; Styles, D. Adapting Stand-Alone Renewable Energy Technologies for the Circular Economy through Eco-Design and Recycling. J. Ind. Ecol. 2017, 23, 133–140. [Google Scholar] [CrossRef] [Green Version]
  6. Colombo, A.F.; Karney, B.W. Energy and Costs of Leaky Pipes: Toward Comprehensive Picture. J. Water Resour. Plan. Manag. 2002, 128. [Google Scholar] [CrossRef] [Green Version]
  7. Xue, X.; Hawkins, T.; Schoen, M.; Garland, J.; Ashbolt, N. Comparing the Life Cycle Energy Consumption, Global Warming and Eutrophication Potentials of Several Water and Waste Service Options. Water 2016, 8, 154. [Google Scholar] [CrossRef] [Green Version]
  8. Salmoral, G.; Zegarra, E.; Vázquez-Rowe, I.; González, F.; del Castillo, L.; Saravia, G.R.; Graves, A.; Rey, D.; Knox, J.W. Water-related challenges in nexus governance for sustainable development: Insights from the city of Arequipa, Peru. Sci. Total Environ. 2020, 747, 141114. [Google Scholar] [CrossRef]
  9. McNabola, A.; Coughlan, P.; Corcoran, L.; Power, C.; Williams, A.P.; Harris, I.; Gallagher, J.; Styles, D. Energy recovery in the water industry using micro-hydropower: An opportunity to improve sustainability. Water Policy 2014, 16, 168–183. [Google Scholar] [CrossRef]
  10. Bosco, C.; Campisano, A.; Modica, C.; Pezzinga, G. Application of rehabilitation and active pressure control strategies for leakage reduction in a case-study network. Water 2020, 12, 2215. [Google Scholar] [CrossRef]
  11. Schwaller, J.; van Zyl, J.E. Modeling the Pressure-Leakage Response of Water Distribution Systems Based on Individual Leak Behavior. J. Hydraul. Eng. 2014, 141, 1–8. [Google Scholar] [CrossRef]
  12. Berardi, L.; Giustolisi, O. Calibration of design models for leakage management of water distribution networks. Water Resour. Manag. 2021, 35, 2537–2551. [Google Scholar] [CrossRef]
  13. Kosucu, M.M.; Sari, O.; Demirel, M.C.; Kiran, S.; Yilmaz, A.; Aybakan, A.; Albay, E.; Ozgur Kirca, V.S. Water leakage reduction in the water distribution network with real time pressure management. Teknik Dergi/Tech. J. Turk. Chamb. Civil Eng. 2021, 32, 10541–10564. [Google Scholar] [CrossRef]
  14. Xu, Q.; Chen, Q.; Ma, J.; Blanckaert, K. Optimal pipe replacement strategy based on break rate prediction through genetic programming for water distribution network. J. Hydro-Environ. Res. 2013, 7, 134–140. [Google Scholar] [CrossRef]
  15. Creaco, E.; Pezzinga, G. Multiobjective optimization of pipe replacements and control valve installations for leakage attenuation in water distribution networks. J. Water Resour. Plan. Manag. 2015, 141, 04014059. [Google Scholar] [CrossRef]
  16. Molinos-Senante, M.; Villegas, A.; Maziotis, A. Measuring the marginal costs of reducing water leakage: The case of water and sewerage utilities in Chile. Environ. Sci. Pollut. Res. 2021, 28, 32733–32743. [Google Scholar] [CrossRef]
  17. Ferraiuolo, R.; Paola, F.D.; Fiorillo, D.; Caroppi, G.; Pugliese, F. Experimental and numerical assessment of water leakages in a PVC-A pipe. Water 2020, 12, 1804. [Google Scholar] [CrossRef]
  18. Cabrera, E.J.; Pardo, M.A.; Cobacho, R.; Cabrera, E.J. Energy Audit of Water Networks. J. Water Resour. Plan. Manag. 2010, 136, 669–677. [Google Scholar] [CrossRef]
  19. Khulief, Y.A.; Khalifa, A.; Mansour, R.B.; Habib, M.A. Acoustic Detection of Leaks in Water Pipelines Using Measurements inside Pipe. J. Pipeline Syst. Eng. Pract. 2012, 3, 47–54. [Google Scholar] [CrossRef]
  20. Pérez-Sánchez, M.; Sánchez-Romero, F.J.; Ramos, H.M.; López-Jiménez, P.A. Energy recovery in existing water networks: Towards greater sustainability. Water 2017, 9, 97. [Google Scholar] [CrossRef] [Green Version]
  21. Binama, M.; Su, W.T.; Li, X.B.; Li, F.C.; Wei, X.Z.; An, S. Investigation on pump as turbine (PAT) technical aspects for micro hydropower schemes: A state-of-the-art review. Renew. Sustain. Energy Rev. 2017, 79, 148–179. [Google Scholar] [CrossRef]
  22. Šavar, M.; Kozmar, H.; Sutlović, I. Improving centrifugal pump efficiency by impeller trimming. Desalination 2009, 249, 654–659. [Google Scholar] [CrossRef]
  23. Sperlich, A.; Pfeiffer, D.; Burgschweiger, J.; Campbell, E.; Beck, M.; Gnirss, R.; Ernst, M. Energy efficient operation of variable speed submersible pumps: Simulation of a ground water well field. Water 2018, 10, 1255. [Google Scholar] [CrossRef] [Green Version]
  24. Karadirek, I.E.; Kara, S.; Yilmaz, G.; Muhammetoglu, A.; Muhammetoglu, H. Implementation of Hydraulic Modelling for Water-Loss Reduction Through Pressure Management. Water Resour. Manag. 2012, 26, 2555–2568. [Google Scholar] [CrossRef]
  25. Jafari, R.; Khanjani, M.J.; Esmaeilian, H.R. Pressure management and electric power production using pumps as turbines. J. Am. Water Work. Assoc. 2015, 107, E351–E363. [Google Scholar] [CrossRef]
  26. Stokes, J.R.; Horvath, A.; Sturm, R. Water loss control using pressure management: Life-cycle energy and air emission effects. Environ. Sci. Technol. 2013, 47, 10771–10780. [Google Scholar] [CrossRef]
  27. Morani, M.C.; Carravetta, A.; Del Giudice, G.; McNabola, A.; Fecarotta, O. A comparison of energy recovery by PATs against direct variable speed pumping in water distribution networks. Fluids 2018, 3, 41. [Google Scholar] [CrossRef] [Green Version]
  28. Stefanizzi, M.; Capurso, T.; Balacco, G.; Torresi, M.; Binetti, M.; Piccinni, A.F.; Fortunato, B.; Camporeale, S.M. Preliminary assessment of a pump used as turbine in a water distribution network for the recovery of throttling energy. In Proceedings of the 13th European Turbomachinery Conference on Turbomachinery Fluid Dynamics and Thermodynamics, Lausanne, Switzerland, 8–12 April 2019. [Google Scholar]
  29. Muhammetoglu, A.; Nursen, C.; Karadirek, I.E.; Muhammetoglu, H. Evaluation of performance and environmental benefits of a full-scale pump as turbine system in Antalya water distribution network. Water Sci. Technol. Water Supply 2017, 17, ws2017087. [Google Scholar] [CrossRef]
  30. Capelo, B.; Pérez-Sánchez, M.; Fernandes, J.F.P.; Ramos, H.M.; López-Jiménez, P.A.; Branco, P.J. Electrical behaviour of the pump working as turbine in off grid operation. Appl. Energy 2017, 208, 302–311. [Google Scholar] [CrossRef]
  31. Motwani, K.H.; Jain, S.V.; Patel, R.N. Cost analysis of pump as turbine for pico hydropower plants—A case Study. Procedia Eng. 2013, 51, 721–726. [Google Scholar] [CrossRef] [Green Version]
  32. Venturini, M.; Alvisi, S.; Simani, S.; Manservigi, L. Energy production by means of pumps as turbines in water distribution networks. Energies 2017, 10, 1666. [Google Scholar] [CrossRef] [Green Version]
  33. Lin, T.; Zhu, Z.; Li, X.; Li, J.; Lin, Y. Theoretical, experimental, and numerical methods to predict the best efficiency point of centrifugal pump as turbine. Renew. Energy 2021, 168, 31–44. [Google Scholar] [CrossRef]
  34. Carravetta, A.; Del Giudice, G.; Fecarotta, O.; Ramos, H.H.M. Energy Production in Water Distribution Networks: A PAT Design Strategy. Water Resour. Manag. 2012, 26, 3947–3959. [Google Scholar] [CrossRef]
  35. Giosio, D.R.; Henderson, A.D.; Walker, J.M.; Brandner, P.A.; Sargison, J.E.; Gautam, P. Design and performance evaluation of a pump-as-turbine micro-hydro test facility with incorporated inlet flow control. Renew. Energy 2015, 78, 1–6. [Google Scholar] [CrossRef]
  36. Alberizzi, J.C.; Renzi, M.; Righetti, M.; Pisaturo, G.R.; Rossi, M. Speed and pressure controls of pumps-as-turbines installed in branch of water-distribution network subjected to highly variable flow rates. Energies 2019, 12, 4738. [Google Scholar] [CrossRef] [Green Version]
  37. Carravetta, A.; Fecarotta, O.; Ramos, H.M. A new low-cost installation scheme of PATs for pico hydropower to recover energy in residential areas. Renew. Energy 2018, 125, 1003–1014. [Google Scholar] [CrossRef]
  38. Rossi, M.; Nigro, A.; Pisaturo, G.R.; Renzi, M. Technical and economic analysis of Pumps-as-Turbines (PaTs) used in an Italian Water Distribution Network (WDN) for electrical energy production. Energy Procedia 2019, 158, 117–122. [Google Scholar] [CrossRef]
  39. Punys, P.; Dumbrauskas, A.; Kvaraciejus, A.; Vyciene, G. Tools for Small Hydropower Plant Resource Planning and Development: A Review of Technology and Applications. Energies 2011, 4, 1258–1277. [Google Scholar] [CrossRef] [Green Version]
  40. Madeira, F.C.; Fernandes, J.F.; Pérez-Sánchez, M.; López-Jiménez, P.A.; Ramos, H.M.; Costa Branco, P. Electro-hydraulic transient regimes in isolated pumps working as turbines with self-excited induction generators. Energies 2020, 13, 4521. [Google Scholar] [CrossRef]
  41. Ramos, H.M.; Morillo, J.G.; Diaz, J.A.R.; Carravetta, A.; McNabola, A. Sustainable water-energy nexus towards developing countries’ water sector efficiency. Energies 2021, 14, 3525. [Google Scholar] [CrossRef]
  42. Carravetta, A.; Del Giudice, G.; Fecarotta, O.; Gallagher, J.; Morani, M.C.; Ramos, H.M. The Potential Energy, Economic & Environmental Impacts of Hydro Power Pressure Reduction on the Water-Energy-Food Nexus. J. Water Resour. Plan. Manag. 2022, 148, 04022012. [Google Scholar]
  43. Cimorelli, L.; Fecarotta, O. Optimal Regulation of Variable Speed Pumps in Sewer Systems. In Proceedings of the 4th EWaS International Conference: Valuing the Water, Carbon, Ecological Footprints of Human Activities, Online, 24–27 June 2020; Environmental Sciences Proceedings. Volume 2, p. 58. [Google Scholar]
  44. Morani, M.C.; Carravetta, A.; D’Ambrosio, C.; Fecarotta, O. A new preliminary model to optimize PATs location in a water distribution network. In Proceedings of the 4th EWaS International Conference: Valuing the Water, Carbon, Ecological Footprints of Human Activities, Online, 24–27 June 2020; Environmental Sciences Proceedings. Volume 2, p. 57. [Google Scholar]
  45. Fecarotta, O.; Cimorelli, L. Optimal scheduling and control of a sewer pump under stochastic inflow pattern. Urban Water J. 2021, 18, 383–393. [Google Scholar] [CrossRef]
  46. Morani, M.C.; Carravetta, A.; Fecarotta, O.; McNabola, A. Energy transfer from the freshwater to the wastewater network using a PAT-equipped turbopump. Water 2020, 12, 38. [Google Scholar] [CrossRef] [Green Version]
  47. Adeyeye, K.; Gallagher, J.; McNabola, A.; Ramos, H.M.; Coughlan, P. Socio-technical viability framework for micro hydropower in group water-energy schemes. Energies 2021, 14, 4222. [Google Scholar] [CrossRef]
  48. Morani, M.C.; Simão, M.; Gazur, I.; Santos, R.S.; Carravetta, A.; Fecarotta, O.; Ramos, H.M. Pressure Drop and Energy Recovery with a New Centrifugal Micro-Turbine: Fundamentals and Application in a Real WDN. Energies 2022, 15, 1528. [Google Scholar] [CrossRef]
Figure 1. Pressure head ( H ) upstream and downstream the PRV.
Water 14 01526 g001
Figure 2. Daily time series of discharge— Q (top) and available stream power— P av (bottom) in the average day of the measured week at the PRV site, with the indication of the standard deviation and min-max intervals.
Water 14 01526 g002
Figure 3. Frequency distribution of the measured discharge, Q (left) and available head drop, Δ H av (right).
Water 14 01526 g003
Figure 4. Cumulated Frequency Distribution (CDF) of the available power ( P av ).
Water 14 01526 g004
Figure 5. Frequency Distribution (pdf) and Cumulated Frequency Distribution (CDF) of the available energy ( E av ) versus the network discharge ( Q ).
Water 14 01526 g005
Figure 6. Scheme of the hydraulic circuit of the PAT booster, with the indication of the pressure measuring points ( P 1 4 ).
Water 14 01526 g006
Figure 7. Booster control unit.
Water 14 01526 g007
Figure 8. Scheme of the test rig: hydraulic circuit and measuring points.
Water 14 01526 g008
Figure 9. Picture of the laboratory.
Water 14 01526 g009
Figure 10. Experimental points and regression curves of the PAT booster of head drop, together with the head drop inside the bypass and the network available head drop, Δ H (top), absorbed/produced power, P T (center) and efficiency, η T (bottom).
Water 14 01526 g010
Figure 11. Output power, P T , for each working point versus the flowing discharge, Q (left) and produced head drop, Δ H T (right) with the indication of the operating PAT.
Water 14 01526 g011
Figure 12. Produced power ( P T ) versus the available power ( P av ), with the contour of the resulting efficiency ( η T ).
Water 14 01526 g012
Figure 13. Percentage of working time of the different operating conditions of the PAT booster.
Water 14 01526 g013
Publisher’s Note: MDPI stays neutral with regard to jurisdictional claims in published maps and institutional affiliations.

