1. Introduction
It is a well-known fact that more than 90% of currently operating geothermal power fields are located in volcanic or magmatic intrusion-related geologic systems [
1,
2]. The Chingshui and Tuchen geothermal fields in Taiwan are among few metamorphic geothermal fields existing in the world. Taiwan is known for its active orogenesis, which resulted from the northwestward movement of the Philippine Sea Plate and its collision with the Eurasian Plate [
3,
4]. The subduction triggered the Okinawa Trough to extend into Taiwan. The latest extension may have just occurred in the last million years, especially in the southwestern part of the Okinawa Trough, which has been characterized by normal faults since the Late Pleistocene [
3,
4,
5]. These young and vigorous activities have been manifested by the existence of abundant hot springs in the Yilan Plain and the northern Central Range, which indicate high geothermal potential [
5,
6]. The exploration of geothermal resources in Taiwan can be traced back to the 1970s. A 3-MWe geothermal energy power plant was constructed in Chingshui, Yilan in 1981, but it was forced to shut down due to the deterioration of efficiency in the early 1990s [
1,
2], mainly due to scaling issues. In 1985, a 260 kWe dual-cycle power generation test system was built in the Tuchen geothermal area to make full use of the thermal energy of the geothermal fluid. In 1994, the project was terminated due to the completion of the phased tasks. With the increasing demand for green energy and shift of national policy, the Chingshui and Tuchen geothermal fields in Yilan have regained attention. However, most of the attention has been paid to the Chingshui area [
5,
6].
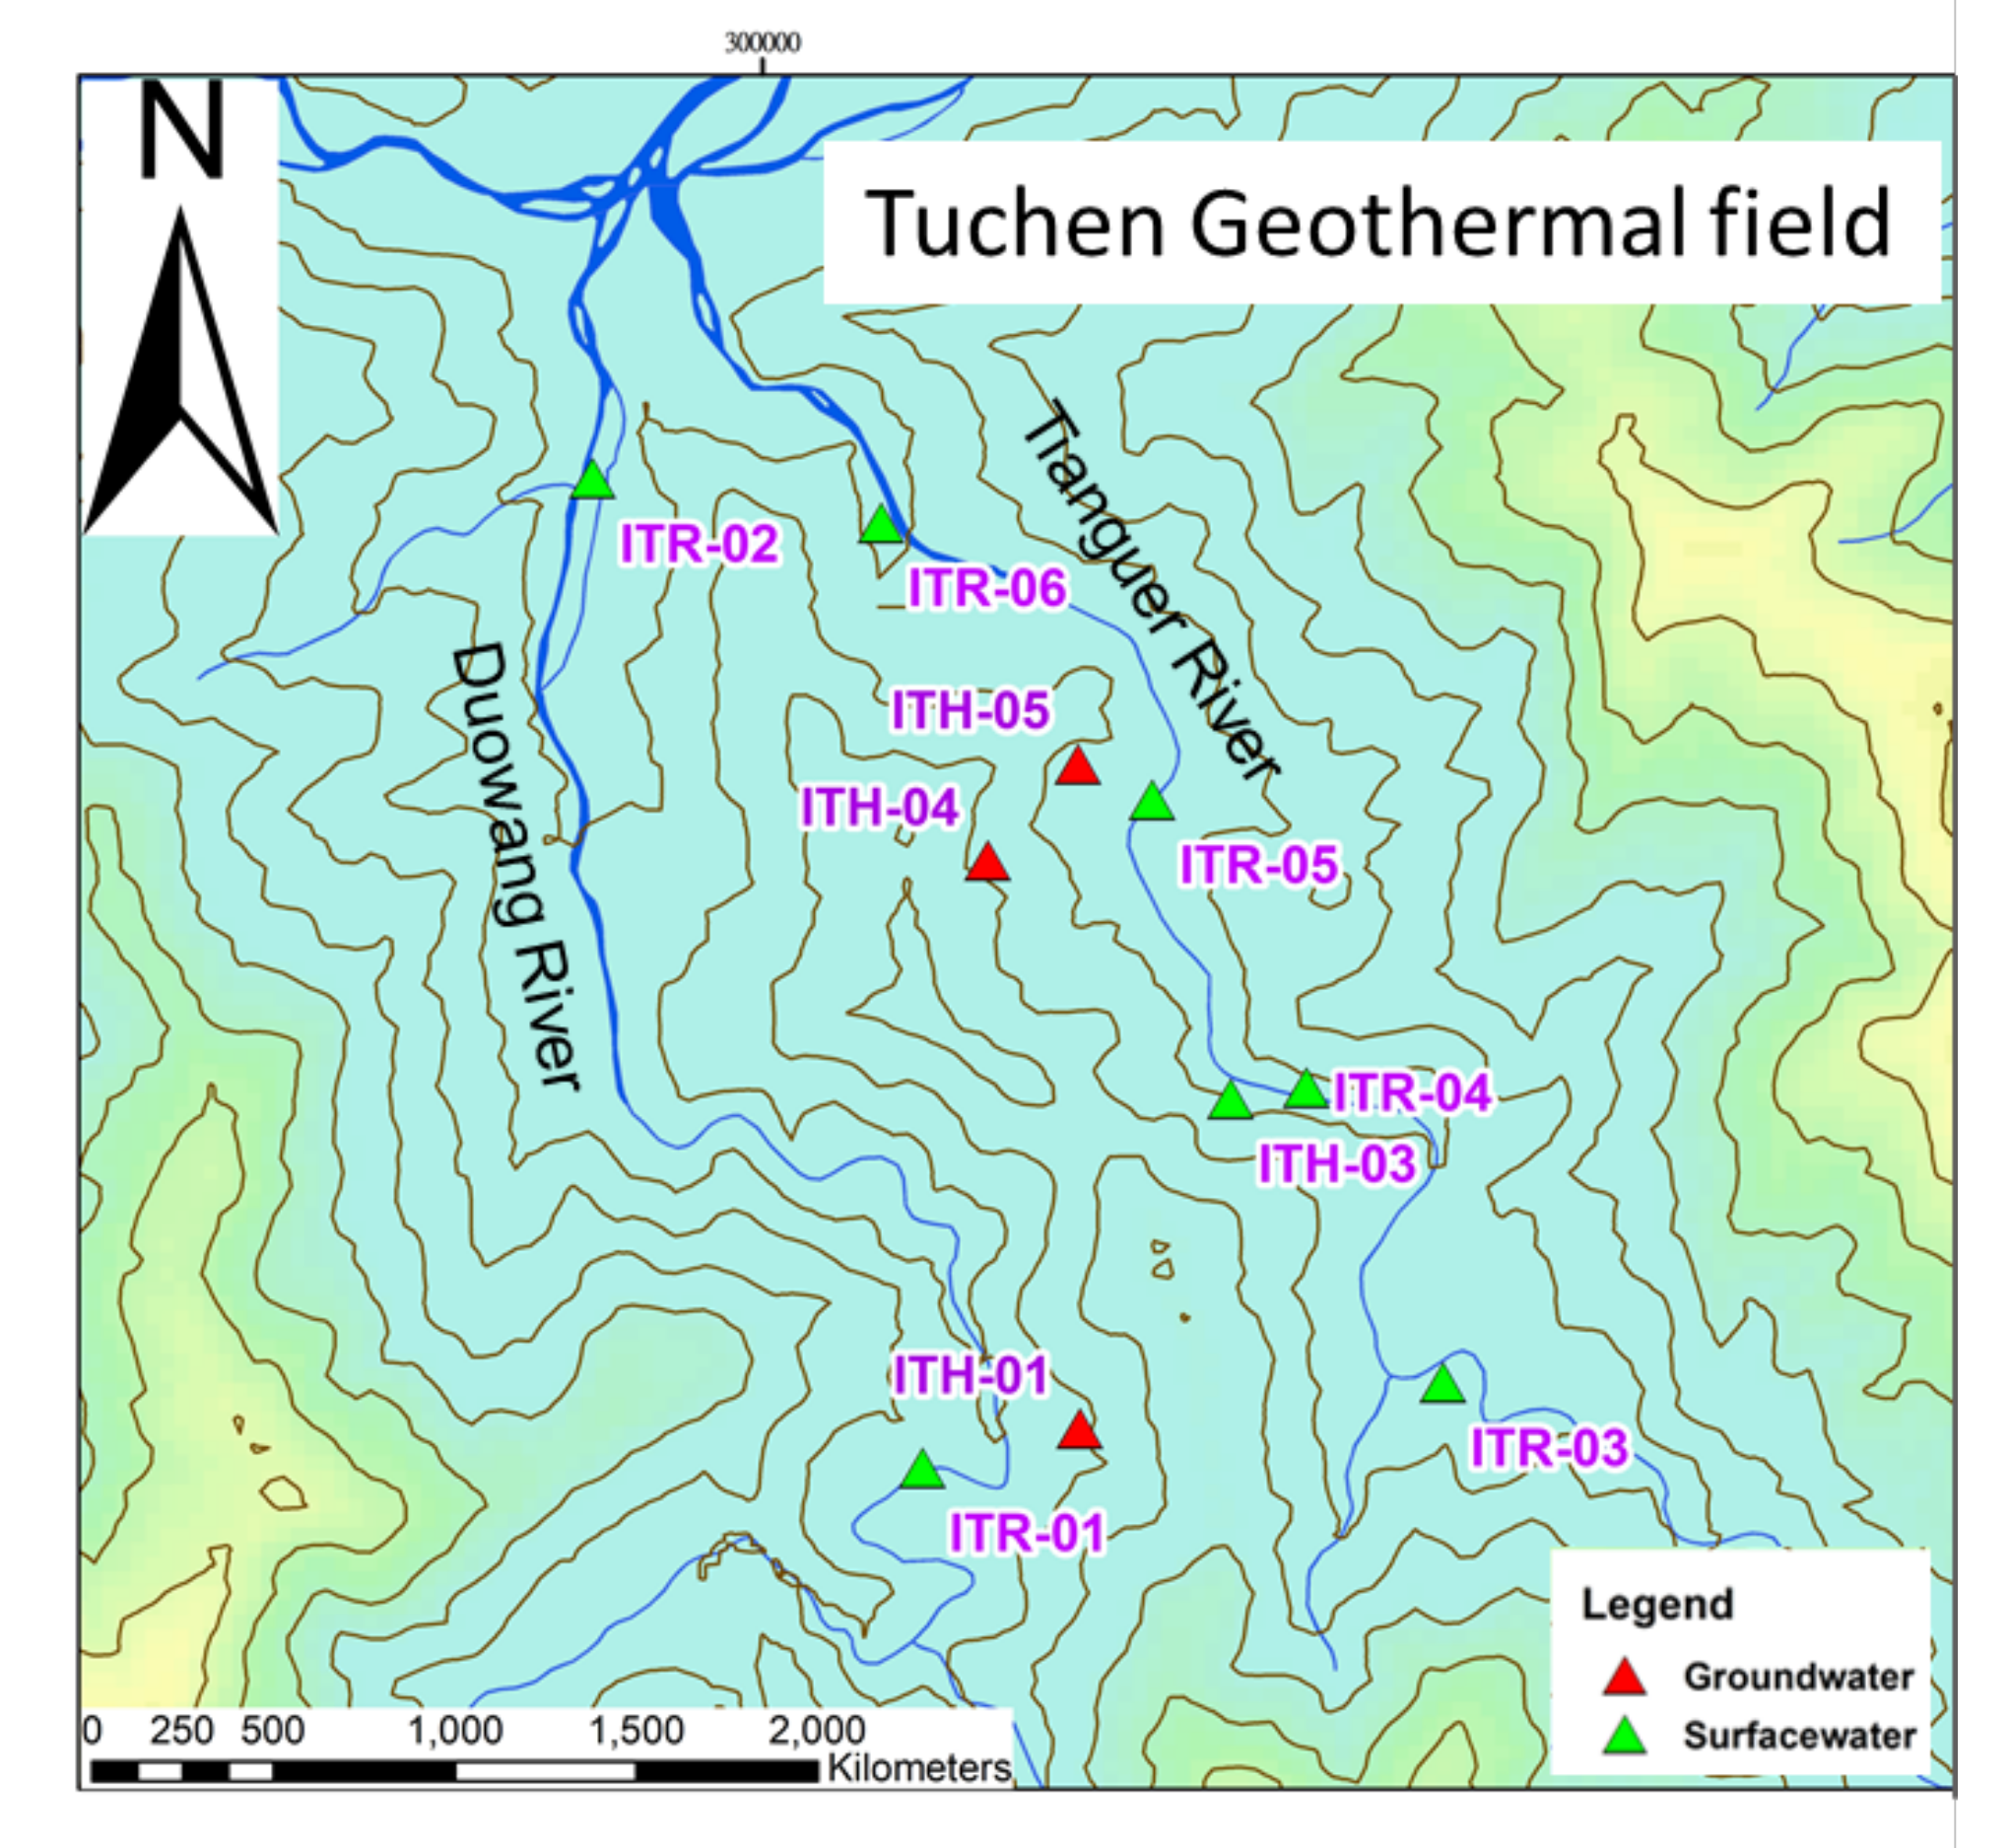
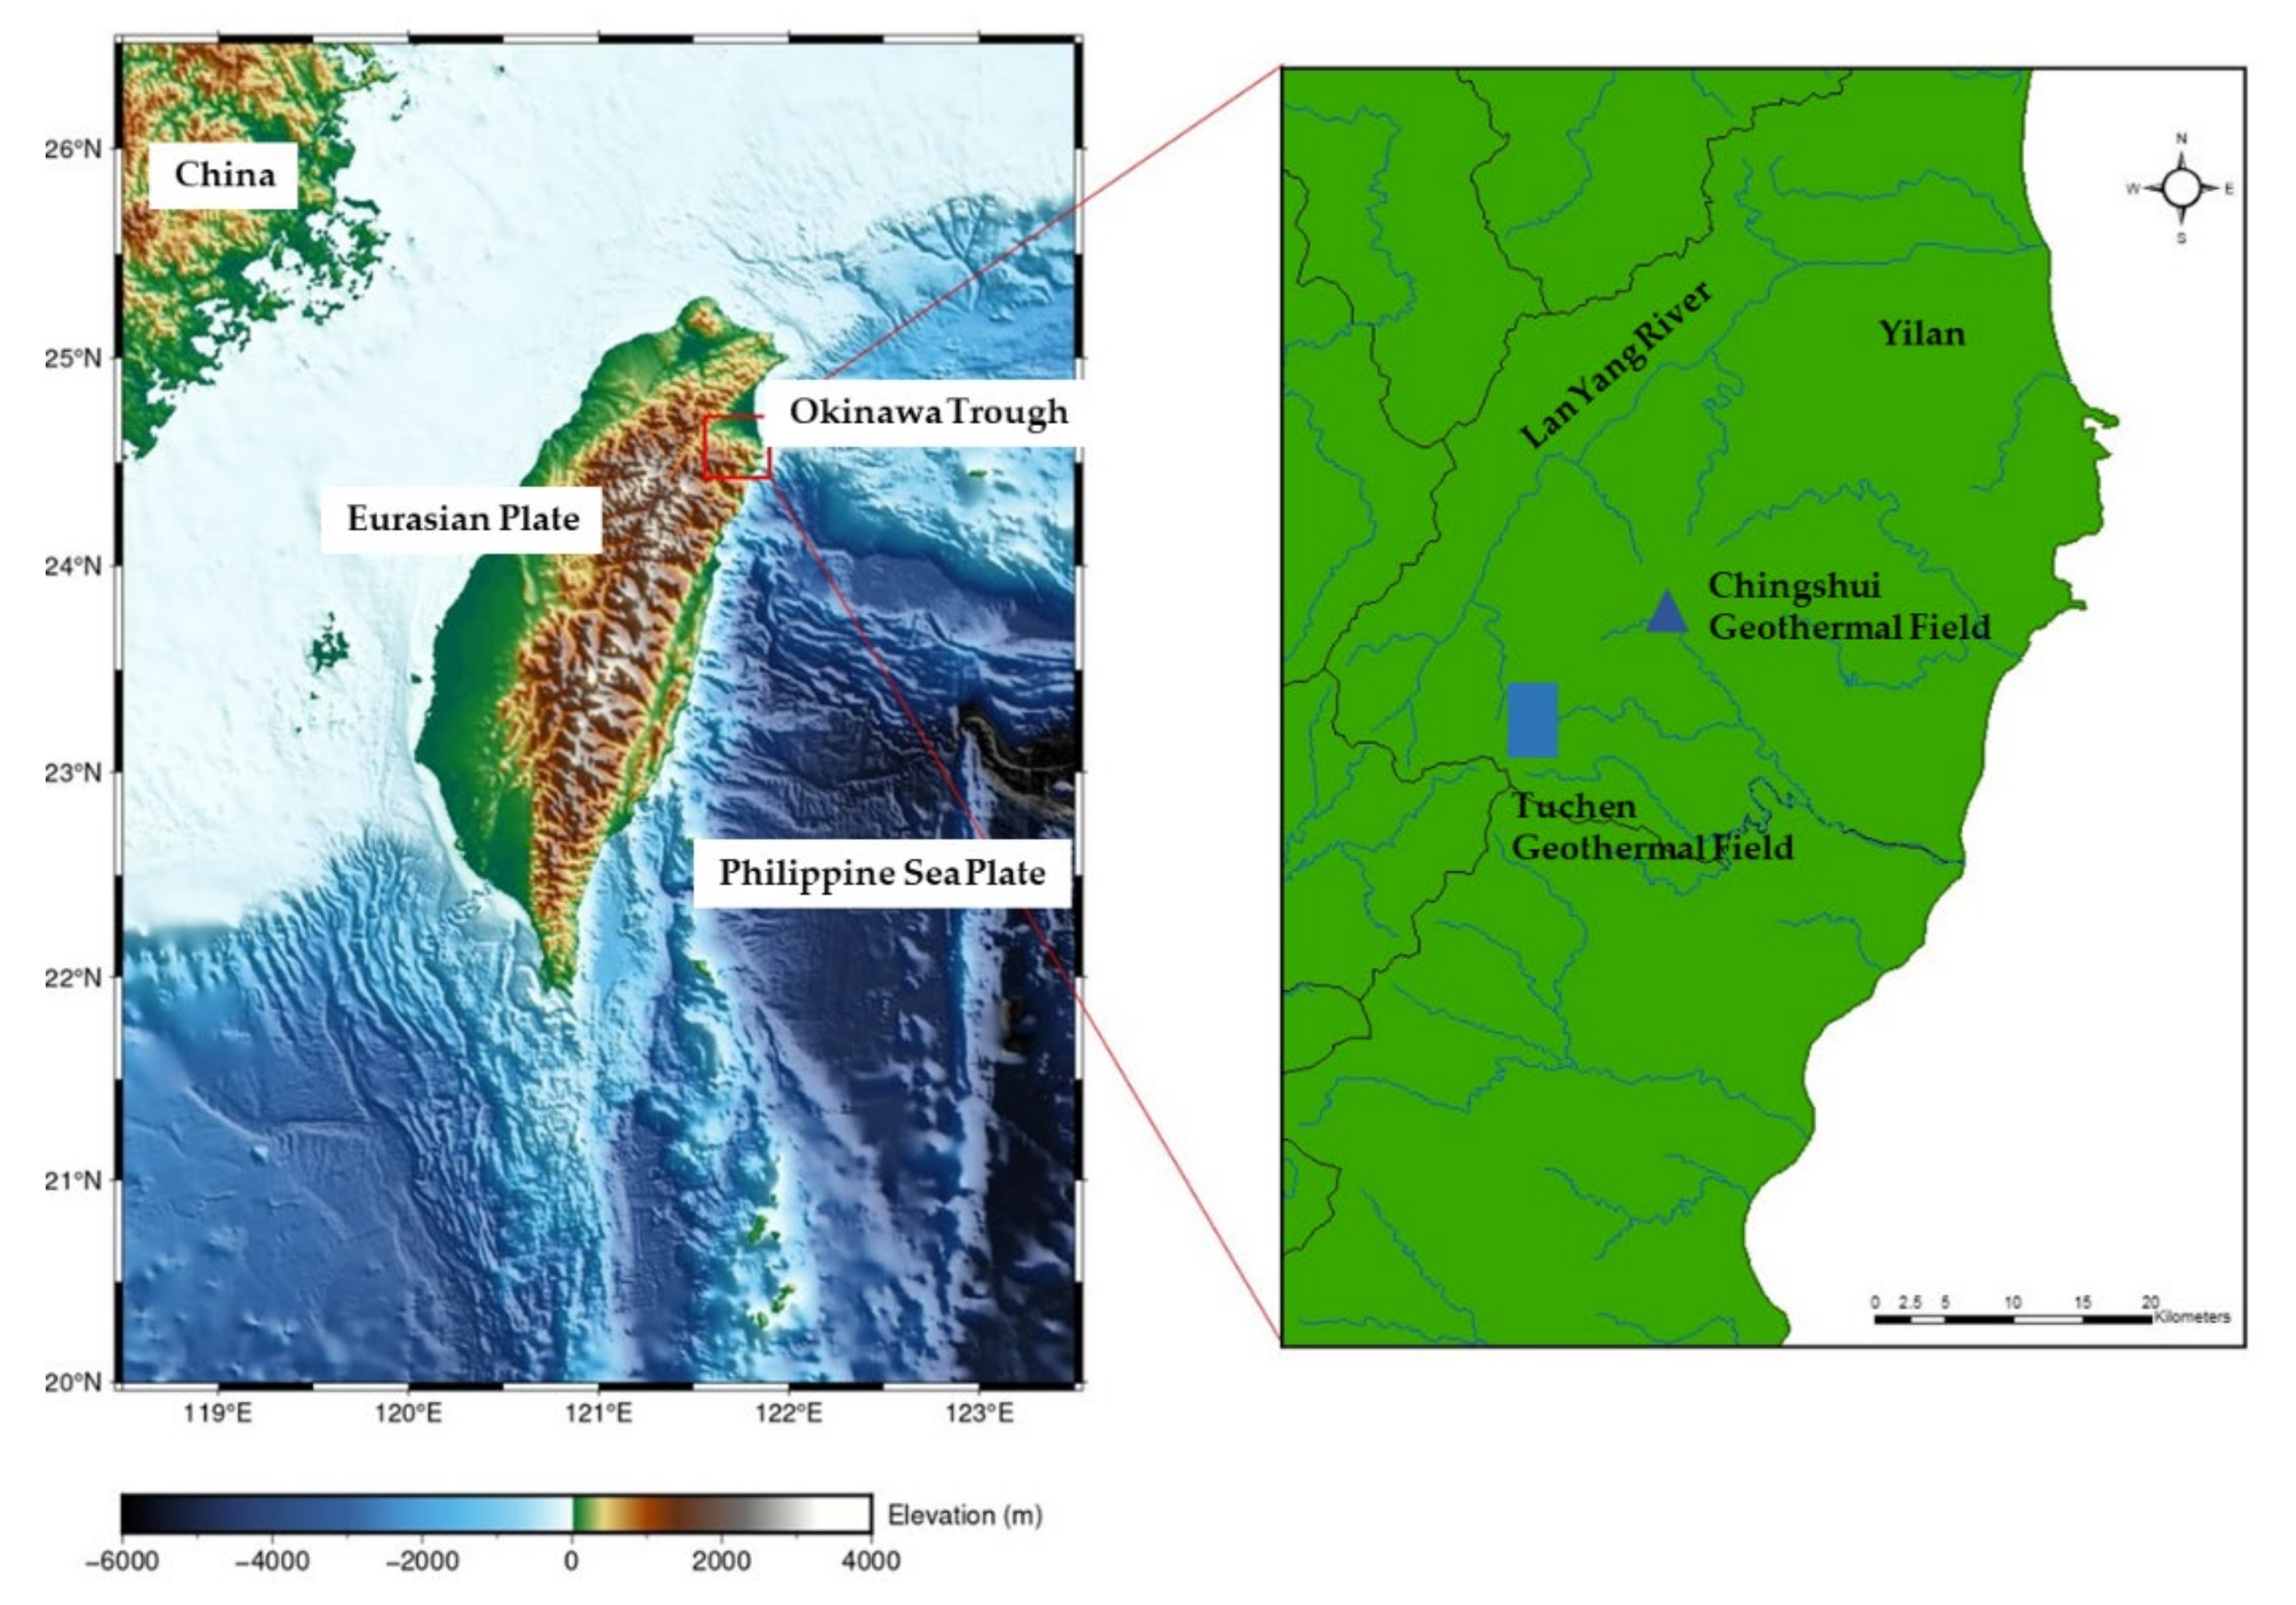
The study area, the Tuchen geothermal field (
Figure 1), is located in the Slate Belt of the northern Central Range of Taiwan, which mostly comprises tight formations that are characterized by low primary porosity [
2,
5,
6]. Thus, the mechanism of how water circulates and bring underground heat to the surface critically affects the duration of the operation of a geothermal field in the metamorphic region [
5]. Therefore, the main objective of this study is using stable isotopes data to characterize subsurface water circulation with help from the estimation of mean residence time from two wells, one 160 m and the other 2200 m deep.
The isotopes of oxygen and hydrogen have long been considered as an ideal tracer due to their ineffectiveness, which is not affected by interactions with aquifer material [
7]. They have demonstrated their usefulness in thermal water for various issues, such as the origin of thermal water and mixing and flow paths [
7]. In general, the isotopes of thermal water are characterized by the relative constant of deuterium values with a general shift of oxygen-18 values to higher values. Generally, the shift is interpreted by water–rock reactions [
7]. On the other hand, the hydrogen content of rock in the crust is generally low, compared to that of oxygen, and is not sufficient to exchange the hydrogen isotopic composition. In addition, boiling and dilution may also cause deuterium and oxygen-18 to vary significantly in high-temperature geothermal systems, as water moves to the surface. This was first reported by Truesdell et al. (1977) [
8] in a study on the Yellowstone geothermal systems, USA. Stable isotopes have also been used to indicate mixing processes and origin of recharge [
9] and have been applied in numerous related studies worldwide [
10,
11,
12,
13]. Oxygen and hydrogen isotopes are also employed to delineate different groundwater systems by their spatial and temporal distribution characteristics [
14,
15] for geothermal explorations and other catchments. But only few studies have been carried out in metamorphic geothermal fields in Taiwan, and most of them are concentrated in the Chingshui geothermal field. It has been suggested that Chingshui geothermal field has fault-related water circulation that brings heat to the surface [
16,
17,
18]. Kuo et al. (2018) [
18] attempted to characterize the water flow pattern in a metamorphic shallow geothermal system in Yilan, Taiwan.
Stable isotopes have long been commonly considered as conservative, naturally occurring tracers, making them reliable tracers for the further probing of subsurface flow processes [
19,
20,
21,
22,
23,
24,
25,
26] and for delineating different groundwater systems. Seasonal variations of stable isotopes in precipitation and groundwater have been applied to estimate the mean residence time (MRT) in catchment scales for years [
27,
28,
29,
30,
31,
32]. The (MRT) can be viewed as the average time water spends in a subsurface system before it arrives at a designated point. Stable oxygen (
18O/
16O) isotopic characteristics not only provide insights for identifying hydrological sources and flow paths but can even be used to estimate mean catchment residence times [
29,
30,
31,
32]. Most estimation methods are based on models presented by Maloszewski and Zuber (1982) [
21]. They applied a lumped parameter approach using 18O or D input signatures and response function models. In order to successfully estimate the mean residence times of subsurface water, groundwater should be sampled at least four times a year, but monthly samples are more likely to show the maximum groundwater variation [
33]. Most studies have put the focus on storm-related events and small catchments for mean residence issues [
30,
31,
32]. This paper attempts to use δ
18O as a natural tracer to estimate the MRT of groundwater in geothermal fields in Taiwan to provide insight into hydrological pathways in the metamorphic geothermal fields in Taiwan. This paper adopts the method developed by Clark and Fritz (2006) [
34] McGuire et al. (2003) [
32] and Reddy et al. (2006) [
14] and use it to estimate the MRT of the study area.
The Study Area
Located in the Ring of Fire (circum-Pacific belt), Taiwan possesses rich geothermal resources due to dynamic plate collision and volcanic activities. The Philippine Sea Plate subducts beneath the Eurasian Plate in Northern Taiwan, forming the the Ryuku Arc [
3,
4,
5]. The westward Okinawa Trough extending to the Yilan Plain results in a heat source for the region. To the south of the Yilan Plain, the northern Central Range has undergone a transition from a tectonic compressional regime to an extensional one [
4]. These activities are particularly pronounced in northern Taiwan, where is located in a collapse/subduction zone based on geophysical data and regional tectonic models [
34,
35]. In this region, the existence of abundant hot springs indicates high geothermal potential in the Yilan Plain and the northern Central Range [
6]. The primary heat source of the geothermal systems of the northern Central Range is believed to be the high-temperature metamorphic rocks in the rapidly uplifted mountain belts [
36]. The study area, Tuchen geothermal field, is located in northeastern Taiwan in the Backbone Range, which is mainly composed of Miocene slate. This Tertiary slate belt extends with a nearly N–S orientation for several hundred kilometers along the west flank of the Central Range [
5]. Several natural occurring hot springs can be found along the Tianguer River and Duowang River as well as geothermal wells in the study area. These hot springs and wells are located in the Lushan Formation, which is divided into three formation members from young to old including the Jentse member, Chingshuihu member, and Kulu member based on lithological differences [
37,
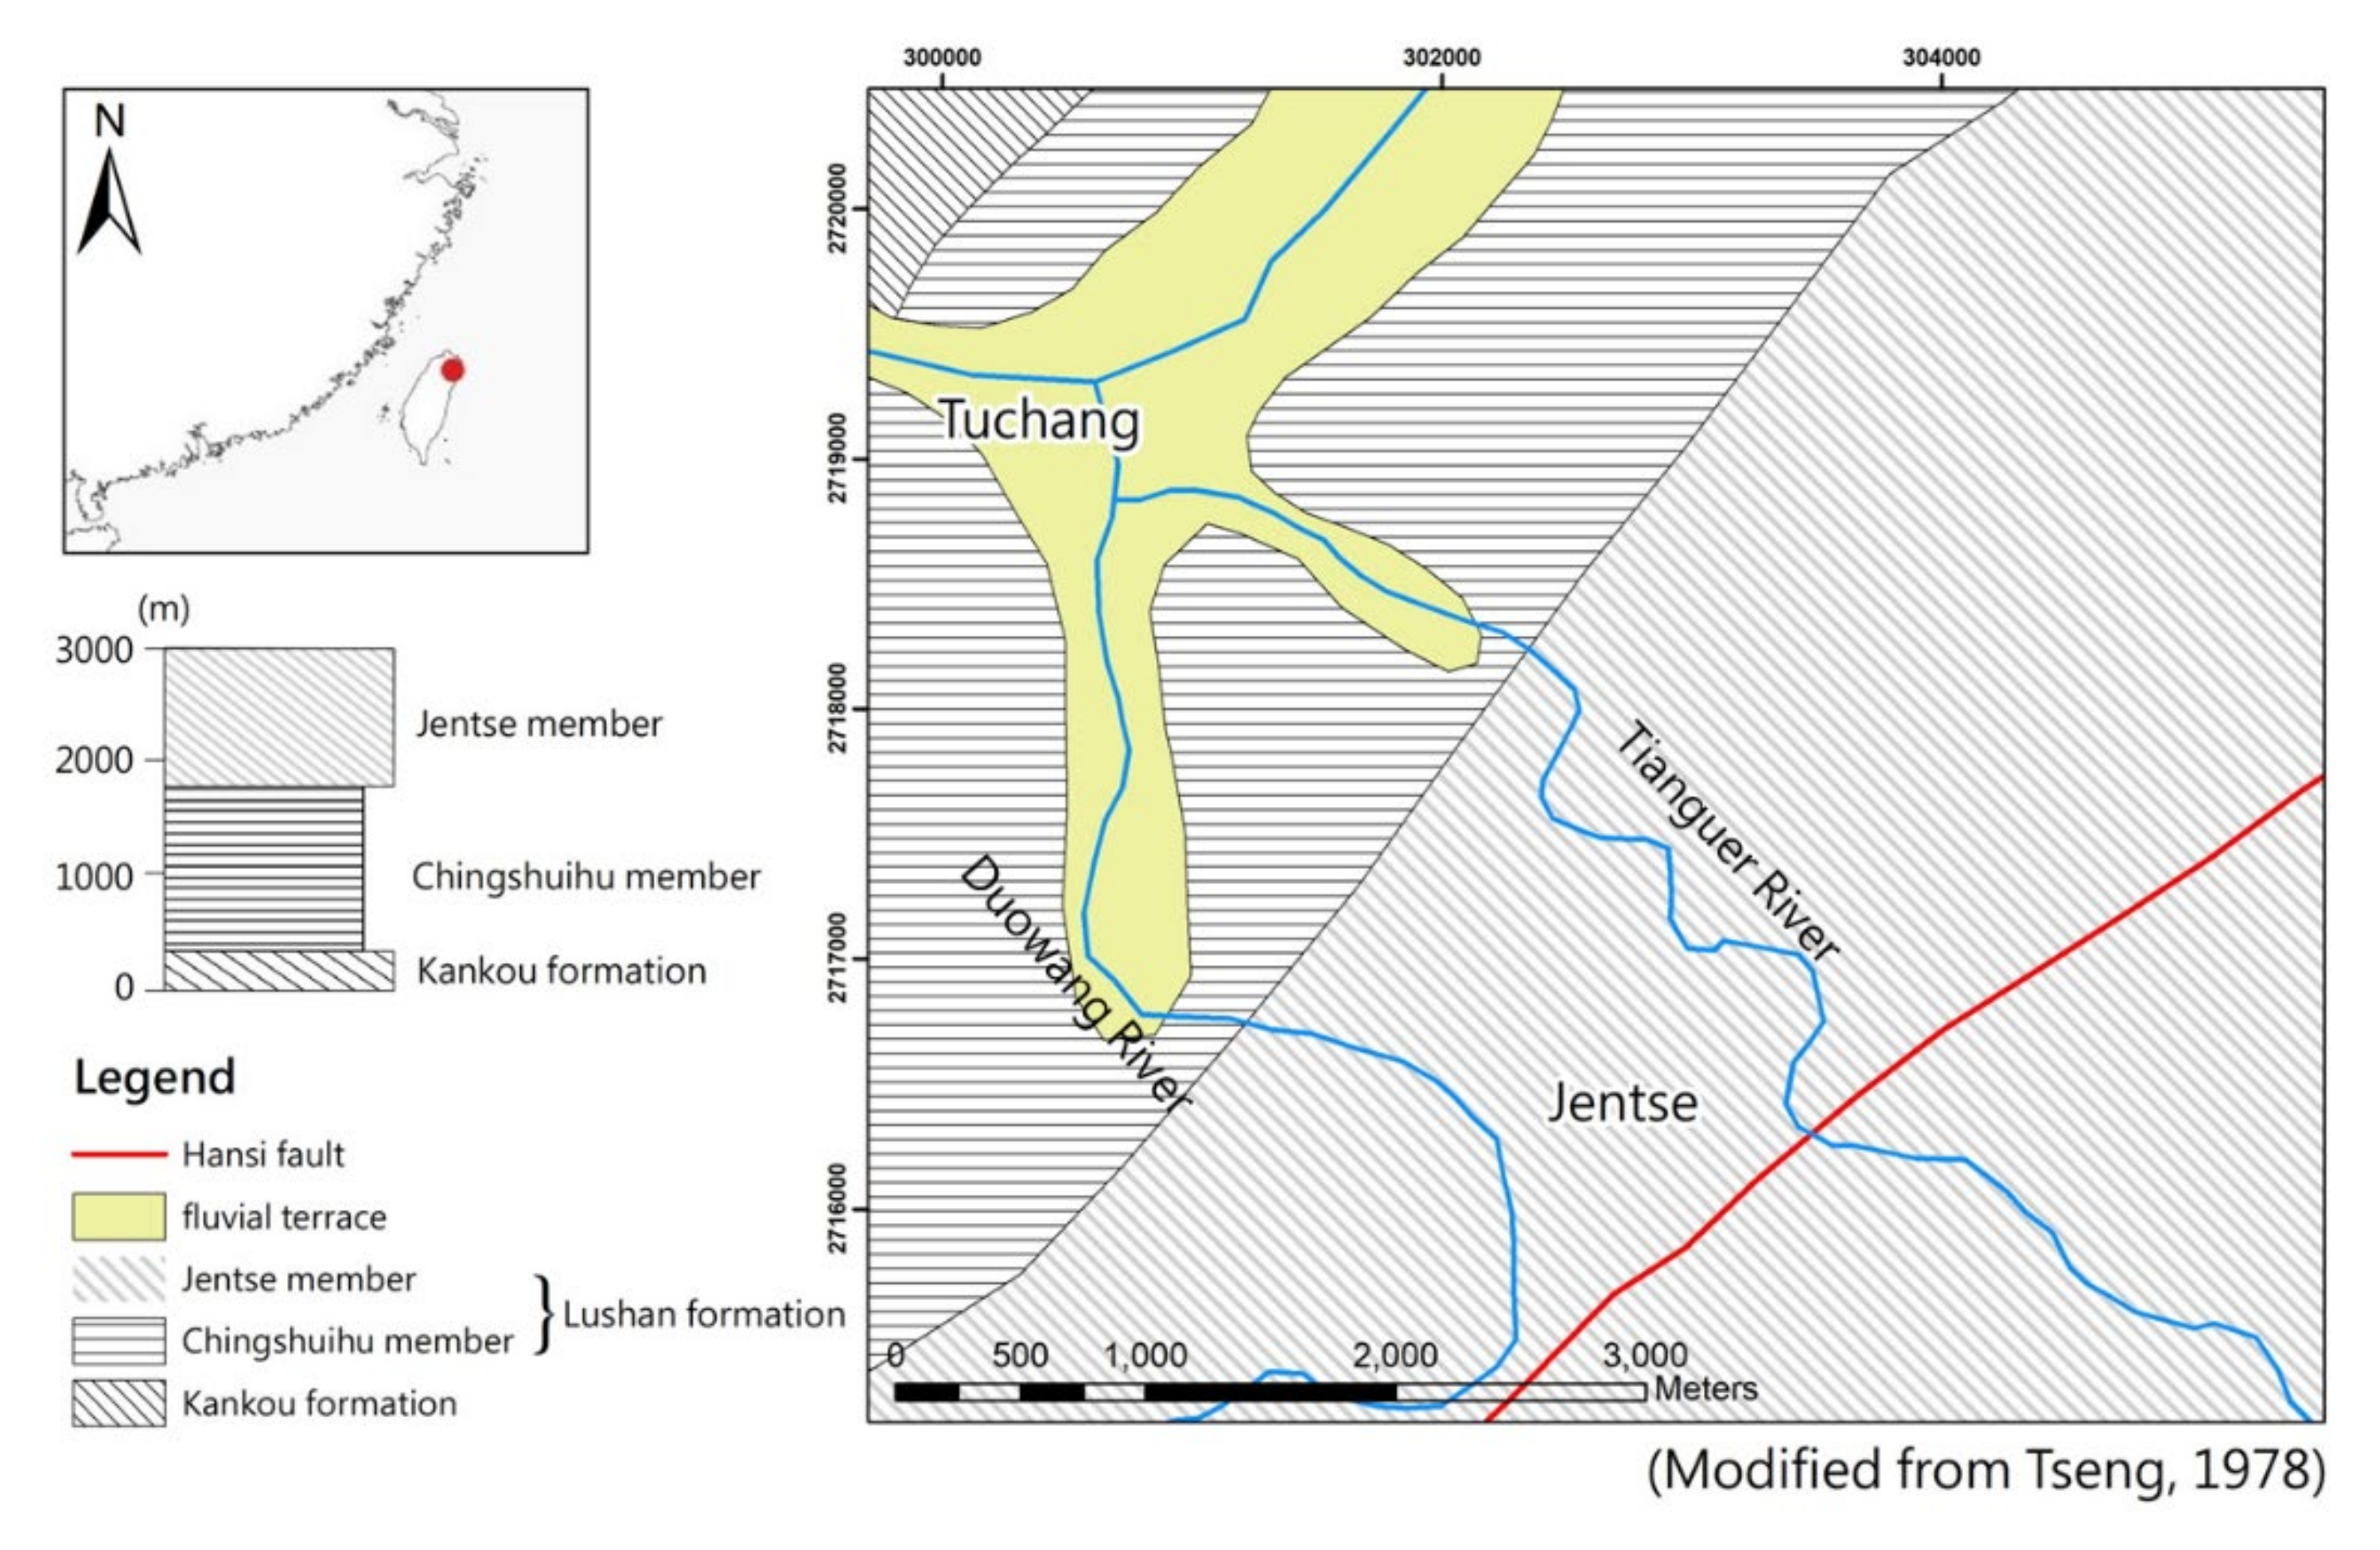
38], but only the Jentse member and Chingshuihu members are exposed in both Tianguer river and Duowang river watersheds. The Lushan Formation in Miocene overlies the Kankou formation (
Figure 2). The Chingshuihu member and Kulu member are composed of slate or phyllite. On the other hand, the Jentse member is composed of alteration argillite and low-degree meta-sandstone. In the study area, the exposed formations strike approximately NE–SW, N30–70 °E and dip 30–90 °SE. Some steeply dipping or overturned beds are observed near faults [
5].
Tseng (1978) suggested that the Hansi and Jentse faults are the major tectonic features with many fractures and minor folds in the study area (
Figure 1) [
39,
40]. Chen et al. (2021) [
5] suggested the fault system is composed of both permeable fault cores marked by porous fault breccia and damage zones characterized by a large number of open-fracture planes that could serve as the major conduit for geofluids to flow in the region [
38] (
Figure 1). Liu et al. (2015) suggested that the temperature of the geothermal systems in the northern Central Range is in the range of 200–230 °C at depths of 2000–3000 m [
6]. Tong et al. (2008) also suggested that the heat source may be a deeper magma-related one in this area [
18].
Typically, rain becomes depleted in the heavier isotopes with increasing altitude due to decreasing temperature and rainout of the air mass [
14,
34]; thus, a strong negative correlation between increasing altitude and isotope enrichment is found in several regions [
41,
42,
43]. This relationship makes the estimation of the recharge altitudes of groundwater discharged in a homogeneous geological setting a relatively straightforward exercise [
44].
Liu et al. [
6] proposed a water circulation conceptual model based on oxygen and hydrogen isotopes. This model depicts the water circulation in Chingshui and Tuchen geothermal which comes from the nearby mountain and is transported to the surface along faults. They used a correlation relationship based on isotopes differentiation with altitude to estimate the local thermal groundwater recharge altitude. The equations used for this estimation are δD = −3.3 × 10
−2h − 22 and δ
18O = −4.1 × 10
−3h − 5.2 and indicate that water originates from nearby 1090-meter mountains. This single water circulation framework has been carried out for geothermal exploration and other related issues [
17,
18] for years. For examples, Tong et al. (2008) [
17] used magnetic survey results to interpret a low magnetic zone below the Chingshui geothermal field. A two-heat reservoir model was provided by using MT [
29]. Fan et al. (2005) [
17] and others used a conceptual model with a single groundwater circulation to simulate scenarios related to geothermal exploration. Chen et al. (2021) proposed that Jentse geothermal area water circulation is mainly controlled by fault- related fractures. It is thus worth using isotopes to further understand the regional water circulation pattern.
2. Materials and Methods
Water samples were taken from 10 sites, including shallow rivers, at 100 m and more in depth, and deeper, at 2000 m in depth, groundwater, and some shallow artesian wells, at a frequency of once a month, and their stable oxygen and hydrogen isotopes (
Figure 3) were analyzed by Picarro L-2130i at Chinese Culture University, Taiwan. USGS standards were used for calibration to VSMOW. The sampling duration starts from October, 2018 and ends in April 2020. For detailed description and location, please refer to
Table 1 and
Figure 2.
Since stable isotopes can be considered as ideal tracers, carefully examining the result and proper technique application can retrieve spatially integrated information about catchment mixing that is relevant at all scales [
45]. These data often provide complementary information to traditional flow measures at the catchment outlet for quantifying water flow paths [
46]. The MRT of a catchment provides a simple descriptor of the effects of storage and mixing within the catchment in terms of its temporal response to precipitation inputs.
The fundamental concept of the mean residence time using stable isotopes is that the seasonal variations of isotopic signatures can be described as a sine function. The time series of its distribution can then be described as
where mean(δ
18O) (‰) is the annual mean δ
18O, A (‰) is the seasonal amplitude of δ
18O, b is the period of the seasonal cycle (i.e., 365 days), t (days) is time, and c (radians) is the phase lag. Parameters in Equation (1) mean(δ
18O) (‰), A and C) were calculated by fitting Equation (1) to measured experimental data by regression analysis. This study adopts the curve-fitting algorithm of SigmaPlot software. Marquardt–Levenberg method was used to find the values of model fitting parameters that result in the smallest value of the sum of the squared residuals between model output and data measured. MRT, then, can be estimated for surface and groundwater by the equation [
14,
18]
where Ap is the seasonal amplitude of δ
18O for precipitation, and b’ is a conversion factor [
22].
3. Results
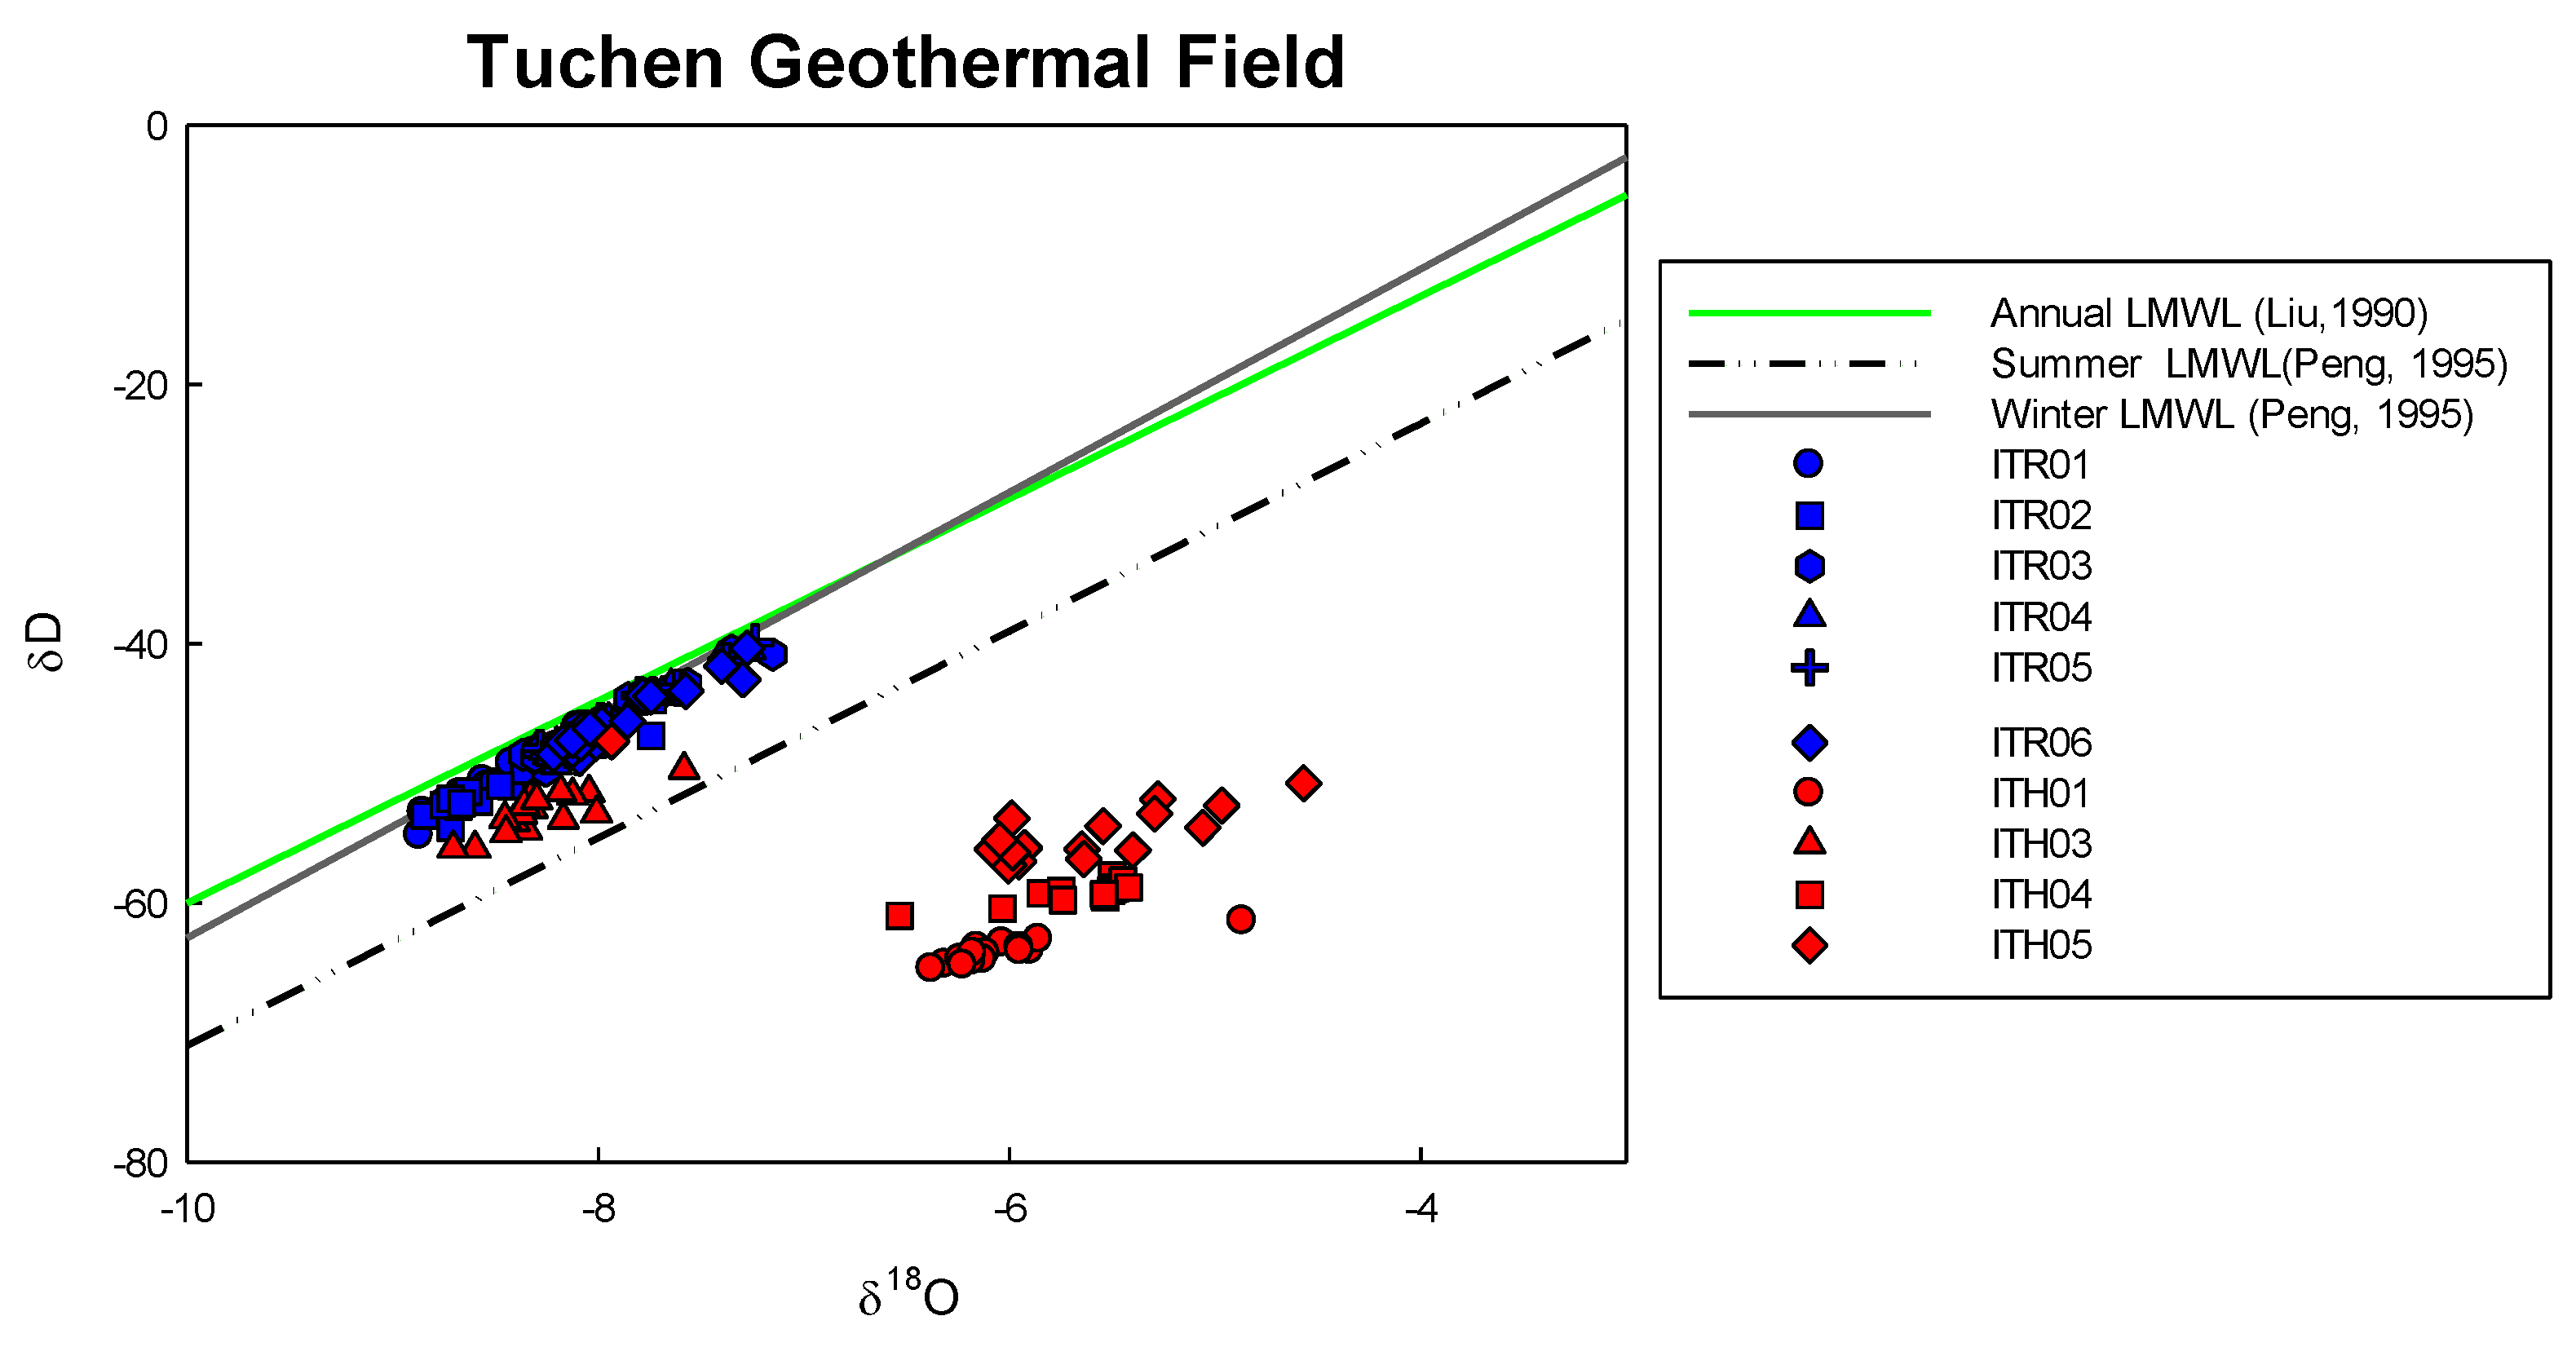
The plot of the δ
18O and δD isotopic compositions of thermal water and surface water on the local meteoric water line (LMWL) shows the close relationship with the meteoric water (
Figure 4), yet a 2‰ shift in thermal water was evident with relatively constant δD values.
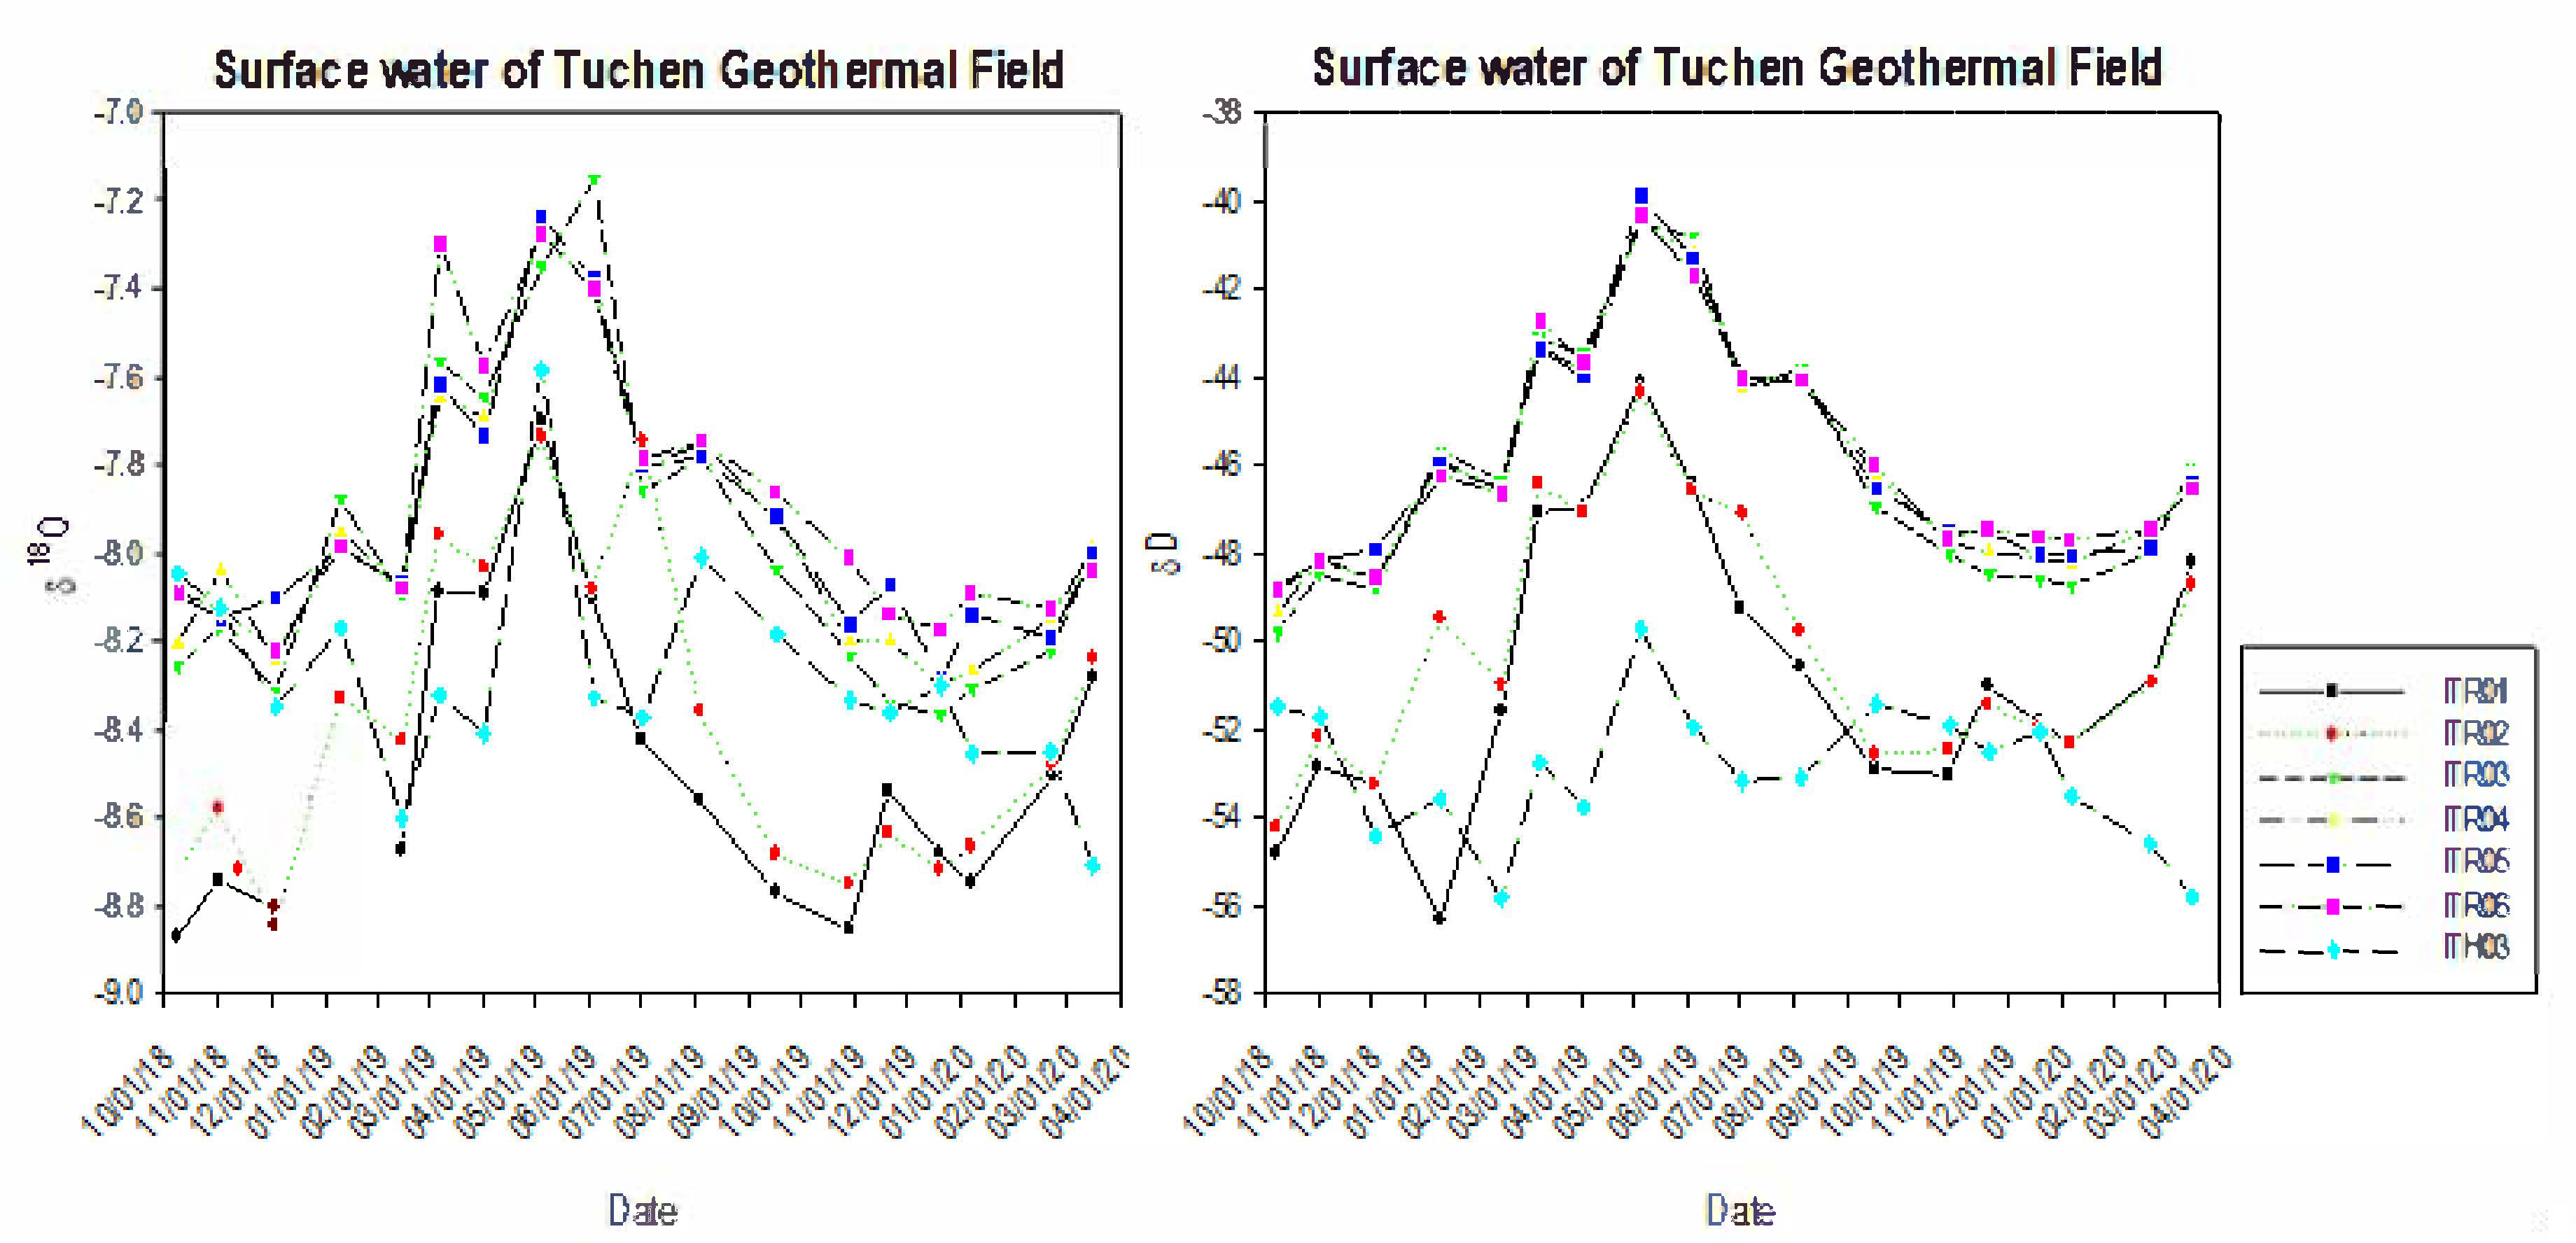
Temporal variations of the δ
18O and δD of the surface water in the study area are shown in
Figure 5. Δ
18O values are between −7.2 to −8.9‰. Values of ITR01, 02, and 03 are heavier than the rest. All surface water samples exhibit the same variation pattern, heavier values between March and July, and lighter values in the rest of year. Despite the fact that ITH03 is a hot spring water, it behaves similarly to surface water, so we have plotted it with surface water. The characteristics of ITH03 comes from the fact that the artisan well mixes with surface water. It erupts right after heavy rainfall, and it ceases to erupt after a long period of dry season.
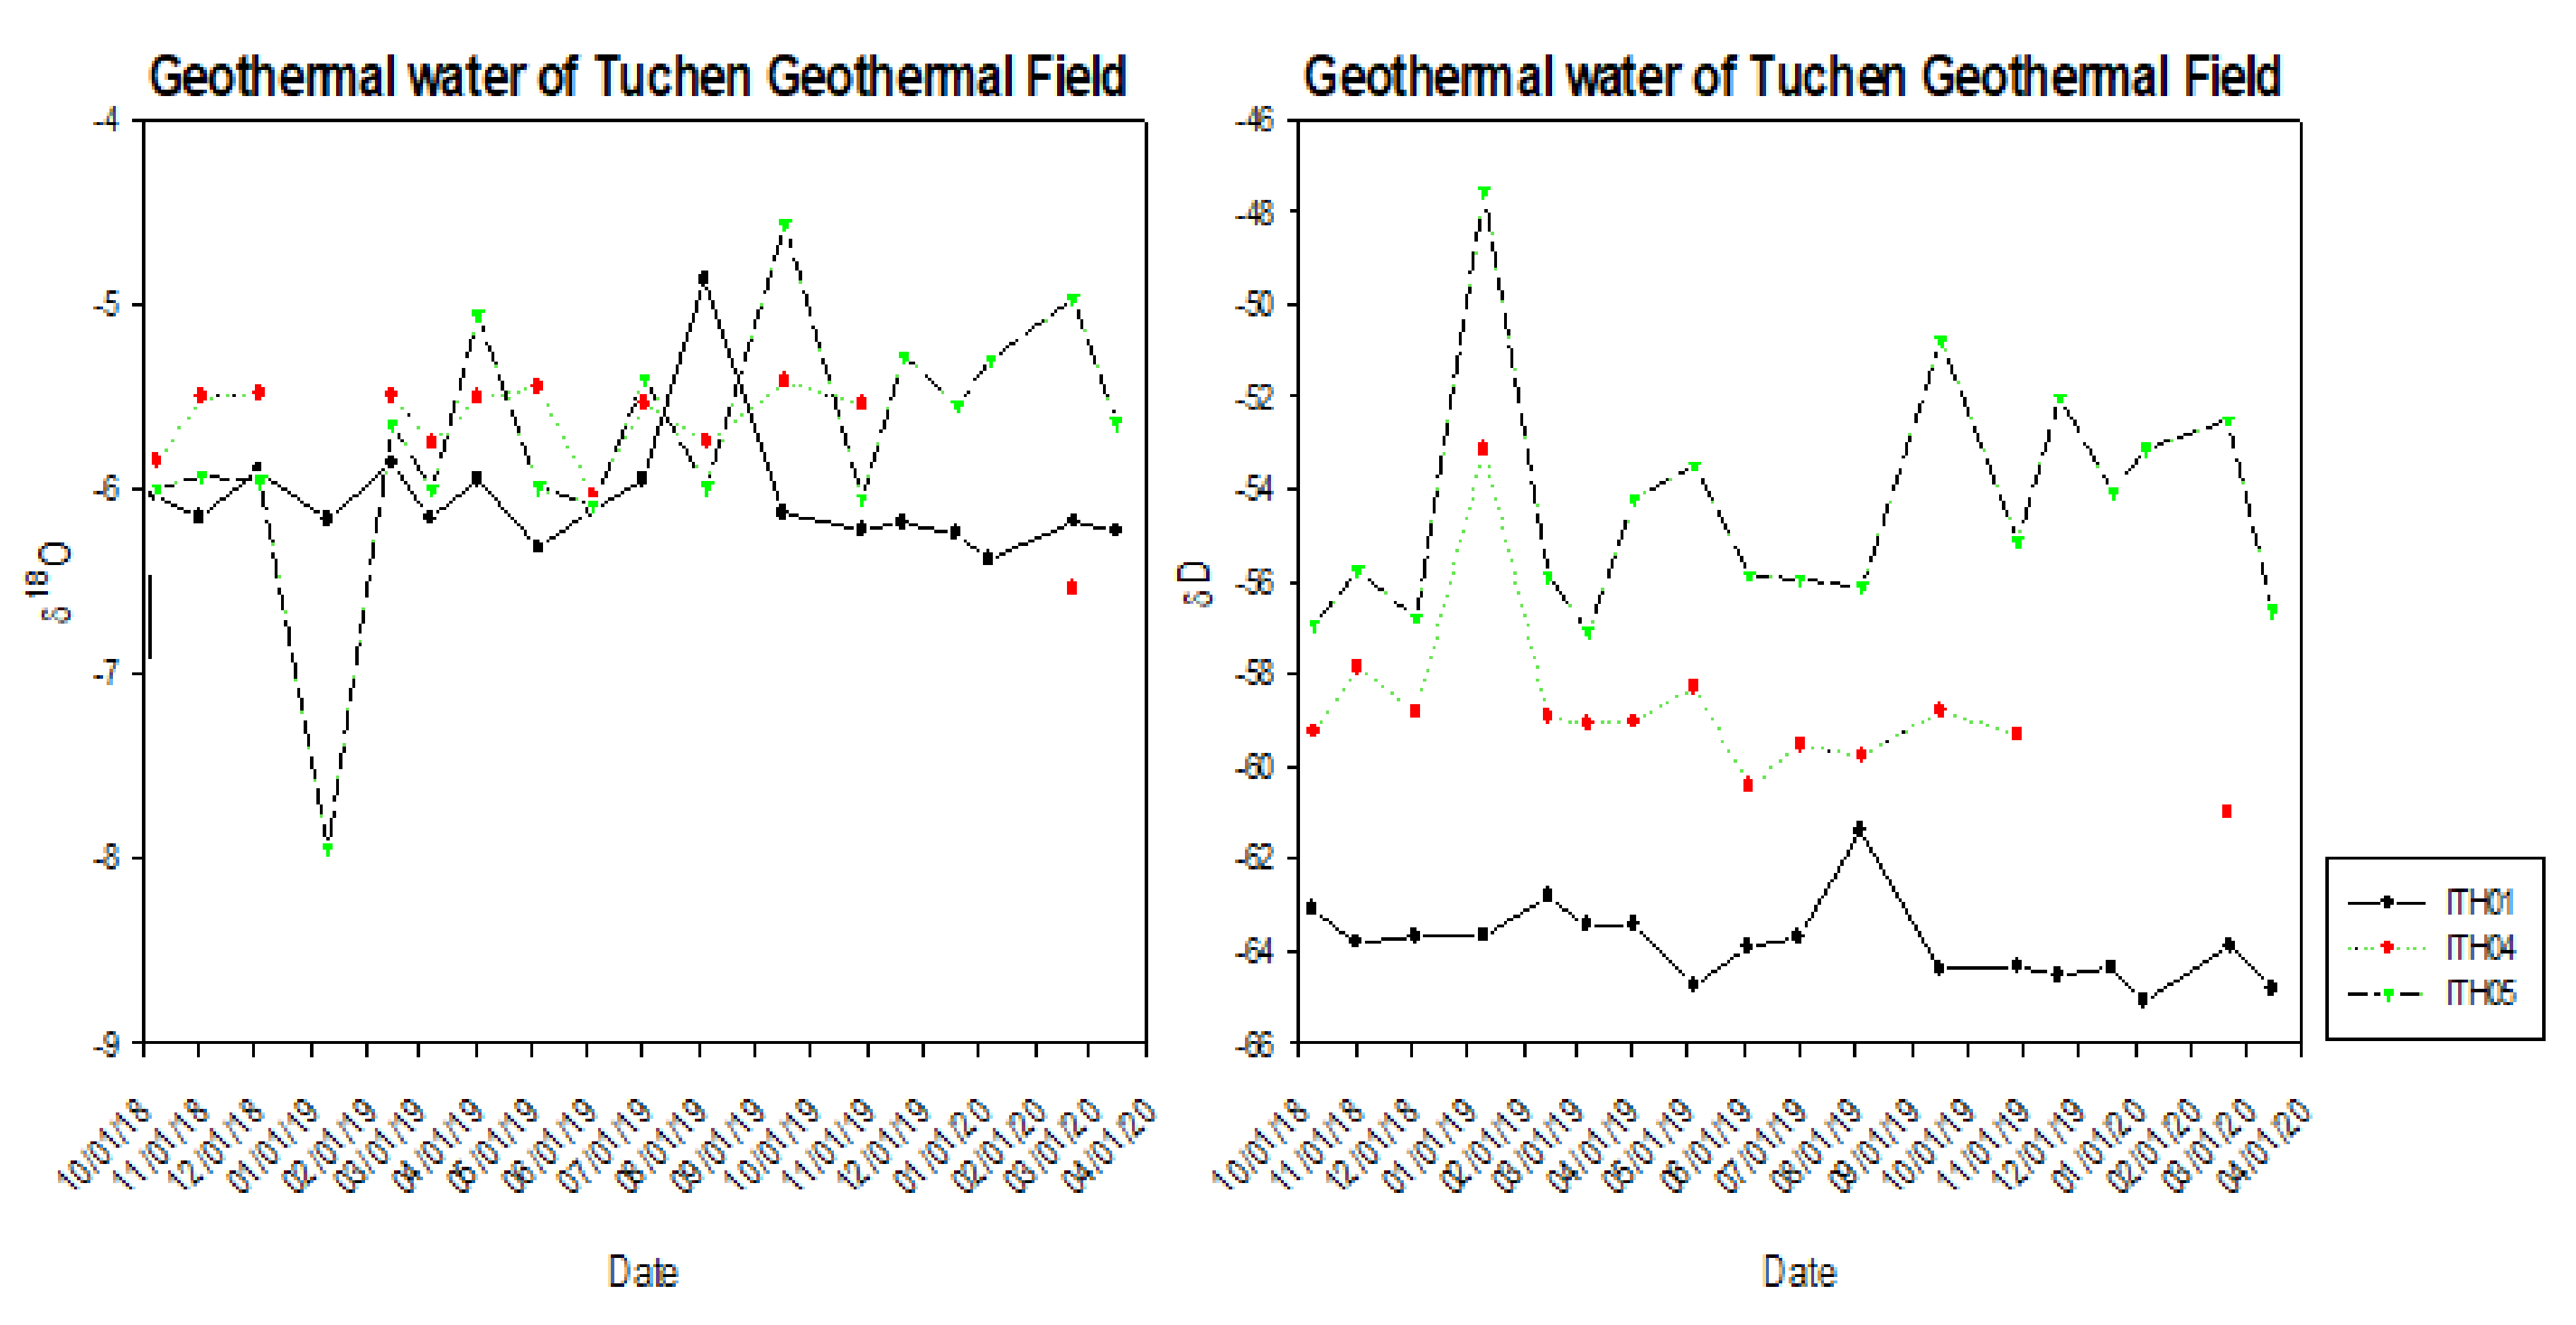
On the other hand, the time series of δ
18O and δD of thermal water in the study area are shown in
Figure 6. The variations of δ
18O values are between −5.5 and −8.5%, and the variations of δD values are between −51 and −64%.
The mean δ
18O and δD values for winter and summer are presented in
Table 2 and
Table 3 for thermal water and surface water, respectively.
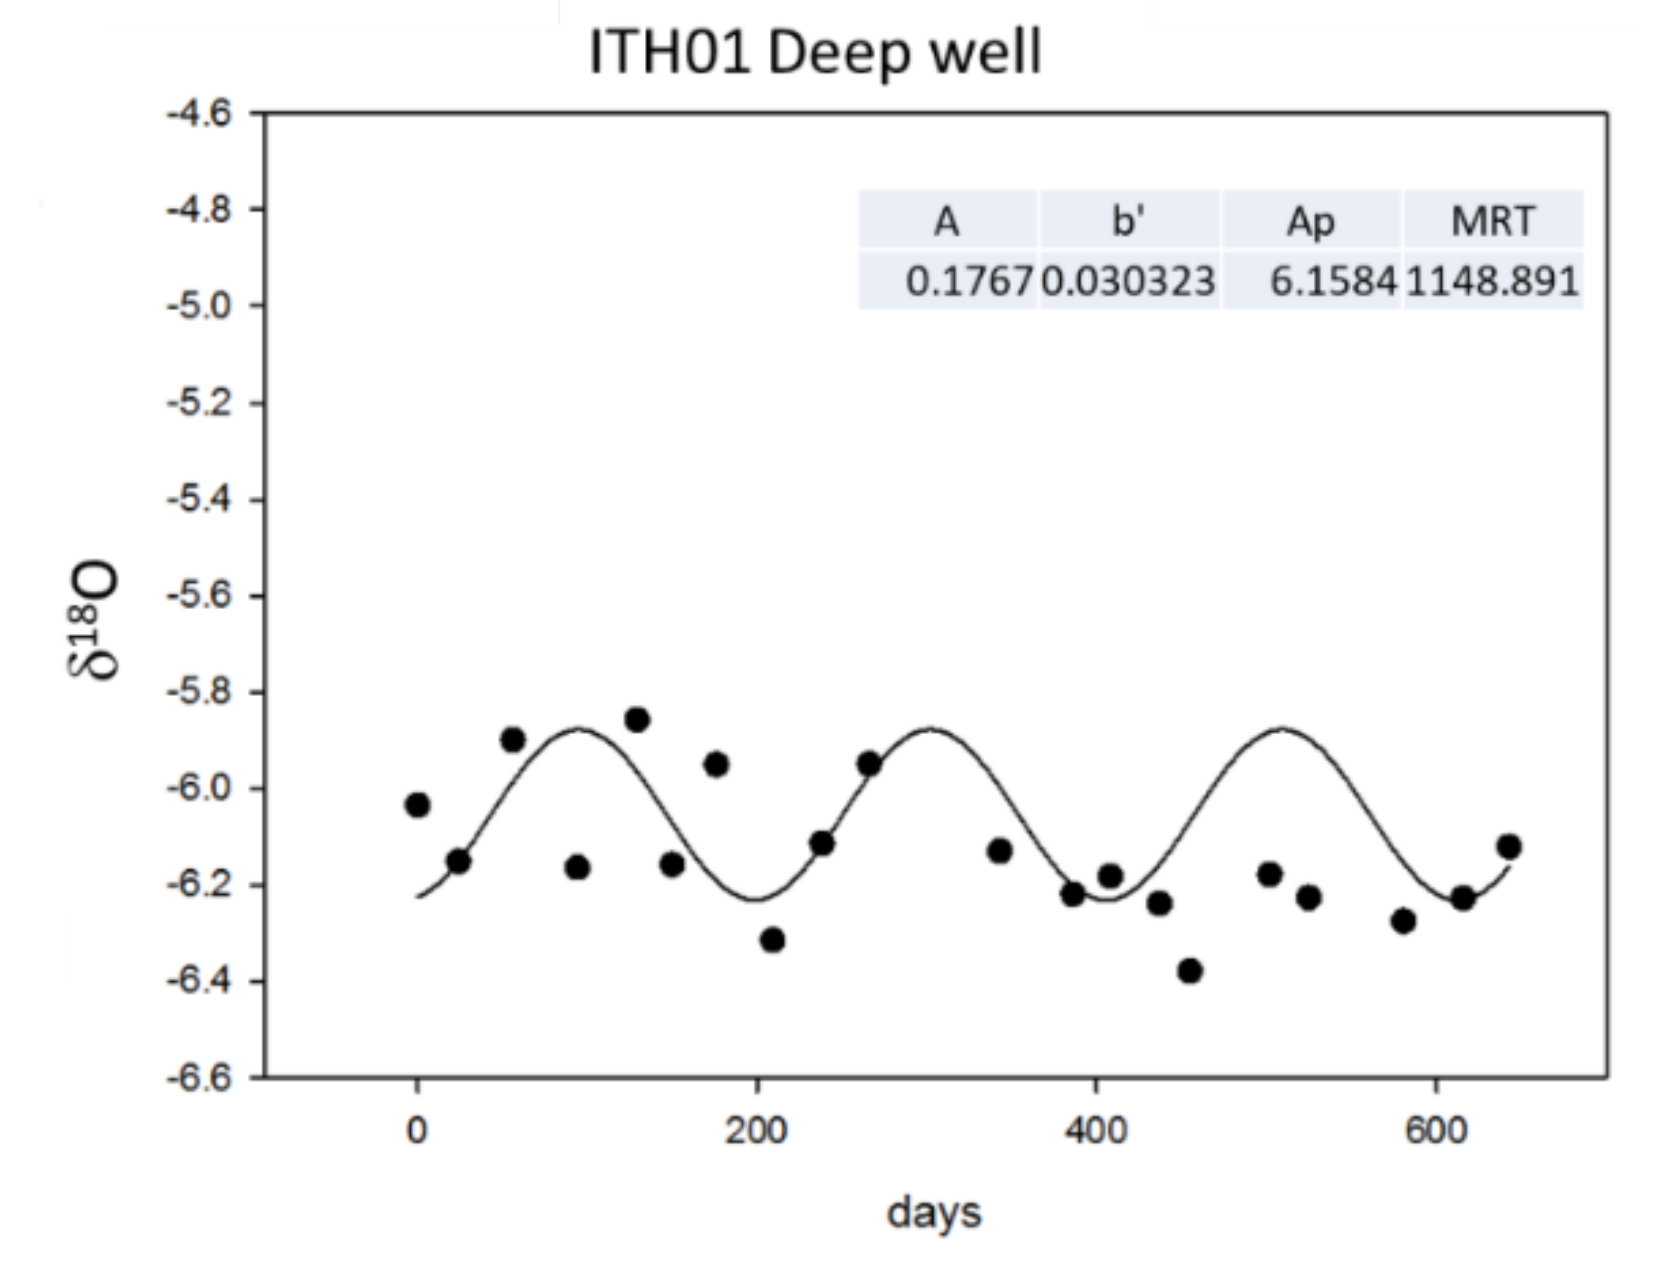
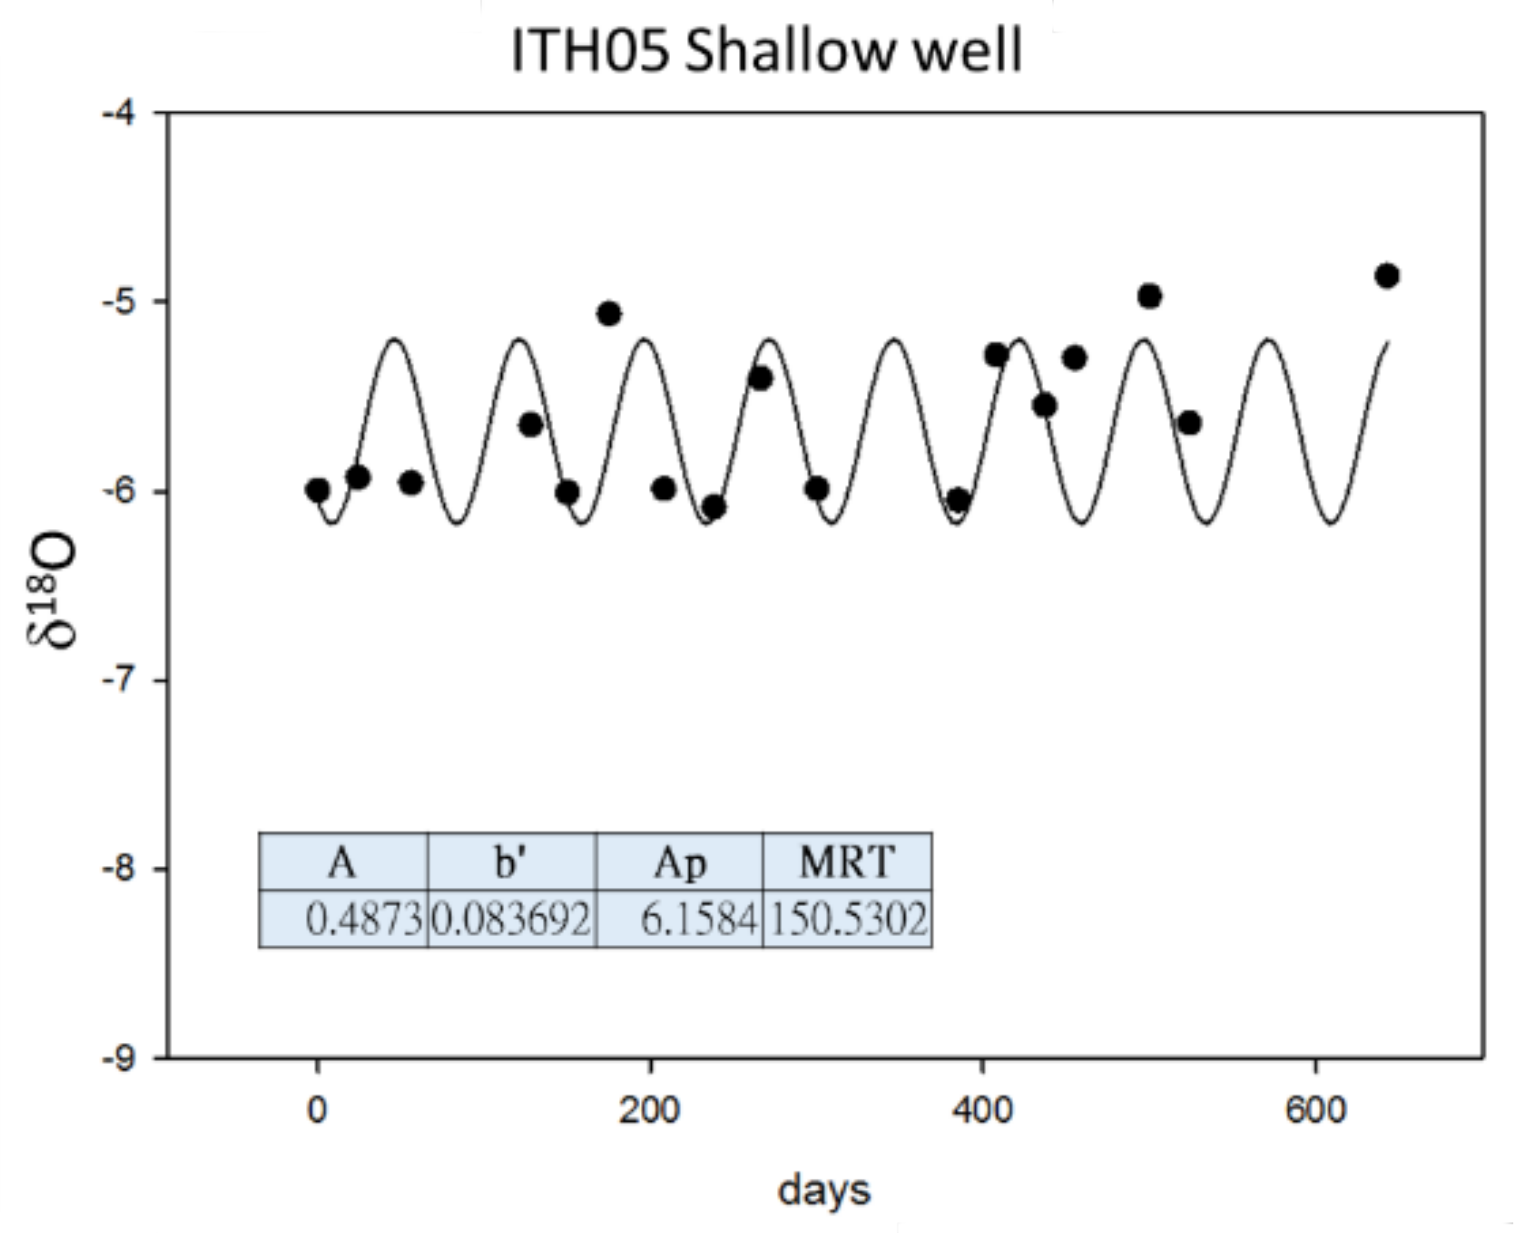
In order to estimate the mean residence time of the study area, two wells, one shallow, Well ITH05, 160 m, and one deeper, Well ITH01, 2200 m, were used to further assistant the field results. The Marquardt–Levenberg method was used to find the result in the smallest value of the sum of the squared residuals between the model output and data measured. The curve-fitting algorithm uses SigmaPlot software. The best curve fitting results are shown in
Figure 7 and
Figure 8, with estimated MRT at 150 and 1148 days.
4. Discussion
The hydrogen and oxygen isotopic compositions of surface water and thermal water in the Tuchen geothermal field are shown in
Figure 4. All surface data lie along the regional meteoric water line, indicating all surface water is highly related to local precipitation in the study area. Song and Lu (2018) [
2] reported the same close relationship between thermal water and the local meteoric water line in the nearby thermal field, the Chingshui geothermal field. However, the characteristic of ITH03 is similar to that of surface water. This may indicate that the major recharge of ITH03 comes from nearby surface water instead of deep groundwater.
An isotopic value shift from the local meteoric water line (LMWL) can be observed for the thermal water, ITH01, 04, and 05, with relatively constant δD values. (
Figure 4). The more than 2‰ shift clearly indicates some interaction mechanism occurred during the circulation. Song and Lu (2018) [
2] reported a 3‰ in δ
18O from the MWL in the nearby Chinshui geothermal field and interpreted it as slow fluid–rock interaction in terms of low permeability of the slate host rocks. We argue this slow fluid-rock interaction could have happened in the study area. Rollinson (1993) [
4] interpreted the shift to be the result of water–rock reactions. Craig (1963) [
6] and numerous studies worldwide [
7,
8,
9,
13] also demonstrated the shift could be caused by the mixing of different waters as groundwater moves to the surface. Chen et al. (2021) also reported the fault and related fractures are the main conduit for thermal water in the Jentse geothermal filed. Data show the mean δ
18O and δD of thermal water are lighter than that of surface water in general. Due to the lack of hydrogen in bedrock, relatively constant δD values were observed, while δ
18O varies. This may indicate thermal water would have recharged from higher altitude with lighter isotopic values along the fault in the study area, and slow fluid–rock interaction took place as the thermal water on the way moved upward.
Seasonal variations of the mean δ
18O and δD can be clearly observed in the study area for both thermal water and surface water. The isotopic values of thermal waters are −5.80% and −58.77% for winter and −5.75% and 59.28% for summer. The isotopic values of surface waters are −8.21% and −49.20% for winter and −8.66% and −47.07% for summer. Liu (1990) [
8] reported a nearby watershed, Langyong River, for which δ
18O and δD were −11 to 0‰ and −70~+ 10‰. He concluded that variations may be due to local rapid topographic change and a strong monsoon effect in winter. These characteristics also leave seasonal marks on stable isotope values in the study area under the same geographic location. These seasonal variation characteristics fulfill the requirement of using MRT estimation.
For surface water, two distinctive groups can be seen in both time series of δ
18O and δD in
Figure 5. They are, ITR03, 04, 05, and 06, and ITR01 and 02. The value of ITR 03, 04, 05, and 06 is separated from the rest with heavier values in surface water for the temporal variations (
Figure 5). ITR03, 04, 05, and 06 are located in the same watershed, the Tianguer River watershed, while ITR01 and 02 are located in the other watershed, the Duowang River watershed, in the study area. This may indicate that the surface water would have recharged from different altitude with the same climatic influence for Tianguer River watershed and Duowang River watershed. Obviously, both tributaries share the same fluctuation pattern, the heavier values of δ
18O observed during March and July. This also can be seen in the thermal water distribution (
Figure 6) with less magnitude. This may indicate two sub-watersheds are recharged from different sources and altitudes [
15,
16]. Liu et al., (1990) [
8] also reported that the wide ranges of δD and δ
18O isotopic compositions may be partly attributed to geographic distributions and thermal water mixing. Chen et al., (2021) identified the subsurface fracture structures and the possible pathway of fluid flow in Jentse geothermal filed. It is thus reasonable to have mixing process take place as water moves upward considering existing complex faulting systems with the orientation of N30–70 °E and a dip at 30–90 °SE [
5] and the nature of metamorphic rock, highly fractured, in the study area.
For thermal water, the mean δ18O and δD of winter and summer are −6.1% and −64% and −5.9% and −63% for ITH01, the deepest well, 2200m, and −5.4% and −58.15% and −5.3% and −59.63% for ITH04, the shallowest well at a depth of 160 m. The deeper the well, the lighter the isotopic composition values are exhibited. This suggests a higher elevation recharge source for the deep well. Similar variations were also observed in surface water. The mean δ18O and δD of winter and summer are −8.27‰ and −51.53‰ and −8.42‰ and −49.76‰ for ITR01, located in the uppermost reach of the tributary, with −8.03‰ and −46.91‰; −7.7‰ and −44.54‰ for ITR06, situated in the lower reach of the tributary. The lower the reach of the river, the heavier the isotopic composition values become in both δ18O and δD.
A 2‰ shift of δ
18O (
Figure 4) indicates an interaction must have occurred when the meteoric water infiltrated the rock [
2,
11]. If the surface water represents the source of the infiltration, for example, ITR01, the mean δD of winter and summer of ITH01 should be close to the values of ITR01. This implies that ITH01 should have recharged from a much higher elevation instead of the nearby region of the site ITR01. The fact is that the mean δD of winter and summer are −51.53% and −49.76% for ITR01 and −64 % and −5.9% and −63% for ITH01. We have estimated the recharge altitude by using the equation δD = −3.3 × 10
−2h − 22 [
11], and the result is 1150 m for the Duowang river watershed. On the other hand, ITH05 was used to estimate the recharge altitude by using the same equation [
11], and the result is 970 m for the Tianguer river watershed. The different recharge altitude estimations may also suggest the existence of various circulations in the study area. The orientation local fault at N30–70 °E and the at dip 30–90 °SE with related fractures, provides an ideal conduit for deep water to move upward.
This inconsistency occurs in the lower reach of the study area as well. The isotopic values of thermal water are lower than that of the surface water. The mean δD of winter and summer are 46.91% and −44.54% for ITR06 and −58.15% and −59.63% for ITH04. This lighter isotopic value suggests the well water could not have directly infiltrated from the surface alone and indicates a higher recharge altitude of the surface water involvement. Interestingly, ITH03 behaves quite similarly to surface water even though it is artesian well water. The values of ITH03 lie slightly off the LMWL but along the line. This could suggest mixing occurs as thermal water moves upward with surface water in the lower reach of the study area.
To further enhance the model, the mean residence time estimation was performed for ITH01, 2200 m, the deepest well, and ITH05, 160 m, the shallowest one (
Figure 7 and
Figure 8). The mean residence time estimation is based on the presumption that all data should have seasonal variations, such as ours. The Marquardt–Levenberg method curve-fitting algorithm of SigmaPlot software was used to find the smallest value of the sum of the squared residuals between the model output and data measured. The results of estimation MRTs are 1148 days and 150 days for ITH01 and ITH05, respectively. This implies that groundwater spent different times, 150 and 1148 days, recharging to both wells. It may also suggest different pathway of circulation for both well recharging. This MRT estimation method is based on the presumption that all data is influenced by seasonal variations [
22,
32,
33,
34], and the MRT should be valid in the range of 10 year or less. It would be much better to have a longer measurement data set, for example, 3–10 years. However, this study has demonstrated the usefulness of the MRT method in understanding water circulation issues in a metamorphic geothermal field with stable isotopes. In addition, in ITH03, surface water with temperature shows similar δ
18O and δD values to the river samples, reflecting that the mixing effect in the field seems to exist only in a very shallow region.
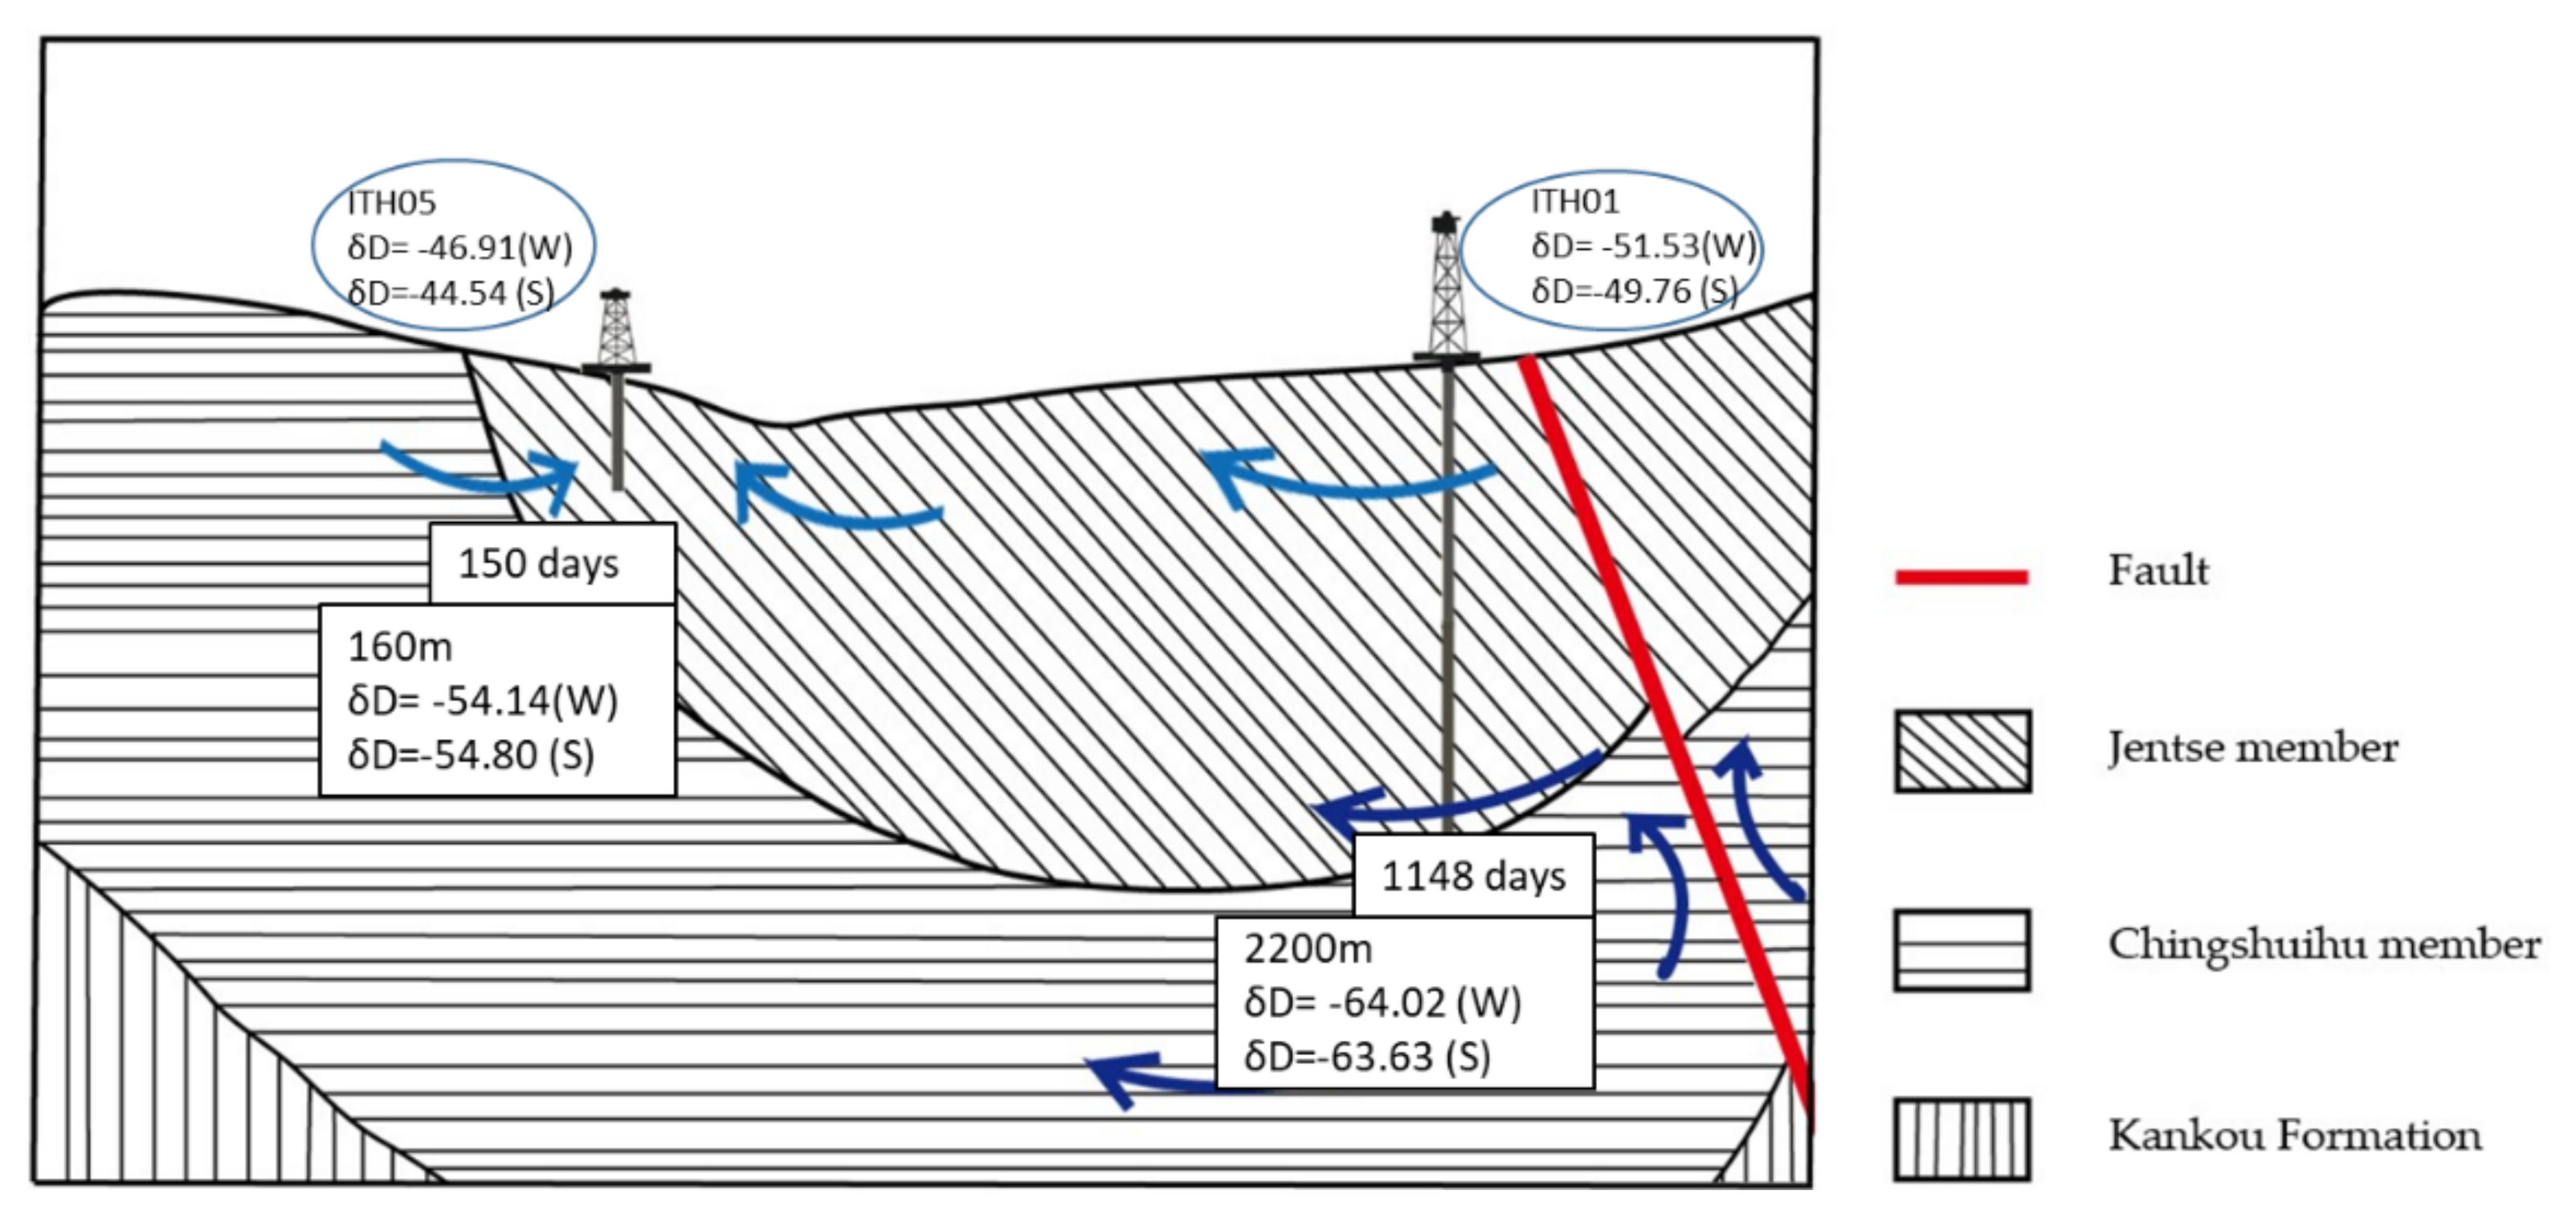
Based on combination of the temporal and spatial distributions of δ
18O and δD values, characteristics of 2‰ shift, the estimation of recharge altitudes from both tributaries, local fault orientation, N30–70 °E and dip at 30–90 °SE, and MRT estimation of two different depths of wells, a two-circulation conceptual model was built (
Figure 9). Water infiltrated to deep aquifers from a higher altitude to the east then moved upward to the surface along the fault, N30–70 °E and dip at 30–90 °SE. The mixing process that takes place as water moves upward could be resulted from slow water–rock interaction, yielding a 2‰ shift with a relative constant δD. Based on the measured one and half-year data, the recharge altitude estimation results in 1150 m for the Duowang river watershed and 970 m for the Tianguer river watershed, respectively. The different recharge altitude estimations may also suggest the existence of various circulations in the study area. In addition, the MRT estimation also shows a similar pattern in the study area. The deeper the well, the lighter the isotopic composition values, with longer MRT.
This combination usage of stable isotopes and MRT estimation in this study may be useful for other metamorphic geothermal areas in Taiwan.
5. Conclusions
This study found seasonal variations of δ18O and δD in the study area for both thermal water and surface water, with heavier values of δ18O in summer and lighter values in winter. Based on the measured data, the recharge altitude estimation results in 1150 m for the Duowang river watershed and 970 m for the Tianguer river watershed, respectively. A 2% shift of δ18O with a relative constant δD for thermal water implies mixing takes place as deep thermal water moves upward. The mean residence time estimation was performed for ITH01, 2200 m, the deepest well, and ITH05, 160 m, the shallowest one in the study area. The results of MRT estimation are 1148 days and 150 days for ITH01 and ITH05, respectively. This also suggests that regional recharging groundwater spent different times, 150 and 1148 days, before reaching wells. The orientation local fault, N30–70 °E and dip at 30–90 °SE, provides an ideal conduit for deep water to move upward due to the nature of low permeability of the slate formation.
Based on the combination of the temporal and spatial distributions of δ
18O and δD values, characteristics of 2% shift, the estimation of recharge altitudes from both tributaries with local fault orientation, N30–70 °E and dip at 30–90 °SE and MRT estimation of two different depths of wells, a two-circulation conceptual model was built (
Figure 9). The combination of stable isotopes and MRT estimation used in this study may be useful for other high temperature metamorphic geothermal areas or other geothermal fields in Taiwan.


