Article

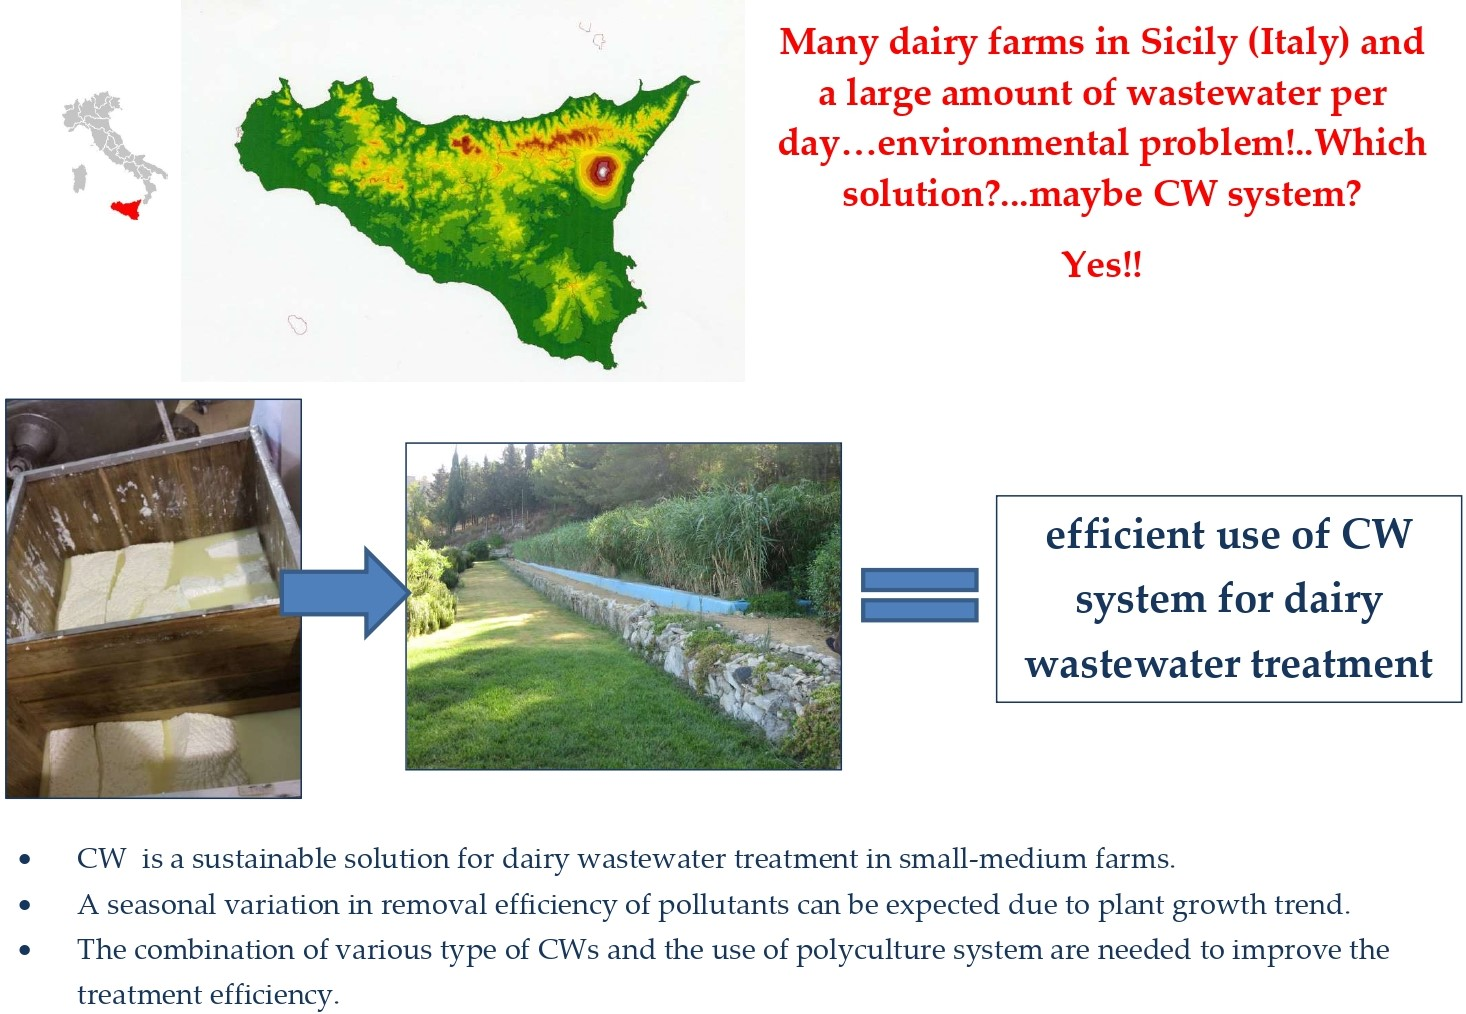
Treatment of Combined Dairy and Domestic Wastewater with Constructed Wetland System in Sicily (Italy). Pollutant Removal Efficiency and Effect of Vegetation

1
Department of Agricultural, Food and Forest Sciences, Università degli Studi di Palermo, Viale delle Scienze 13, Building 4, 90128 Palermo, Italy
2
Department of Agricultural and Forest Sciences, Università degli Studi della Tuscia, 01100 Viterbo, Italy
3
Research Consortium for the Development of Innovative Agro-Environmental Systems (Corissia), Via della Libertà 203, 90143 Palermo, Italy
*
Authors to whom correspondence should be addressed.
These authors are equally contributed.
Water 2021, 13(8), 1086; https://doi.org/10.3390/w13081086
Submission received: 26 March 2021 / Revised: 12 April 2021 / Accepted: 13 April 2021 / Published: 15 April 2021

Abstract

:
Dairy wastewater (DWW) contains large amounts of mineral and organic compounds, which can accumulate in soil and water causing serious environmental pollution. A constructed wetland (CW) is a sustainable technology for the treatment of DWW in small-medium sized farms. This paper reports a two-year study on the performance of a pilot-scale horizontal subsurface flow system for DWW treatment in Sicily (Italy). The CW system covered a total surface area of 100 m2 and treated approximately 6 m3 per day of wastewater produced by a small dairy farm, subsequent to biological treatment. Removal efficiency (RE) of the system was calculated. The biomass production of two emergent macrophytes was determined and the effect of plant growth on organic pollutant RE was recorded. All DWW parameters showed significant differences between inlet and outlet. For BOD5 and COD, RE values were 76.00% and 62.00%, respectively. RE for total nitrogen (50.70%) was lower than that of organic compounds. RE levels of microbiological parameters were found to be higher than 80.00%. Giant reed produced greater biomass than umbrella sedge. A seasonal variation in RE of organic pollutants was recorded due to plant growth rate Our findings highlight the efficient use of a CW system for DWW treatment in dairy-cattle farms.

Graphical Abstract

1. Introduction

The dairy industry is the largest Italian food sector and represents more than 15% of the national food business [1]. Estimates by the Milk Market Observatory [2] indicate that Italy is one of the largest milk and dairy-product producers in the European Union with an annual average total milk yield of 11,721,375 t over the last ten years [3]. In Sicily (Italy), dairy products represent a significant proportion of the total value of agricultural outputs and include raw milk from buffalo, cow, goat and sheep, butter, yoghurt and different types of cheese. The dairy sector is, thus, widely present in this region and it is mostly composed of specialized small and medium farms. These farms consume extremely high amounts of water annually, mainly used in cleaning and cooling systems, technological systems, steam generators and fire protection systems.
Taking into consideration the relationship between water consumption and milk production, a survey carried out in 35 Italian dairies [4] estimated an average water consumption of 1 L of water per kilogram of raw milk produced by the dairy. During butter and cheese processing, however, water consumption varied between 3 and 30 L of water per kilogram of raw milk [5]. Due to this high water consumption, the dairy industry produces vast quantities of wastewater, which must then be treated, causing a series of negative impacts on the surrounding natural ecosystem. A number of authors [6,7] reported 1–10 L of wastewater generated per liter of processed milk.
Dairy wastewater (DWW) is characterized by high levels of detergents, fats, minerals, organic compounds, proteins and a wide range of pH values [7,8,9,10,11]. As stated by various authors [7,12,13], typical DWW characteristics include 1400–50,000 mg L−1 biochemical oxygen demand (BOD5), 2000–90,000 mg L−1 chemical oxygen demand (COD,) 70–800 mg L−1 total suspended solids (TSS), 100–1400 mg L−1 total nitrogen (TN) and 25–450 mg L−1 total phosphorus (TP).
However, the composition of DWW is not stable over time as affected by various factors such as seasonality of dairy activities, different dairy products produced, operating and processing conditions of dairy products and wastewater management [14,15]. In particular, a critical component of DWW is whey. Whey constitutes 85%–95.00% of the milk volume, it contains fats, lactose, minerals, proteins, vitamins and is considered the greatest pollutant in DWW due to the high organic load and volume that is produced [10,12,16]. Literature, in fact, calculates the global production of whey to be over 100 billion kilograms per year [17,18].
Despite the fact that DWW can be re-used in the production of some horticultural and open field crops [9,19,20], its long-term application can have a negative impact on the characteristics of soil structure, causing a decrease in crop yield [21,22]. Furthermore, when DWW is directly discharged into water bodies, it negatively affects aquatic life, leading to eutrophication of the receiving waters [12,23]. It was reported that, globally, every year approximately 4–11 million tons of DWW are released into the environment, causing severe hazard to all biodiversity [24,25].
On the basis of that, a number of treatment systems must be applied. DWW is usually treated by physical-chemical methods, such as coagulation/flocculation and/or biological methods, which include processes such as activated sludge, aerated lagoons, anaerobic sludge blanket reactors, anaerobic filters, sequencing batch reactor, trickling filters, or others [10,15,26]. However, the use of conventional treatments can be problematic for a series of reasons, such as variability in certain hydraulic aspects, significant sludge production, high management costs and the need for specialized staff to manage wastewater operations [13].
In Sicily and other Mediterranean countries, small and medium dairy farms are isolated from conventional treatment plants and are often located close to areas with high agricultural and ecological importance, such as lakes, lagoons, ponds and open fields [27]. However, the technical and biological characteristics of a constructed wetland (CW) make it an ideal DWW treatment system for these farms. Constructed wetland systems (CWs) are easy to use and manage, they reduce operation and maintenance costs, they provide high levels of pollutant removal efficiency (RE), improve water quality and preserve the soil and aquatic environments [12,13,24,27]. CWs have been successfully used in the treatment of DWW in only a few Mediterranean countries, such as Italy [13,27,28,29,30,31] and Greece [12,32,33]. Among CWs, the horizontal sub-surface flow system (HSSFs) is considered one of the best performing systems for DWW treatment, achieving very high RE values for organic compounds and nutrients, mainly [34].
However, taking the characteristics of DWW into consideration, and, in particular, the high organic load, it is realistic to assume that in the medium and long term a significant amount of organic matter will accumulate in the substrate, contributing to its clogging and reducing the pollutant RE of the system [35]. Thus, a combination of HSSFs with an effective pretreatment system is fundamental in order to maintain the high treatment performance of the system.
Literature on DWW treatment using CWs is quite substantial, however, most studies tend to give greater importance to chemical and engineering aspects and limited attention to plant species. In HSSFs, plants contribute greatly to the treatment process, however, their action is significantly affected by air temperature, increasing the performance when air temperature stimulates vegetative growth. A novelty of this paper is, thus, the comparison of two underused plant species in CWs, Arundo donax L. and Cyperus alternifolius L., in terms of growth, biomass production and N uptake, and highlighting how the choice of vegetation can affect DWW treatment.
The aims of the study were: (i) to assess the pollutant RE of a pilot-scale HSSFs CW for treatment of DWW produced by a small dairy farm in Sicily, (ii) to assess the plant growth during the year and its effect on organic pollutant RE.

2. Materials and Methods

2.1. Test Site

Tests were conducted in the two years from 2019 to 2020 on a pilot HSSFs CW in Raffadali, a rural municipality in the West of Sicily (37°24′ N–1°05′ E, 446 m a.s.l.).
The system was used to treat DWW produced by a small dairy-cattle farm located in the surrounding area. The farm produced milk for cheese-making. In particular, the farm had two sheds and an average of 80 lactating cows. The production capacity of milk was approximately of 1600 L day−1 (Figure 1).
DWW used in the study was composed of wastewater from the holding area (following solid liquid separation), milking parlor and, thus, mixed with domestic wastewater produced by the staff of the dairy farm.

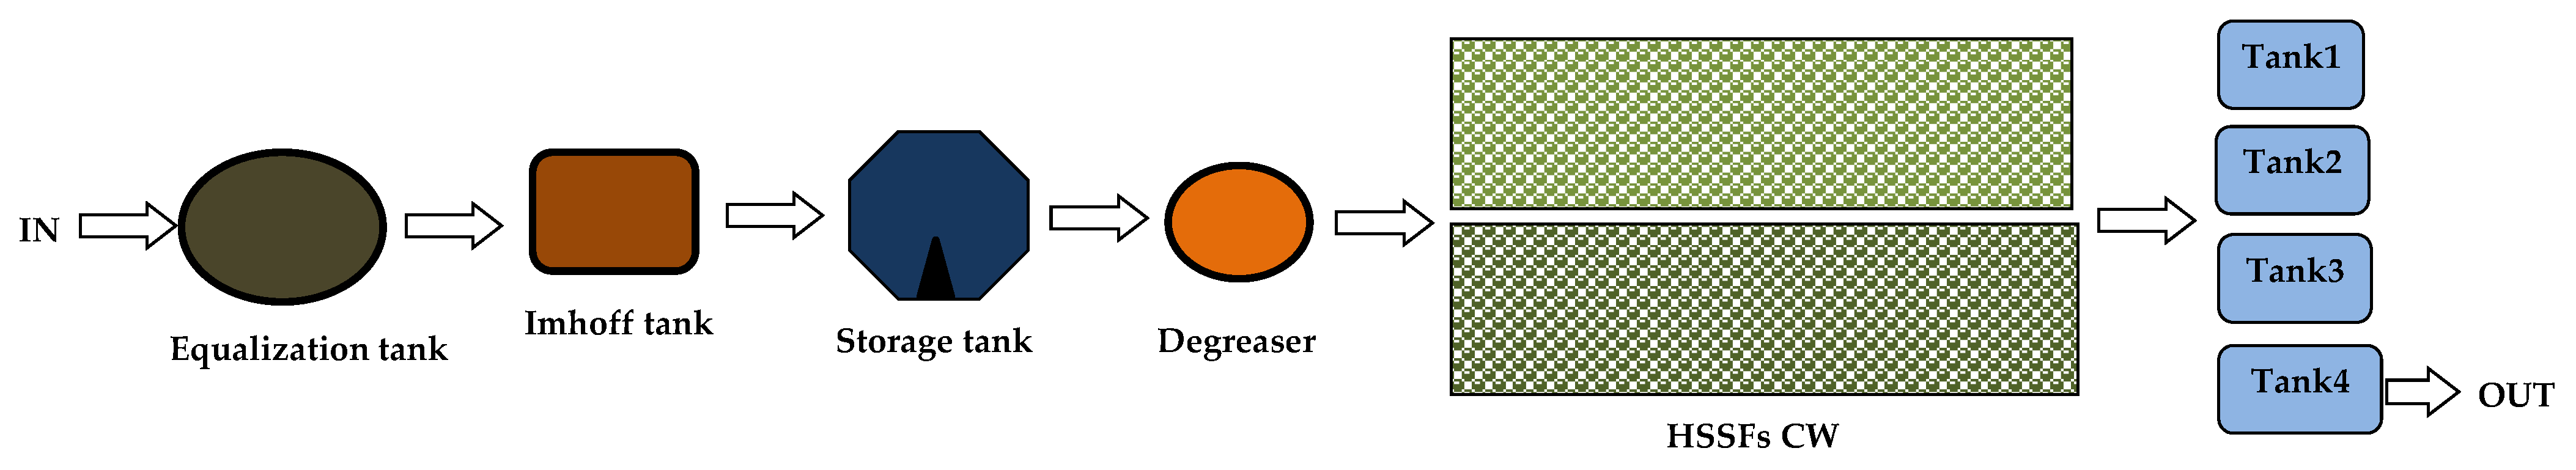
2.2. Description of the HSSFs CW

The HSSFs CW system was built in the year 2000 and located in an urban park (Figure 2). It included two separate, parallel units each 50 m long and 1 m wide, with a total surface area of 100 m2. The floor and walls of the units were made of concrete. The units were lined with sheets of ethylene and vinyl-acetate and were designed in order to receive a total of 6 m3 of wastewater per day. Filter bed depth was 0.50 m with a water depth of 0.30 m and a 2% slope. The substrate was made of evenly-sized 30 mm silica quartz river gravel (Si 30.02%; Al 5.11%; Fe 6.10%; Ca 2.65%; Mg 1.05%) with a porosity of 35–40%.
The two units were separately planted with giant reed (Arundo donax L.) and umbrella sedge (Cyperus alternifolius L.). The information on propagation techniques of the two species and plant density were described by the authors in a previous study [36].
The layout of the system for the wastewater treatment is shown in Figure 3.
On the dairy farm, the DWW, mixed with domestic wastewater, was fed into an equalization tank and, subsequently, treated by two Imhoff septic tanks in order to remove TSS and organic matter. The pre-treated DWW from the dairy farm was then collected in a 15.00 m3 storage tank at the HSSFs CW. The tank was equipped with a submerged electric pump to feed water into the CWs units, and with a liter gauge and outlet valve for periodic cleaning of solid sediments.
Initially, the wastewater was fed into a static degreaser to separate fats, soaps and food wastes and, subsequently, pumped through a 1.00 m wide perforated polyvinylchloride pipe into the two HSSFs CW units. The homogeneous distribution of wastewater in each unit was ensured through a timer-controlled pumping system. In each unit, the pipe was placed 10.00 cm from the surface of the substrate. Treated dairy wastewater (TDWW) was collected using a perforated drainage pipe system, placed at the bottom of the filter bed and then conducted downhill into a system of four interconnected tanks of 5.00 m3 each.
The two units were tested using a hydraulic loading rate (HLR) of 6.00 cm day−1 and hydraulic retention time (HRT) of 8.30 days. Finally, TDWW was generally discharged into the soil using a subsurface irrigation system connected to the last of the four tanks. The subsurface irrigation system was designed taking into account the number of equivalent inhabitants and the physical characteristics of the soil.

2.3. Plant Measurements

Plant growth was determined by measuring the plant height, stem density and calculating the dry weight of the above-(leaves and stems) and below-ground plant parts (roots and rhizomes). The main morphological parameters were taken from March to November for each year.
Plant height was calculated fortnightly by measuring the maximum height of 10 plants, in good phytosanitary condition, selected randomly from the initial, the middle and the end sections of each unit. Leaf number per plant and root-system length were determined monthly by making a leaf count and measuring the root length of 10 plants selected randomly for each unit. Culm/stem density was calculated monthly on an area of 1.00 m2 for each planted unit.
According to a previous study [37], four crop growth stages were identified: (a) initial stage: from greenup to the beginning of stem elongation; (b) crop development stage: from stem elongation to initial flowering; (c) mid-season stage: from flowering to initial canopy senescence; (d) late-season stage: from canopy senescence to plant harvest.
In November, the plants were cut back to a height of 50.00 cm above the gravel bed. Fresh above-ground and below-ground weights were determined on a representative sample of 10 plants from each unit. The above- and below-ground biomass dry weights were calculated by drying the collected plant material in an oven at 62.00 °C for 72 h. Nitrogen levels in the aboveground biomass parts of the plants were determined using a Carbon, Hydrogen, Nitrogen (CHN) elemental analyzer, in full compliance with plant biomass basic analysis standards. This process was repeated following the next cutting, after 12 months.

2.4. DWW Analysis

Wastewater samples were taken monthly from March to November, for both years, amounting to a total of 72 times (36 times per planted unit). The samples were collected at the inflow and outflow of each CW unit. 1.00 L of wastewater was collected from each of the two points at each sampling. The influent sample was taken close to the pipe while the effluent sample was collected at the mouth of the outflow pipe. Sampling always occurred at the same time, usually coinciding with milking procedure or other operations into the dairy farm.
The pH and electrical conductivity (EC) were determined directly on site using a portable Universal meter (Multiline WTW P4). Using Italian water analytical methods [38], TSS, BOD5, COD, TN, ammonia nitrogen (NH4-N), organic nitrogen (ON), TP and heavy metals (Cu, Ni, Pb and Zn) were determined. Total coliforms (TC), fecal streptococci (FS), Escherichia coli (E. coli) and Salmonella spp. levels were determined by membrane filter methods, based on standard methods for water testing [39]. RE of the HSSFs CW was based on pollutant concentrations and calculated in accordance with International Water Association [40]:
RE = C i C 0 C i
where Ci and C0 are the mean concentrations of the pollutants in the influent and effluent.

2.5. Weather Data

A weather station belonging to the agrometeorological information service of the Sicilian Government [41] was used to collect climate data. It was located close to the pilot HSSFs CW. The station was equipped with a MTX datalogger (model WST1800, Padova, Italy) and various climate sensors. In particular, a temperature sensor MTX (model TAM platinum PT100 thermo-resistance with anti-radiation screen) and a rainfall sensor MTX (model PPR with a tipping bucket rain gauge) provided data on daily minimum and maximum air temperatures and total 10-day rainfall data.

2.6. Statistical Analysis

Statistical analyses were performed using the package MINITAB 17 for Windows. A paired t-test was used to compare the mean levels of each chemical and microbiological parameter at influent and outlet. A level of p < 0.05 was used for all comparisons. For DWW composition, all the representative values were presented using mean ± standard deviation calculations.

3. Results and Discussion

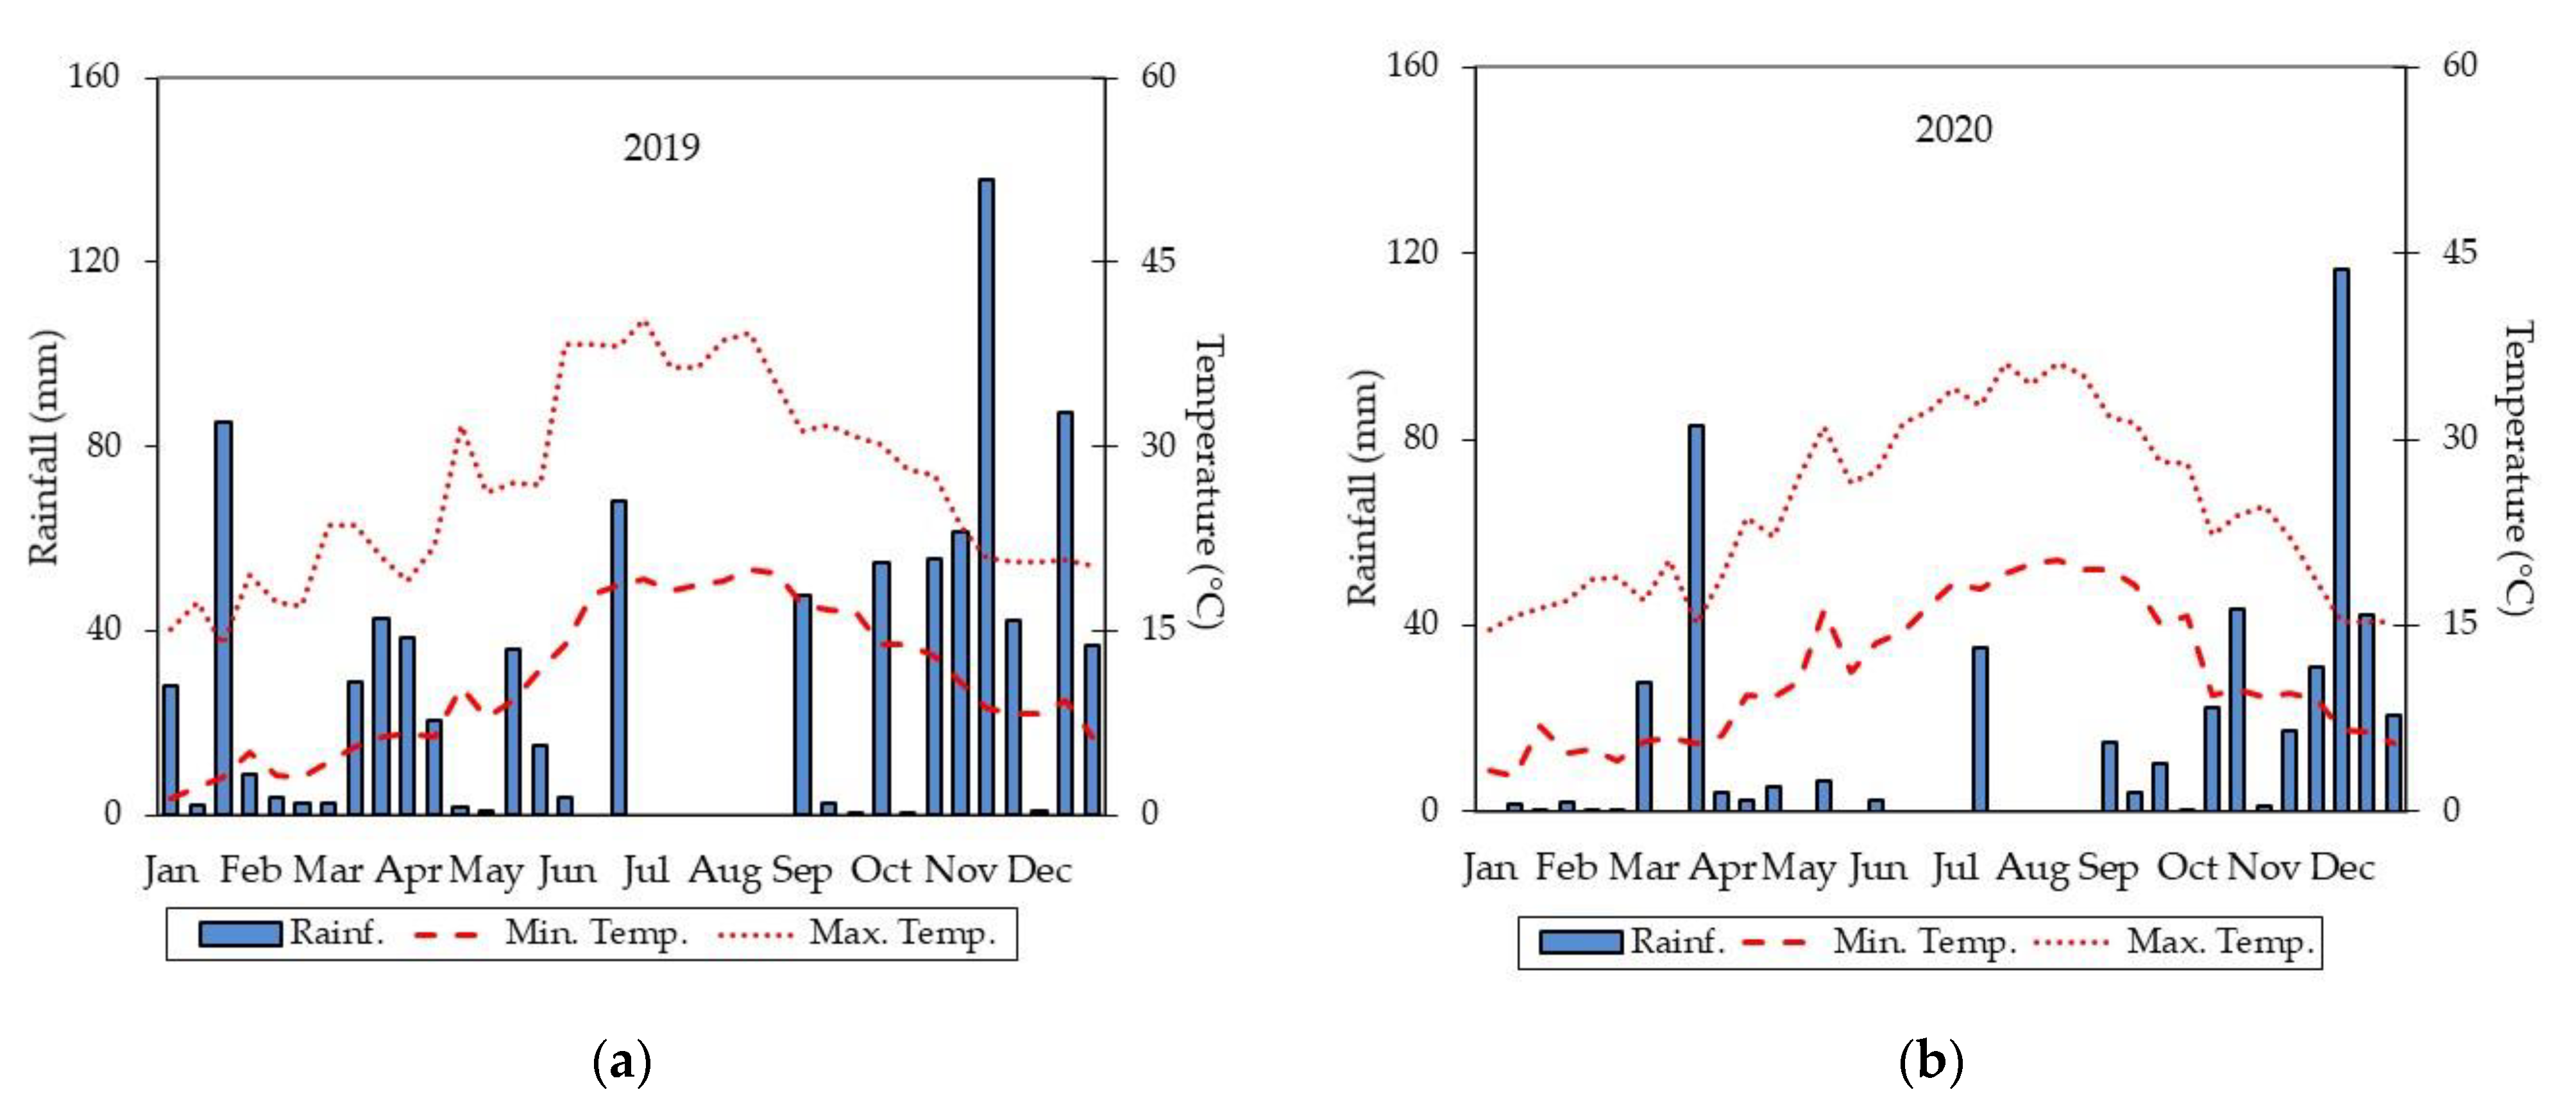
3.1. Rainfall and Air Temperature Trends in the HSSFs CW Area

According to the Köppen–Geiger climate classification, the study location is characterized by a warm temperate climate with hot-dry summers and rainfall not well distributed throughout the year [42]. With reference to time series 1982–2012, the annual average rainfall was approximately 650.00 mm, the average air temperature was 17.50 °C, the average maximum air temperature was 23.50 °C, and the average minimum air temperature was 11.20 °C.
Figure 4 shows air temperatures and total rainfall trends in 2019 and 2020.
In both years, maximum and minimum air temperatures increased greatly from the beginning of April to the third 10-day period of August and decreased up to the end of December. The highest maximum air temperature (40.30 °C) was recorded in the first 10-day period of July 2019 and the lowest minimum air temperature (1.40 °C) was determined in the first 10-day period of January 2019. Annual rainfall ranged between 917 mm (2019) and 495 mm (2020). The highest rainfall levels (138 mm) occurred during the second 10-day period of November 2019. The distribution of rainy days during the seasons was quite different over the two years. The days of absence of rainfall were more in 2020 than in 2019 and concentrated also in the winter season. Particularly, in summer, average monthly rainfall was 22.70 mm in 2019) and 18.13 mm in 2020.
The highest treatment performance of HSSFs CW was recorded from April to August in both years when air temperatures positively affected plant growth and microbiological activities in the CW units. Furthermore, during the autumn months, we observed no significant decrease in plant activity due to mild air temperatures. The climate conditions allowed the two macrophytes to extend their vegetative cycle until the end of autumn, delaying senescence and their ability to remove pollutants from DWW.

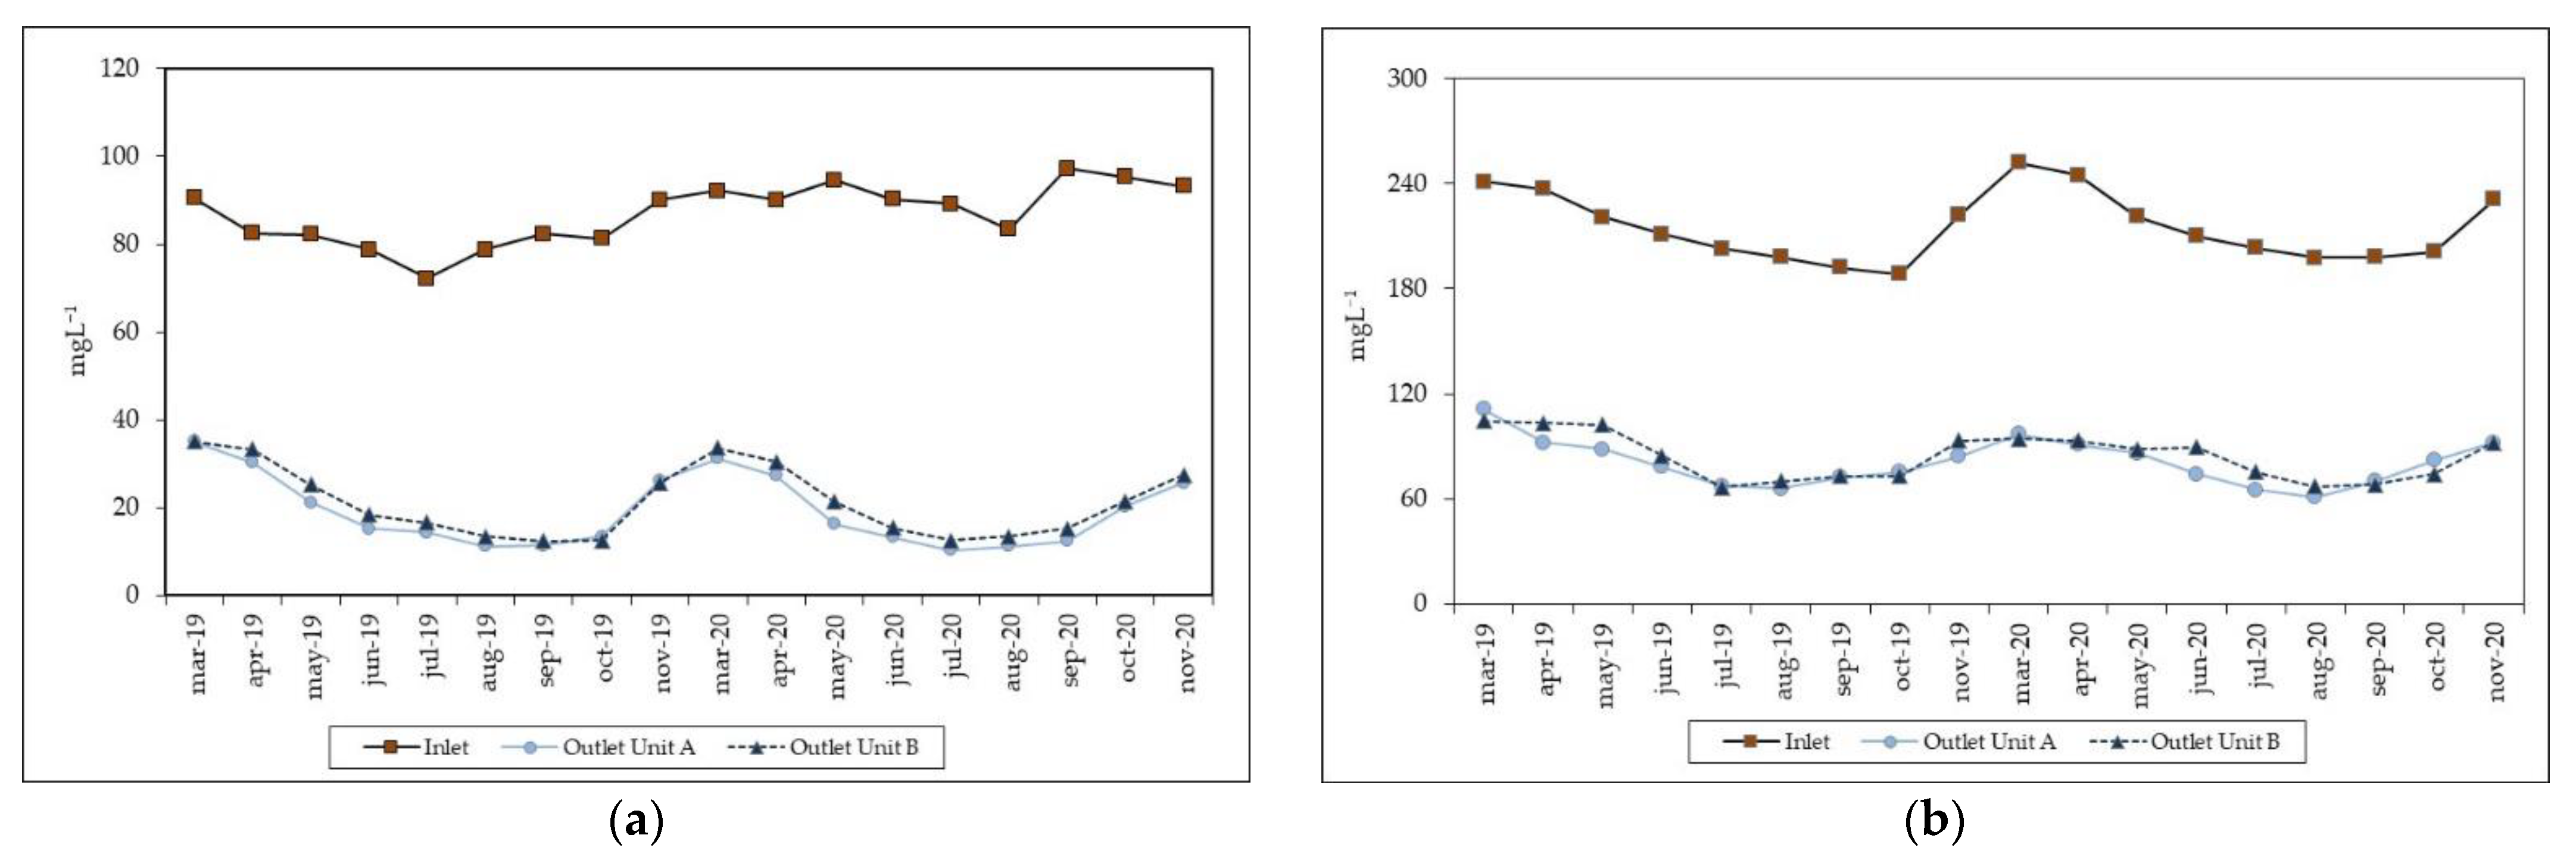
3.2. Monitoring and Pollutants Removal Efficiency of the HSSFs CW

Table 1 and Table 2 show the average influent and effluent concentrations of chemical and physical parameters, as well as RE percentages of the HSSFs CW.
As reported by various authors [13,14,15,43], the levels of the main parameters in the study were different throughout the year and varied mainly due to seasonal changes in dairy activities.
Pre-treatment by the septic tank and degreaser provided effective treatment of the DWW due to biological, chemical and physical processes. At the inlet of the HSSFs CW, odors were not unpleasant, and no coarse matter was found in the DWW.
For pH measurements, literature [11,13,44] shows ranging between 3.5 and 11, depending on the dairy activities and the use of alkaline and acid cleaners. In our study, in both planted units, influent values were found to be slightly alkaline, significantly higher than effluent values. This was in agreement with the findings of other authors [24,27,28], who report pH values of the HSSFs CW effluent close to 7.0. As found by various authors [45,46], it is reasonable to assume that the decrease in pH values in the effluent are due to the production of carbon dioxide (CO2) by the decomposition of plant residues, the removal of various components of the wastewaters in the root area and the nitrification of ammonia.
In the case of EC, influent values were significantly lower than effluent values. Furthermore, in the two planted units, the EC effluent values were found to be different, probably due to different evapotranspiration rates of the two emergent macrophytes. This physical process determined, in fact, high water consumption in the planted units and an increase in salt levels in the solution. The effect of evapotranspiration on EC levels of the CW effluent has been previously well explained by a number of authors [47,48,49,50,51,52].
TSS values were found to differ significantly between influent and effluent. TSS RE was found to be almost identical in the two planted units. These values were inside the range of those observed in HSSFs CW for the DWW treatment, which varied between 75% and 85% [13,24,27,40,44]. In Italy, some authors [28,30] reported TSS RE values of above 90%, however when using different pre-treatment systems and applying hybrid CWs. Previous studies investigated the reasons which could influence the TSS removal in a HSSFs and the majority of them agree with the fact that filtration and sedimentation processes contribute greatly to elimination of the TSS [53]. In our study, these physical processes carried out by substrate, plant roots and microorganisms improved the wastewater flow in the two planted units and, consequently, the treatment performance of the system.
BOD5 and COD values showed significant differences between influent and effluent. BOD5 RE varied from 78.02% (giant reed-unit) to 75.61% (umbrella sedge-unit). Similarly, COD RE varied from 62.67% (giant reed-unit) to 61.12% (umbrella sedge-unit). These values remained within limits consistent with findings of other authors concerning HSSFs. In Argentina, in a pilot-scale HSSFs CW located close to a dairy farm, the authors [24] found average RE values for BOD5 and COD of 57.90% and 68.70%, respectively. In Vermont (USA), a series of integrated systems consisting of various combinations of HSSFs, and vertical sub-surface flow systems (VSSFs) were used to treat DWW, with a BOD5 RE of 86–89.00% [54]. In Japan, multistage HSSF systems were designed to treat DWW under cold climate conditions. Researchers found high removal rates for COD RE (93–96.00%) [55]. In southern Europe, in various studies [12,27,28,29,31,32,33], the authors reported average values of BOD5 RE ranging between 70% and 94% depending on various factors, such as the size of the CW and the wastewater pretreatment. In this study, at inlet of the HSSFs CW, the ratio between BOD5 and COD was found to be 0.40, on average. As reported in literature, a ratio lower than 0.50 indicates low susceptibility of wastewater to biodegradation. In this study, due to the fact that the BOD5/COD ratio was slightly lower than 0.50, it is reasonable to presume that most compounds in the DWW were easily biodegradable. The high average RE values of BOD5 and COD can be explained by considering the role of plants, substrate and microorganisms in a CW and their interaction. Many authors [12,13,24,27,44,53] highlight, in fact, that filtration and sedimentation carried out by plants and substrate, together with microbiological degradation, are the main physical and chemical processes required for the elimination of organic matter in a CW. However, taking the functional and construction characteristics of HSSFs into consideration, it is not possible to conclude that the removal rate of organic compounds depends only on oxygen levels in the rhizosphere. As confirmed by previous studies [40,53], high RE values in a system can be explained by anaerobic biodegradation processes in the CW units.
Regarding TN, effluent values were significantly lower than influent values. TN RE values were recorded as being similar in both planted units. Moreover, these values were on average lower than those of TSS, BOD5 and COD. Literature [40,53,56] remarks that, in a HSSFs CW, nitrification/denitrification and plant/microbial uptake represent the most frequent mechanisms for nitrogen removal. However, these processes depend greatly on the oxygen availability. In a HSSFs CW, the oxygen levels are usually low, and this condition can limit the ammonium nitrification process and explain the lower TN RE values recorded. Comparing our findings with those of other studies, both similarities and differences were found. In Lithuania, in a HSSFs vegetated with Phragmites australis for treatment of combined dairy and domestic wastewater, the authors [57] claimed that the system provided an average TN RE of 37–44.00%. In a review on various experiences from the Netherlands and Belgium [12], using CWs for DWW treatment, higher TN removal rates (>85–90.00%) than those of our study were reported. In Italy, assessing the HSSFs treatment performance for DWW, various authors [28,29] obtained TN RE values which were consistent with those in this study.
For TP, significant differences between influent and effluent concentrations were observed. Both planted units recorded similar TP RE average values, approximately 40%. Literature highlights that TP RE depends on several factors, such as the age of the HSSFs CW, the adsorption properties of the substrate, the gradual filling of the sorption sites over the years and the presence of under composed plant material around the substrate surface [58,59,60]. Furthermore, it may be related to plant uptake, as the macrophytes have different absorption and storage capacities [61]. However, it is important to highlight that, in a HSSFs CW, TP RE tends to decrease over the time and seems to be high when the plants are young, the root length density is low per unit of substrate volume and substrate adsorption is highly active [12,58,59,60]. Observing the low average value of TP RE recorded in this study, it was found to be in the range of 30.00–60.00% as shown by literature, largely due to the above-mentioned reasons. In Italy, in a study conducted on a dairy farm in the province of Reggio Emilia [28], a TP RE value of 60.00% was found, based on an average influent TP concentration of 12.80 mg L−1; in another Italian study carried out in the Aosta Valley [29], TP RE was 40.00% with an average influent TP concentration of 10.00 mg L−1. In Ireland, in an integrated CWs used to treat DWW, TP removal varied depending on the season (5%–84%), with lowest performance during the cold season [62].
Concerning heavy metals, significant differences between influent and effluent concentrations were found. In both planted units, RE values were, in general, acceptable. Our findings were in agreement with those obtained in a study carried out in Sicily using a HSSFs CW planted with Phragmites australis [27]. These results confirm the contribution of plants to the removal process and the importance of the interaction of plants, microorganisms and substrate in the CWs, as highlighted previously [63,64].
In the case of microbiological parameters, bacteria were always present in the effluent due to the fact that DWW was mixed with domestic wastewater. Domestic wastewater was found, in fact, to have the highest average TC, FC and E. coli levels (data not shown). It is worth noting that the levels of bacteria in combined dairy and domestic wastewater were not constant and varied over the time depending on dairy farming activities and practices.
Concerning the main results, in both planted units and for each microbiological parameter in the study, RE levels were found to be above 80.00% (Table 3). Significant differences were found between influent and effluent average values. Comparing these findings with those of other studies [24,27,28], many similarities were observed, despite different operating conditions at the CWs.
The high pathogen RE can be explained considering all processes carried out by macrophytes and microorganisms in the substrate. A number of authors [40,53,65,66], in fact, maintain that typical processes in a CW, such as filtration and adsorption, chemical oxidation and sedimentation, are efficient for removal of microorganisms and that the more favorable the conditions for plant life and bacteria, the more effective the removal of pathogens.
Furthermore, as clearly explained in previous studies, the aerobic conditions in the root zone of a HSSFs CW permitted greater bacterial biofilm formation and promoted high pathogen RE [40,53].
In Italy, the discharge of treated wastewaters into the soil is regulated by Legislative Decree 156/2006. In this research study, average chemical and physical parameter results at the outlet of the HSSFs CW were not all within the legal limits of the Italian Decree. In particular, TN and TP concentration values did not meet the threshold values due to fact their removal was not high. Concerning the microbiological parameters, data recorded for Escherichia coli were not found to be within these legislative values. Reasons for this are varied and may be linked to the size of the two planted units, removal efficiency of the pretreatments and the seasonality of DWW. As pathogen removal is significantly affected by aerobic/anaerobic conditions in the substrate, a hybrid wetland, for example a combined HSSF-VSSF, could allow for better performance [32]. In fact, the two systems are characterized by diverse retention time and this could positively influence pathogen removal [36].

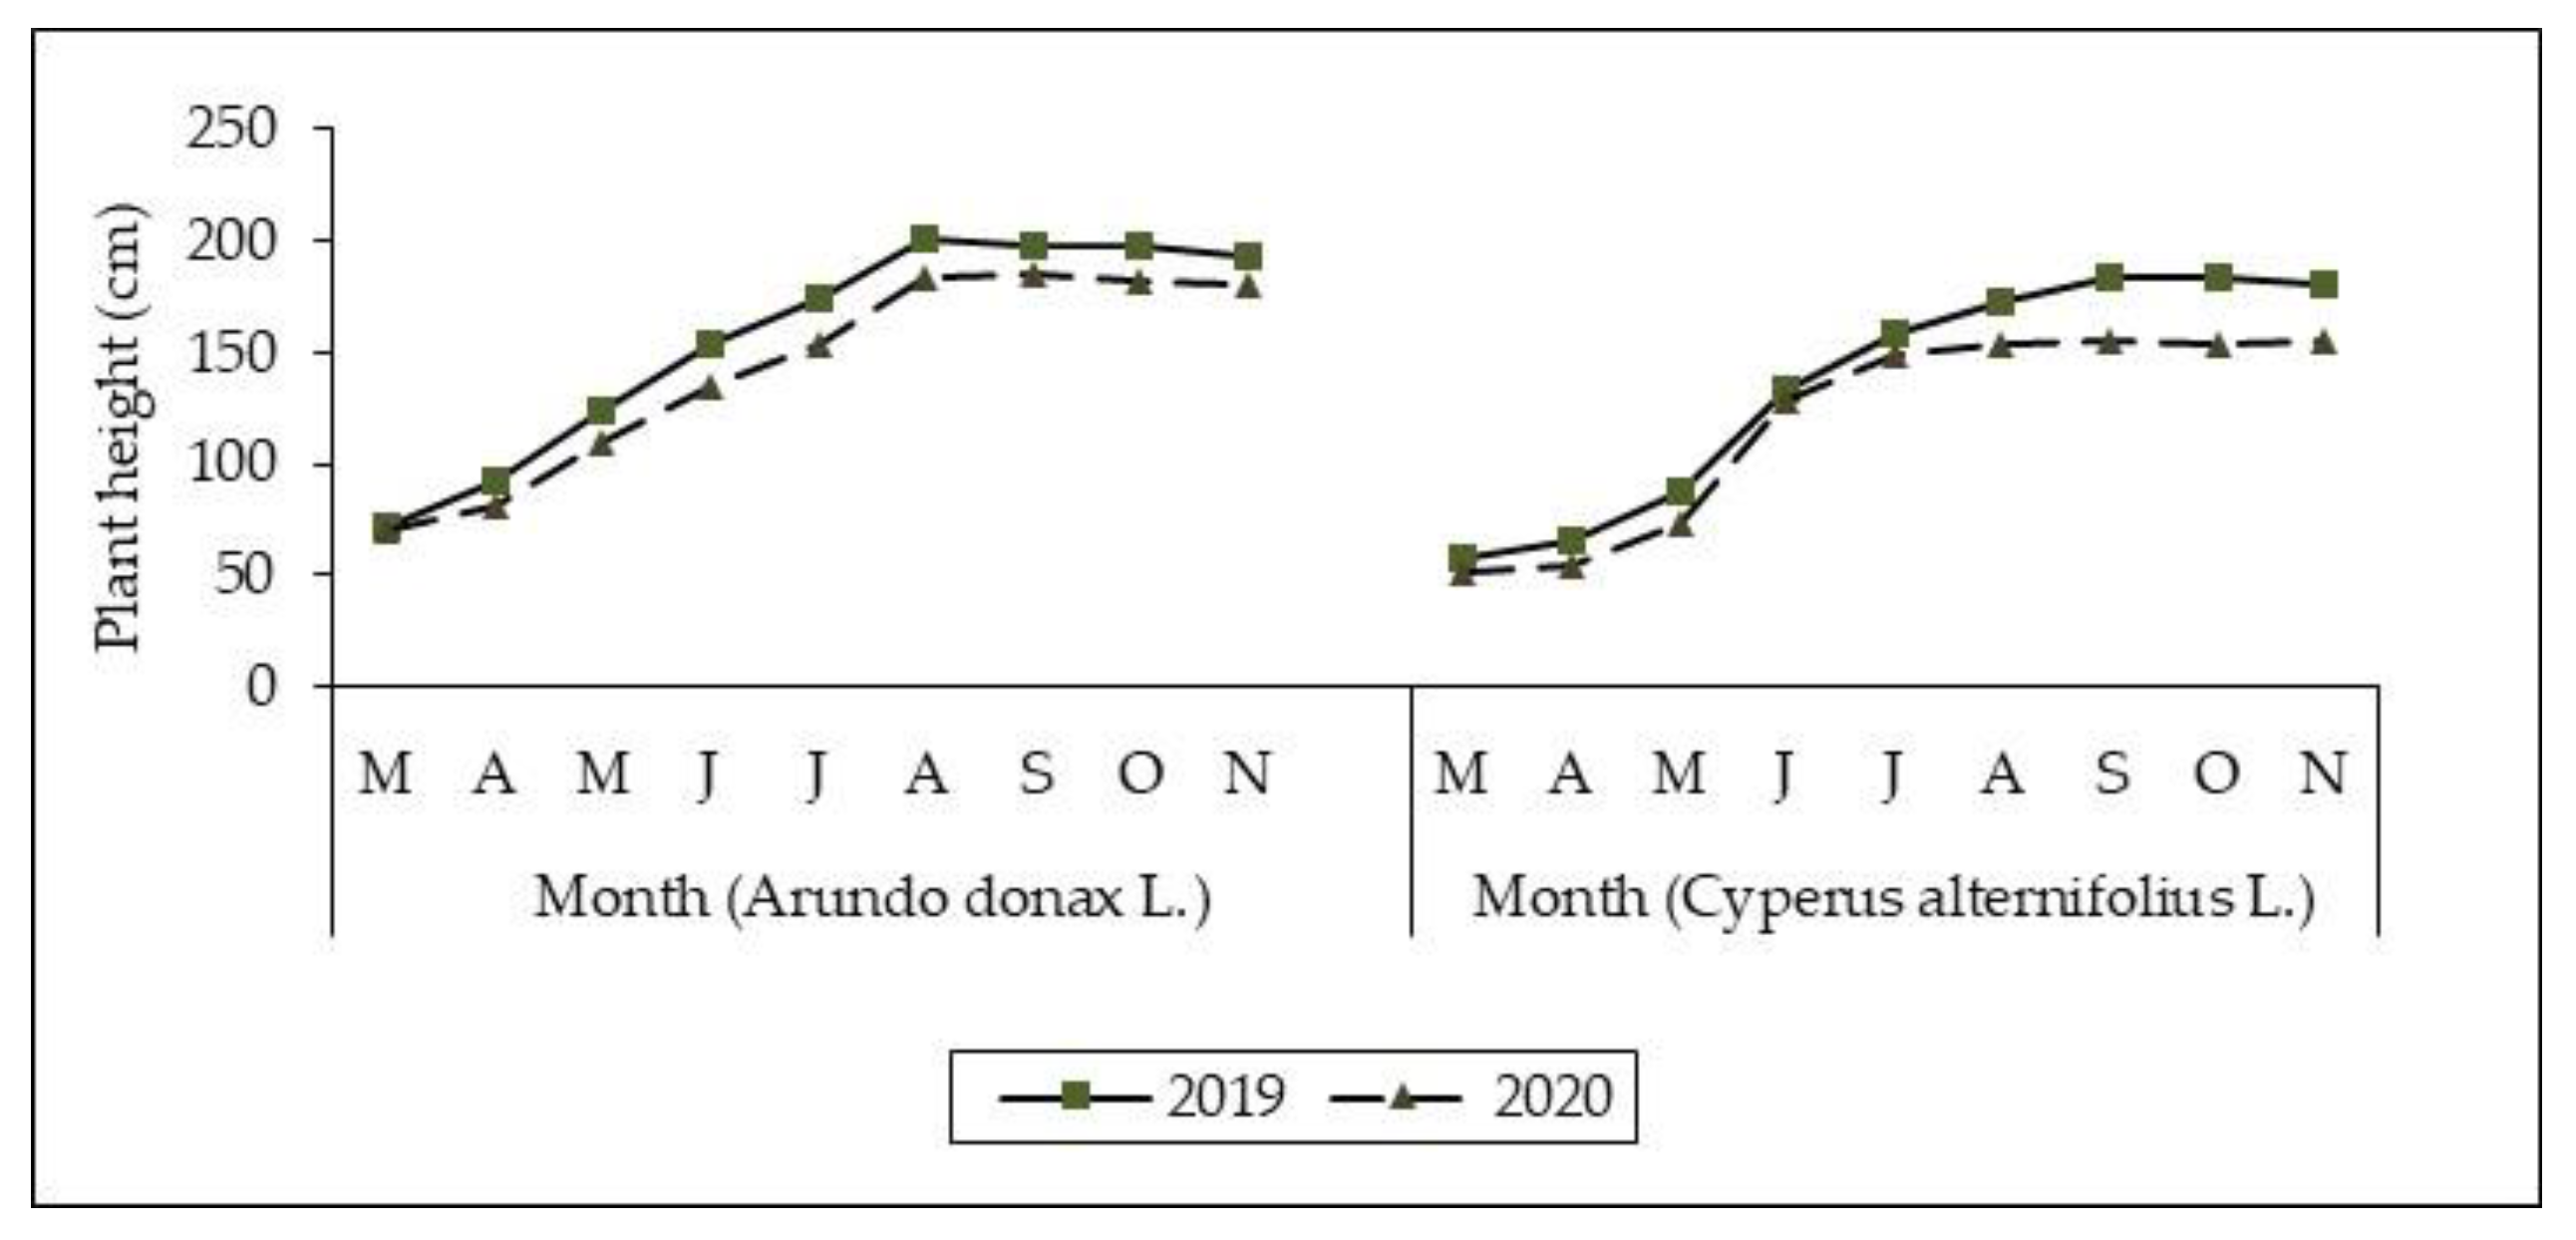
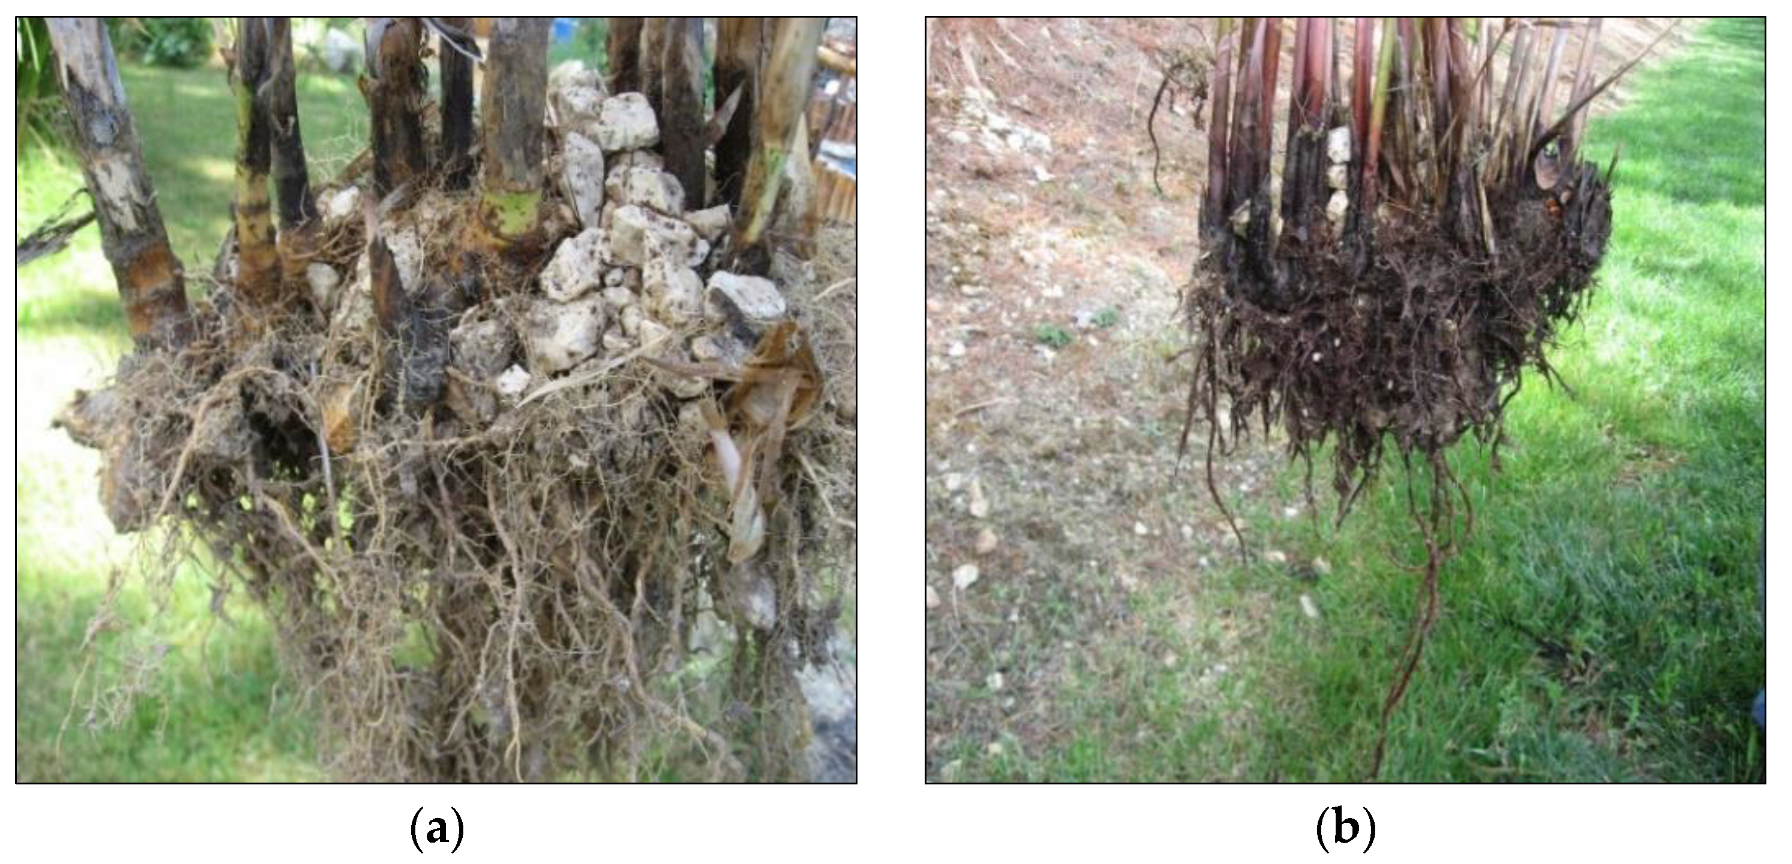
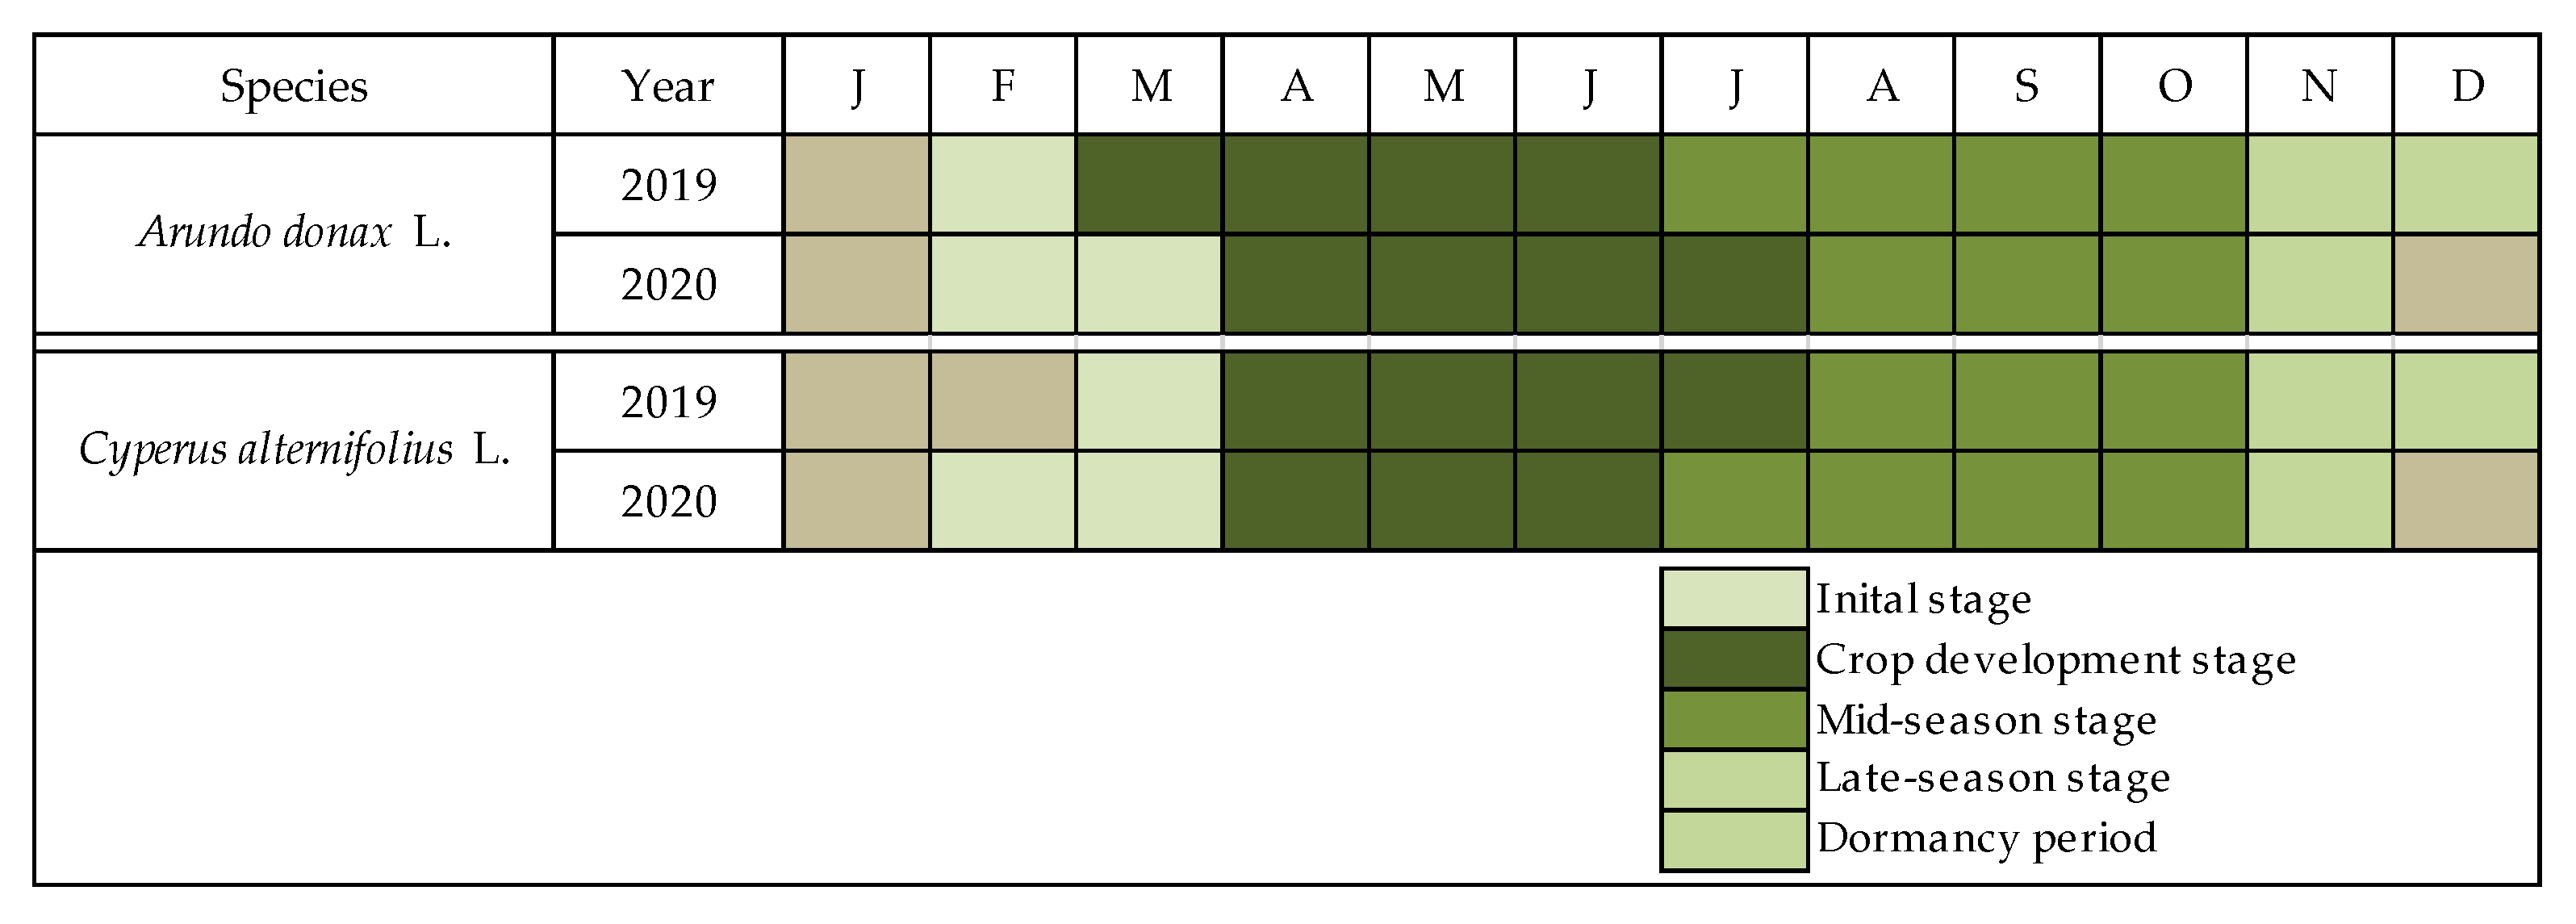
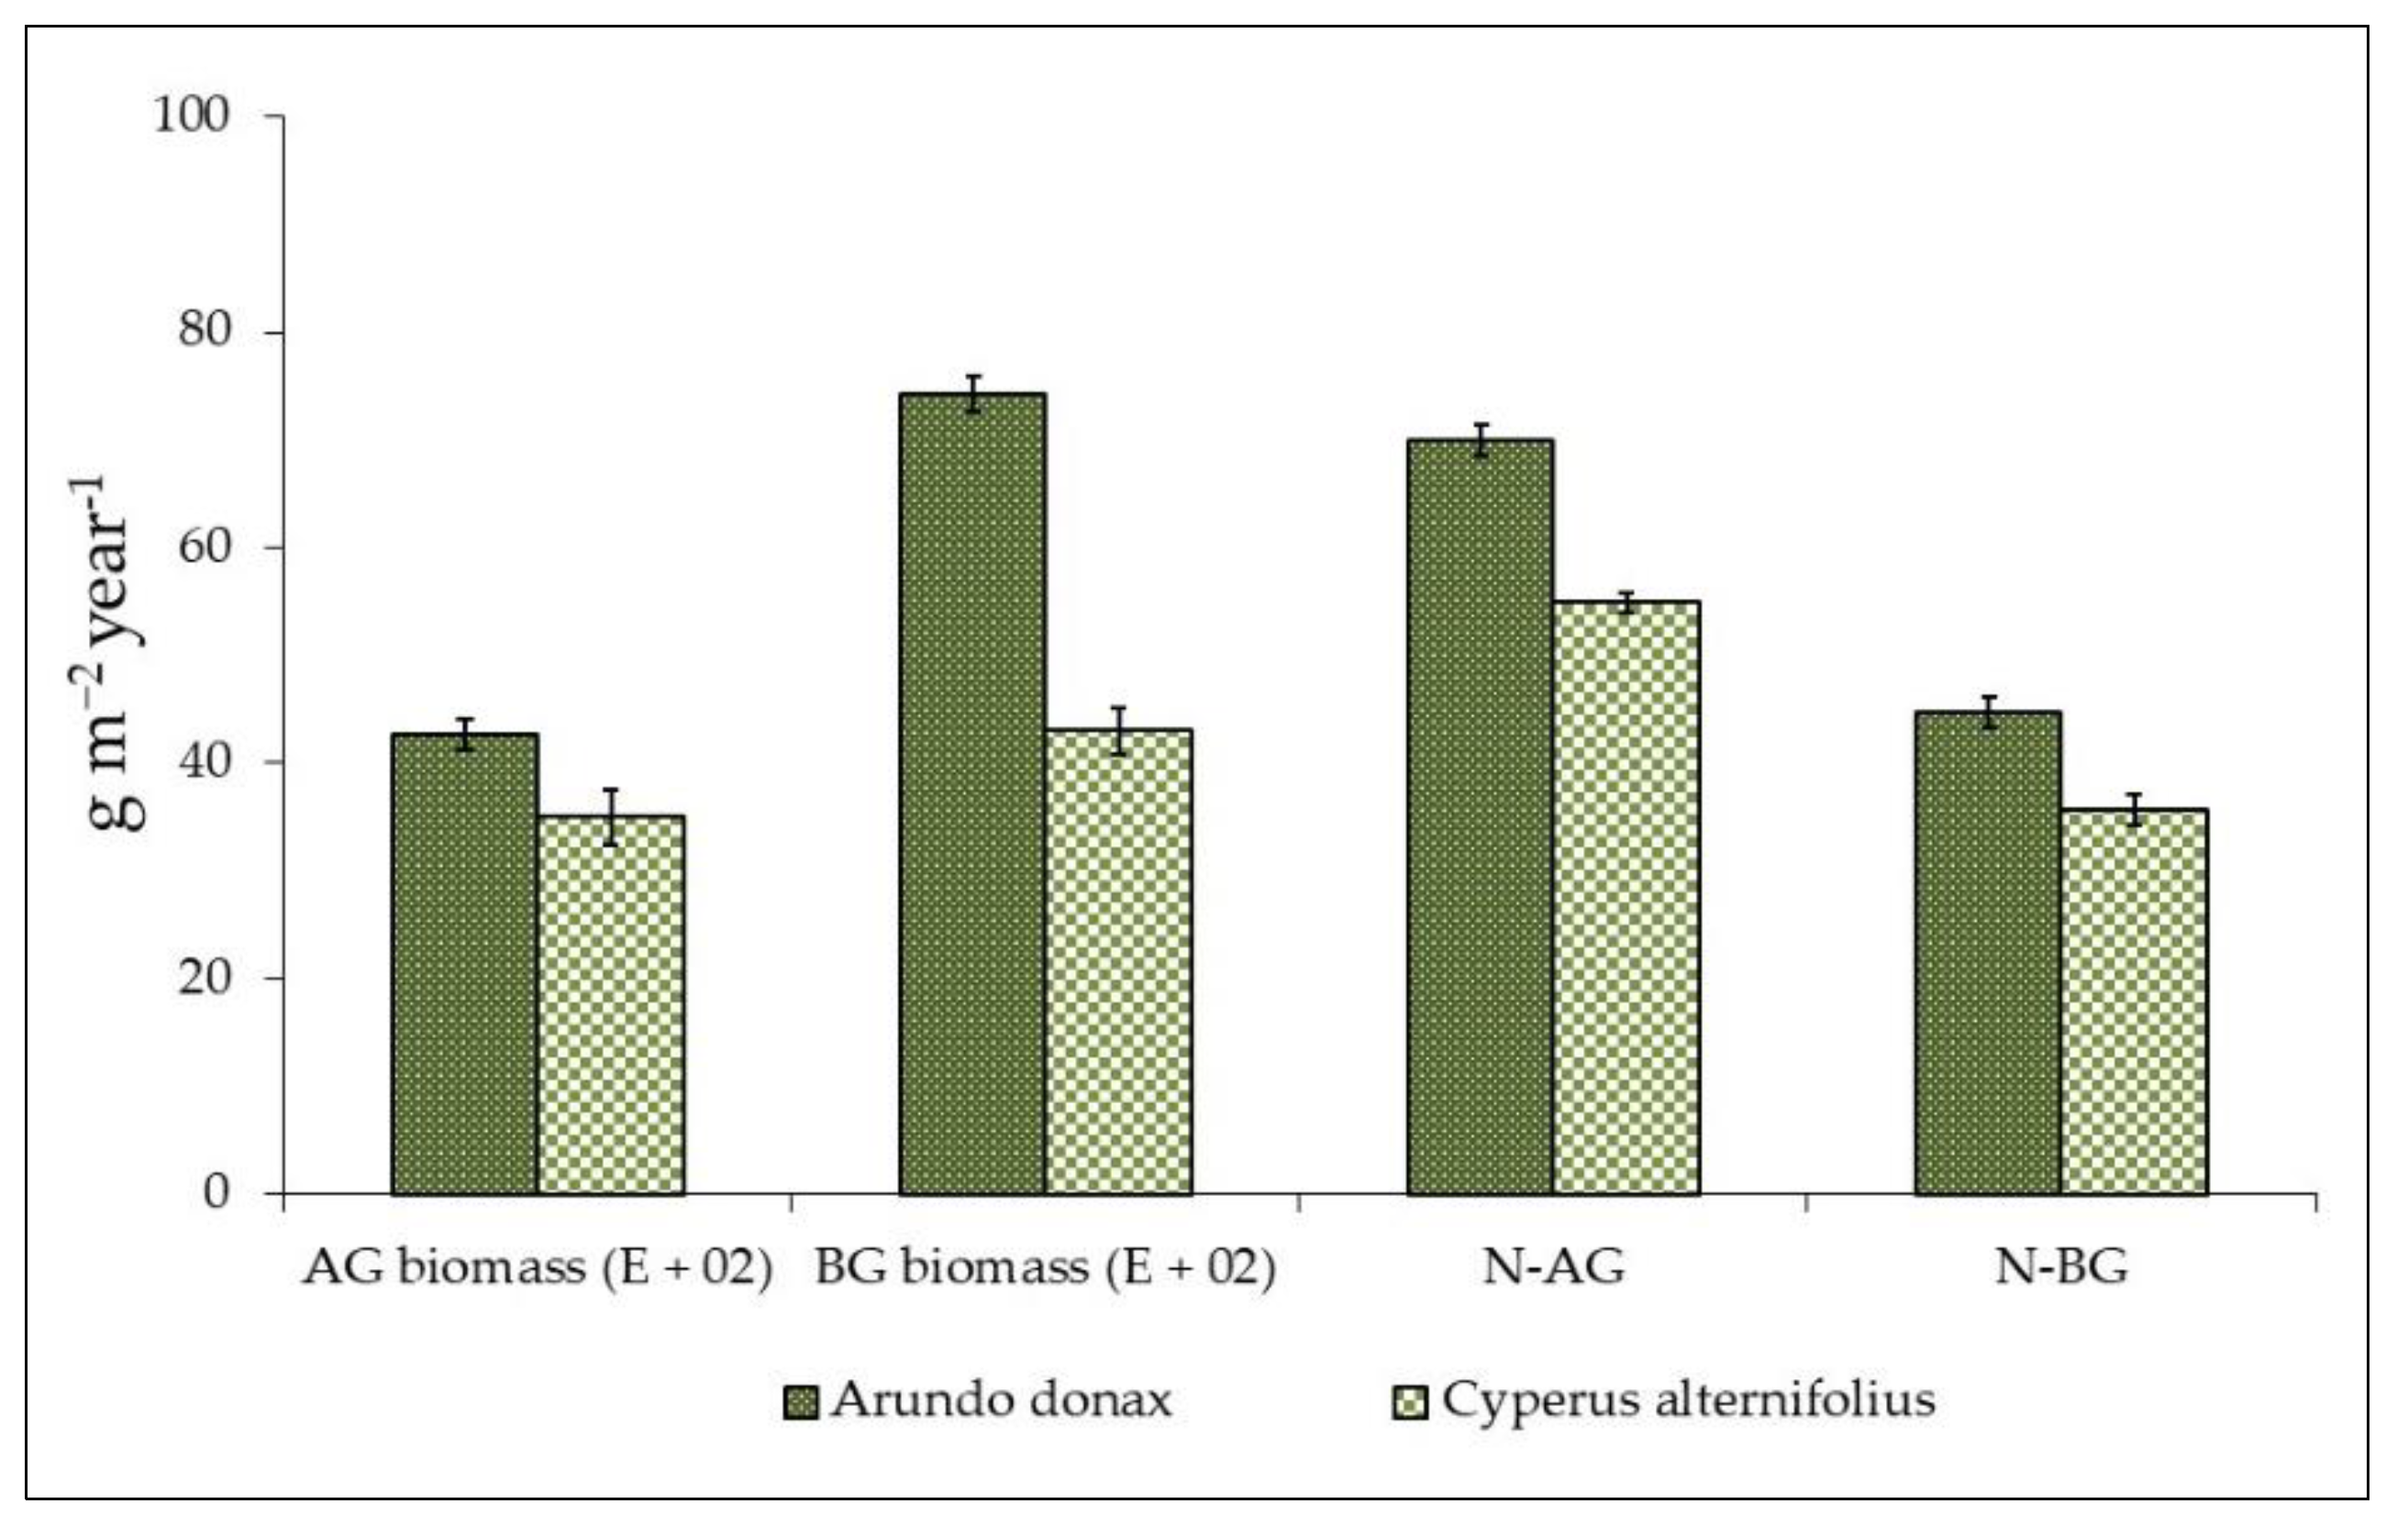
3.3. Plant Growth and Biomass Production

In both years, maximum plant growth was recorded during summer when the air temperatures were higher than those of other seasons.
Average plant heights ranged between 149.16 cm (giant reed) and 127.66 cm (umbrella sedge). In 2019, plant growth was more intense than in 2020 due to better climate conditions (Figure 5).
During the two years, average culm/stem density, root diameter and root length were not similar for the two species, highlighting different morphological traits (Table 4).
In both planted units, culm/stem density decreased over the period despite the different air temperatures. This was probably due to a self-thinning process which is common in plant monocultures, as explained in a study aimed at comparing two emergent macrophytes in a CW [67]. The distribution of the root system was uniform in both planted units, however, the root length increased more in the giant reed-unit (Figure 6).
These findings confirmed the differences in terms of morphological parameters between the two macrophytes in the study, as found previously [36,68].
When observing the length of the growth stages, differences between the species were recorded over the two years (Figure 7).
The initial stage was found to be the shortest whilst crop development stage and mid-season stage were the longest, on average. For giant reed, mid-season stage occurred at mid-July and at the end of October. In the case of umbrella sedge, this stage was longer in 2020 than 2019 and occurred at beginning of July and at the end of October. As observed in previous studies [36,69], during late-season stage, leaf loss for giant reed was limited during both years and was found to be lower than for umbrella sedge. In 2019, late-season stage occurred between November and December. Plants were harvested when dormancy started (beginning of December) and nutrient-uptake capacity of the species decreased greatly.
Figure 8 shows average plant biomass and nitrogen content of the two macrophytes for the years 2019–2020.
In the study period, giant reed produced greater biomass than umbrella sedge and was confirmed as a plant with high biomass yield potential. Average dry matter for the above-ground parts of the giant reed was 42,400 g m–2 y–1, and 63,000 g m–2 y–1 for the below-ground parts. Concerning umbrella sedge, average dry matter for the above-ground parts was 34,600 g m–2 y–1, and 38,700 g m–2 y–1 for the below-ground parts.
The different levels of biomass production of the two species greatly affected their capacity to remove pollutants from DWW. As stated in a previous study [36], we can say that the greater the production of biomass, the greater the nutrient uptake by the plants. In fact, the higher average biomass levels of giant reed allowed the plants to uptake greater levels of nutrients with respect to umbrella sedge. The nutrients were then partly stored in the roots and partly translocated to stem and leaves in order to allow for vegetative growth. Average N levels in the above-ground parts were found to be 69.10 g m–2 y–1 for giant reed and 53.24 g m–2 y–1 for umbrella sedge. In contrast, average N content in the below-ground parts was 43.32 g m–2 y–1 for giant reed and 32.93 g m–2 y–1 for umbrella sedge.
Observing the results, both species accumulated more N in the aerial parts than roots and this was consistent with other studies [24,69,70]. These results demonstrate that plants show good potential for N uptake from DWW in a CW, despite the fact that their N removal performance is generally found to be lower than that of microorganism removal and ranged from 0.50% to 40.00% of the TN removal [40,71,72]. However, it is worth noting that greater or lesser ability of plants to produce high biomass yield and remove nutrients from wastewaters depends heavily on various factors, such as morphological characteristics of plants, plant age, growing season, environmental conditions, CW configuration, type of wastewater and loading ranges [73,74].
When comparing the two species in this study, giant reed performed better than umbrella sedge in terms of N uptake due to greater plant biomass production over the two years and probably better adaptation to the environmental conditions of the HSSFs CW area. The high performance of giant reed was also confirmed by previous studies [75,76,77] conducted under different climate conditions, which highlight the fact that giant reed is one of the most high-yielding biomass species [78,79], despite being relatively underutilized in CWs [79]. On the contrary, the performance of umbrella sedge was much lower than that obtained in tropical and subtropical areas [80,81,82], where this species is commonly used in CWs.
In this study, heavy metal content in the plant biomass was not determined due to lower average levels in DWW.

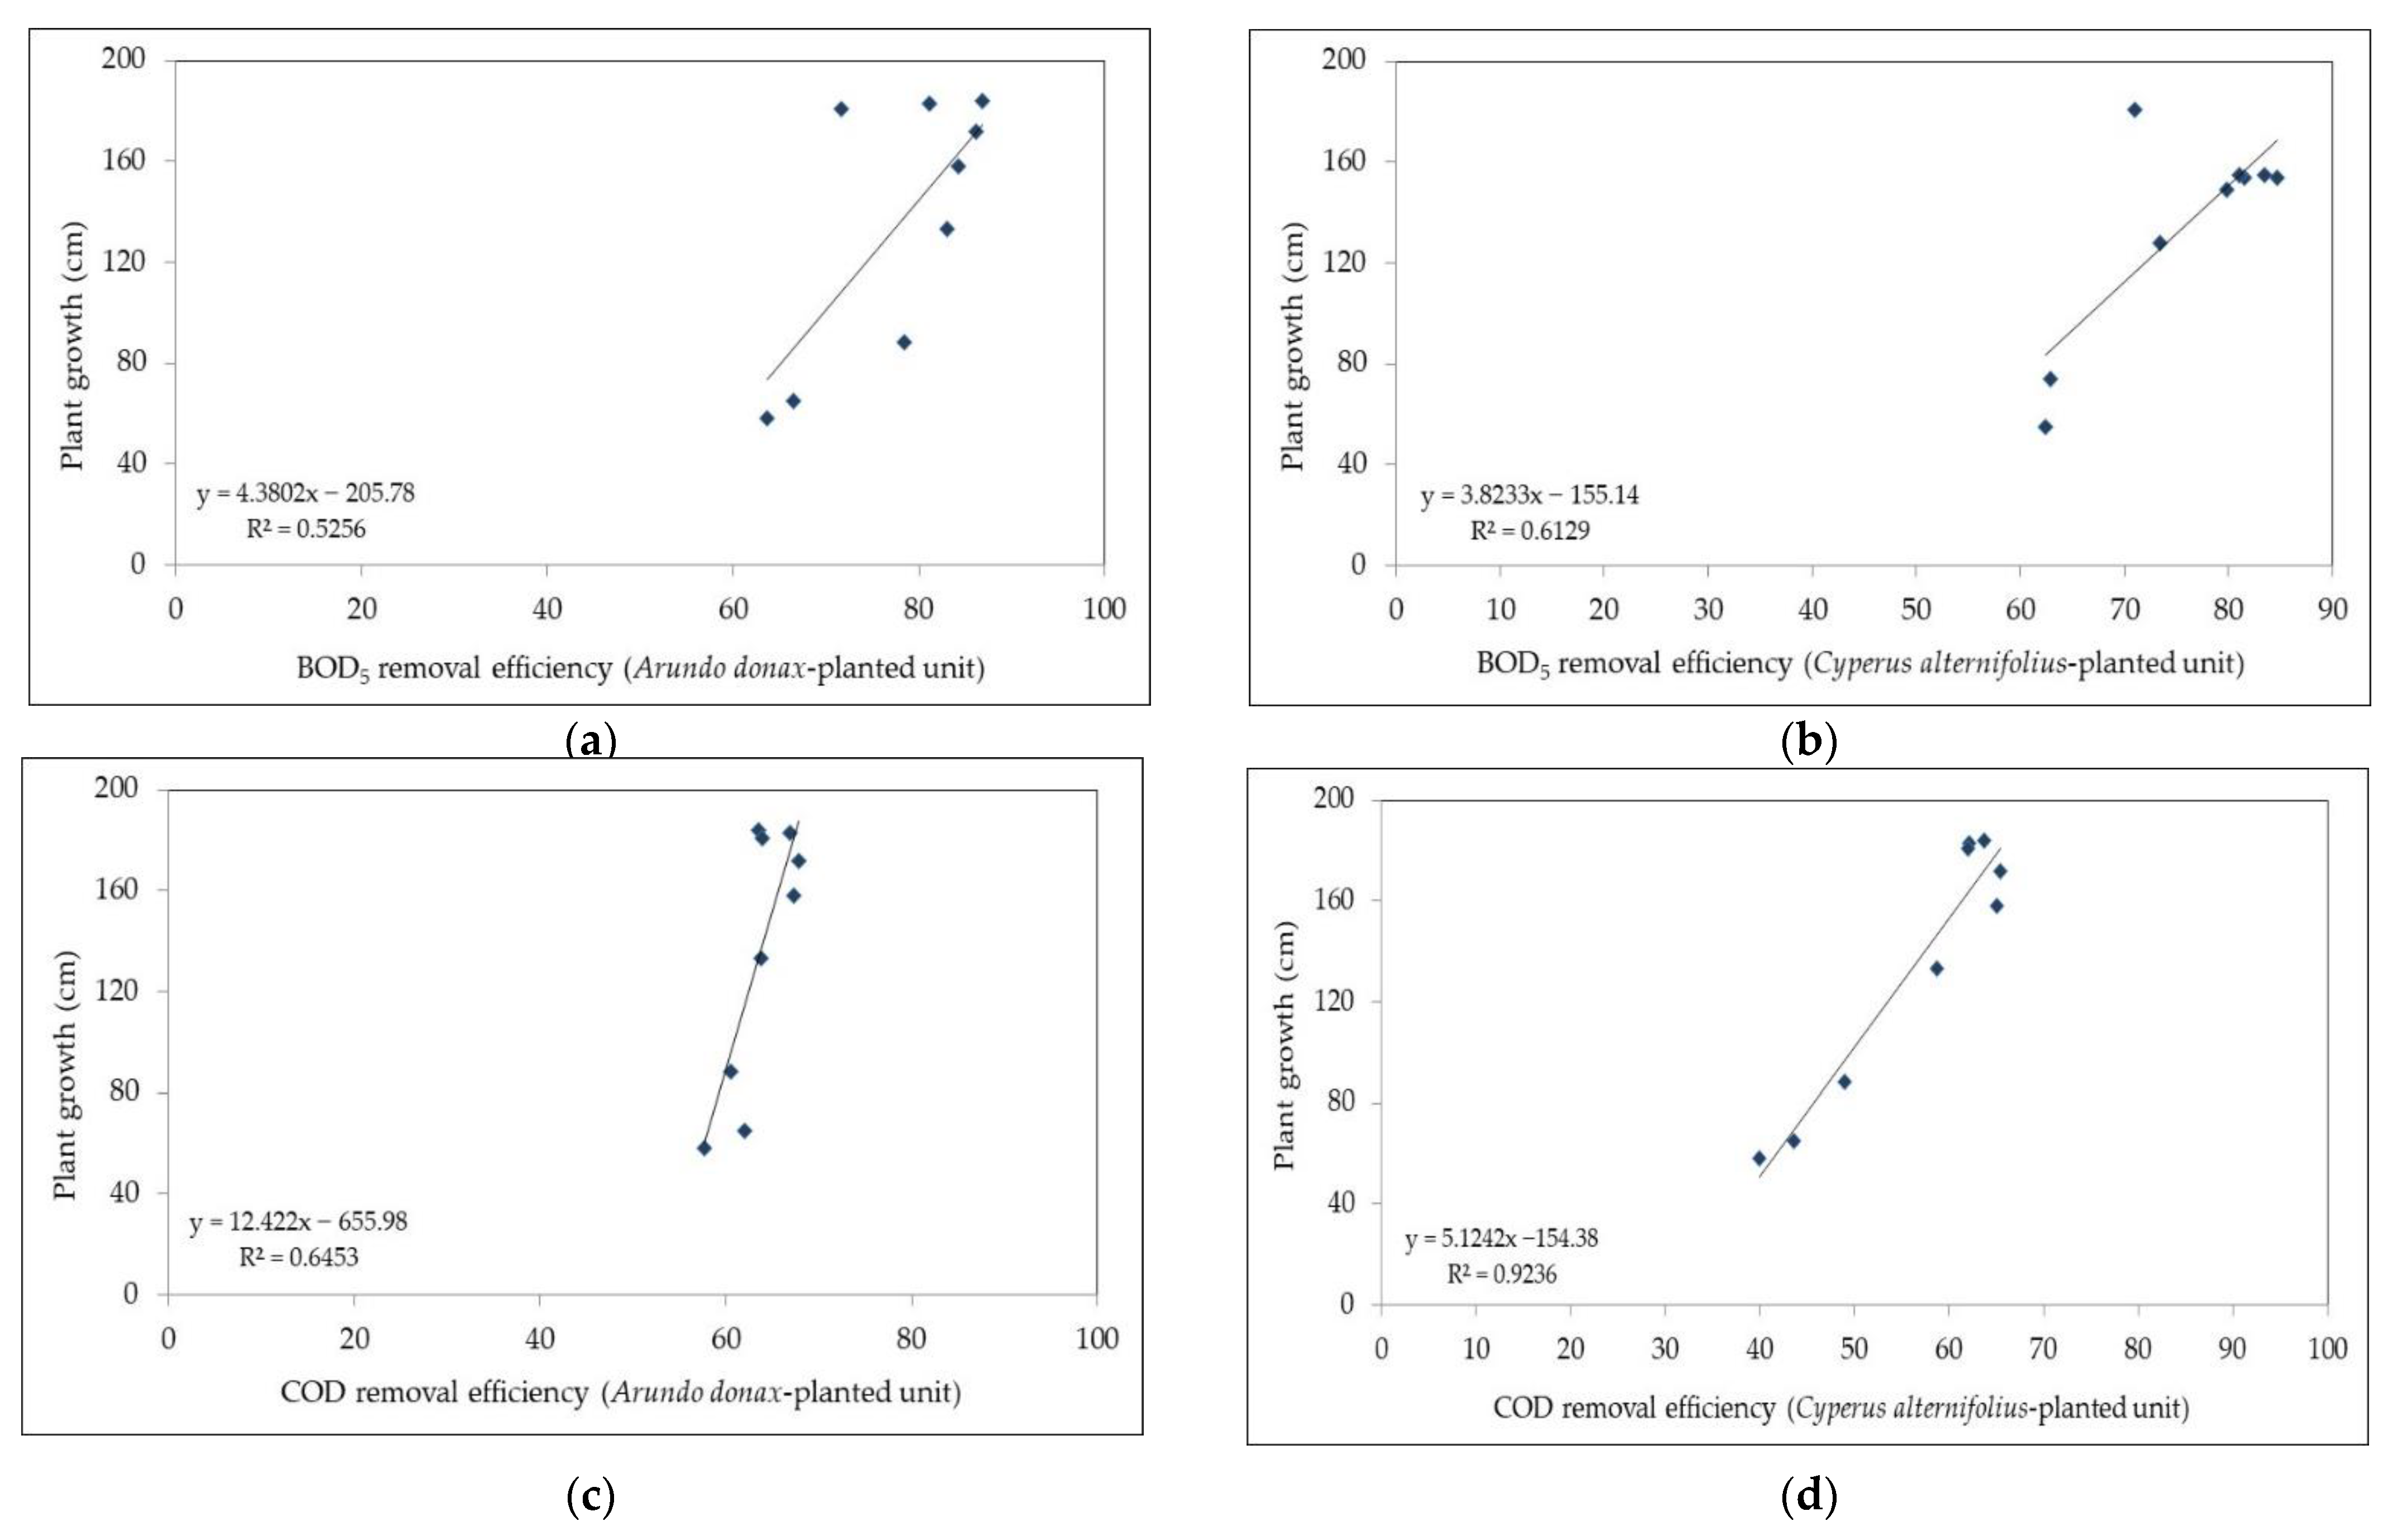
3.4. Effect of Plant Growth on BOD5 and COD RE

In Figure 9, the average BOD5 and COD concentrations at different dates in the two planted units are shown.
Observing the trend of BOD5 and COD concentration values at the outlet of the two planted units in both years, it is possible to note that the lowest values were obtained during summer months while the highest values were found during autumn and the beginning of spring.
Seasonal variations in RE of organic pollutants contained in DWW was recorded in the HSSFs CW. This phenomenon is due to a number of factors, however, the effect of vegetation on pollutant RE seems to be one the most important. Vegetation, in fact, affects organic pollutant RE in a CW due to plant growth which differs during the seasons, depending on environmental conditions.
In both planted units, the correlations (Figure 10) between plant growth and organic pollutants RE were positive and allow to say that as plant growth increases, the removal efficiency of organic pollutant also increases.
This aspect can be explained by considering also the interaction between plant and microorganisms in the substrate. As well-known in literature [32,40,66], vegetation provides surface areas for microbial growth and transports oxygen from the leaves to the roots and from the roots to rhizosphere, where it is exploited by bacteria to carry out the oxidation of organic compounds. Thus, vegetation increases the dissolved oxygen concentration in the rhizosphere and makes a contribution to the degradation of organic compounds.
However, the release of oxygen by roots in terms of rate is not the same during the months, being high in spring and summer due to intense plant growth and low in winter due to senescence. Consequently, in spring/summer, when plants grow fast due to favorable climate conditions, the oxidation of organic compounds by aerobic microorganisms is usually documented to be higher than in other seasons because of a greater level of oxygen in the root zone
In the case of DWW, it contains easily biodegradable organic substances [32]. Therefore, we can assume that seasonal variations in RE of these substances can be expected if this type of wastewater is treated by HSSFs CW.
Our results were confirmed by a number of studies. In Japan, in a study [83] carried out in a hybrid CWs for milking parlor wastewater treatment, removal rates for TSS, COD, TN, total carbon and total coliform were found to increase during warm periods, however, the system also performed well during the cold period. In Vermont (USA), three hybrid CWs planted with Schoenoplectus fluviatilis were used to treat DWW showing higher performance during peak vegetation growth [54]. In Portugal, in a HSSFs CW planted with Phragmites australis, removal efficiencies exhibited seasonal trends for N and P compounds and higher N removal rates were recorded during the warm period due to more intense plant growth [84]. In China, the authors investigated how plants and air temperature affected CWs performance and found that removal efficiency of NH4, NO3, TN and TP decreased using polyculture systems and with the decline in temperature [85]. Similar results were obtained by other authors in China [86]. In Kentucky (USA), in 12 subsurface flow wetlands planted with various aquatic species and used for the treatment of domestic wastewater, it was observed that not only did the planted units perform better during the warmer months, but that a polyculture system provided more consistent treatment of various pollutants and was less susceptible to seasonal variation than a monoculture system [87].
The results of these studies confirm seasonal variations in RE of organic and mineral pollutants in CWs and highlight the significant effect of vegetation.

4. Conclusions

The results of this study confirm the efficiency of CWs for DWW treatment. The pilot HSSFs CW led to a significant improvement in the chemical and microbiological quality of combined dairy and domestic wastewater. In particular, RE values were high for BOD5, COD, TSS and all microbiological parameters. This was also due to efficient pretreatment of the wastewater using biological technologies which were greatly efficient in removing organic compounds. On the other hand, TN, TP and Escherichia coli levels did not meet the threshold values in a constant manner required by Italian Legislative Decree 156/2006 concerning the discharge of treated wastewater into the soil. The role of vegetation was essential in DWW removal processes as plants affect the activity of microorganisms through the release of oxygen in the root zone. Arundo donax was more suitable for removal of nitrogen than Cyperus alternifolius and produced greater levels of plant biomass. Despite differing performances, both planted units showed seasonal variations in RE of organic pollutants, probably due to diverse intensity of plant growth over the course of the year. Thus, the removal of organic compounds was found to increase during warm periods and decrease in cold periods. This aspect should be taken into consideration as DWW treatment using CWs needs to be highly efficient throughout all seasons in order to prevent environmental pollution. It is possible to affirm that a combination of various CW systems and the use of a polyculture system with warm and cold-season species could lead to improvements in the treatment performance of DWW and to obtaining constantly high pollutant RE values. Further studies should be carried out focusing on the technical benefits of these solutions regarding the treatment of DWW on dairy farms.

Author Contributions

Conceptualization, M.L. and T.T.; methodology, M.L. and T.T.; software, N.I. and D.F.; validation, R.R. and G.V.; formal analysis, R.R., N.I. and D.F.; investigation, M.L. and G.V.; re-sources, F.R. and T.T.; data curation, N.I., G.V. and D.F.; writing—original draft preparation, M.L.; writing—review and editing, M.L. and R.R.; visualization, R.R., N.I. and G.V.; super-vision, F.R. and T.T.; project administration, M.L., R.R., F.R. and T.T. All authors have read and agreed to the published version of the manuscript.

Funding

This research received no external funding.

Institutional Review Board Statement

Not applicable.

Informed Consent Statement

Not applicable.

Data Availability Statement

Data are available by contacting the authors.

Acknowledgments

The authors would like to thank all staff of the dairy farm for their help during the two years. Special thanks go to Lucie Branwen Hornsby for her linguistic assistance.

Conflicts of Interest

The authors declare no conflict of interest.

References

  1. L’Industria Alimentare in Italia. Available online: www.ismea.it (accessed on 1 October 2020).
  2. Annual Production Series of Dairy Products. Available online: www.ec.europa.eu (accessed on 10 October 2020).
  3. Milk and Dairy Products. Available online: www.dati.istat.it (accessed on 21 October 2020).
  4. Rossi, P.; Marchiorlatti Vignat, I. Caratteristiche dei caseifici dell’area del sisma. In Progetto ERICA: Linee Guida Efficienza Energetica e Rinnovabili per il Caseificio del Futuro, 1st ed.; C.R.P.A.: Regione Emilia-Romagna, Italy, 2013; Volume 1, pp. 12–24. [Google Scholar]
  5. Sanna, M. Antinquinamento delle Industrie Alimentari, 1st ed.; Luigi Scialpi: Rome, Italy, 1982; p. 565. [Google Scholar]
  6. Matos, A.T.; Freitas, W.S.; Lo Monaco, P.A.V. Eficiéncia de sistemas alagados construídos na remoção de poluentes de águas resíduárias da suinocultura. Ambient. Agua Interdiscip. J. Appl. Sci. 2010, 5, 119–132. [Google Scholar] [CrossRef] [Green Version]
  7. Vourch, M.; Balannec, B.; Chaufer, B.; Dorange, G. Treatment of dairy industry wastewater by reverse osmosis for water reuse. Desalination 2008, 219, 190–202. [Google Scholar] [CrossRef]
  8. Sarkar, B.; Chakrabarti, P.P.; Vijaykumar, A.; Kale, V. Wastewater treatment in dairy industries—Possibility of reuse. Desalination 2006, 195, 141–152. [Google Scholar] [CrossRef]
  9. Prazeres, A.R.; Rivas, J.; Almeida, M.A.; Patanita, M.; Dôres, J.; Carvalho, F. Agricultural reuse of cheese whey wastewater treated by NaOH precipitation for tomato production under several saline conditions and sludge management. Agric. Water Manag. 2016, 167, 2–74. [Google Scholar] [CrossRef]
  10. Carvalho, F.; Prazeres, A.R.; Rivas, J. Cheese whey wastewater: Characterization and treatment. Sci. Total Environ. 2013, 445–446, 385–396. [Google Scholar] [CrossRef]
  11. Demirel, B.; Yenigun, O.; Onay, T.T. Anaerobic treatment of dairy wastewaters: A review. Process Biochem. 2005, 40, 2583–2595. [Google Scholar] [CrossRef]
  12. Akratos, C.S.; van Oirshot, D.; Tekerlekopoulou, A.G.; Vajenas, D.V.; Stefanakis, A. Dairy wastewater treatment with constructed wetlands: Experiences from Belgium, the Netherlands and Greece. In Constructed Wetlands for Industrial Wastewater Treatment, 1st ed.; Stefanakis, A.I., Ed.; John Wiley & Sons, Ltd.: Hoboken, NJ, USA, 2018; Volume 1, pp. 175–198. [Google Scholar]
  13. Masi, F.; Rizzo, A.; Bresciani, R.; Basile, C. Dairy wastewater treatment by horizontal subsurface flow constructed wetland in southern Italy. In Natural and Constructed Wetlands, 1st ed.; Vymazal, J., Ed.; Springer: Cham, Switzerland, 2016; Volume 1, pp. 131–139. [Google Scholar]
  14. Pattnaik, R.; Yost, R.S.; Porter, G.; Masunaga, T.; Attanandana, T. Improving multi-soil-layer (MSL) system remediation of dairy effluent. Ecol. Eng. 2007, 32, 1–10. [Google Scholar] [CrossRef]
  15. Prazeres, A.R.; Carvalho, F.; Rivas, J. Cheese whey management: A review. J. Environ. Manag. 2012, 110, 48–68. [Google Scholar] [CrossRef] [PubMed]
  16. Farizoglu, B.; Keskinler, B.; Yildiz, E.; Nuhoglu, A. Cheese whey treatment performance of an aerobic jet loop membrane bioreactor. Process Biochem. 2004, 39, 2283–2291. [Google Scholar] [CrossRef]
  17. Smithers, G.W. Whey and whey proteins—From “gutter-to-gold”. Int. Dairy J. 2008, 18, 695–704. [Google Scholar] [CrossRef]
  18. OECD–FAO. Agricultural Outlook 2008–2017, Highlights. Available online: www.agris.fao.org (accessed on 3 November 2020).
  19. Prazeres, A.R.; Carvalho, F.; Rivas, J.; Patanita, M.; Dôres, J. Growth and development of tomato plants Lycopersicon esculentum Mill. under different saline conditions by fertirrigation with pretreated cheese whey wastewater. Water Sci. Technol. 2013, 67, 2033–2041. [Google Scholar] [CrossRef]
  20. Prazeres, A.R.; Carvalho, F.; Rivas, J.; Patanita, M.; Dôres, J. Pretreated cheese whey wastewater management by agricultural reuse: Chemical characterization and response of tomato plants Lycopersicon esculentum Mill. under salinity conditions. Sci. Total Environ. 2013, 463–464, 943–951. [Google Scholar] [CrossRef]
  21. Hawke, R.; Summers, S. Effects of land application of farm dairy effluent on soil properties: A literature review. N. Z. J. Agric. Res. 2006, 49, 307–320. [Google Scholar] [CrossRef]
  22. Liu, Y.Y.; Haynes, R. Effect of long-term irrigation with dairy factory wastewater on soil properties. In Proceedings of the 19th World Congress of Soil Science, Soil Solutions for a Changing World, Brisbane, Australia, 1–6 August 2010; pp. 70–73. [Google Scholar]
  23. Ibekwe, A.M.; Grieve, C.M.; Lyon, S.R. Characterization of Microbial Communities and Composition in Constructed Dairy Wetland Wastewater Effluent. Appl. Environ. Microbiol. 2003, 69, 5060–5069. [Google Scholar] [CrossRef] [Green Version]
  24. Schierano, M.C.; Panigatti, M.C.; Maine, M.A.; Griffa, C.A.; Boglione, R. Horizontal subsurface flow constructed wetland for tertiary treatment of dairy wastewater: Removal efficiencies and plant uptake. J. Environ. Manag. 2020, 272, 111094. [Google Scholar] [CrossRef] [PubMed]
  25. Ahmad, T.; Aadil, R.M.; Ahmed, H.; Rahman, U.U.; Soares, B.C.; Souza, S.L.; Pimentel, T.C.; Scudino, H.; Guimarães, J.T.; Esmerino, E.A.; et al. Treatment and utilization of dairy industrial waste: A review. Trends Food Sci. Technol. 2019, 88, 361–372. [Google Scholar] [CrossRef]
  26. Kushwaha, J.P.; Srivastava, V.C.; Mall, I.D. An Overview of Various Technologies for the Treatment of Dairy Wastewaters. Crit. Rev. Food Sci. Nutr. 2011, 51, 442–452. [Google Scholar] [CrossRef] [PubMed]
  27. Licata, M.; Tuttolomondo, T.; Virga, G.; Leto, C.; La Bella, S. The use of constructed wetlands for the treatment of agro-industrial wastewater—A case study in a dairy-cattle farm in Sicily (Italy). Desalin. Water Treat. 2017, 76, 300–310. [Google Scholar] [CrossRef]
  28. Mantovi, P.; Marmiroli, M.; Maestri, E.; Tagliavini, S.; Piccinini, S.; Marmiroli, N. Application of a horizontal subsurface flow constructed wetland on treatment of dairy parlor wastewater. Bioresour. Technol. 2003, 88, 85–94. [Google Scholar] [CrossRef]
  29. Gorra, R.; Freppaz, M.; Zanini, E.; Scalenghe, R. Mountain dairy wastewater treatment with the use of a ‘irregularly shaped’ constructed wetland (Aosta Valley, Italy). Ecol. Eng. 2014, 73, 176–183. [Google Scholar] [CrossRef]
  30. Comino, E.; Riggio, V.; Rosso, M. Mountain cheese factory wastewater treatment with the use of a hybrid constructed wetland. Ecol. Eng. 2011, 37, 1673–1680. [Google Scholar] [CrossRef]
  31. Mantovi, P.; Piccinini, S.; Lina, F.; Marmiroli, N.; Marmiroli, N. Treating wastewaters from cheese production in H-SSFs con-structed wetlands. In Proceedings of the International Conference Multifunctions of Wetland Systems, Padova, Italy, 26–29 June 2007; pp. 72–73. [Google Scholar]
  32. Sultana, M.Y. Treatment of Industrial and Agro-Industrial Wastewater Using Constructed Wetlands. Ph.D. Thesis, School of Engineering, University of Patras, Patras, Greece, 18 November 2014. [Google Scholar]
  33. Sultana, M.-Y.; Mourti, C.; Tatoulis, T.; Akratos, C.S.; Tekerlekopoulou, A.G.; Vayenas, D.V. Effect of hydraulic retention time, temperature, and organic load on a horizontal subsurface flow constructed wetland treating cheese whey wastewater. J. Chem. Technol. Biotechnol. 2015, 91, 726–732. [Google Scholar] [CrossRef]
  34. Vymazal, J. The use constructed wetlands with horizontal sub-surface flow for various types of wastewater. Ecol. Eng. 2009, 35, 1–17. [Google Scholar] [CrossRef]
  35. Nguyen, L.M. Organic matter composition, microbial biomass and microbial activity in gravel-bed constructed wetlands treating farm dairy wastewaters. Ecol. Eng. 2000, 16, 199–221. [Google Scholar] [CrossRef]
  36. Leto, C.; Tuttolomondo, T.; La Bella, S.; Leone, R.; Licata, M. Growth of Arundo donax L. and Cyperus alternifolius L. in a hor-izontal subsurface flow constructed wetland using pre-treated urban wastewater—A case study in Sicily (Italy). Desalin. Water Treat. 2013, 251, 7447–7459. [Google Scholar] [CrossRef]
  37. Allen, R.G.; Pereira, L.S.; Raes, D.; Smith, M. Introduction to crop evapotranspiration (ETc). In Crop Evapotranspiration: Guidelines for Computing Crop Requirements—FAO Irrigation and Drainage Paper 56, 1st ed.; FAO: Rome, Italy, 1998; Volume 1, pp. 89–102. [Google Scholar]
  38. APAT; CNR-IRSA. Metodi Analitici Per le Acque. Agenzia per la Protezione dell’Ambiente e per i Servizi Tecnici, Con-siglio Nazionale delle Ricerche, 1st ed.; Istituto di Ricerca sulle Acque: Rome, Italy, 2004; 1149p. [Google Scholar]
  39. Standard Methods for the Examination of Water and Wastewater, 19th ed.American Public Health Association: Washington, DC, USA, 1998.
  40. Kadlec, R.H.; Knight, R.L.; Vymazal, J.; Brix, H.; Cooper, P.; Haberl, R. Constructed Wetlands for Pollution Control: Processes, Performance, Design and Operation, 1st ed.; International Water Association Publishing: London, UK, 2000; pp. 17–90. [Google Scholar]
  41. Servizio Informativo Agrometeorologico Siciliano. Available online: www.sias.regione.sicilia.it (accessed on 24 January 2021).
  42. Kottek, M.; Grieser, J.; Beck, C.; Rudolf, B.; Rubel, F. World Map of the Köppen-Geiger climate classification updated. Meteorol. Z. 2006, 15, 259–263. [Google Scholar] [CrossRef]
  43. Brewer, A.; Cumby, T.; Dimmock, S. Dirty water from dairy farms, II: Treatment and disposal options. Bioresour. Technol. 1999, 67, 161–169. [Google Scholar] [CrossRef]
  44. Vymazal, J. Constructed wetlands for treatment of industrial wastewaters: A review. Ecol. Eng. 2014, 73, 724–751. [Google Scholar] [CrossRef]
  45. Brix, H.; Sorrell, B.K.; Lorenzen, B. Are Phragmites-dominated wetlands a net source or net sink of greenhouse gases? Aquat. Bot. 2001, 69, 313–324. [Google Scholar] [CrossRef]
  46. Chen, D.; Gu, X.; Zhu, W.; He, S.; Wu, F.; Huang, J.; Zhou, W. Denitrification- and anammox-dominant simultaneous nitri-fication, anammox and denitrification (SNS) process in subsurface flow constructed wetlands. Biores. Technol. 2019, 271, 298–305. [Google Scholar] [CrossRef]
  47. Beebe, D.A.; Castle, J.W.; Molz, F.J.; Rodgers, J.H., Jr. Effects of evapotranspiration on treatment performance in constructed wetlands: Experimental studies and modeling. Ecol. Eng. 2014, 71, 394–400. [Google Scholar] [CrossRef] [Green Version]
  48. Headley, T.; Davison, L.; Huett, D.; Müller, R. Evapotranspiration from subsurface horizontal flow wetlands planted with Phragmites australis in sub-tropical Australia. Water Res. 2012, 46, 345–354. [Google Scholar] [CrossRef]
  49. Licata, M.; Tuttolomondo, T.; Leto, C.; La Bella, S.; Virga, G. The use of constructed wetlands for the treatment and reuse of urban wastewater for the irrigation of two warm-season turfgrass species under Mediterranean climatic conditions. Water Sci. Technol. 2017, 76, 459–470. [Google Scholar] [CrossRef] [Green Version]
  50. Pedescoll, A.; Sidrach-Cardona, R.; Sánchez, J.; Bécares, E. Evapotranspiration affecting redox conditions in horizontal constructed wetlands under Mediterranean climate: Influence of plant species. Ecol. Eng. 2013, 58, 335–343. [Google Scholar] [CrossRef]
  51. Tuttolomondo, T.; Licata, M.; Leto, C.; Leone, R.; La Bella, S. Effect of plant species on water balance in a pilot-scale horizontal subsurface flow constructed wetland planted with Arundo donax L. and Cyperus alternifolius L.—Two-year tests in a Mediterranean environment in the West of Sicily (Italy). Ecol. Eng. 2015, 74, 79–92. [Google Scholar] [CrossRef]
  52. La Bella, S.; Tuttolomondo, T.; Leto, C.; Bonsangue, G.; Leone, R.; Virga, G.; Licata, M. Pollutant removal efficiency of a pi-lot-scale Horizontal Subsurface Flow in Sicily (Italy) planted with Cyperus alternifolius L. and Typha latifolia L. and reuse of treated wastewater for irrigation of Arundo donax L. for pellet production—Results of two-year tests under Mediterranean climatic conditions. Desalin. Water Treat. 2016, 57, 22743–22763. [Google Scholar]
  53. Cooper, P.F.; Job, G.D.; Green, M.B.; Shutes, R.B.E. Reed Beds and Constructed Wetlands for Wastewater Treatment; WRc Publications: Marlow, UK, 1996. [Google Scholar]
  54. Lee, M.S.; Drizo, A.; Rizzo, D.M.; Druschel, G.; Hayden, N.; Twohig, E. Evaluating the efficiency and temporal variation of pilot-scale constructed wetlands and steel slag phosphorus removing filters for treating dairy wastewater. Water Res. 2010, 44, 4077–4086. [Google Scholar] [CrossRef] [PubMed]
  55. Kato, K.; Inoue, T.; Ietsugu, H.; Sasaki, H.; Harada, J.; Kitagawa, K.; Sharma, P.K. Design and performance of hybrid con-structed wetland systems for high-content wastewater treatment in the cold climate of Hokkaido, northern Japan. Water Sci. Technol. 2013, 68, 1468–1476. [Google Scholar] [CrossRef] [PubMed]
  56. Saeed, T.; Sun, G. A comprehensive review on nutrients and organics removal from different wastewaters employing sub-surface flow constructed wetlands. Crit. Rev. Environ. Sci. Technol. 2017, 47, 203–288. [Google Scholar] [CrossRef]
  57. Gasiunas, V.; Strusevicius, Z.; Struseviciene, M.-S. Pollutant Removal by Horizontal Subsurface Flow Constructed Wetlands in Lithuania. J. Environ. Sci. Health Part A 2005, 40, 1467–1478. [Google Scholar] [CrossRef] [PubMed]
  58. Lin, Y.F.; Jing, S.R.; Lee, D.Y.; Wang, T.W. Nutrient removal from aquaculture wastewater using a constructed wetlands sys-tem. Aquaculture 2002, 209, 169–184. [Google Scholar] [CrossRef]
  59. Lu, S.; Zhang, X.; Wang, J.; Pei, L. Impacts of different media on constructed wetlands for rural household sewage treatment. J. Clean. Prod. 2016, 127, 325–330. [Google Scholar] [CrossRef]
  60. Maine, M.A.; Suñe, N.; Hadad, H.; Sánchez, G.; Bonetto, C. Influence of vegetation on the removal of heavy metals and nu-trients in a constructed wetland. J. Environ. Manag. 2009, 90, 355–363. [Google Scholar] [CrossRef] [PubMed]
  61. Di Luca, G.; Maine, M.; Mufarrege, M.; Hadad, H.; Bonetto, C. Influence of Typha domingensis in the removal of high P concentrations from water. Chemosphere 2015, 138, 405–411. [Google Scholar] [CrossRef] [PubMed]
  62. Dunne, E.; Culleton, N.; O’Donovan, G.; Harrington, R.; Olsen, A. An integrated constructed wetland to treat contaminants and nutrients from dairy farmyard dirty water. Ecol. Eng. 2005, 24, 219–232. [Google Scholar] [CrossRef]
  63. Brisson, J.; Chazarenc, F. Maximizing pollutant removal in constructed wetlands: Should we pay more attention to macrophyte species selection? Sci. Total Environ. 2009, 407, 3923–3930. [Google Scholar] [CrossRef] [PubMed]
  64. Hamad, M.T. Comparative study on the performance of Typha latifolia and Cyperus Papyrus on the removal of heavy metals and enteric bacteria from wastewater by surface constructed wetlands. Chemosphere 2020, 260, 127551. [Google Scholar] [CrossRef]
  65. Vymazal, J. Horizontal sub-surface flow and hybrid constructed wetlands systems for wastewater treatment. Ecol. Eng. 2005, 25, 478–490. [Google Scholar] [CrossRef]
  66. Wu, S.; Carvalho, P.N.; Müller, J.A.; Manoj, V.R.; Dong, R. Sanitation in constructed wetlands: A review on the removal of human pathogens and fecal indicators. Sci. Total Environ. 2016, 541, 8–22. [Google Scholar] [CrossRef] [PubMed]
  67. Vymazal, J.; Krőpfelová, L. Growth of Phragmites australis and Phalaris arundinacea in constructed wetlands for wastewater treatment in the Czech Republic. Ecol. Eng. 2005, 25, 606–621. [Google Scholar] [CrossRef]
  68. Licata, M.; Gennaro, M.C.; Tuttolomondo, T.; Leto, C.; La Bella, S. Research focusing on plant performance in constructed wetlands and agronomic application of treated wastewater—A set of experimental studies in Sicily (Italy). PLoS ONE 2019, 14, e0219445. [Google Scholar] [CrossRef] [PubMed]
  69. Kantawanichkul, S.; Kladprasert, S.; Brix, H. Treatment of high-strength wastewater in tropical vertical flow constructed wetlands planted with Typha angustifolia and Cyperus involucratus. Ecol. Eng. 2009, 35, 238–247. [Google Scholar] [CrossRef]
  70. Borin, M.; Salvato, M. Effects of five macrophytes on nitrogen remediation and mass balance in wetland mesocosms. Ecol. Eng. 2012, 46, 34–42. [Google Scholar] [CrossRef]
  71. Di Luca, G.A.; Mufarrege, M.M.; Hadad, H.R.; Maine, M.A. Nitrogen and phosphorus removal and Typha domingensis tol-erance in a floating treatment wetland. Sci. Total Environ. 2019, 650, 233–240. [Google Scholar] [CrossRef] [PubMed] [Green Version]
  72. Białowiec, A.; Janczukowicz, W.; Randerson, P.F. Nitrogen removal from wastewater in vertical flow constructed wetlands containing LWA/gravel layers and reed vegetation. Ecol. Eng. 2011, 37, 897–902. [Google Scholar] [CrossRef]
  73. Saeed, T.; Sun, G. A review on nitrogen and organics removal mechanisms in subsurface flow constructed wetlands: De-pendency on environmental parameters, operating conditions and supporting media. J. Environ. Manag. 2012, 112, 419–448. [Google Scholar] [CrossRef]
  74. Vymazal, J. Removal of nutrients in various types of constructed wetlands. Sci. Total Environ. 2007, 380, 48–65. [Google Scholar] [CrossRef]
  75. Manios, T.; Kypriotakis, Z.; Manios, V.; Dialyna, G. Plant Species in a Two-Year-Old Free Water Surface Constructed Wetland Treating Domestic Wastewater in the Island of Crete. J. Environ. Sci. Health Part A 2002, 37, 1327–1335. [Google Scholar] [CrossRef]
  76. Zhu, S.-X.; Ge, H.-L.; Ge, Y.; Cao, H.-Q.; Liu, N.; Chang, J.; Zhang, C.-B.; Gu, B.-J.; Chang, S.-X. Effects of plant diversity on biomass production and substrate nitrogen in a subsurface vertical flow constructed wetland. Ecol. Eng. 2010, 36, 1307–1313. [Google Scholar] [CrossRef]
  77. Idris, S.M.; Jones, P.L.; Salzman, S.A.; Croatto, G.; Allison, G. Evaluation of the giant reed (Arundo donax) in horizontal sub-surface flow wetlands for the treatment of recirculating aquaculture system effluent. Environ. Sci. Pollut. Res. 2012, 19, 1159–1170. [Google Scholar] [CrossRef]
  78. Ciria, M.; Solano, M.; Soriano, P. Role of Macrophyte Typha latifolia in a Constructed Wetland for Wastewater Treatment and Assessment of Its Potential as a Biomass Fuel. Biosyst. Eng. 2005, 92, 535–544. [Google Scholar] [CrossRef]
  79. Avellan, C.T.; Ardakanian, R.; Gremillion, P. The role of constructed wetlands for biomass production within the wa-ter-soil-waste nexus. Water Sci. Technol. 2007, 75, 2237–2245. [Google Scholar] [CrossRef]
  80. Cui, L.-H.; Ouyang, Y.; Chen, Y.; Zhu, X.-Z.; Zhu, W.-L. Removal of total nitrogen by Cyperus alternifolius from wastewaters in simulated vertical-flow constructed wetlands. Ecol. Eng. 2009, 35, 1271–1274. [Google Scholar] [CrossRef]
  81. Kyambadde, J.; Kansiime, F.; Dalhammar, G. Nitrogen and Phosphorus Removal In Substrate-Free Pilot Constructed Wetlands With Horizontal Surface Flow In Uganda. Water Air Soil Pollut. 2005, 165, 37–59. [Google Scholar] [CrossRef]
  82. Soda, S.; Hamada, T.; Yamaoka, Y.; Ike, M.; Nakazato, H.; Saeki, Y.; Kasamatsu, T.; Sakurai, Y. Constructed wetlands for advanced treatment of wastewater with a complex matrix from a metal-processing plant: Bioconcentration and translocation factors of various metals in Acorus gramineus and Cyperus alternifolius. Ecol. Eng. 2012, 39, 63–70. [Google Scholar] [CrossRef]
  83. Sharma, P.K.; Takashi, I.; Kato, K.; Ietsugu, H.; Tomita, K.; Nagasawa, T. Seasonal efficiency of a hybrid sub-surface flow constructed wetland system in treating milking parlor wastewater at northern Hokkaido. Ecol. Eng. 2013, 53, 257–266. [Google Scholar] [CrossRef]
  84. Albuquerque, A.; Albuquerque, A.; Amaral, L.; Nogueira, R. Seasonal variation of nutrient removal in a full-scale horizontal constructed wetland. Energy Procedia 2017, 136, 225–232. [Google Scholar] [CrossRef]
  85. Zhou, Q.; Zhu, H.; Bañuelos, G.; Yan, B.; Liang, Y.; Yu, X.; Cheng, X.; Chen, L. Effects of Vegetation and Temperature on Nutrient Removal and Microbiology in Horizontal Subsurface Flow Constructed Wetlands for Treatment of Domestic Sewage. Water Air Soil Pollut. 2017, 228, 95. [Google Scholar] [CrossRef]
  86. Zhu, H.; Zhou, Q.-W.; Yan, B.-X.; Liang, Y.-X.; Yu, X.-F.; Gerchman, Y.; Cheng, X.-W. Influence of vegetation type and temperature on the performance of constructed wetlands for nutrient removal. Water Sci. Technol. 2017, 77, 829–837. [Google Scholar] [CrossRef] [PubMed]
  87. Karathanasis, A.D.; Potter, C.L.; Coyne, M.S. Vegetation effects on fecal bacteria, BOD, and suspended solid removal in con-structed wetlands treating domestic wastewater. Ecol. Eng. 2003, 20, 157–169. [Google Scholar] [CrossRef]
Figure 1. Cheese production in the dairy-cattle farm.
Water 13 01086 g001
Figure 2. A view of the pilot-scale horizontal sub-surface flow systems (HSSFs) constructed wetland CW.
Water 13 01086 g002
Figure 3. Layout of the system for treatment of combined dairy and domestic wastewater.
Water 13 01086 g003
Figure 4. Rainfall and air temperature trends. Graph (a) refers to 2019 while graph (b) refers to 2020.
Water 13 01086 g004
Figure 5. Plant height trend of giant reed and umbrella sedge (2019/2020).
Water 13 01086 g005
Figure 6. Root system of the two macrophytes. (a) refers to giant reed while (b) refers to umbrella sedge plants.
Water 13 01086 g006
Figure 7. Duration of the main growth stages of giant reed and umbrella sedge.
Water 13 01086 g007
Figure 8. Above-ground (AG) and below-ground (BG) biomass and nitrogen content (N) of giant reed and umbrella sedge. Bars indicate standard error of the means.
Water 13 01086 g008
Figure 9. Times series charts for BOD5 and COD removal with influent and effluent concentrations in the two planted units; (a) refers to BOD5 while (b) refers to COD.
Water 13 01086 g009
Figure 10. Correlations between plant growth and organic pollutant RE based on concentrations. (a) Refers to BOD5 RE of giant reed-planted unit; (b) refers to BOD5 RE of umbrella sedge-planted unit; (c) refers to COD RE of giant reed-planted unit; (d) refers to COD RE of umbrella sedge-planted unit.
Water 13 01086 g010
Table 1. Variation (VA) of pH and EC in the planted units from March to November 2019/2020. For each planted unit, two-year average values (± standard deviation) are shown (n = 36).
ParameterInfluentEffluent 1Effluent 2VA (%) 1VA (%) 2Discharge in Soil 3t-Test 4
pH7.95 ± 0.277.35 ± 0.187.30 ± 0.107.907.806–8*
EC (mS cm−1)4.45 ± 1.115.75 ± 0.985.43 ± 1.0229.1022.01-*
Notes: 1 Giant reed-planted unit; 2 umbrella sedge-planted unit. 3 Threshold values for Italian Decree 156/2006. 4 Significant (*) differences between influent and effluent values (p < 0.05).
Table 2. Main chemical and physical composition of the DWW from inlet to outlet of the HSSFs CW. Removal efficiency from March to November 2019/2020. For each planted unit, two-year average values (±standard deviation) are shown (n = 36).
ParameterInfluentEffluent 1Effluent 2RE (%) 1RE (%) 2Discharge in Soil 3t-Test 4
ColorP 5NP 6NP -
OdorNU 7NUNU -
Coarse matterPresentAbsentAbsent Absent
TSS (mg L−1)147.11 ± 0.0224.10 ± 3.3525.89 ± 0.0180.6982.9825*
BOD5 (mg L−1)86.92 ± 6.8819.22 ± 7.4921.27 ± 7.7978.0275.6120*
COD (mg L−1)215.29 ± 9.1280.83 ± 8.5384.12 ± 11.1062.6761.12100*
TN (mg L−1)91.03 ± 3.4343.73 ± 3.4145.72 ± 2.4151.8449.6815*
N–NH4 (mg L−1)62.10 ± 3.4534.12 ± 3.5230.11 ± 3.2345.0551.51-*
ON (mg L−1)24.12 ± 1.4314.34 ± 1.2713.26 ± 2.1140.5145.11-*
TP (mg L−1)13.96 ± 0.558.40 ± 0.298.53 ± 0.2839.8638.882*
Cu (mg L−1)0.075 ± 0.0010.042 ± 0.0010.039 ± 0.00144.1148.310.10*
Ni (mg L−1)0.023 ± 0.0010.015 ± 0.0010.016 ± 0.00135.1731.030.20*
Pb (mg L−1)0.019 ± 0.0010.013 ± 0.0010.012 ± 0.00131.5736.840.10*
Zn (mg L−1)0.32 ± 0.0020.14 ± 0.0010.16 ± 0.00156.2550.330.50*
Notes: 1 Giant reed-planted unit; 2 umbrella sedge-planted unit. 3 Threshold values for Italian Decree 156/2006. 4 Significant (*) differences between influent and effluent values (p < 0.05). 5 Perceptible; 6 not perceptible; 7 not unpleasant.
Table 3. Main microbiological composition of the DWW from inlet to outlet of the HSSFs CW. Removal efficiency from March to November 2019/2020. For each planted unit, two-year average values (± standard deviation) are shown (n = 36).
ParameterInfluentEffluent 1Effluent 2RE 1RE 2Discharge in Soil 3t-Test 4
TC (CFUs 100 mL–1)3.97 ± 0.02 53.19 ± 0.113.21 ± 0.0083.3182.77-*
FS (CFUs 100 mL−1)3.85 ± 0.013.04 ± 0.013.13 ± 0.0184.3281.17-*
Escherichia coli (CFUs 100 mL−1)3.91 ± 0.013.01 ± 0.023.05 ± 0.0287.4486.48≤3.69 5*
Salmonella spp. (CFUs 100 mL−1)AbsentAbsentAbsent -
Notes: 1 Giant reed-planted unit; 2 umbrella sedge-planted unit. 3 Threshold values for Italian Decree 156/2006. 4 Significant (*) differences between influent and effluent values (p < 0.05). 5 The average concentration values are shown as units of Log10.
Table 4. Morphological parameters of giant reed (CW1) and umbrella sedge (CW2) plants in the HSSFs CW. Two-year average values (±standard deviation) are shown (n = 18).
ParameterCW1CW2
Culm/stem density (n m−2)22.02 ± 2.3487.11 ± 3.55
Culm/stem height (cm)149.16 ± 13.44127.66 ± 12.67
Root diameter (cm)41.10 ± 2.1032.33 ± 3.31
Root length (cm)30.03 ± 1.5628.31 ± 2.03
Publisher’s Note: MDPI stays neutral with regard to jurisdictional claims in published maps and institutional affiliations.

