
Study on the Evaluation of (Heavy) Metals in Water and Sediment of Skadar Lake (Montenegro), with BCF Assessment and Translocation Ability (TA) by Trapa natans and a Review of SDGs


Abstract
:1. Introduction
2. Materials and Methods
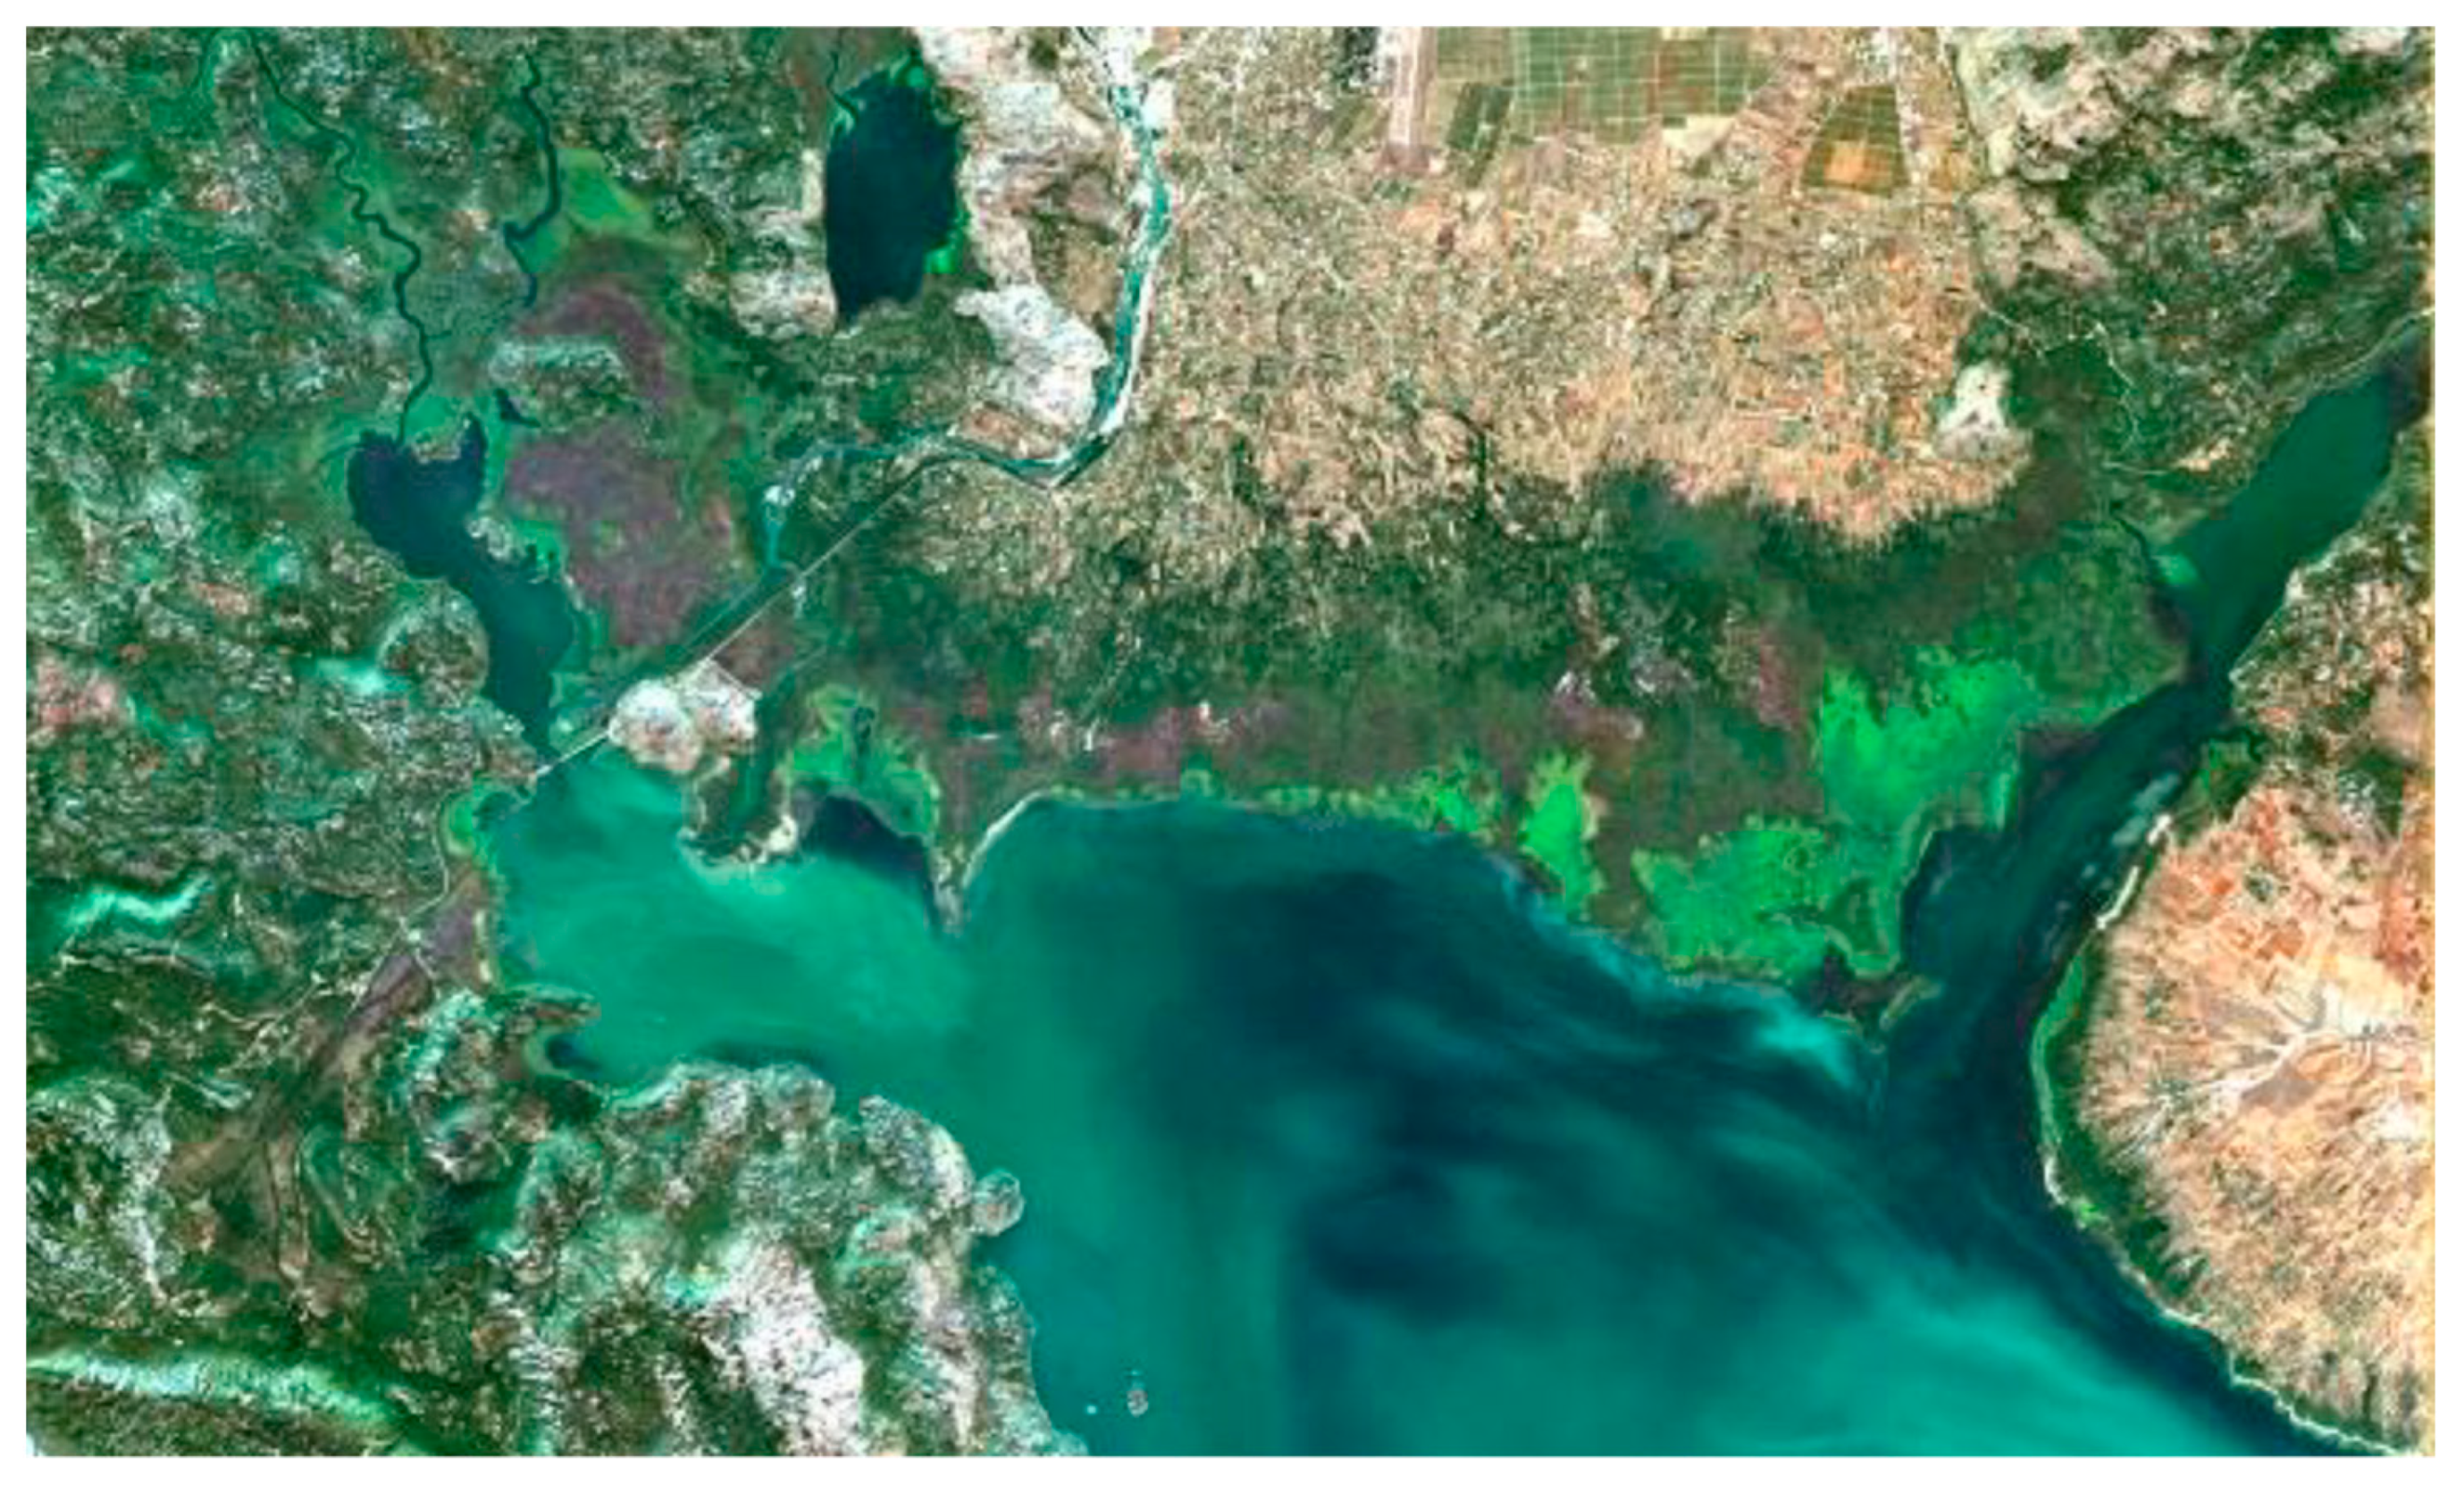
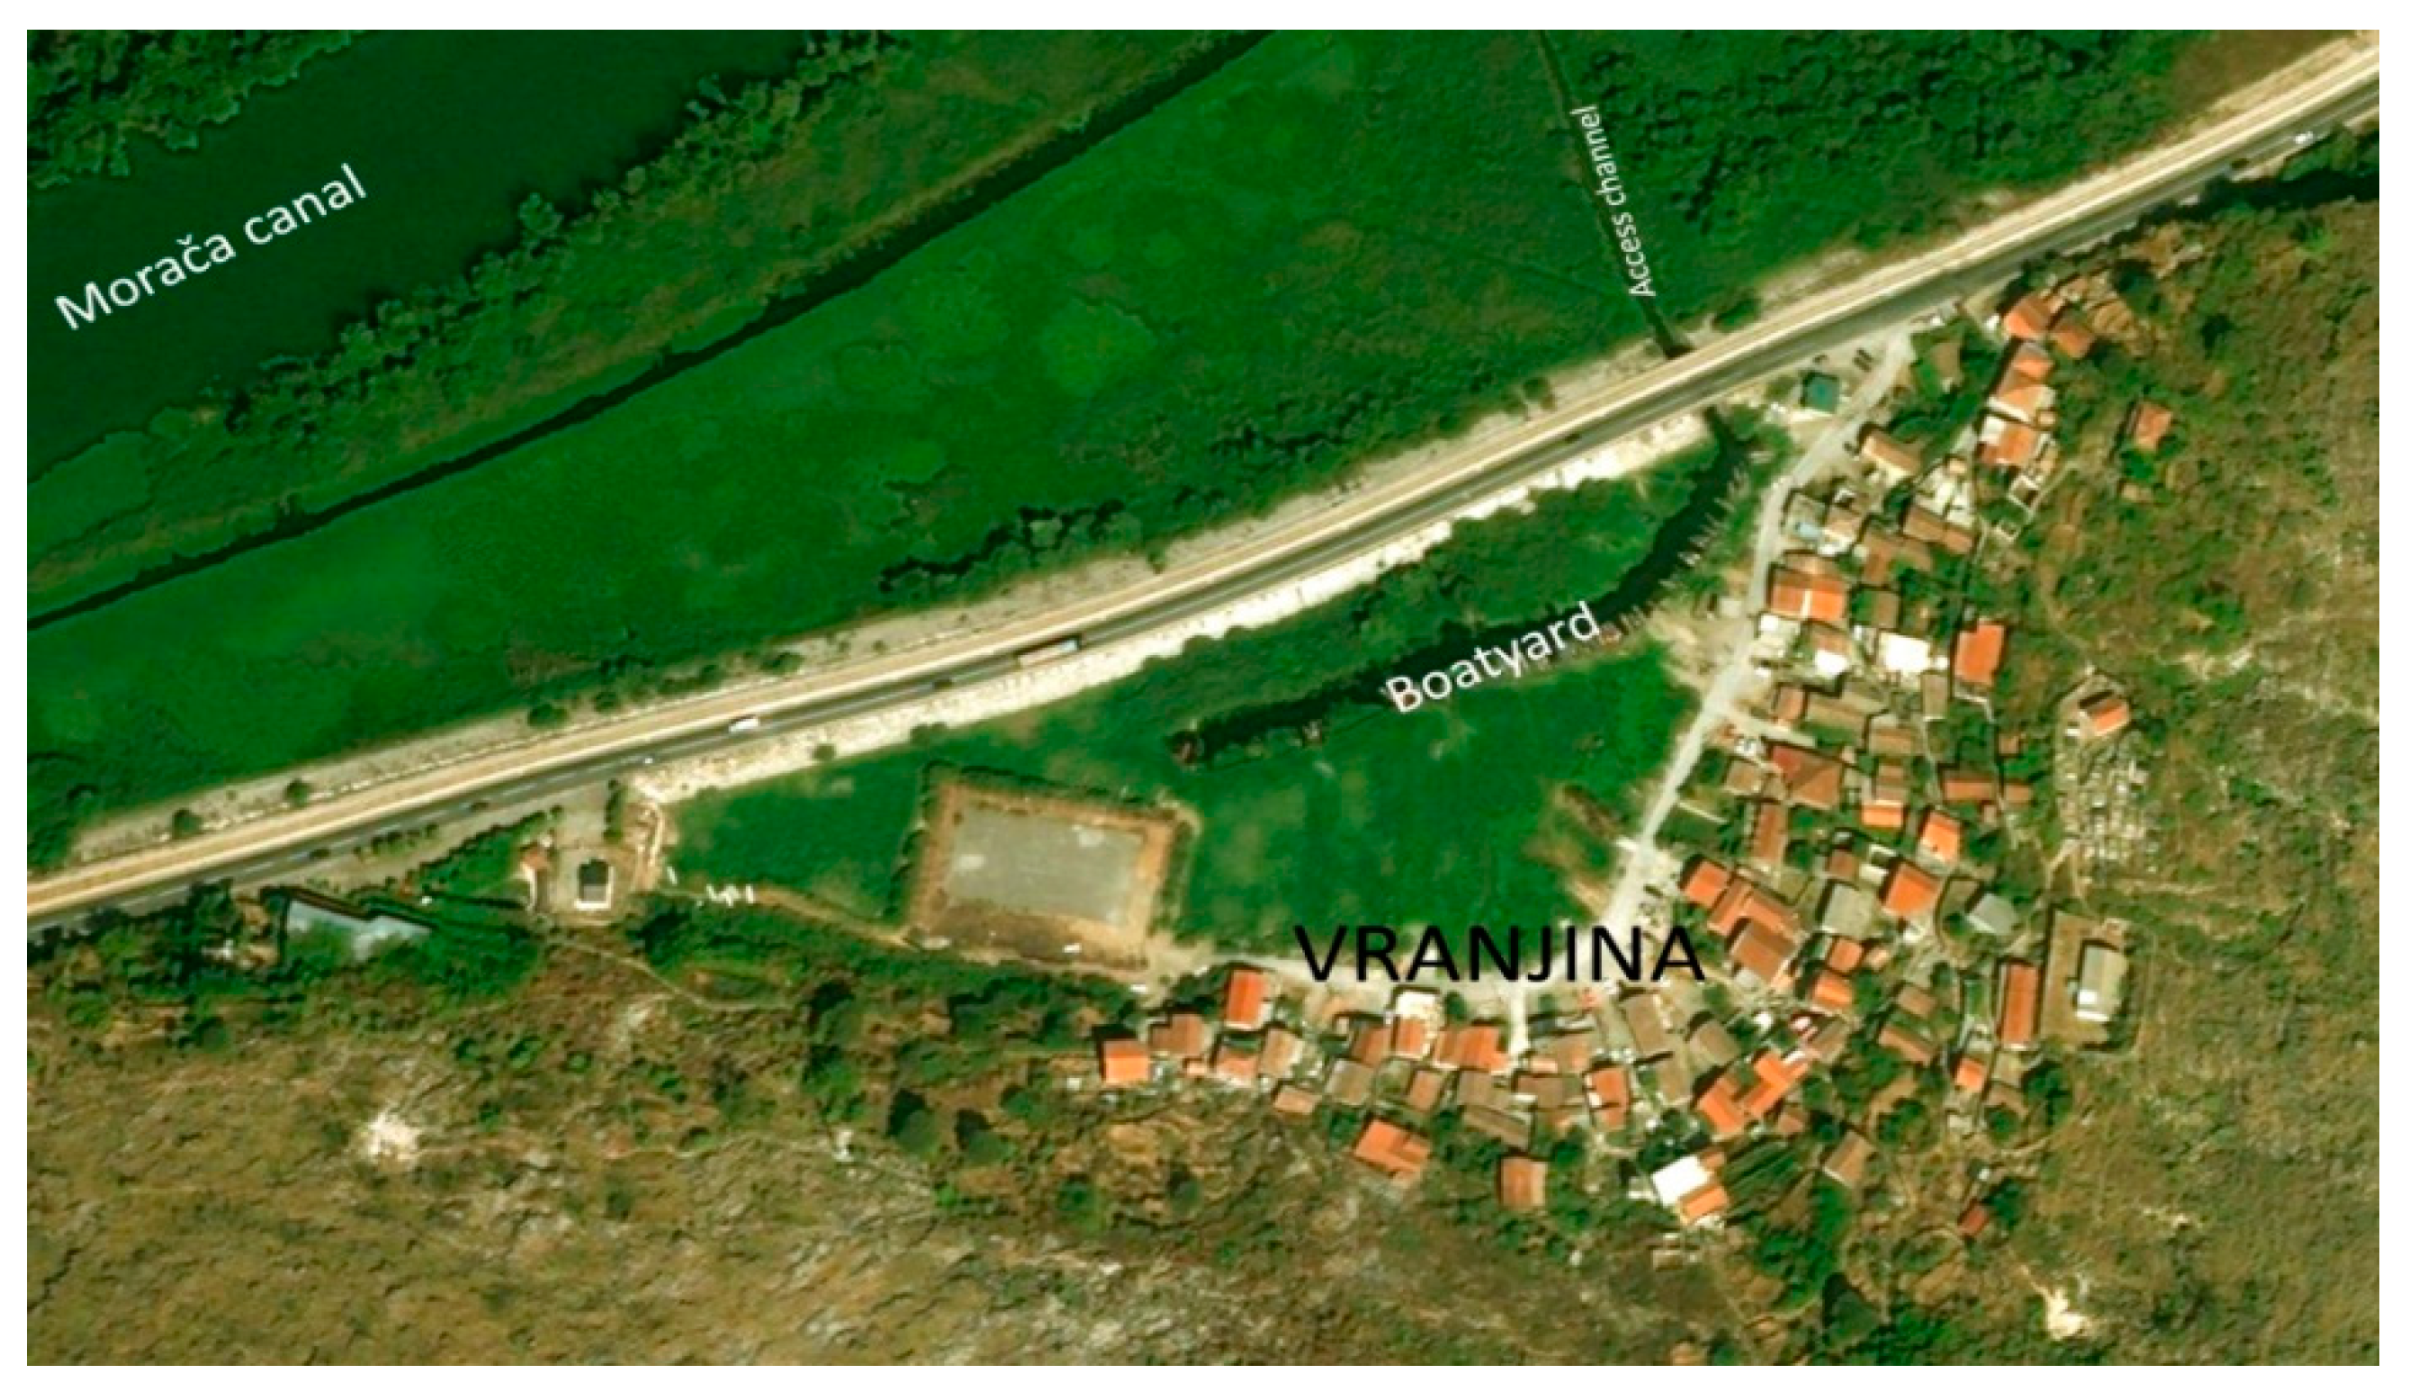
2.1. Study Area and Research Methodology
2.2. Laboratory Analyses, Instrumental Methods/Techniques
2.3. Statistical Analyses
2.3.1. Bioconcentration Factor (BCF)
2.3.2. Biota Sediment Accumulation Factor (BSAF)
2.3.3. Translocation Ability (TA)
2.3.4. Chemical and Ecological Status
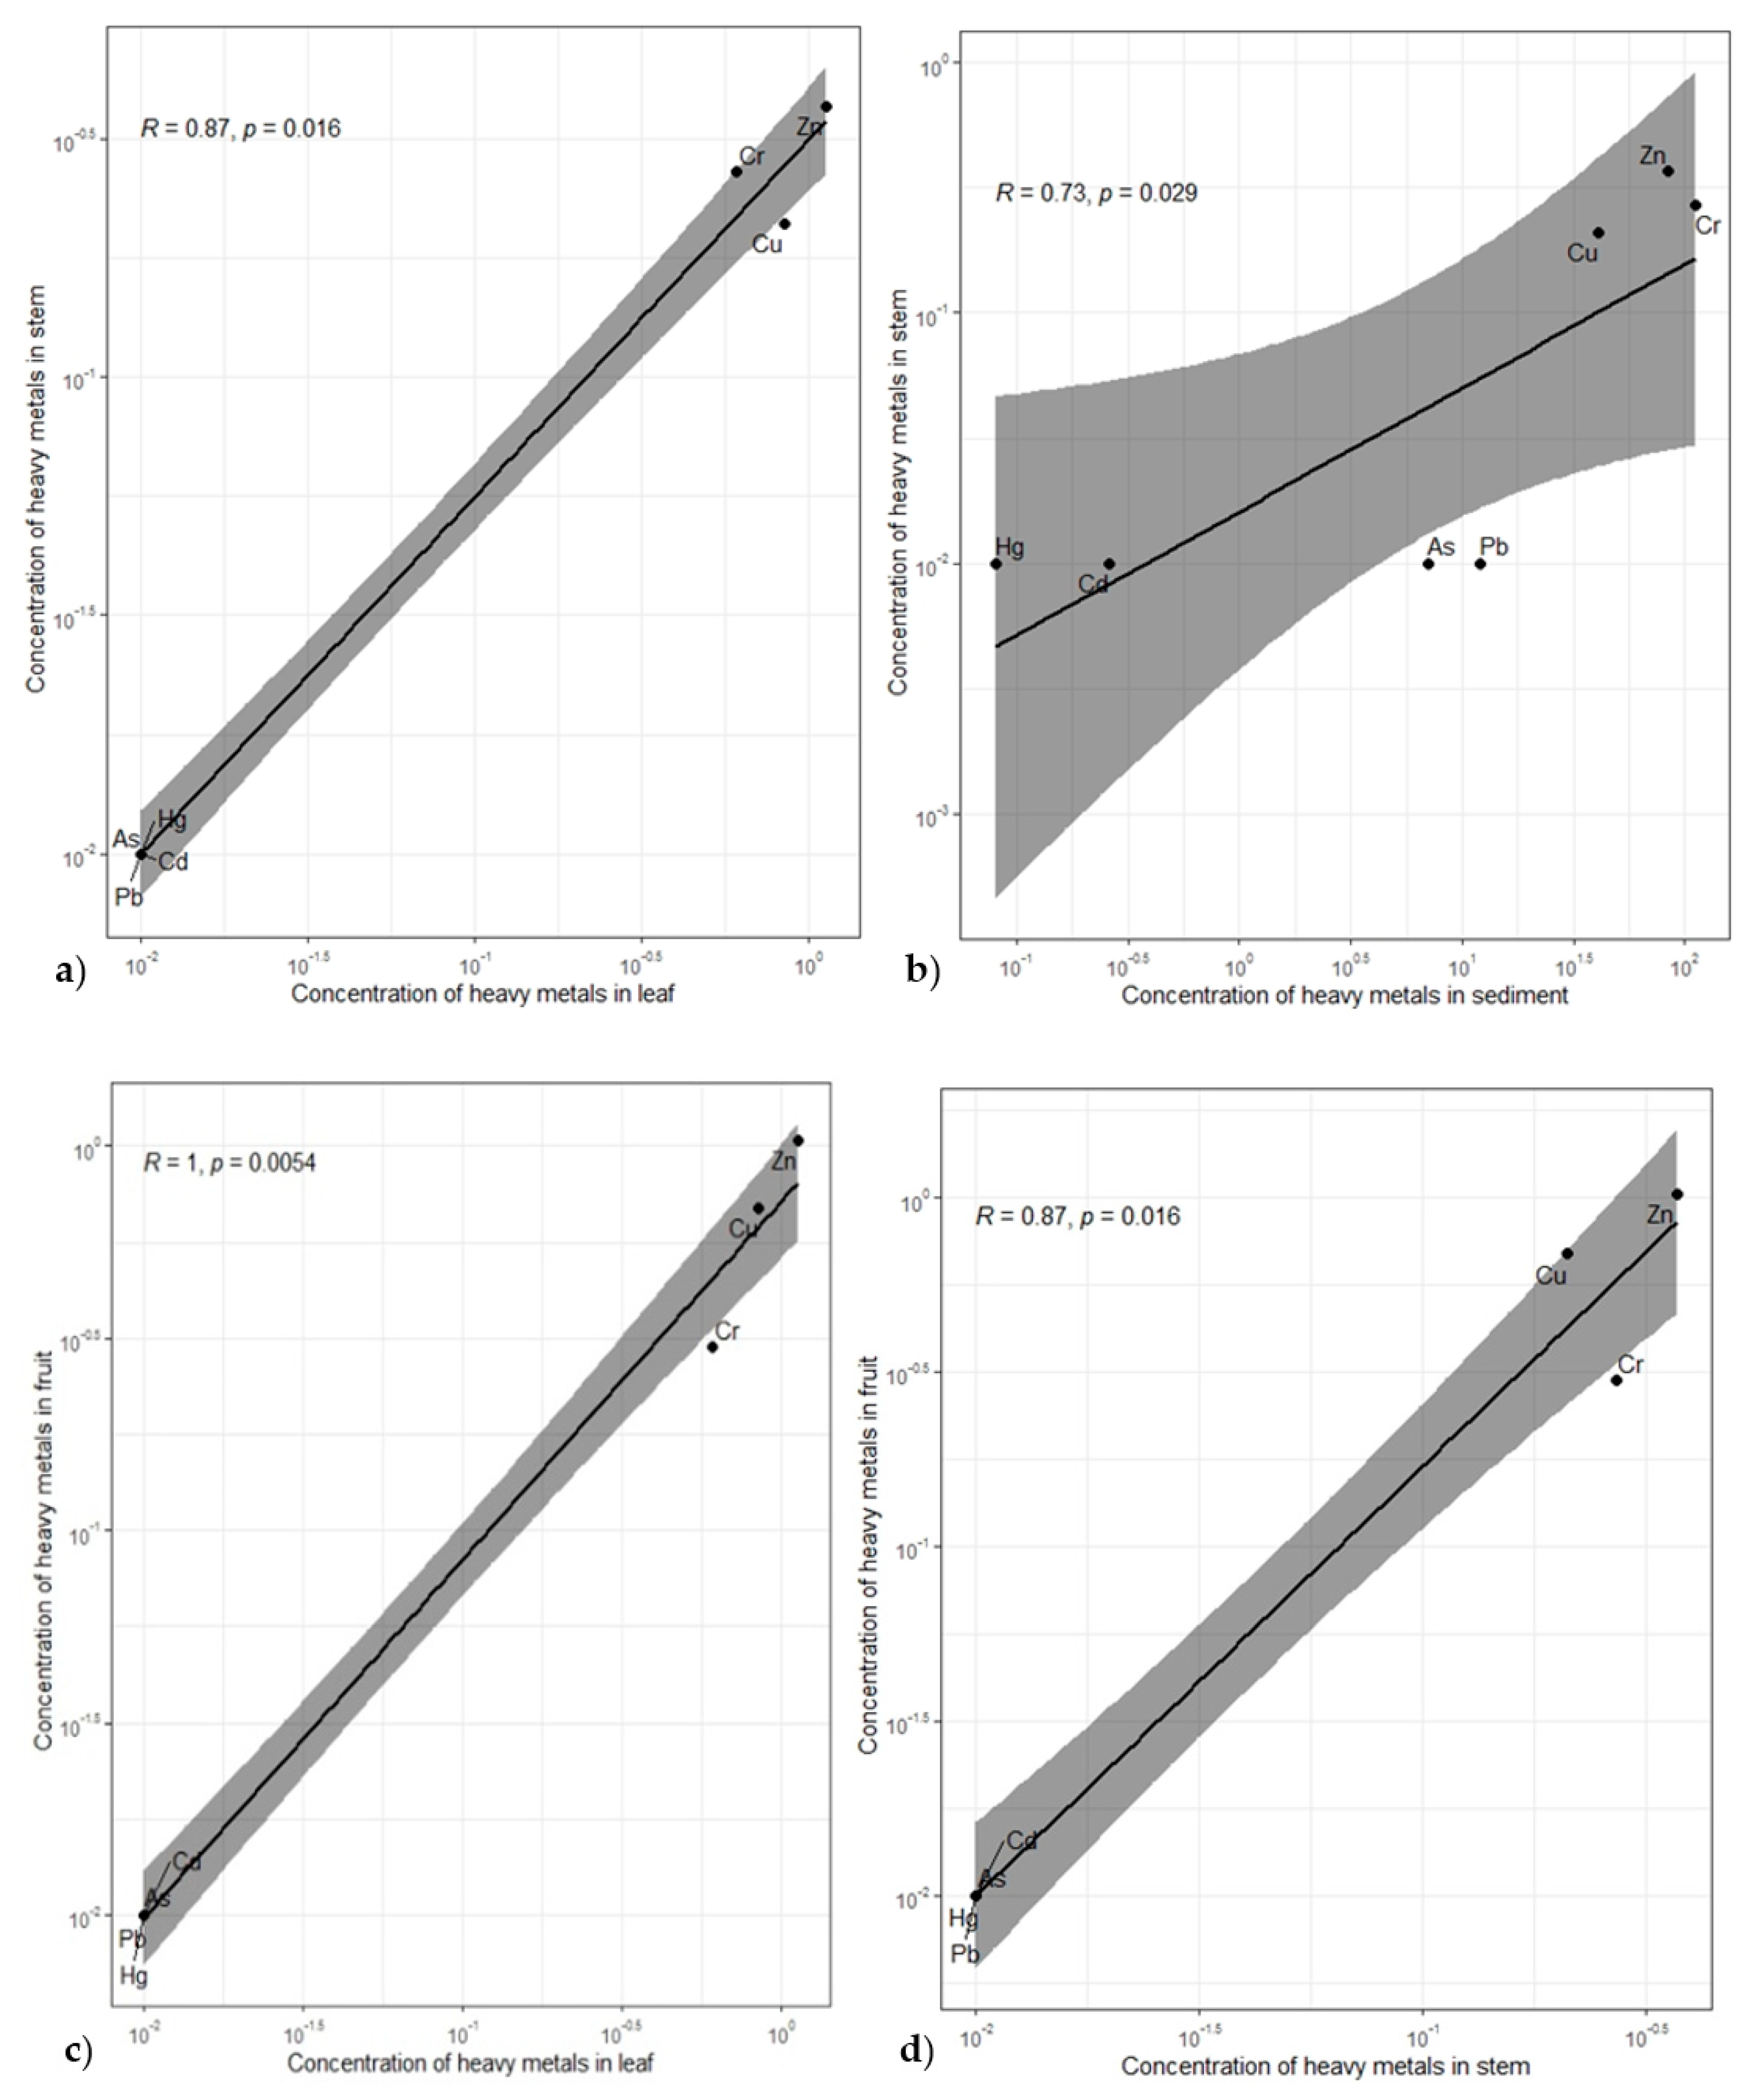
2.3.5. Kendal’s Tau Coefficient-Kendal Rank Correlation Coefficient
3. Results
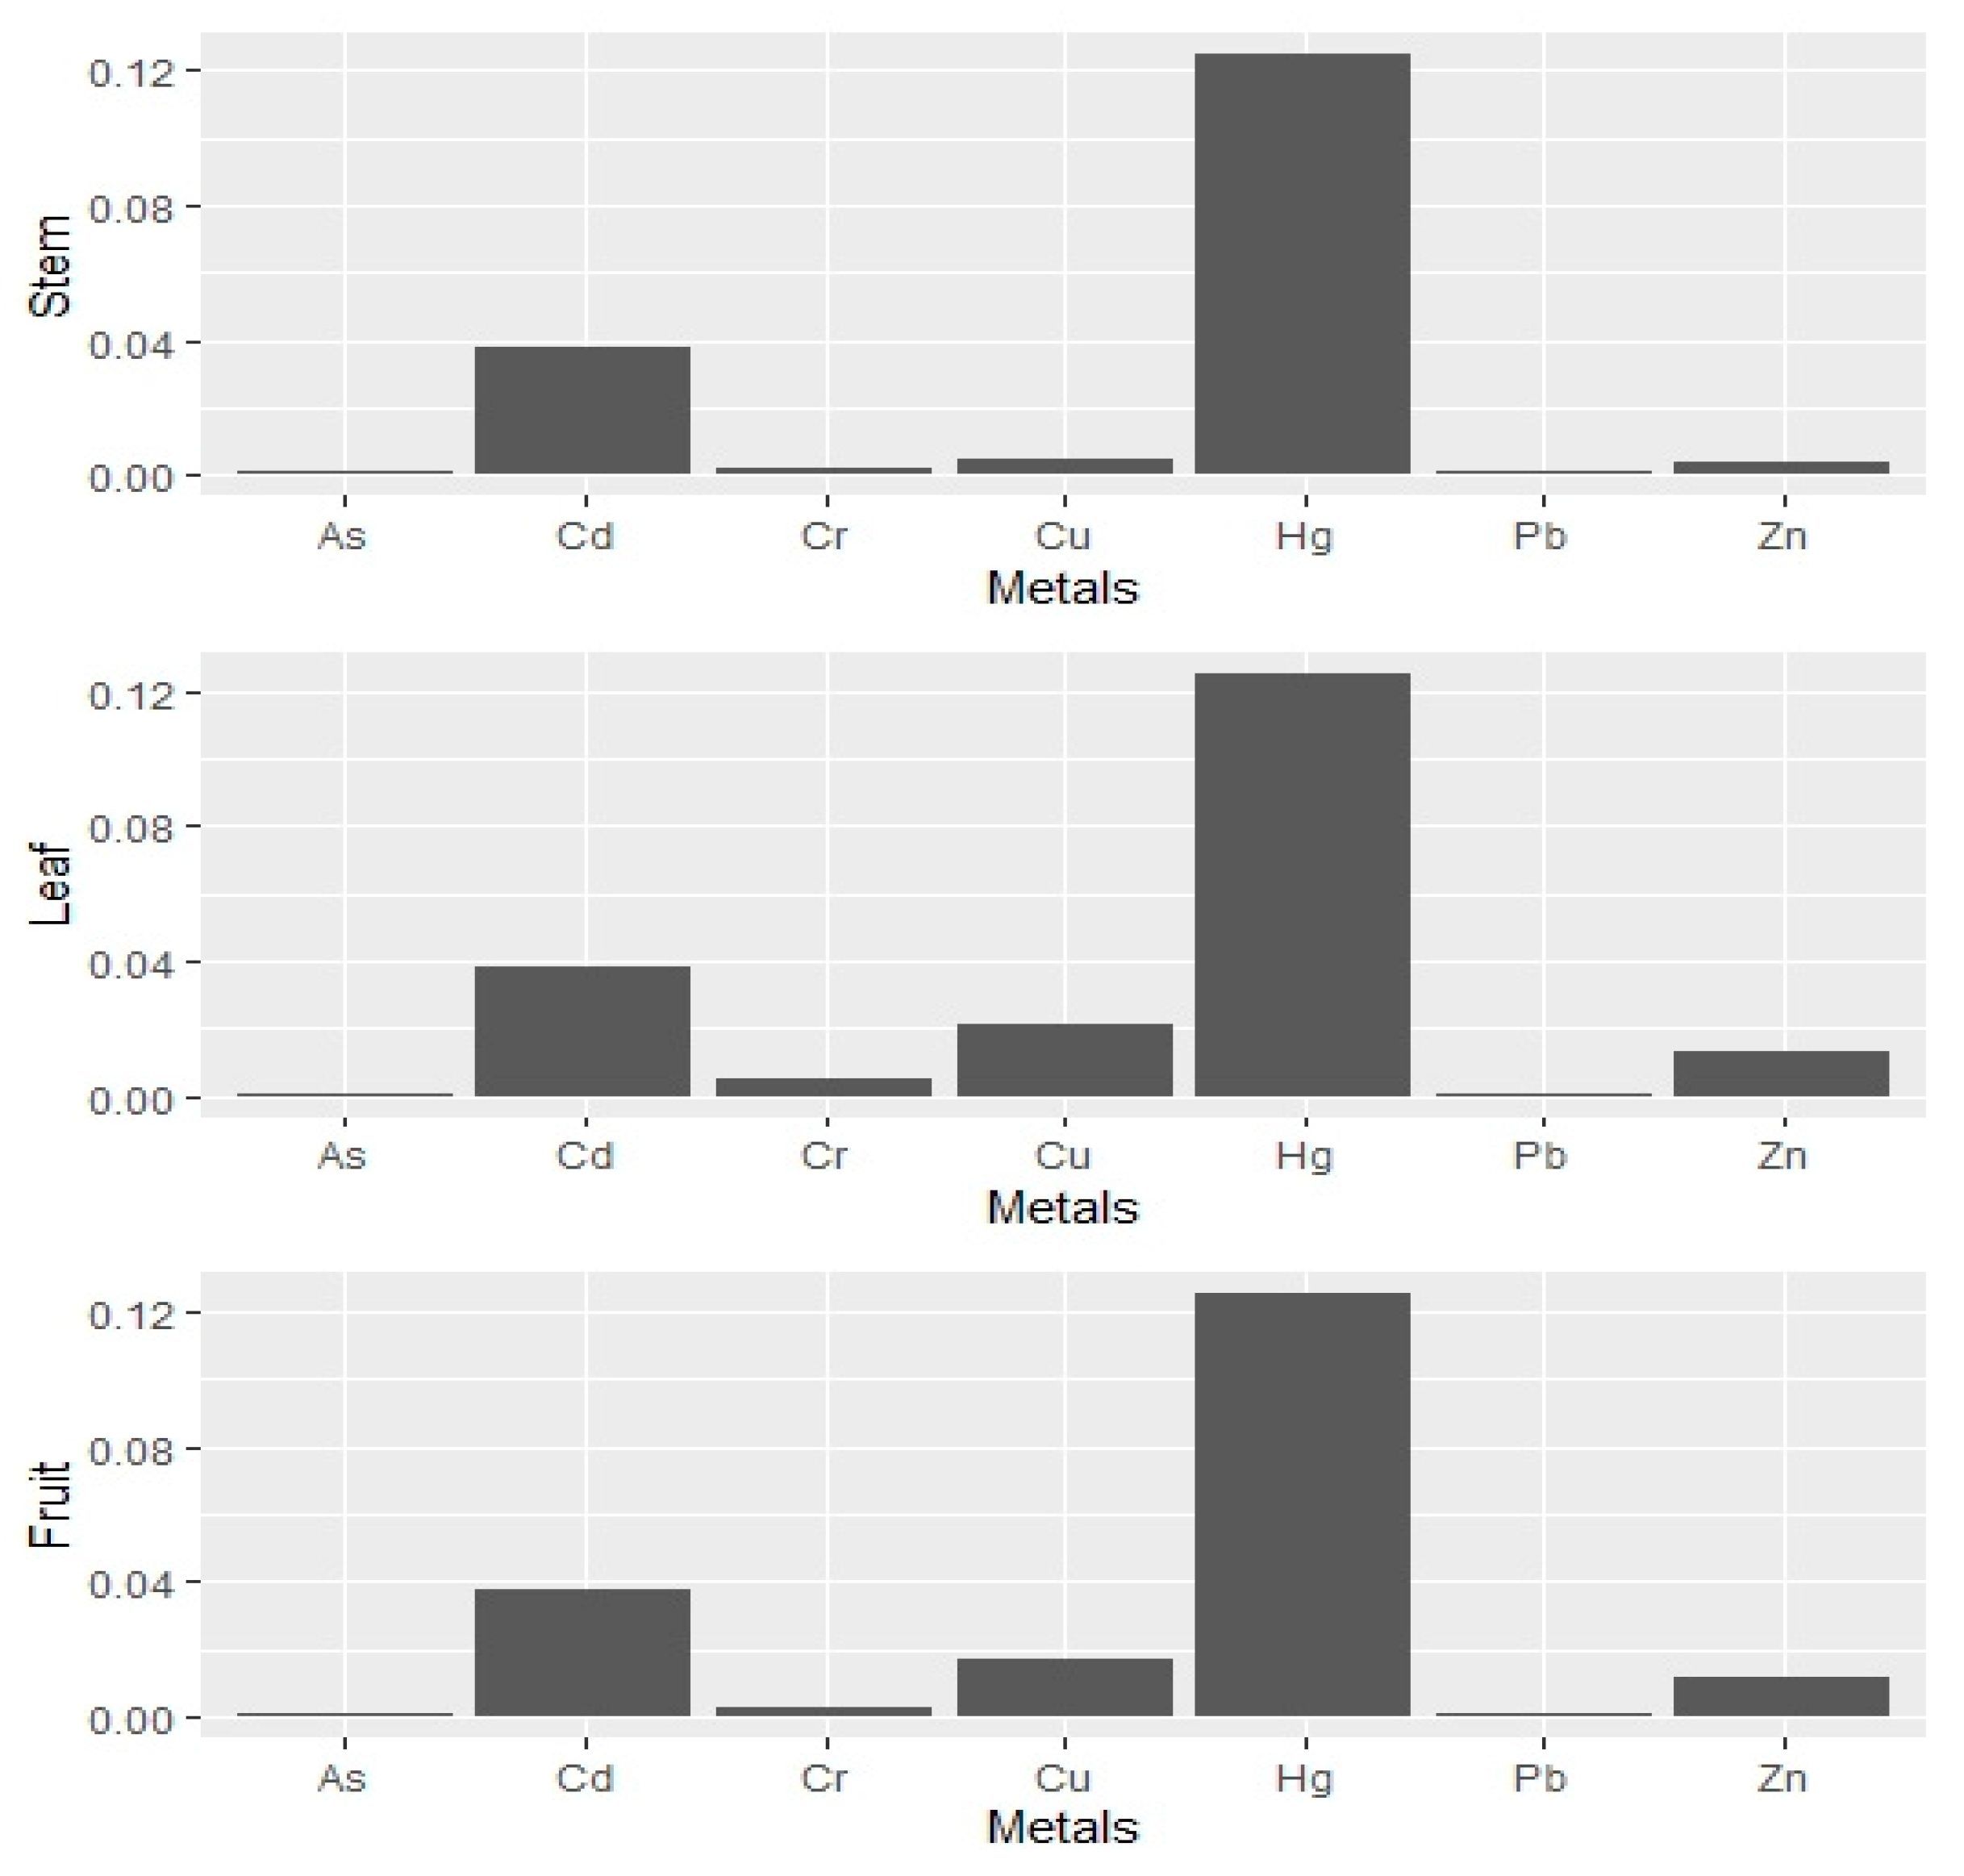
3.1. Bioconcentration Factor (BCF)
3.2. Biota Sediment Accumulation Factor (BSAF)
3.3. Translocation Ability (TA)
3.4. Chemical and Ecological Status
4. Discussion
4.1. Water (Heavy) Metal Concentration and Toxicity to Aqutic Plants (Aquatic Biota) and Humans
4.2. Sediment-(Heavy) Metal Concentration
4.3. Aquatic Plants, Phytotoxic Effects; (Heavy) Metal Concentracion in Stem, Leaf and Fruit (Trapa Natans), BCF, BSAF, TA and Short Review of Initial Research of the Water Chesnut (Skadar Lake)
4.4. Protection of Skadar Lake of National and International Importance with Sustainable Development Goals (SDGs)
- -
- Preventing the degradation of renewable natural resources (biodiversity, water, air, land);
- -
- Enabling efficient management of renewable natural resources;
- -
- Improving the status of the environment and human health;
- -
- Sustainable spatial planning;
- -
- Efficient use of metallic and nonmetallic raw materials.
- -
- Reduction and prevention of pollution of the lake water;
- -
- Improved monitoring of biodiversity;
- -
- Strengthening the management of natural resources, including promoting environmentally sustainable economic use of biological resources, as well as improved management of the protected areas;
- -
- Promotion of environmentally sustainable tourism development with an emphasis on local community participation and potential benefits;
- -
- Strengthening the legal and institutional framework for environmental protection, sustainable management and trans-boundary cooperation and exchange;
- -
- Trans-boundary equality of the protected area, satisfying both high environmental standards and ensuring the sustainability of the activities developed;
- -
- Strengthening the management of natural resources, including promoting environmentally sustainable economic use of biological resources, as well as improved management of the Protected Areas;
- -
- Promotion of environmentally sustainable tourism development with an emphasis on local community participation and potential benefits;
- -
- Strengthening the legal and institutional framework for environmental protection, sustainable management and trans-boundary cooperation and exchange;
- -
5. Conclusions
Funding
Institutional Review Board Statement
Informed Consent Statement
Data Availability Statement
Acknowledgments
Conflicts of Interest
References
- Sundic, D.; Radujkovic, B. Pollution of the Skadar Lake; NGO Green Home: Podgorica, Montenegro, 2012; pp. 1–94. [Google Scholar]
- Ministry of Sustainable Development and Tourism, Montenegro. Development of a commercial project in Skadar Lake National Park and candidate Emerald site (Montenegro)—Report by the Government. In Proceedings of the Standing Committee 40th Meeting, Strasbourg, France, 30 November–4 December 2020; Council of Europe: Strasbourg, France, 2020. [Google Scholar]
- Deutsche Gesellschaft für Internationale Zusammenarbeit (GIZ): Shorozone Functionality, Skadar/Shkodra Lake, Implementing the EU Water Framework Directive in South Eastern Europe. Available online: https://rm.coe.int/complaints-on-stand-by-development-of-a-commercial-project-in-skadar-l/168077e58c (accessed on 1 March 2021).
- Dizdari, A.; Kopliku, D. Toxicity Bio-Monitoring of Shkodra Lake Surface Water Using a Higher Plant Assay. Acad. J. Interdiscip. Stud. 2013, 2, 133. [Google Scholar]
- Ministry of Sustainable Development and Tourism of Montenegro. Spatial Plan of Special Purpose of the National Park Skadar Lake; Ministry of Sustainable Development and Tourism of Montenegro: Podgorica, Montenegro, 2018. [Google Scholar]
- Ministry of Sustainable Development and Tourism. National Biodiversity Strategy with the Action Plan for the Period 2016–2020; Ministry of Sustainable Development and Tourism: Podgorica, Montenegro, 2015; pp. 1–82. [Google Scholar]
- Keukelaar, F.; Goffau, A.; Pradhan, T.; Sutmuller, G.; Misurovic, A.; Ivanovic, S.; Uskokovic, B.; Agron, H.A.; Haxhimihali, E.; Prifti, A.; et al. Lake Shkoder Transboundary Diagnostics Analysis; Final Report: Summary No 9P6515.World Bank (IBRD) 9P6515; Royal Haskoning: Nijmegen, The Netherlands, 2006; pp. 1–18. [Google Scholar]
- Keukelaar, F. The last 500 year of sedimentation in Shkodra Lake (Albania, Montenegro): Paleo environmental evolution and potential for paleoseismicity studies. J. Paleolimnol. 2008, 40, 619–633. [Google Scholar]
- Karmaka, S.; Mavukkandy, M. Lakes and Reservoir: Pollution, Chapter; Taylor & Francis: London, UK, 2013; pp. 1576–1587. [Google Scholar]
- Shalabh, B.; Akash, J.; Chaudhar, J. Trapa natans (water chesnut) an overview. Int. Res. J. Pharm. 2013, 3, 31–33. [Google Scholar]
- Bharthi, V.; Kavya, B.; Shantha, T.R.; Prathapa, R.M.; Kavya, N.; Rao, V.; Kalpeshkumar, B.I.; Venkateshwarlu, G. Pharmacognostical evaluation and phytochemical studies on Ayurvedic nutritional fruits of Trapa natans L. Int. J. Herb. Med. 2015, 3, 1–13. [Google Scholar]
- Kang, W.; Li, Y.; Gu, X.; Huang, X. Hepatoprotective activity of Trapa acornis shell extracts against CCl4-induced liver injury in rats. Acad. J. Pharm. Pharmacol. 2012, 6, 2856–2861. [Google Scholar] [CrossRef] [Green Version]
- Razvy, M.A.; Faruk, M.O.; Hoque, M.A. Environment friendly antibacterial activity of water chestnut fruits. J. Biodivers. Environ. Sci. 2011, 1, 26–34. [Google Scholar]
- Stoicescu, I.; Sirbu, R.; Pirjol, T.N.; Cocia, M.; Balaban, D.P.; Camelia, B. In vitro antioxidant and antibacterial activity of Trapa natans aquatic plant from Danube delta area. J. Acad. Romana 2012, 57, 729–733. [Google Scholar]
- Shukla, A.D.; Gujrati, A.; Srivavasta, N. In vitro analysis of anti-bacterial activity of Trapa natans. Int. J. Pharm. Res. Dev. 2012, 3, 502–508. [Google Scholar]
- Mandal, S.M.; Migliolo, L.; Franco, O.L.; Ghosh, A.K. Identification of an antifungal peptide from Trapa natans fruits with inhibitory effects on Candida tropicalis biofilm formation. J. Elsevier Pept. 2011, 32, 1741–1747. [Google Scholar] [CrossRef] [PubMed]
- Ozturk, M.; Ozozen, G.; Minareci, O. Determination of heavy metals, in fish, water and sediments of Avsar dam Iran Lake in Turkey. J. Environ Health Sci. Eng. 2009, 6, 73–80. [Google Scholar]
- Ali, H.; Khan, E.I. Ecotoxicology of Hazardous Heavy Metals: Environmental Persistence, Toxicity and Bioaccumulation. Environ. Chem. 2019, 6730305. Available online: https://www.hindawi.com/journals/jchem/2019/6730305 (accessed on 15 March 2021).
- García, M.E.; Bundschuh, J.; Ramos, O.; Quintanilla, J.; Persson, K.M.; Bengtsson, L.; Berndtsson, R. Heavy metals in aquatic plants and their relationship to concentration in surface water, groundwater and sediments, a case study of Poopo Basin. Rev. Boliv. Química 2005, 22, 11–18. [Google Scholar]
- Ministry of Agriculture and Rural Development, Ministry of Health and the Ministry of Sustainable Development and Tourism. Regulation for Determining the Status of Surface Waters; Ministry of Agriculture and Rural Development, Ministry of Health and the Ministry of Sustainable Development and Tourism: Podgorica, Montenegro, 2019; pp. 1–39. [Google Scholar]
- Government of the Republic of Montenegro: Rulebook on Classification and Categorization of Surface and Ground Water. Available online: https://www.morskodobro.com/dokumenti/uredba_klasifikacija_kategorizacija_podzemnih_voda.pdf (accessed on 1 March 2021). (In Montenegrin).
- The Food and Agriculture Organization (FAO): Working Document for Information and Use in Discussions Related to Contaminants and Toxins in the GSCTFF. Available online: http://www.fao.org/tempref/codex/Meetings/CCCF/CCCF5/cf05_INF.pdf (accessed on 1 March 2021).
- Directorate for Foodsafety, Veterinary and Phytosanitary Affairs: Regulation on Maximum Permitted Levels of Contaminants in Food. Available online: https://ubh.gov.me/biblioteka/sektor_1/uredbe/?query=hrani&sortDirection=desc (accessed on 1 March 2021). (In Montenegrin)
- Canadian Council of Ministres of the Environment: Canadian Sediment Quality Guidelines for the Protection of Aquatic Life. Available online: https://www.ccme.ca/en/res/mercury-canadian-sediment-quality-guidelines-for-the-protection-of-aquatic-life-en.pdf (accessed on 1 March 2021).
- The Netherlands Ministry of Housing, Spatial Planning and Environment; Circular on target values and intervetion values for soil remediation. Available online: https://www.esdat.net/environmental%20standards/dutch/annexs_i2000dutch%20environmental%20standards.pdf (accessed on 1 March 2021).
- Mackay, D.; Fraser, A. Biaccumulation of persistent organic chemicals, mechanisms and models. Environ. Pollut. 2000, 110, 375–391. [Google Scholar] [CrossRef]
- McGeer, J.; Brix, K.; Skeaff, J.; DeForest, D.; Brigham, S.; Adams, W.; Green, A. Inverse Relationship Between Bioconcentration Factor and Exposure Concentration for Metals: Implications for Hazard Assessment of Metals in the Aquatic Environment. Environ. Toxicol. Chem. 2003, 22, 1017–1037. [Google Scholar] [CrossRef]
- Pollman, C.D.; Axelrad, D.M. Mercury bioaccumulation factors and spurious correlations. Sci. Total Environ. 2014, 496, 6–12. [Google Scholar] [CrossRef]
- Nideda, L.A.; Manohar, S. Bioconcenntration factor and translocation ability of heavy metals within different habitats of hydrophytes in Nairobi Dam, Kenya. J. Environ. Sci. Toxicol. Food Technol. 2014, 8, 42–45. [Google Scholar]
- Nyatwere, D.M. The Potential of Bioaccumulation and Translocation of heavy metals in plant species growing around the Tailing Dam in Tanzania. Int. J. Sci. Technol. 2014, 3, 690–697. [Google Scholar]
- McDonald, M.J. Handbook of Biological Statistic, 3rd ed.; University of Delavare: Baltimor, MD, USA, 2014; pp. 1–299. [Google Scholar]
- Bolboacai, S.D.; Jfntschi, L. Pearson versus Spearman, Kendall’s Tau Correlation Analysis on Structure Activity Relationships of Biologic Active Compounds. Leonardo J. Sci. 2006, 9, 179–200. [Google Scholar]
- ATSDR. Priority List of Hazardous Substances. Agency for Toxic Substances and Diseases Registry. 2007. Available online: http://www.atsdr.cdc.gov/ (accessed on 28 July 2009).
- ATSDR CERCLA. Priority List of Hazardous Substances. ATSDR Home. 2007. Available online: http://www.atsdr.cdc.gov/cercla/07list.html (accessed on 22 March 2011).
- U.S. Environmental Protection Agency (EPA). Locating and Estimating Air Emissions from Sources of Arsenic and Arsenic Compounds; Environmental Protection Agency (EPA): Washington, DC, USA, 1998; pp. 1–82. [Google Scholar]
- Medical and Biologic Effects of Environmental Pollutants, Arsenic; National Research Council (US) Committee on Medical and Biological Effects of Environmental Pollutants; National Academies Press (US): Washington, DC, USA, 1977; pp. 1–323.
- Abbas, G.; Murtaza, B.; Bibi, I.; Shahid, M.; Niazi, N.K.; Khan, M.I.; Amjad, M.; Hussain, M.N. Arsenic Uptake, Toxicity, Detoxification, and Speciation in Plants: Physiological, Biochemical, and Molecular Aspects. Int. J. Environ. Res. Public Health 2018, 15, 59. [Google Scholar] [CrossRef] [Green Version]
- World Health Organization (WHO). Air Quality Guidelines for Europe, 2nd ed.; WHO Regional Office for Europe: Copenhagen, Denmark, 2000; pp. 125–127. [Google Scholar]
- Mandal, P. An insight of environmental contamination of arsenic on animal health. Emerg. Contam. 2017, 3, 17–22. [Google Scholar] [CrossRef]
- Krivokapić, M. Assesment of the ten (heavy) metals pollution in the water and sediment of the Moracca river mouth and in muscle tissue of Squalius platyceps including BAF evaluation. J. Environ. Prot. Ecol. 2019, 4, 1629–1638. [Google Scholar]
- Singh, A.; Kumar, C.S.; Agarwal, A. Effect of lead and cadmium on aquatic plant Hydrilla verticillata. J. Environ. Biol. 2013, 34, 1027–1031. [Google Scholar]
- Eisler, R. Lead hazards to fish, wildlife, and invertebrates: A synoptic review. U.S. Fish and Wildlife Service. Biol. Rep. 1988, 85, 1–14. [Google Scholar]
- Wani, A.L.; Ara, A.; Usmani, J.A. Lead toxicity: A review. Interdiscip. Toxicol. 2015, 8, 55–64. [Google Scholar] [CrossRef] [Green Version]
- Mrozińska, N.; Bakowska, M. Effects of Heavy Metals in Lake Water and Sediments on Bottom Invertebrates Inhabiting the Brackish Coastal Lake Łebsko on the Southern Baltic Coast. Int. J. Environ. Res. Public Health 2020, 17, 6848. [Google Scholar] [CrossRef]
- Vemic, M.; Rousseau, D.; DuLaing, G.; Lens, P. Distribution and fate of metals in the Montenegrin part of Lake Skadar. Int. J. Sediment Res. 2014, 28, 357–367. [Google Scholar] [CrossRef]
- Water Framework Directive—United Kingdom Technical Advisory Group (WFD-UKTAG): Proposed EQS for Water Framework Directive Annex VIII substances: Zinc (For Consultation). Available online: https://www.wfduk.org/sites/default/files/Media/Zinc%20-%20UKTAG.pdf (accessed on 1 March 2021).
- Li, X.F.; Wang, P.F.; Feng, C.L.; Liu, D.Q.; Chen, J.K.; Wu, F.C. Acute Toxicity and Hazardous Concentrations of Zinc to Native Freshwater Organisms Under Different pH Values in China. Bull. Environ. Contam. Toxicol. 2019, 103, 120–126. [Google Scholar] [CrossRef] [PubMed] [Green Version]
- U.S. Environmental Protection Agency (EPA). National Recommanded Water Quality Criteria-Aquatic Life Criteria; Environmental Protection Agency (EPA): Washington, DC, USA, 2004; pp. 1–22. [Google Scholar]
- Bodar, C.W.M. Environmental Risk Limits for Zinc. Available online: https://www.rivm.nl/bibliotheek/rapporten/601782004.pdf (accessed on 1 March 2021).
- Kastratovic, V.; Jacimovic, Z. The distribution on zinc in the water, aquatic macrophytes and sediment of Skadar Lake. Agric. For. 2020, 66, 96–104. [Google Scholar] [CrossRef]
- Australian Government Initiative: Copper in Freshwater and Marine Water. Available online: https://www.waterquality.gov.au/anz-guidelines/guideline-values/default/water-quality-toxicants/toxicants/copper-2000 (accessed on 1 March 2021).
- CDM. Site Investigation and Preparation Study for the Remediation of Industrial Waste Disposal Sites in Montenegro; Project No 88431:141 COWI. Environmental impact assessment of remediation of solid waste disposal sites in Alumina Plant Podgorica (KAP); Project number A024110; Ministry of Sustainable Development and Tourism of Montenegro and Environmental Protection Agency: Podgorica, Montenegro, 2012; pp. 1–99. [Google Scholar]
- U.S. Environmental Protection Agency: Framework for Metals Risk Assessment. Available online: https://www.epa.gov/sites/production/files/2013-09/documents/metals-risk-assessment-final.pdf (accessed on 1 March 2021).
- Ma, L.; Wu, J.; Abduwail, J.; Liu, W. Geochemical Responses to Anthropogenic and Natural Influences in Ebinur Lake Sediments of Arid Northwest China. PLoS ONE 2016, 11, 1–12. [Google Scholar] [CrossRef] [Green Version]
- Venkatramedy, V.; Vutukuru, S.S.; Tchounwou, P.B. Ecotoxicology of hexavalent chromium in freshwaerfish. Rev. Environ. Health 2009, 24, 129–145. [Google Scholar]
- Berry, W.J.; Boothman, W.S.; Serbst, J.R.; Edwards, P.A. Predicting the toxicity of chromium in sediments. Env. Toxicol. Chem. 2004, 23, 2981–2992. [Google Scholar] [CrossRef]
- Kastratovic, V.; Djurovic, D.; Krivokapic, S.D.; Mugosa, B.P. Mobility and bioavalibility of metals in sediments of Skadar Lake, Montenegro. In Proceedings of the 16th International Conference on Heavy Metals in the Environment 2012, Rome, Italy, 23–27 September 2012; EDP SCIENCES: Lez Ili, France, 2013. [Google Scholar] [CrossRef]
- Bekteshi, E.; Myrtaj, L.; Gurakuqi, I. Heavy Metals in the Shkodra Lake Ecosystem. J. Environ. Prot. Ecol. 2014, 15, 834–841. [Google Scholar]
- Duborija, A.; Strugar, V.; Duborija, N. The research of presence and behaviour of heavy metals in water environment of Skadar Lake. In Proceedings of the Advance in Waste Management, 4th WSEAS International Conference on Waste Management, Water Pollution, Air Pollution, Indoor Climate (WWAI 10), Kantaoui, Sousse, 3–6 May 2010; pp. 134–138. [Google Scholar]
- Yeppe, K.J.; Yang, J.; Long, S.M.; Carew, M.E.; Zhang, Y.; Pettigrove, V.; Hoffman, A.A. Detecting copper toxicity in sediments: from the subindividual level to the population level. J. Appl. Ecol. 2017, 54, 1331–1342. [Google Scholar]
- Sofilic, T. Ecotoxicology; University of Zagreb, Faculty of Metalurgy: Sisak, Croatia, 2014; pp. 1–173. [Google Scholar]
- Paliulis, D. Assessment of Lake Bottom Sediment Pollution by Lead and Cadmium. Pol. J. Environ. Stud. 2014, 23, 1273–1279. [Google Scholar]
- Pradita, S.; Pattarathomronga, M.S.; Panutrakulb, S. Arsenic Cadmium and Lead Concentrations in Sediment and Biota from Songkhla Lake: A Review. Procedia Soc. Behav. Sci. 2013, 91, 573–580. [Google Scholar] [CrossRef] [Green Version]
- Kastratovic, V. The Water and Sediment Chemistry of Skadar Lake; Springer: Berlin/Heidelberg, Germany, 2018; pp. 122–139. [Google Scholar]
- Barrett, P.M.; Hull, E.A.; Burkart, K.; Hargrave, O.; McLean, J.; Taylor, V.F.; Jackson, B.P.; Gawel, J.E.; Neumann, R.B. Contrasting arsenic cycling in strongly and weakly stratified contaminated lakes: Evidence for temperature control on sediment–water arsenic fluxes. Limnoogy Oceanogr. 2019, 64, 1333–1346. [Google Scholar] [CrossRef]
- Kastratović, V.; Jacimovic, Z.; Bigovic, M.; Djurovic, D.; Krivokapic, S. Environmental status and geochemical assessment sediments of Lake Skadar, Montenegro. Environ. Monit. Assess. 2016, 188, 1–15. [Google Scholar] [CrossRef]
- Genchi, G.; Sinicropi, M.S.; Lauria, G.; Carocci, A.; Catalano, A. The effects of cadmium toxicity. Int. J. Environ. Res. Public Health 2020, 17, 3782. [Google Scholar] [CrossRef]
- Patra, M. Sharma, A. Mercury Toxicity in Plants. Bot. Rev. 2000, 66, 379–422. [Google Scholar] [CrossRef]
- Kastratovic, V.; Jacimovic, Z.; Djurovic, D.; Bigovic, M.; Krivokapic, S. Lemna minor L. as bioindicator of heavy metal pollution in Skadar Lake (Montenegro). J. Sci. 2015, 37, 123–134. [Google Scholar] [CrossRef] [Green Version]
- Petrovic, D.; Jancic, D.; Furdek, M.; Mikac, N.; Krivokapic, S. Aquatic Plant Trapa natans L. as Bioindicator of Trace Metal Contamination in a Freshwater Lake (Skadar Lake, Montenegro). Acta Bot. Croat. 2016, 75, 236–243. [Google Scholar] [CrossRef] [Green Version]
- MukeshBabu, M.; Dwivedi, D.H.; Ram, Y.R.B.; Meena, M.L. Bioaccumulation and distribution of heavy metals in water chestnut (Trapa natans var. bispinosa Roxb.) in the Lucknow Region. Afr. J. Agric. Res. 2013, 8, 2765–2768. [Google Scholar]
- Markovic, G.; Vicentijevic-Markovic, G.S.; Tanaskovic, S.T. First Record of Water Chestnut (Trapa natans L. Trapaceae, Myrtales) in Central Serbia. J. Cent. Eur. Agric. 2015, 16, 436–444. [Google Scholar] [CrossRef]
- Ministry of Tourism and Environment of Montenegro, Ministry of Environment, Forests and Water Administration of Albania (MEFWA). Lake Skadar Shkodra Integrated Ecosystem Management Project. The Strategic Action Plan (SAP) for Skadar Shkodra Lake Albania & Montenegro. Available online: https://iwlearn.net/resolveuid/b8fab0fe-f54b-4113-814e-850a52eefc04 (accessed on 1 March 2021).
- Ministry of Sustainable Development and Tourism. Strategic Environmental Impact Assessment Report for Spatial Plan of Special Purpose of Skadar Lake National Park; Ministry of Sustainable Development and Tourism: Podgorica, Montenegro, 2018; pp. 1–98. [Google Scholar]
- Bejko, D. Promoting Environmental Protection through the Management of Shared Natural Resources between Albania and Montenegro: The Shkodra Lake Watershed. In Environmental Security in South-Eastern Europe; Montini, M., Bogdanovic, S., Eds.; Springer: Dordrecht, The Netherlands; Berlin/Heidelberg, Germany, 2011; pp. 197–212. [Google Scholar]
- Dhora, D.; Sokoli, F.; Ligeni, S. Liqeni i Shkodrës—Biodiversiteti; UNDP, GEF/SGP, SHRMMNSH: Shkoder, Albany, 2000; pp. 14–23. (In Albanian) [Google Scholar]
- Keukelaar, F.; Goffau, A.; Pradhan, T.; Sutmuller, G.; Misurovic, A.; Ivanovic, S.; Uskokovic, B.; Hetoja, A.; Haxhimihali, E.; Prifti, A.; et al. Lake Shkoder Transboundary Diagnostic Analysis, Albania and Montenegro. Available online: https://www.ais.unwater.org/ais/aiscm/getprojectdoc.php?docid=1445 (accessed on 1 March 2021).
- Strbac, N.; Vukovic, M.; Voza, D.; Sokic, M. Sustainable Development and Environmental Protection. Recycl. Sustain. Dev. 2012, 5, 18–29. [Google Scholar]
- United Nations: The Sustainable Development Goals Report. Available online: https://unstats.un.org/sdgs/report/2019/The-Sustainable-Development-Goals-Report-2019.pdf (accessed on 1 March 2021).
- National Strategy of Development in Montenegro; Government of Montenegro, Ministry of Suistainable Development and Tourusm: Podgorica, Montenegro, 2007; pp. 1–125.
- Ministry of Ecology, Spatial Planning and Urbanism, Government of Montenegro: Nacionalna Strategija Održivog Razvoja do 2030. godine. Available online: https://mrt.gov.me/biblioteka/strategije?AccessibilityFontSize=default (accessed on 20 March 2021). (In Montenegrin)


| Metals | Working Wavelength | PQL (mg/L) |
|---|---|---|
| Pb | 283.3 | 0.005 |
| Cd | 228.8 | 0.001 |
| Cu | 324.8 | 0.001 |
| Zn | 213.9 | 0.002 |
| Al | 308.2 | 0.005 |
| Cr | 357.9 | 0.002 |
| Hg | 225.6 | 0.0005 |
| As | 224.5 | 0.0005 |
| Parameter/Metal | Value (mg/kg) | Result of Analysis CRM (mg/kg) | Certified Value CRM (mg/kg) | LOQ (mg/kg) |
|---|---|---|---|---|
| Lead (Pb) | 12 (±1) | 135.1 ± 11.3 | 132.8 ± 1.1 | 1 |
| Cadmium (Cd) | 0.26 (±0.03) | 0.820 ± 0.094 | 0.817 ± 0.011 | 0.2 |
| Copper (Cu) | 41 (±4) | 110.5 ± 10.8 | 117.7 ± 5.6 | 0.2 |
| Zinc (Zn) | 84 (±8) | 480.3 ± 45.7 | 485.3 ± 4.2 | 0.2 |
| Mercury (Hg) | 0.08 (±0.01) | 0.4465 ± 0.0558 | 0.4474 ± 0.0069 | 0.001 |
| Chromium (Cr) | 111 (±8) | 329.8 ± 23.7 | 352 ± 22 | 0.2 |
| Arsenic (As) | 7 (±1) | 42.2 ± 6.0 | 45.3 ± 1.8 | 2 |
| Samples (mg/L, mg/kg) | Pb | Cd | Cu | Zn | Al | Cr | Hg | As |
|---|---|---|---|---|---|---|---|---|
| Lake/Water | <0.005 | <0.0005 | <0.002 | 0.004 | <0.002 | <0.002 | <0.0005 | <0.01 |
| Trapa natans steam | <0.01 | <0.01 | 0.21 | 0.37 | 26.6 | 0.27 | <0.01 | <0.01 |
| Trapa natans leaf | <0.01 | <0.01 | 0.85 | 1.13 | 89.43 | 0.61 | <0.01 | <0.01 |
| Trapa natans fruit | <0.01 | <0.01 | 0.69 | 1.03 | 28.53 | 0.30 | <0.01 | <0.01 |
| Parameter/Metal | Value (mg/kg) |
|---|---|
| Lead (Pb) | 12 |
| Cadmium (Cd) | 0.26 |
| Copper (Cu) | 41 |
| Zinc (Zn) | 84 |
| Mercury (Hg) | 0.08 |
| Chromium (Cr) | 111 |
| Arsenic (As) | 7 |
| Stem | Leaf | Fruit | Sediment | |
|---|---|---|---|---|
| Stem | 0.867 * | 0.867 * | 0.732 * | |
| Leaf | 0.867 * | 1.000 ** | 0.620 | |
| Fruit | 0.867 * | 1.000 ** | 0.620 | |
| Sediment | 0.732 * | 0.620 | 0.620 | |
| Computed correlation used Kendall-method with listwise-deletion. | ||||
| Metals | Stem | Leaf | Fruit |
|---|---|---|---|
| Pb | 2 | 2 | 2 |
| Cd | 20 | 20 | 20 |
| Cu | 105 | 425 | 345 |
| Zn | 92.5 | 282.5 | 257.5 |
| Al | 1330 | 44715 | 14265 |
| Cr | 135 | 305 | 150 |
| Hg | 20 | 20 | 20 |
| As | 1 | 1 | 1 |
| Metals/Part of Plant | Pb | Cd | Cu | Zn | Al | Cr | Hg | As |
|---|---|---|---|---|---|---|---|---|
| stem | <0.01 | <0.01 | 0.21 | 0.37 | 26.6 | 0.27 | <0.01 | <0.01 |
| leaf | <0.01 | <0.01 | 0.85 | 1.13 | 89.43 | 0.61 | <0.01 | <0.01 |
| TA | 1.00 | 1.00 | 0.247 | 0.327 | 0.297 | 0.443 | 1.00 | 1.00 |
| Metals/Part of Plant | Pb | Cd | Cu | Zn | Al | Cr | Hg | As |
|---|---|---|---|---|---|---|---|---|
| stem | <0.01 | <0.01 | 0.21 | 0.37 | 26.6 | 0.27 | <0.01 | <0.01 |
| fruit | <0.01 | <0.01 | 0.69 | 1.03 | 28.53 | 0.30 | <0.01 | <0.01 |
| TA | 1.00 | 1.00 | 0.304 | 0.359 | 0.932 | 0.900 | 1.00 | 1.00 |
| Metals | Unit | Research Data | Rulebook | < or > |
|---|---|---|---|---|
| Lead | mg/L | 0.005 | 0.05 | < |
| Cadmium | mg/L | 0.0005 | 0.005 | < |
| Copper | mg/L | 0.002 | 1.0 | < |
| Zinc | mg/L | 0.004 | 0.3–1 | < |
| Aluminium | mg/L | 0.002 | ||
| Chromium | mg/L | 0.002 | 0.05 | < |
| Mercury | mg/L | 0.0005 | 0.005 | < |
| Arsenic | mg/L | 0.01 | 0.05 | < |
| Metals | Unit | Research Data | Canada SQG | < or > | Netherland SQG | < or > |
|---|---|---|---|---|---|---|
| Lead | mg/kg | 12.0 | 35.0 | < | 85.0 | < |
| Cadmium | mg/kg | 0.26 | 0.6 | < | 0.8 | < |
| Copper | mg/kg | 41 | 35.7 | > | 36.0 | > |
| Zinc | mg/kg | 84 | 123 | < | 140 | < |
| Chromium | mg/kg | 111 | 37.3 | > | 100 | > |
| Mercury | mg/kg | 0.08 | 0.17 | < | 0.3 | < |
| Arsenic | mg/kg | 7 | 5.9 | > | 29.0 | < |
Publisher’s Note: MDPI stays neutral with regard to jurisdictional claims in published maps and institutional affiliations. |
© 2021 by the author. Licensee MDPI, Basel, Switzerland. This article is an open access article distributed under the terms and conditions of the Creative Commons Attribution (CC BY) license (http://creativecommons.org/licenses/by/4.0/).
Share and Cite
Krivokapić, M. Study on the Evaluation of (Heavy) Metals in Water and Sediment of Skadar Lake (Montenegro), with BCF Assessment and Translocation Ability (TA) by Trapa natans and a Review of SDGs. Water 2021, 13, 876. https://doi.org/10.3390/w13060876
Krivokapić M. Study on the Evaluation of (Heavy) Metals in Water and Sediment of Skadar Lake (Montenegro), with BCF Assessment and Translocation Ability (TA) by Trapa natans and a Review of SDGs. Water. 2021; 13(6):876. https://doi.org/10.3390/w13060876
Chicago/Turabian StyleKrivokapić, Marijana. 2021. "Study on the Evaluation of (Heavy) Metals in Water and Sediment of Skadar Lake (Montenegro), with BCF Assessment and Translocation Ability (TA) by Trapa natans and a Review of SDGs" Water 13, no. 6: 876. https://doi.org/10.3390/w13060876
APA StyleKrivokapić, M. (2021). Study on the Evaluation of (Heavy) Metals in Water and Sediment of Skadar Lake (Montenegro), with BCF Assessment and Translocation Ability (TA) by Trapa natans and a Review of SDGs. Water, 13(6), 876. https://doi.org/10.3390/w13060876