
Coastal Erosion of Arctic Cultural Heritage in Danger: A Case Study from Svalbard, Norway


Abstract
1. Introduction
The GEOCULT Project
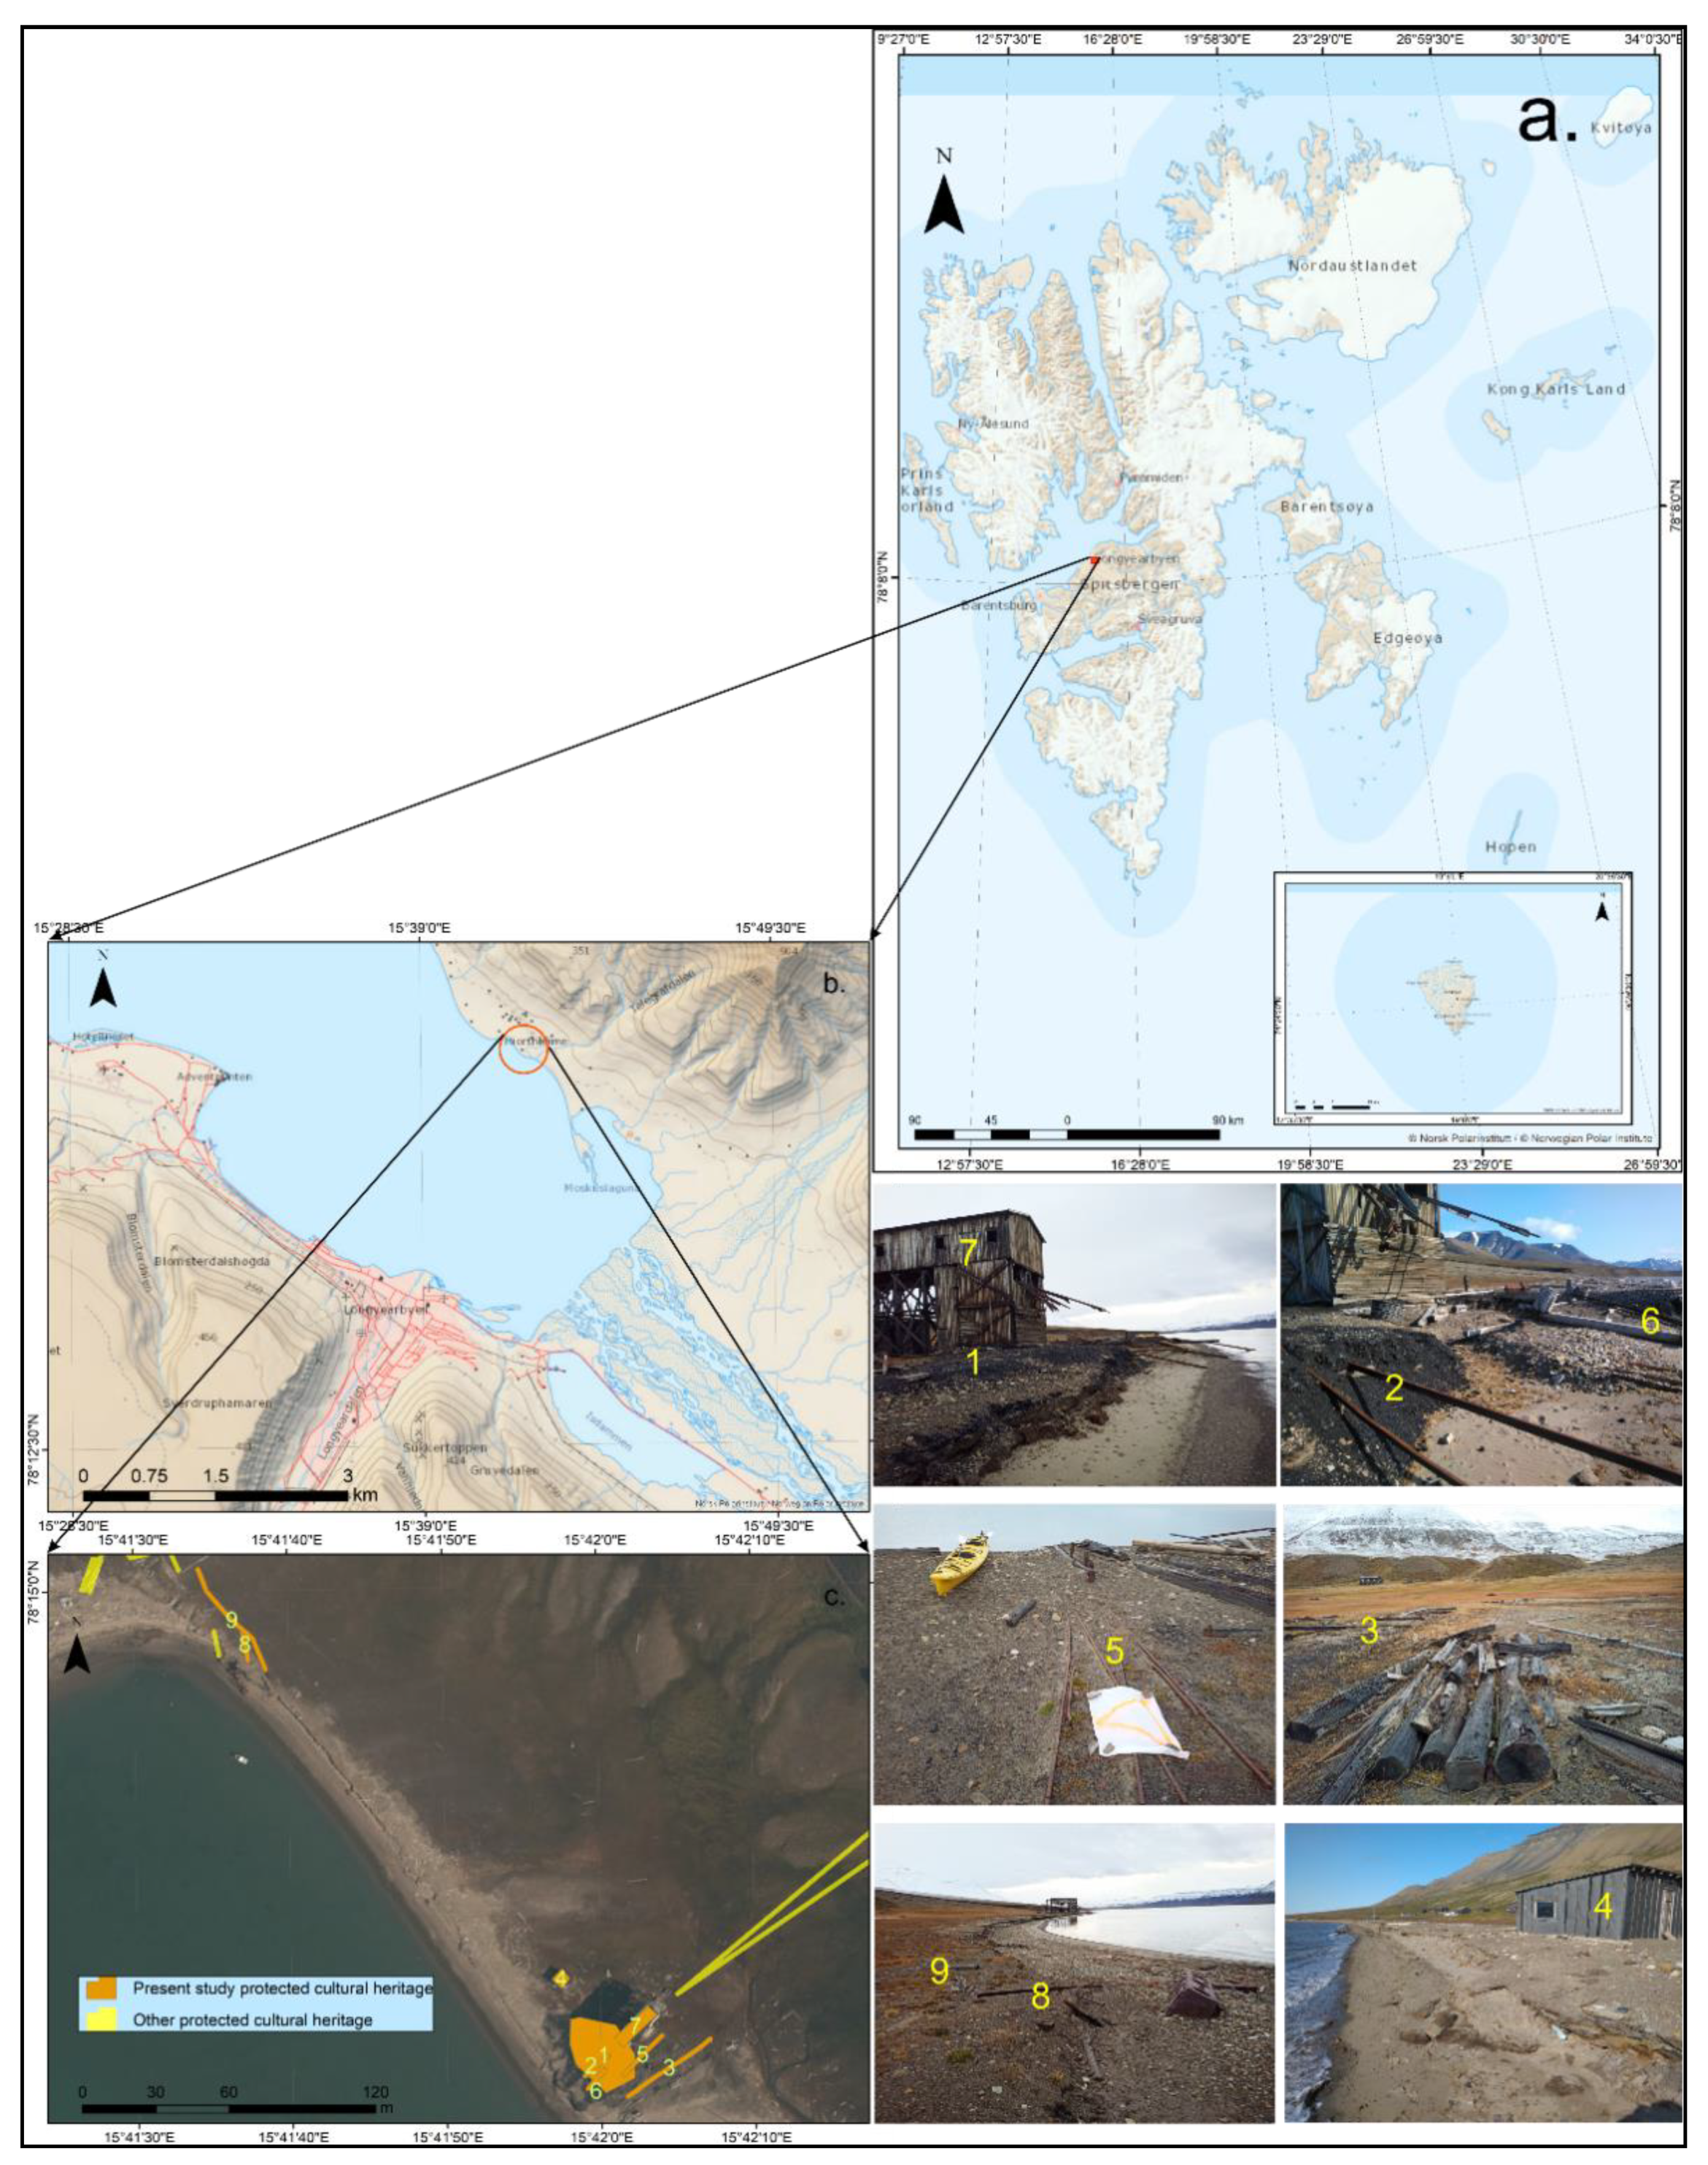
2. Study Area
3. Materials and Methods
4. Results and Discussion
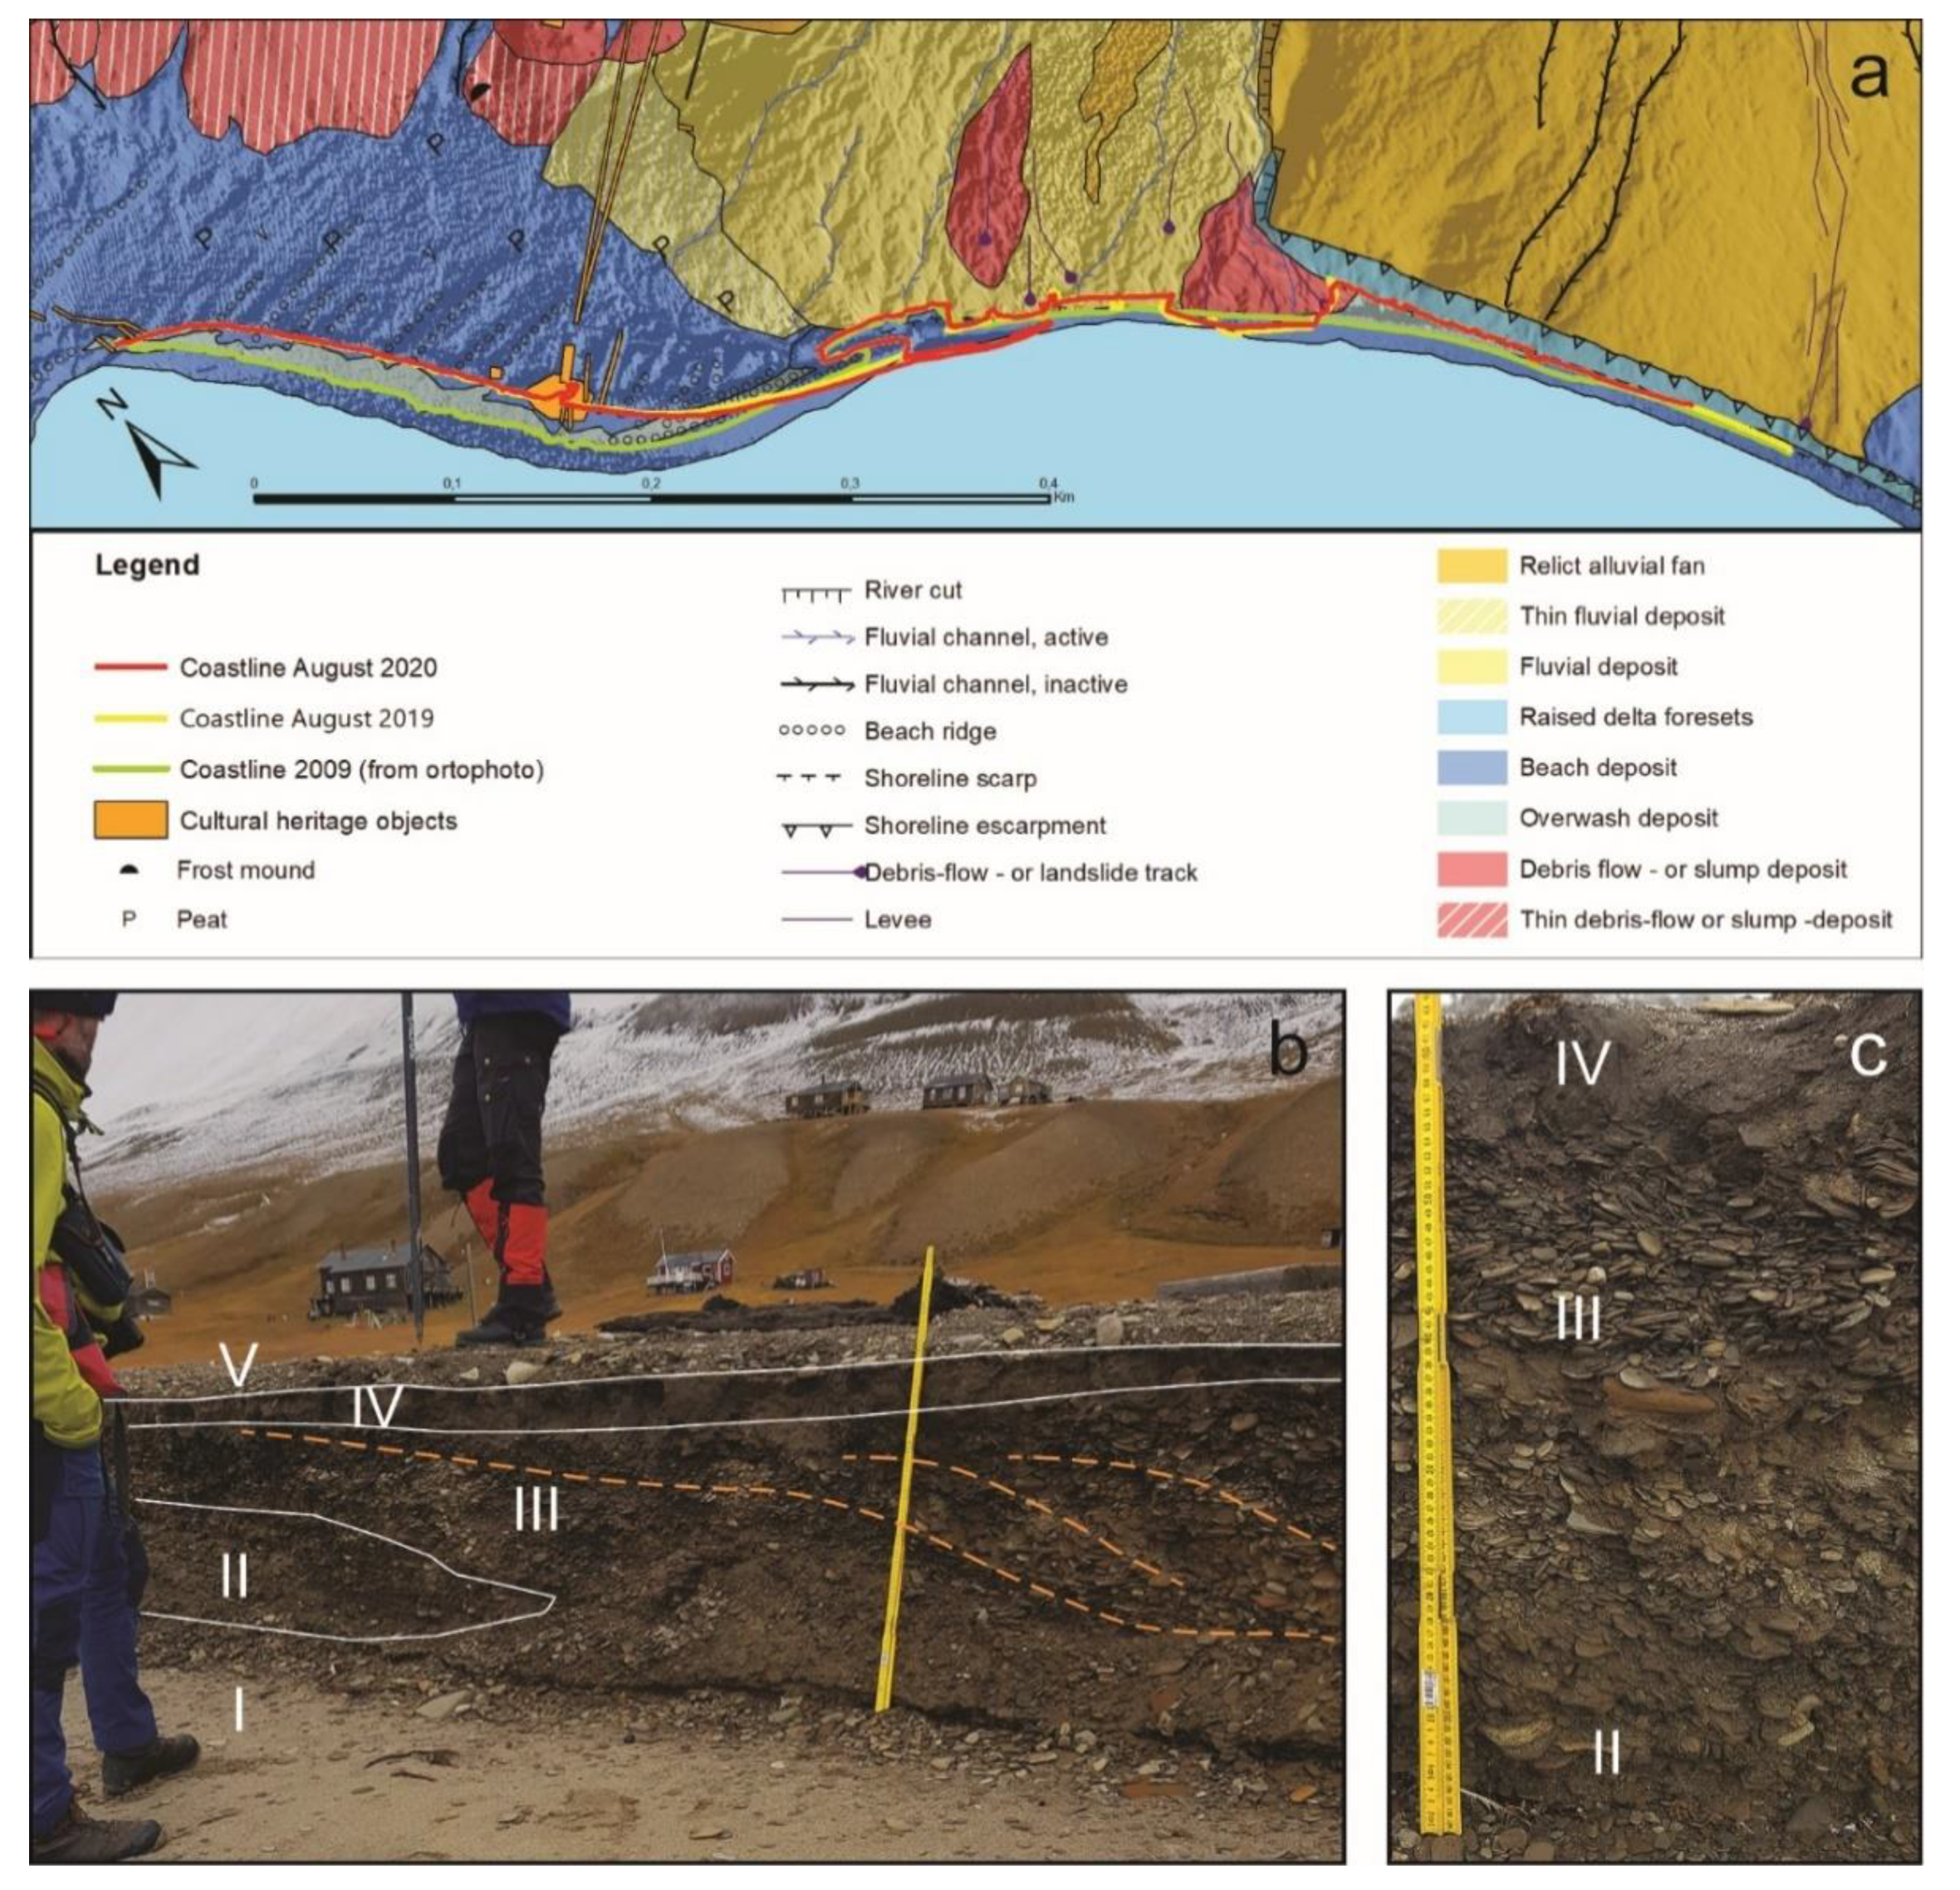
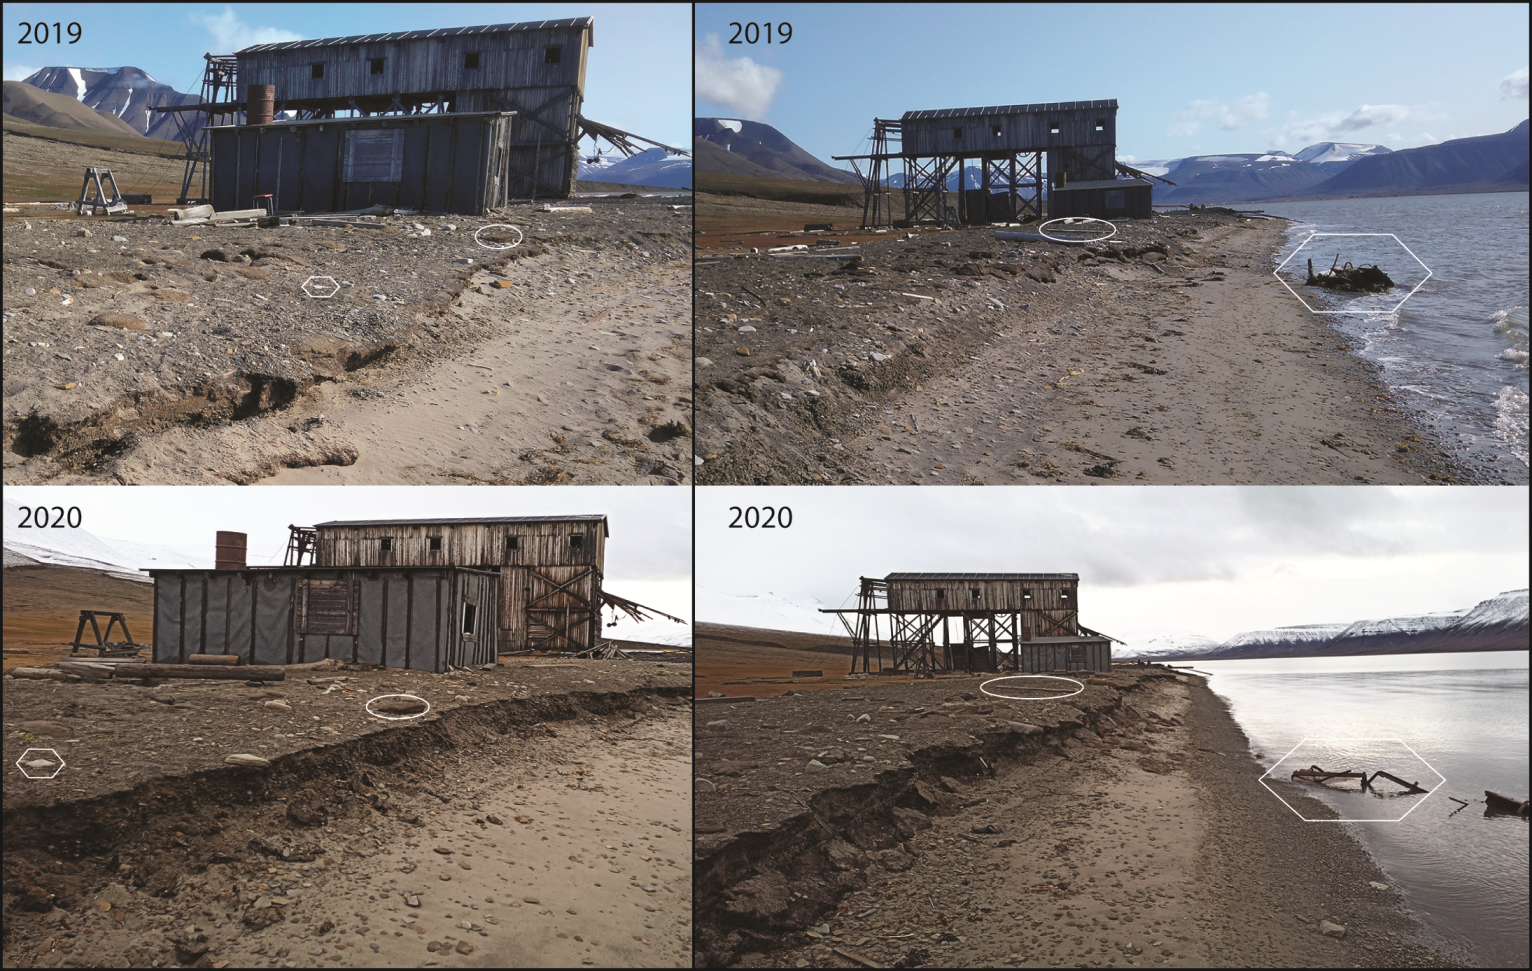
4.1. Geological Mapping and Short-Term Shoreline Erosion Changes
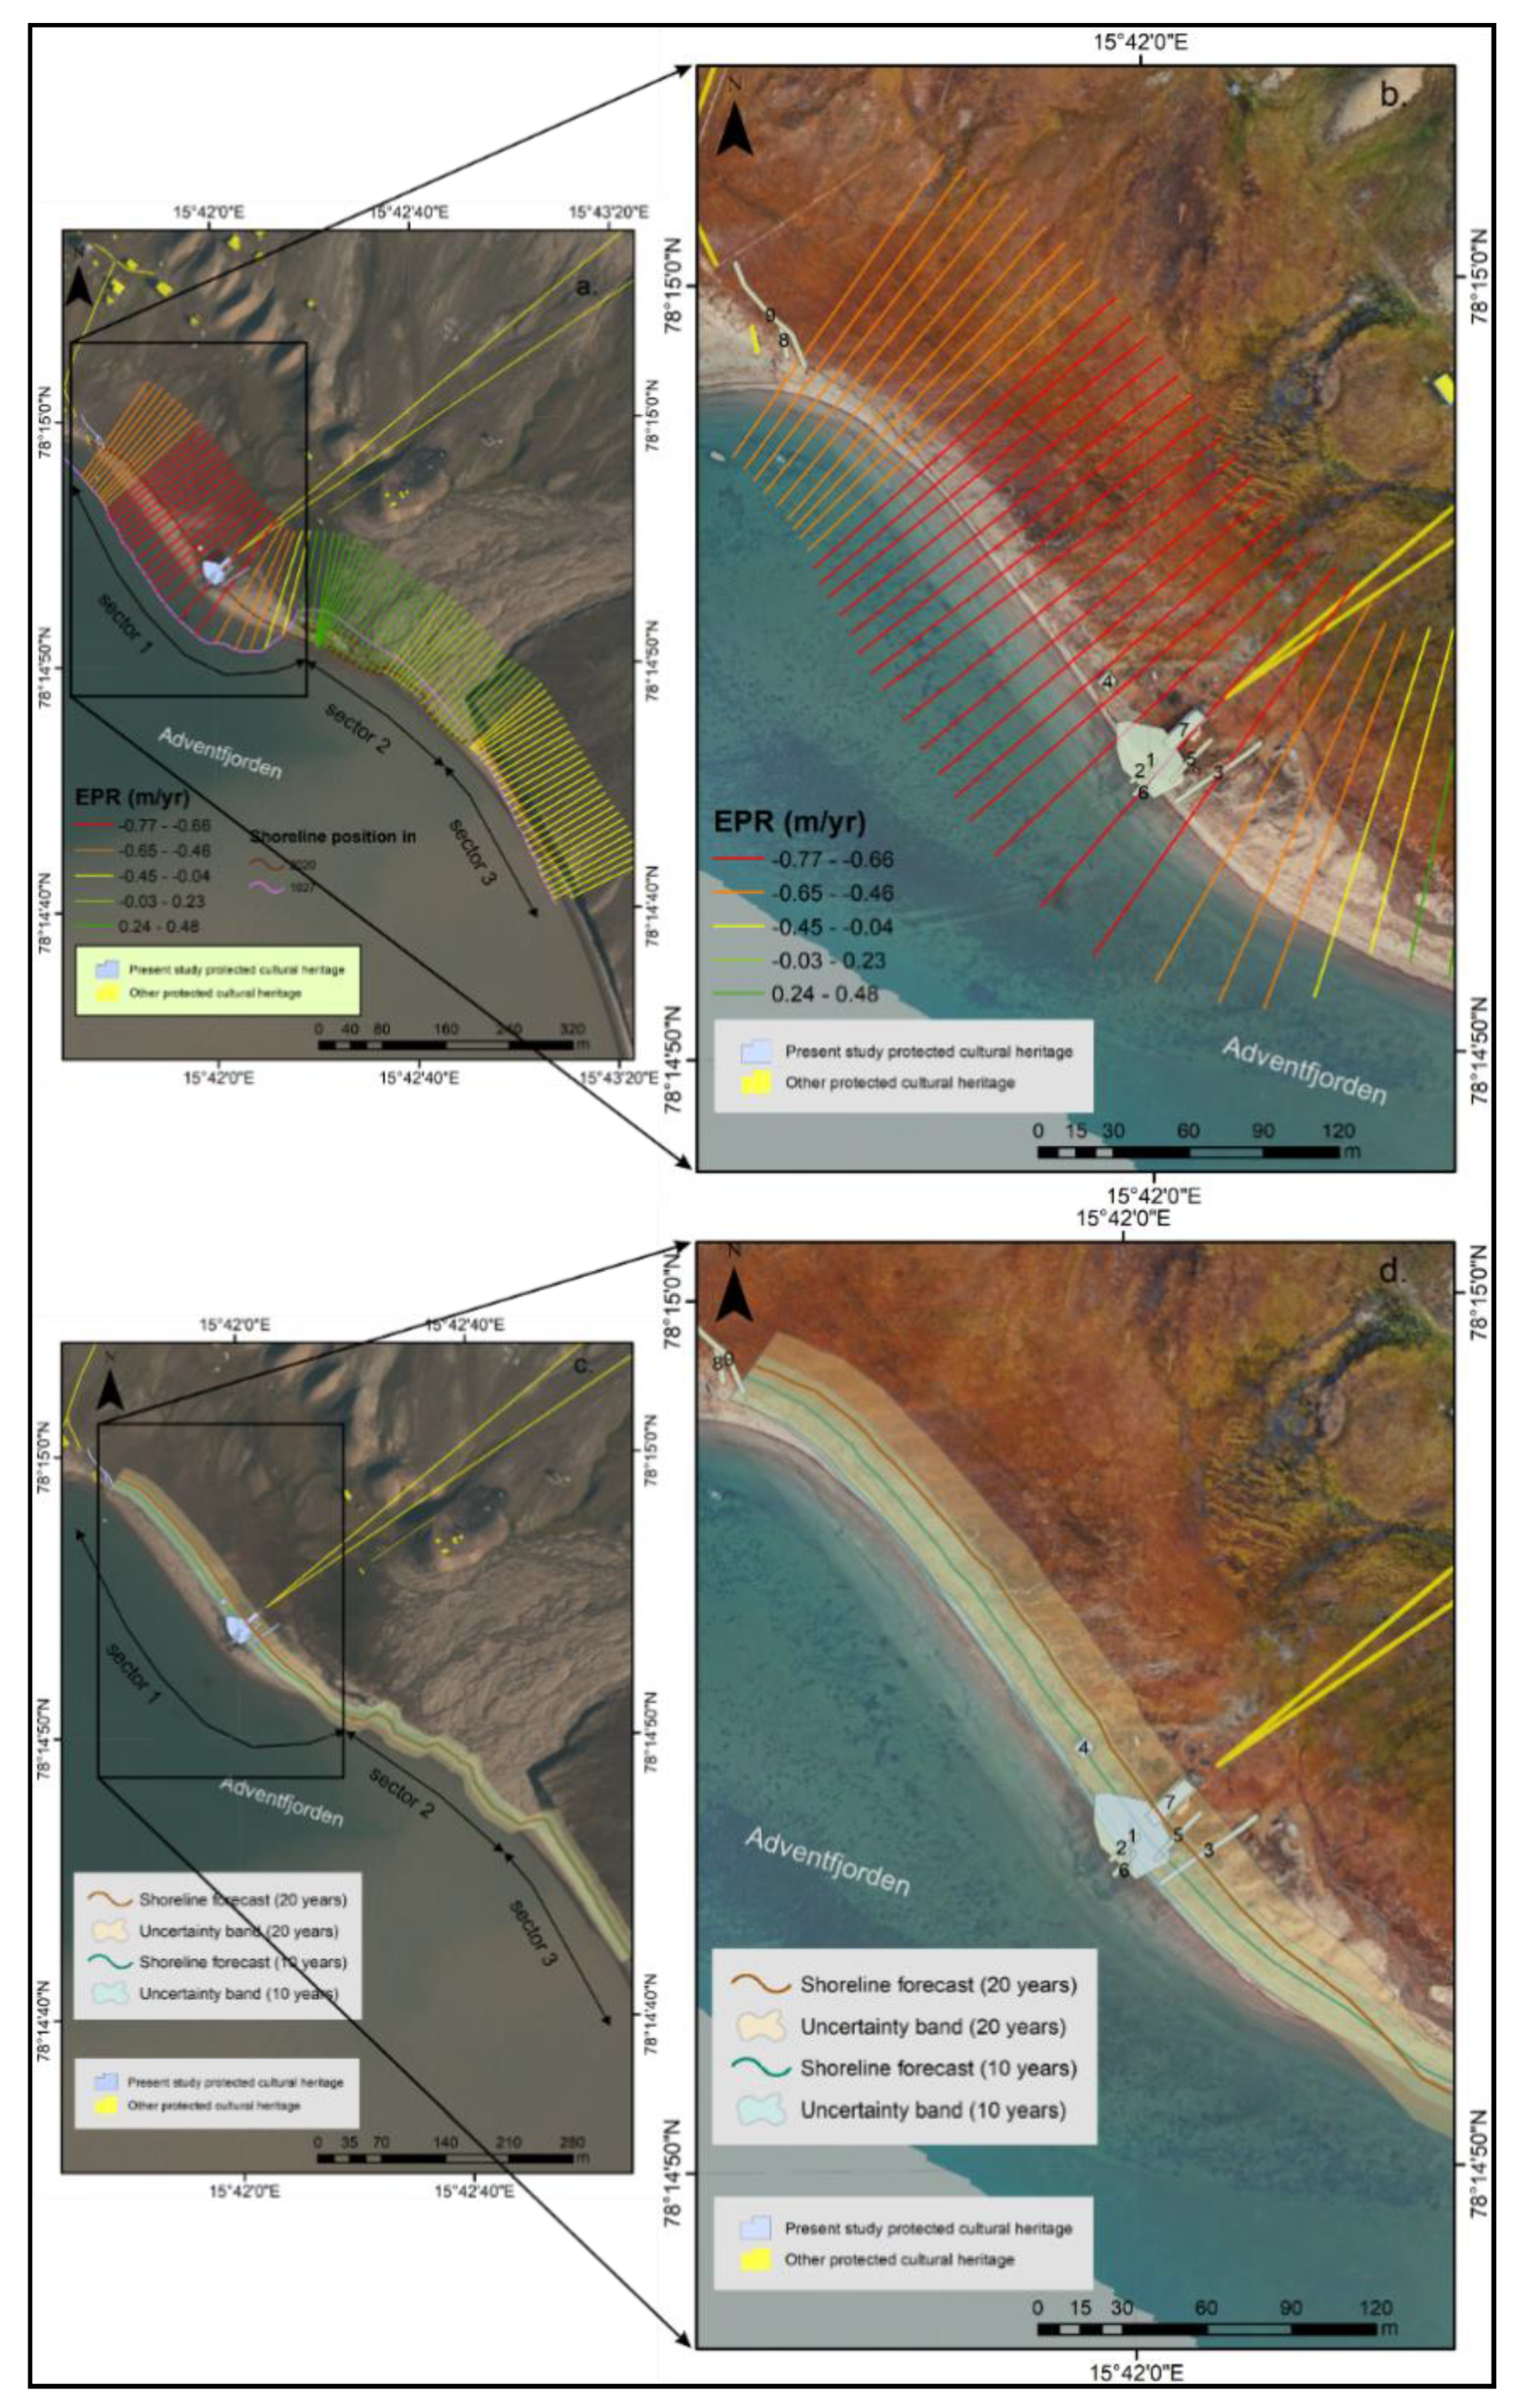
4.2. Long-Term Shoreline Changes and Implications on Cultural Heritage
5. Conclusions
Supplementary Materials
Author Contributions
Funding
Acknowledgments
Conflicts of Interest
References
- Verlynde, N. Perceptions of risk and climate change in densely populated coastal areas. Environ. Risque Santé 2018, 17, 278–293. [Google Scholar] [CrossRef]
- Jonah, F.E. Managing coastal erosion hotspots along the Elmina, Cape Coast and Moree area of Ghana. Ocean Coast. Manag. 2015, 109, 9–16. [Google Scholar] [CrossRef]
- Yu, Q.; Lau, A.K.H.; Tsang, K.T.; Fung, J.C.H. Human damage assessments of coastal flooding for Hong Kong and the Pearl River Delta due to climate change-related sea level rise in the twenty-first century. Nat. Hazards 2018, 92, 1011–1038. [Google Scholar] [CrossRef]
- Yletyinen, J. Arctic climate resilience. Nat. Clim. Chang. 2019, 9, 805–806. [Google Scholar] [CrossRef]
- Bintaja, R. The impact of Arctic warming on increased rainfall. Sci. Rep. 2018, 8, 16001. [Google Scholar] [CrossRef] [PubMed]
- Irrgang, A.M.; Lantuit, H.; Gordon, R.R.; Piskor, A.; Manson, G.K. Impacts of past and future coastal changes on the Yukon coast—Threats for cultural sites, infrastructure, and travel routes. Arct. Sci. 2019, 5, 107–126. [Google Scholar] [CrossRef]
- Li, J.; Ma, Y.; Liu, Q.; Zhang, W.; Guan, C. Growth of wave height with retreating ice cover in the Arctic. Cold Reg. Sci. Technol. 2019, 164, 102790. [Google Scholar] [CrossRef]
- Sesana, E.; Gagnon, A.S.; Bertolin, C.; Hughes, J. Adapting Cultural Heritage to Climate Change Risks: Perspectives of Cultural Heritage Experts in Europe. Geosciences 2018, 8, 305. [Google Scholar] [CrossRef]
- Lombardo, L.; Tanyas, H.; Nicu, I.C. Spatial modeling of multi-hazard threat to cultural heritage sites. Eng. Geol. 2020, 277, 105776. [Google Scholar] [CrossRef]
- Lantuit, H.; Overduin, P.P.; Couture, N.; Wetterich, S.; Aré, F.; Atkinson, D.; Brown, J.; Cherkashov, G.; Drozdov, D.; Forbes, D.L.; et al. The Arctic Coastal Dynamics database: A new classification scheme and statistics on arctic permafrost coastlines. Estuar. Coast. 2012, 35, 383–400. [Google Scholar] [CrossRef]
- Fatorić, S.; Seekamp, E. Are cultural heritage and resources threatened by climate change? A systematic literature review. Clim. Chang. 2017, 142, 227–254. [Google Scholar] [CrossRef]
- García Sánchez, F.; García Sánchez, H.; Ribalaygua, C. Cultural heritage and sea level rise threat: Risk assessment of coastal fortifications in the Canary Islands. J. Cult. Herit. 2020, 44, 211–217. [Google Scholar] [CrossRef]
- Reimann, L.; Vafeidis, A.T.; Brown, S.; Hinkel, J.; Tol, R.S.J. Mediterranean UNESCO World Heritage at risk from coastal flooding and erosion due to sea-level rise. Nat. Commun. 2018, 9, 4161. [Google Scholar] [CrossRef] [PubMed]
- Pourkerman, M.; Marriner, N.; Morhange, C.; Djamali, M.; Amjadi, S.; Lahijani, H.; Beni, A.N.; Vacchi, M.; Tofighian, H.; Shah-Hoesseini, M. Tracking shoreline erosion of “at risk” coastal archaeology: The example of ancient Siraf (Iran, Persian Gulf). Appl. Geogr. 2018, 101, 45–55. [Google Scholar] [CrossRef]
- Nicu, I.C.; Usmanov, B.; Gainullin, I.; Galimova, M. Shoreline dynamics and evaluation of cultural heritage sites on the shores of large reservoirs: Kuibyshev Reservoir, Russian Federation. Water 2019, 11, 591. [Google Scholar] [CrossRef]
- Williamson, J.; Nicu, I.C. Photogrammetric Measurement of Erosion at the Sabbath Point Beothuk Site in Central Newfoundland, Canada. Sustainability 2020, 12, 7555. [Google Scholar] [CrossRef]
- Sankhua, R.N.; Sharma, N.; Pandey, A.D. Use of remote sensing and ANN in assessment of erosion activities in Majuli, the world’s largest river island. Int. J. Remote Sens. 2005, 26, 4445–4454. [Google Scholar] [CrossRef]
- Nicu, I.C. Natural hazards—A threat for immovable cultural heritage. A review. Int. J. Conserv. Sci. 2017, 8, 375–388. [Google Scholar]
- Nicu, I.C. Natural risk assessment and mitigation of cultural heritage sites in North-eastern Romania (Valea Oii river basin). Area 2019, 51, 142–154. [Google Scholar] [CrossRef]
- Arlov, T.B. A Short History of Svalbard, 2nd ed.; Norsk Polarinstitutt: Oslo, Norway, 1989. [Google Scholar]
- Nicu, I.C.; Stalsberg, K.; Rubensdotter, L.; Martens, V.V.; Flyen, A.-C. Coastal Erosion Affecting Cultural Heritage in Svalbard. A Case Study in Hiorthhamn (Adventfjorden)—An Abandoned Mining Settlement. Sustainability 2020, 12, 2306. [Google Scholar] [CrossRef]
- Hollesen, J.; Matthiesen, H.; Fenger-Nielsen, R.; Abermann, J.; Westergaard-Nielsen, A.; Elberling, B. Predicting the loss of organic archaeological deposits at a regional scale in Greenland. Sci. Rep. 2019, 9, 1–8. [Google Scholar] [CrossRef] [PubMed]
- Fenger-Nielsen, R.; Elberling, B.; Kroon, A.; Westergaard-Nielsen, A.; Matthiesen, H.; Harmsen, H.; Madsen, C.K.; Stendel, M.; Hollesen, J. Arctic archaeological sites threatened by climate change: A regional multi-threat assessment of sites in south-west Greenland. Archaeom 2020, 62, 1280–1297. [Google Scholar] [CrossRef]
- Jensen, A.M. Critical information for the study of ecodynamics and socio-natural systems: Rescuing endangered heritage and data from Arctic Alaskan Coastal sites. Quat. Int. 2020, 549, 227–238. [Google Scholar] [CrossRef]
- Bose, P.S. Vulnerabilities and displacements: Adaptation and mitigation to climate change as a new development mantra. Area 2016, 48, 168–175. [Google Scholar] [CrossRef]
- Fram Centre. Available online: http://www.ifram.no/innstilte-prosjekter-for-finansiering-i-2020-terrestrial.6279308-337573.html (accessed on 8 December 2020).
- Esau, I.; Argentini, S.; Przybylak, R.; Repina, I.; Sjöblom, A. Svalbard Meteorology. Adv. Meteorol. 2012, 2012, 1–3. [Google Scholar] [CrossRef]
- Christiansen, H.H.; Humlum, O.; Eckerstorfer, M. Central Svalbard 2000–2011 Meteorological Dynamics and Periglacial Landscape Response. Arct. Antarct. Alp. Res. 2013, 45, 6–18. [Google Scholar] [CrossRef]
- Nordli, Ø.; Przybylak, R.; Ogilvie, A.E.J.; Isaksen, K. Long-term temperature trends and variability on Spitsbergen: The extended Svalbard Airport temperature series, 1898–2012. Polar Res. 2014, 33, 21349. [Google Scholar] [CrossRef]
- Førland, E.J.; Benestad, R.E.; Hanssen-Bauer, I.; Haugen, J.E.; Skaugen, T.E. Temperature and Precipitation Development at Svalbard 1900–2100. Adv. Meteorol. 2011, 2011, 1–14. [Google Scholar] [CrossRef]
- Dallmann, W.K.; Kjærnet, T.; Nøttvedt, A. Geological Map of Svalbard, 1:100,000 sheet C9G Adventdalen. Temakart 31/32; Norwegian Polar Institute: Tromsø, Norway, 2001; pp. 4–55. [Google Scholar]
- De Haas, T.; Kleinhans, M.G.; Carbonneau, P.E.; Rubensdotter, L.; Hauber, E. Surface morphology of fans in the high-Arctic periglacial environment of Svalbard: Controls and processes. Earth-Science Rev. 2015, 146, 163–182. [Google Scholar] [CrossRef]
- Eckerstorfer, M.; Malnes, E.; Christiansen, H.H. Freeze/thaw conditions at periglacial landforms in Kapp Linné, Svalbard, investigated using field observations, in situ, and radar satellite monitoring. Geomorphology 2017, 293, 433–447. [Google Scholar] [CrossRef]
- Van Pelt, W.; Pohjola, V.; Pettersson, R.; Marchenko, S.; Kohler, J.; Luks, B.; Hagen, J.O.; Schuler, T.V.; Dunse, T.; Noël, B.; et al. A long-term dataset of climatic mass balance, snow conditions, and runoff in Svalbard (1957–2018). Cryosphere 2019, 13, 2259–2280. [Google Scholar] [CrossRef]
- Jaskólski, M.W.; Pawłowski, Ł.; Strzelecki, M.C. High Arctic coasts at risk—The case study of coastal zone development and degradation associated with climate changes and multidirectional human impacts in Longyearbyen (Adventfjorden, Svalbard). Land Degrad. Dev. 2018, 29, 2514–2524. [Google Scholar] [CrossRef]
- Zagórski, P.; Jarosz, K.; Superson, J. Integrated Assessment of Shoreline Change along the Calypsostranda (Svalbard) from Remote Sensing, Field Survey and GIS. Mar. Geod. 2020, 43, 433–471. [Google Scholar] [CrossRef]
- Kruse, F. Is Svalbard a pristine ecosystem? Reconstructing 420 years of human presence in an Arctic archipelago. Polar Rec. 2016, 52, 518–534. [Google Scholar] [CrossRef]
- Himmelstoss, E.A.; Henderson, R.E.; Kratzmann, M.G.; Farris, A.S. Digital Shoreline Analysis System (DSAS) Version 5.0 User Guide; Open-File Report; US Geological Survey: Reston, VA, USA, 2018.
- Riksantivaren—Norwegian Directorate for Cultural Heritage Management. Available online: https://www.riksantikvaren.no/veiledere/askeladden/ (accessed on 8 December 2020).
- Noardo, F. Architectural heritage semantic 3D documentation in multi-scale standard maps. J. Cult. Herit. 2018, 32, 156–165. [Google Scholar] [CrossRef]
- Dawson, P.C.; Bertulli, M.M.; Lévy, R.; Tucker, C.; Dick, L.; Cousins, P.L. Application of 3D Laser Scanning to the Preservation of Fort Conger, a Historic Polar Research Base on Northern Ellesmere Island, Arctic Canada. Arctic 2013, 66, 147–158. [Google Scholar] [CrossRef]
- Lewińska, P.; Zagórski, P. Creating a 3D database of Svalbard’s historical sites: 3D inventory and virtual reconstruction of a mining building at Camp Asbestos, Wedel Jarlsberg Land, Svalbard. Polar Res. 2018, 37, 1485416. [Google Scholar] [CrossRef]
- Solem, D.-Ø.E.; Nau, E. Two New Ways of Documenting Miniature Incisions Using a Combination of Image-Based Modelling and Reflectance Transformation Imaging. Remote. Sens. 2020, 12, 1626. [Google Scholar] [CrossRef]
- Medina, J.J.; Maley, J.M.; Sannapareddy, S.; Medina, N.N.; Gilman, C.M.; McCormack, J.E. A rapid and cost-effective pipeline for digitization of museum specimens with 3D photogrammetry. PLoS ONE 2020, 15, e0236417. [Google Scholar] [CrossRef]
- Zagórski, P.; Rodzik, J.; Moskalik, M.; Strzelecki, M.; Lim, M.; Błaszczyk, M.; Promińska, A.; Kruszewksi, G.; Styszyńska, A.; Malczewski, A. Multidecadal (1960–2011) shoreline changes in Isbjørnhamna (Hornsund, Svalbard). Pol. Polar Res. 2015, 36, 369–390. [Google Scholar] [CrossRef]


| Nr. crt. | Heritage Site ID | Name | Function/Description |
|---|---|---|---|
| 1 | 93040-12 | Coal pile | Industry, production/coal pile at the cable-car central |
| 2 | 93040-2 | Track | Industry, manufacturing, production/route of trolley track |
| 3 | 93049-19 | Track | Industry, manufacturing, production/remnants of railroad |
| 4 | 93040-5 | Smithy | Industry, manufacturing, production/the building has a wooden frame; roofing-felt cladding on all sides, wooden door, windows are missing. Forging-hearth of yellow brick. The chimney is made out of oil drums. A lot of scrap iron in and around the building, along with remnants of a hand drill and iron ovens |
| 5 | 93040-4 | Track | Industry, manufacturing, production/route of trolley track |
| 6 | 93040-3 | Track | Industry, manufacturing, production/route of trolley track |
| 7 | 93040-6 | Cable-car Central | Industry, manufacturing, production/a large wooden construction for coal loading. The machinery inside is in good condition; with wheels and gears on cast foundations. A staircase leads to the top of the structure. Remains of two railway tracks bulge from the south side of the building towards the fjord |
| 8 | 146668-20 | Track | Industry, manufacturing, production/remnants of railroad |
| 9 | 146668-21 | Track | Industry, manufacturing, production/remnants of railroad |
Publisher’s Note: MDPI stays neutral with regard to jurisdictional claims in published maps and institutional affiliations. |
© 2021 by the authors. Licensee MDPI, Basel, Switzerland. This article is an open access article distributed under the terms and conditions of the Creative Commons Attribution (CC BY) license (http://creativecommons.org/licenses/by/4.0/).
Share and Cite
Nicu, I.C.; Rubensdotter, L.; Stalsberg, K.; Nau, E. Coastal Erosion of Arctic Cultural Heritage in Danger: A Case Study from Svalbard, Norway. Water 2021, 13, 784. https://doi.org/10.3390/w13060784
Nicu IC, Rubensdotter L, Stalsberg K, Nau E. Coastal Erosion of Arctic Cultural Heritage in Danger: A Case Study from Svalbard, Norway. Water. 2021; 13(6):784. https://doi.org/10.3390/w13060784
Chicago/Turabian StyleNicu, Ionut Cristi, Lena Rubensdotter, Knut Stalsberg, and Erich Nau. 2021. "Coastal Erosion of Arctic Cultural Heritage in Danger: A Case Study from Svalbard, Norway" Water 13, no. 6: 784. https://doi.org/10.3390/w13060784
APA StyleNicu, I. C., Rubensdotter, L., Stalsberg, K., & Nau, E. (2021). Coastal Erosion of Arctic Cultural Heritage in Danger: A Case Study from Svalbard, Norway. Water, 13(6), 784. https://doi.org/10.3390/w13060784