1. Introduction
Recently, the high demand for water in domestic, agricultural, and industrial sectors has added additional pressure on water resources [
1,
2]. It is important to balance this demand by understanding recharge as an essential process in water resources management.
Groundwater recharge zones potential zones (GRPZ) are identified as locations where the ground surface permits water infiltration and percolation through the soil [
3]. Thus, water can infiltrate into the soil, reach the vadose zone, or continue flowing [
4,
5,
6,
7,
8].
Despite the importance of recharge zones as essential elements in water resources management in Willochra Basin, the identification and mapping of these zones is still poorly understood.
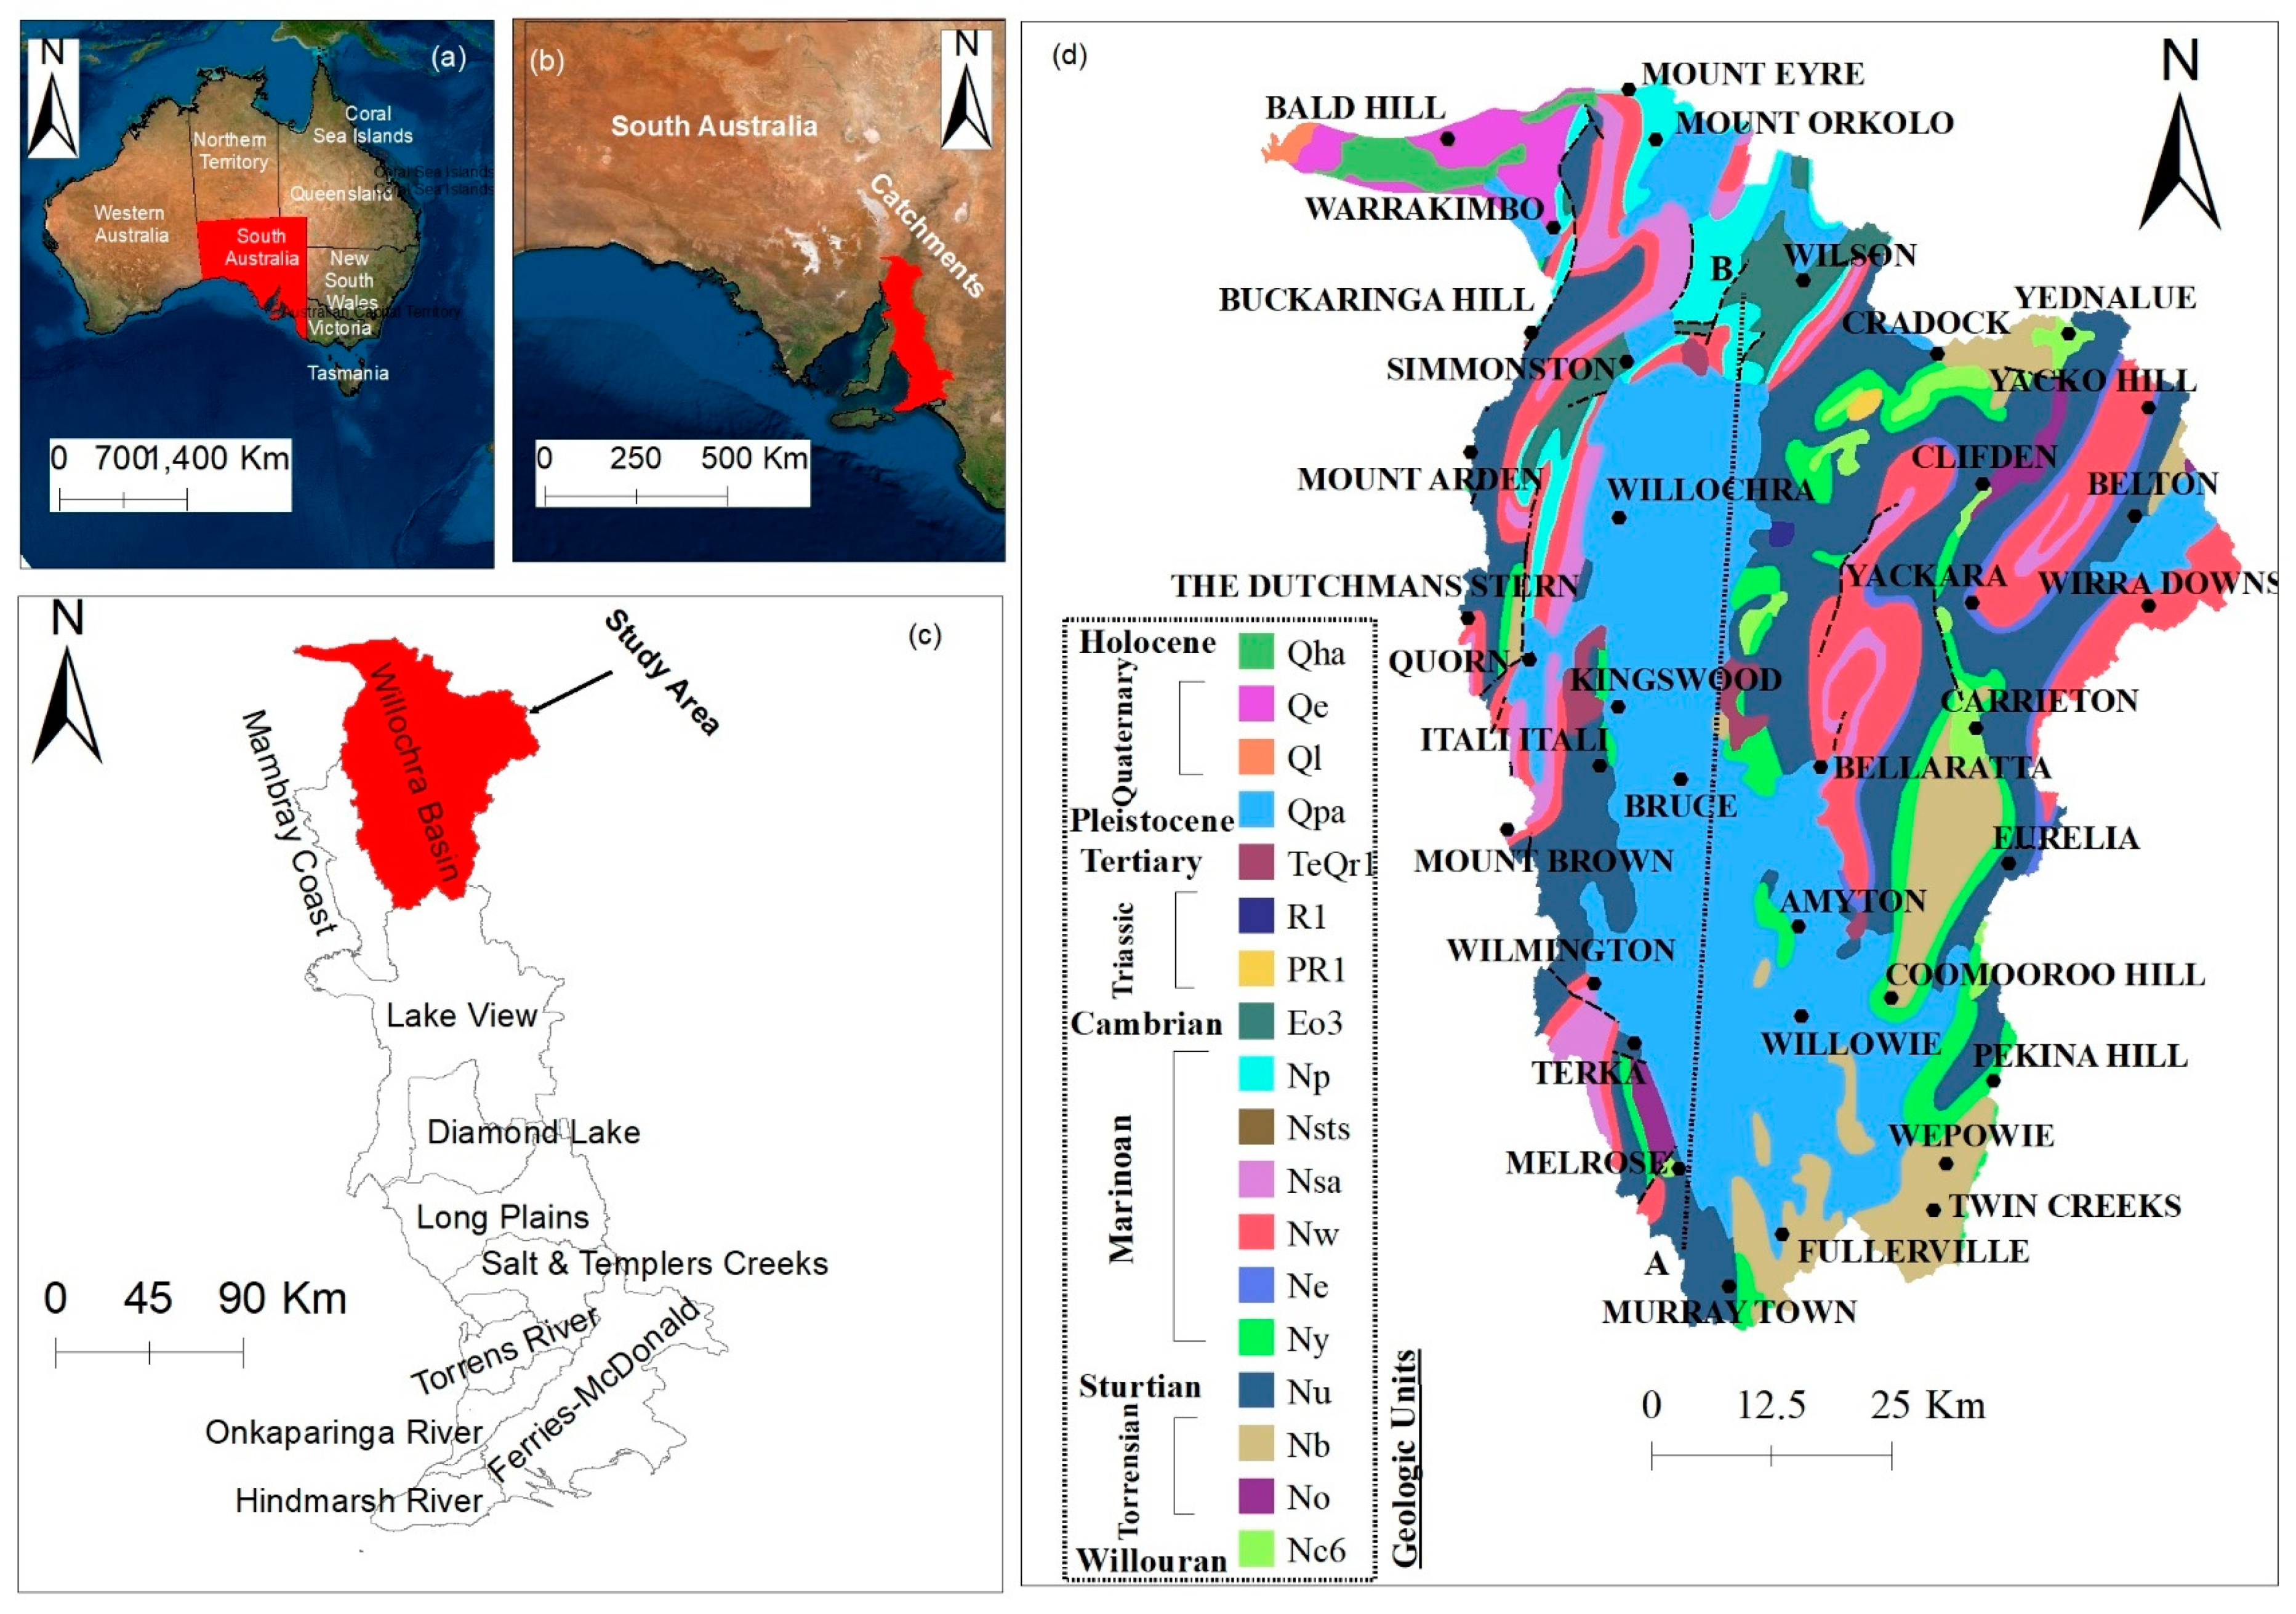
The main objective of this study is to highlight the importance of the integration of Remote Sensing (RS), Geographic Information System (GIS), and modelling as an efficient and low-cost approach to delineate recharge potential zonation, using the Willochra Basin of South Australia as an example (
Figure 1). The Willochra Basin exhibits severe drought characteristics despite having considerable annual rainfall. Along the basin, land use has changed from cropping and grazing rotation to irrigated horticulture, which has led to the construction of larger farm dams (>5 ML). The combined impacts of flood irrigation and farm dam development have added more pressure on the water resources. Therefore, the need for sustainable management of the groundwater resource is crucial.
The recharge potential in arid regions varies significantly in space and time due to the low and intermittent precipitation, and high annual temperature [
9]. As a result, several geological, hydrological, and geophysical methods have been developed to identify the dynamics of recharge in such areas [
10,
11,
12]. However, most of these methods are considered time consuming and costly for water resources management.
During the last two decades, significant attention has been given to cost-effective approaches for mapping the groundwater recharge potential zones [
13,
14,
15]. One of the most effective approaches, which has been extensively used for the water resources management, is the integration of remote sensing (RS), a geographic information system (GIS), and multicriteria decision-making (MCDM) [
3,
11,
12]. The availability of RS data has facilitated the assessment of prospective groundwater potential zones at both local and regional scales [
4,
16,
17]. In addition, MCDM has been widely used to deal with complex decision problems [
16,
17,
18,
19,
20]. In the assessment of water resource evaluation processes, MCDM has been employed to find a solution for absent and/or vague information, effectively manage and understand decisions, and improve the quality of judgments [
15,
21,
22]. In general, MCDM analysis is considered an effective technique for assessment in groundwater potential mapping, especially in data-limited areas [
21].
In this study, the analytic hierarchy process (AHP), the multi-influencing factor (MIF), and fraction ratio (FR) methods, such as MCDM, are applied to develop a sustainability assessment framework. These techniques have been recognised as powerful, efficient, and reliable methods for multi-criteria decision analysis in GIS environments [
22,
23,
24]. AHP is a rational technique for organizing information alternatives based on a hierarchical framework by the application of mathematical pairwise comparisons [
25]. It is a widely accepted model that can be employed for environmental management and hazard modelling purposes [
5,
6,
7,
8,
26,
27]. MIF is another elementary technique to execute MCDM based on existing knowledge of the relative importance of different factors [
28,
29,
30,
31]. It has been extensively used to delineate groundwater potential regions [
32,
33]. Additionally, the FR method has been integrated with other approaches to find out groundwater potential regions in many studies [
21,
34,
35,
36]. In recent years, several studies have been successfully undertaken to identify the recharge potential zones using advanced approaches such as statistical approaches [
37,
38], logistic model tree [
39], artificial neural network [
40], random forest, and maximum entropy models [
41]. However, studies about the integration of the AHP, MIF, and FR methods, and RS and GIS to delineate groundwater potential zones are still few [
36]. The present study is an attempt to incorporate a systematic integration of the three techniques with available remotely sensed and groundwater data to provide a rapid and cost-effective tool for delineating the groundwater potential zones.
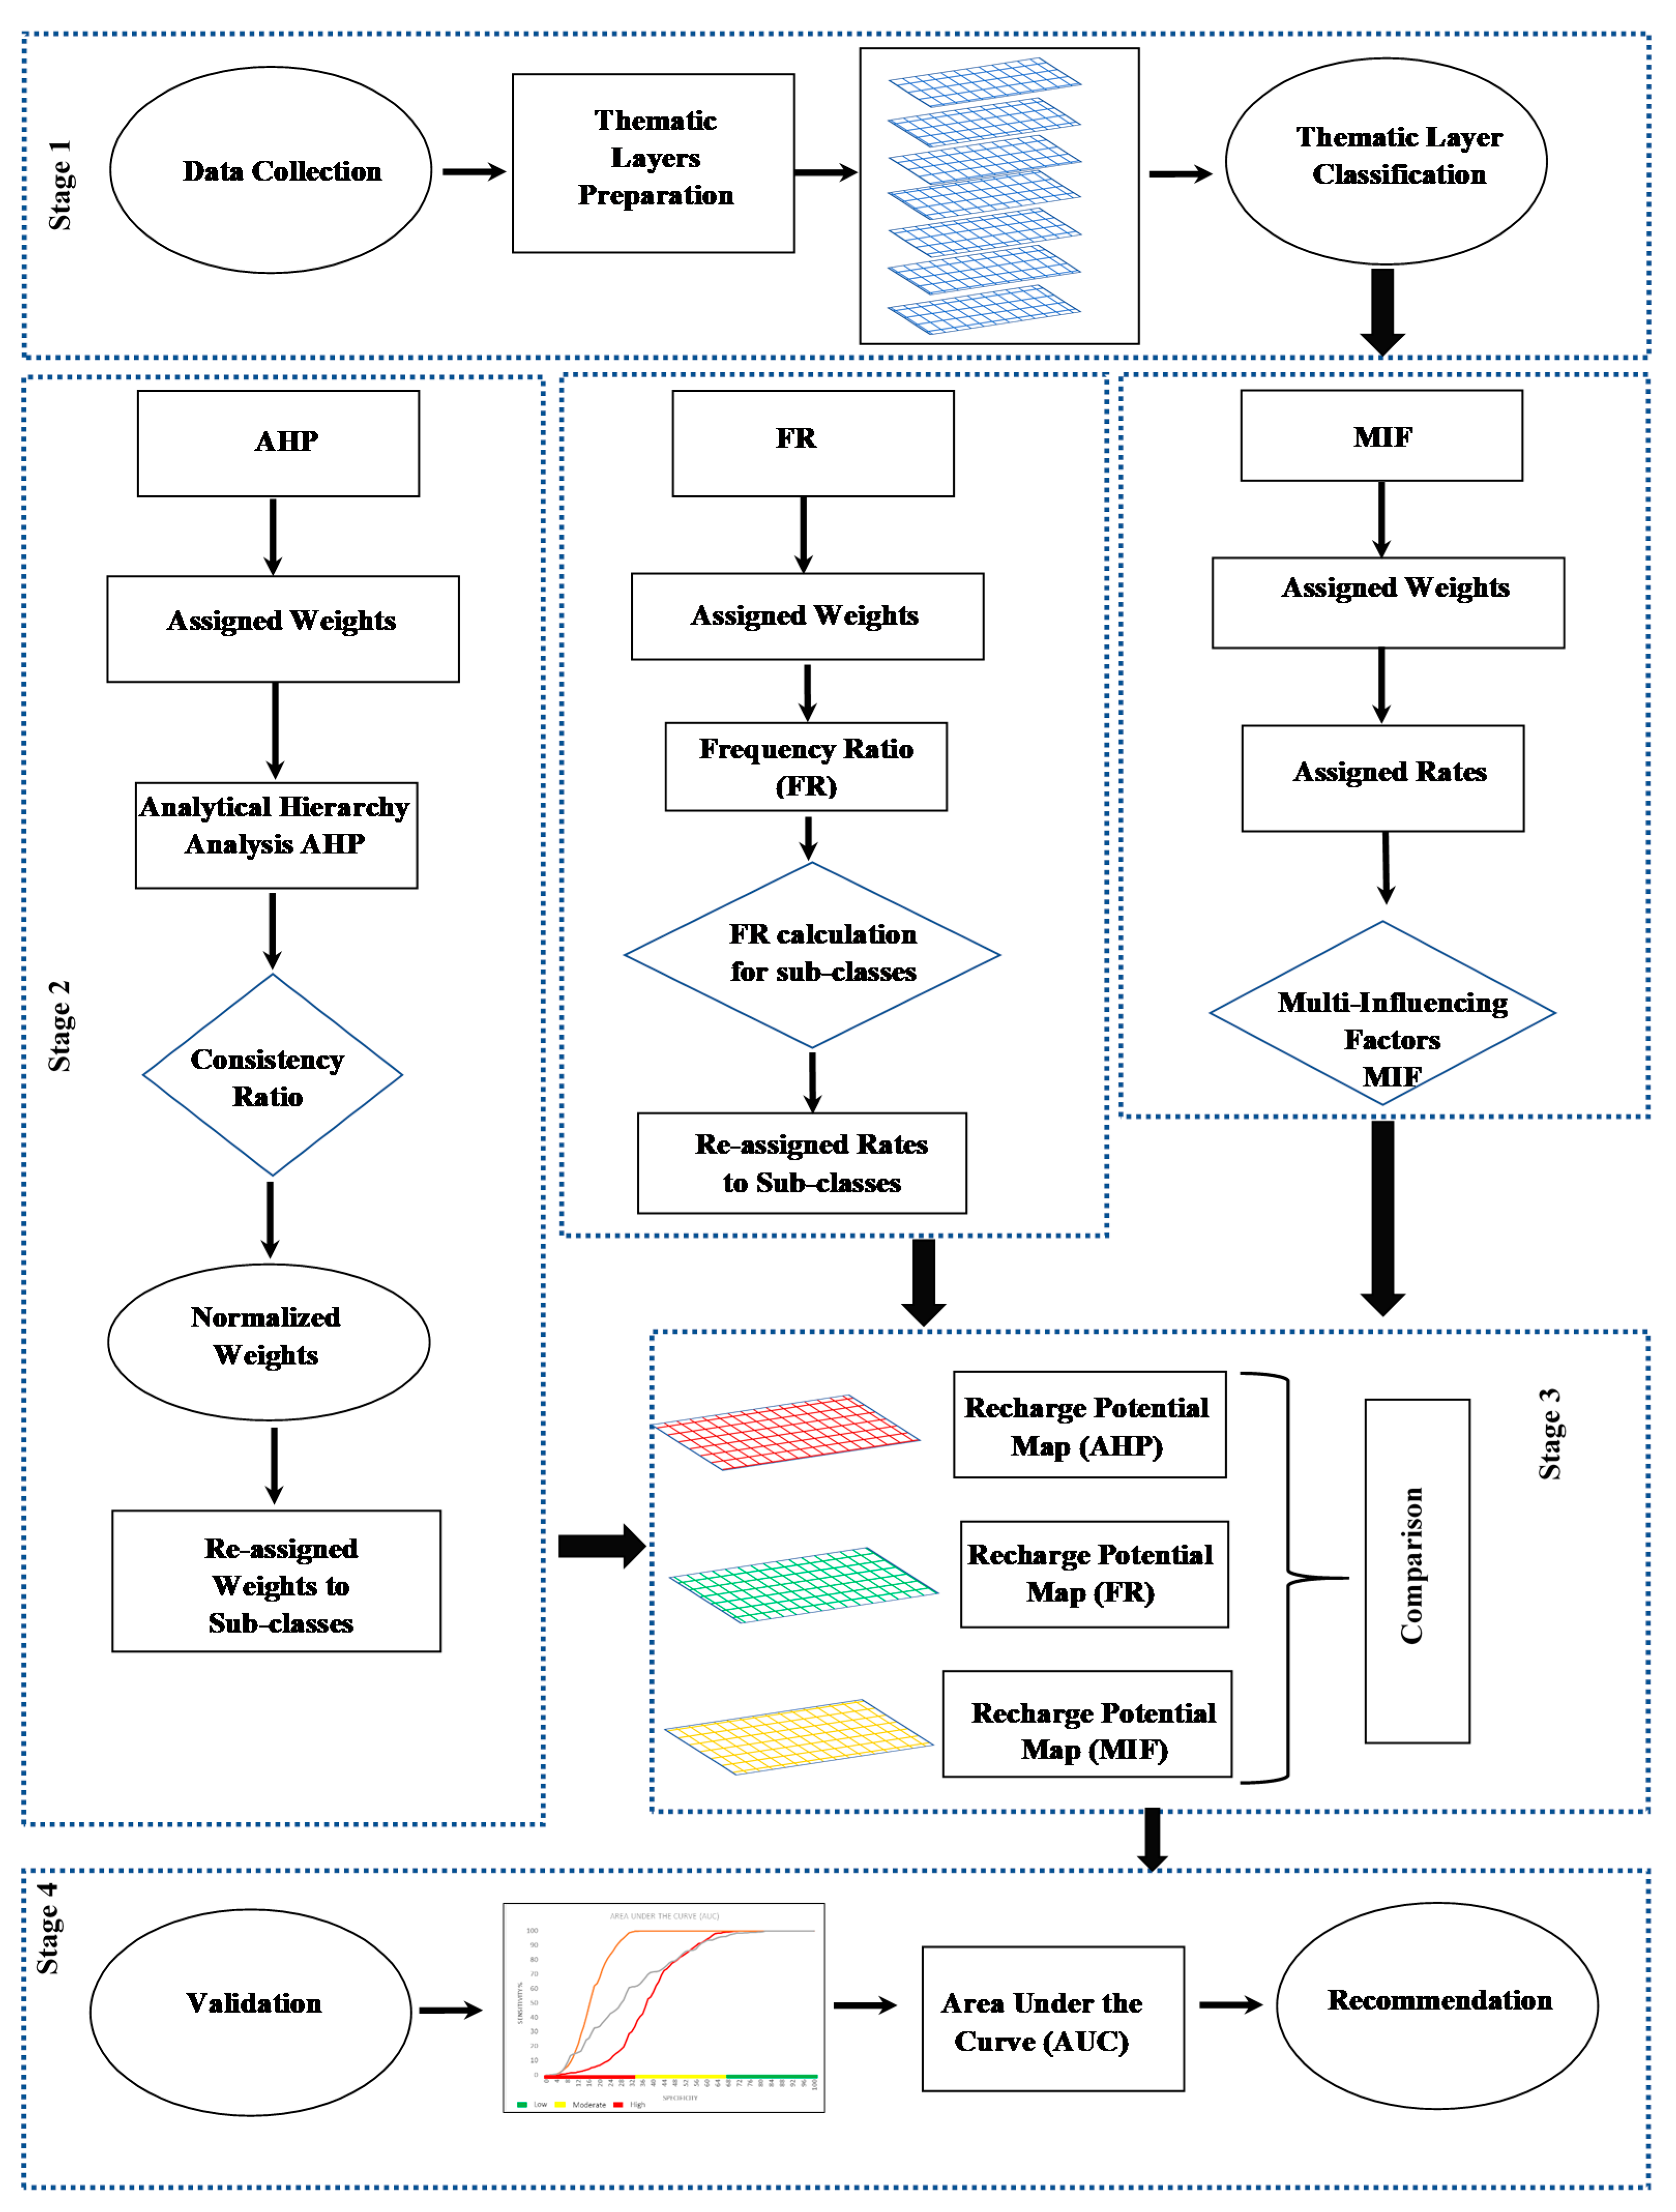
The study aims to: (1) Develop, delineate, and integrate thematic layers for potential groundwater recharge zones, (2) compare the performance of MIF, AHP, and FR, and (3) validate the resulted potential groundwater recharge zone maps with the receiver operating characteristic (ROC) curve and available water data.
2. Study Area
The Willochra Basin is a local-scale groundwater resource in the Southern Flinders Ranges, South Australia, which is described as a non-prescribed region under the South Australian Natural Resources Management Act 2004. The basin is situated about 250 km north of Adelaide. The topography of the basin contrasts significantly from 965 m at Mt Brown in the southwest to 70 m near Lake Torrens in the northwest. The basin is bounded on high topographic features such as Mt. Robert, Mt. Eyre, and Mt. Arden (
Figure 1). Many townships such as Melrose, Murray Town, Wilmington, and Quorn are distributed across the basin.
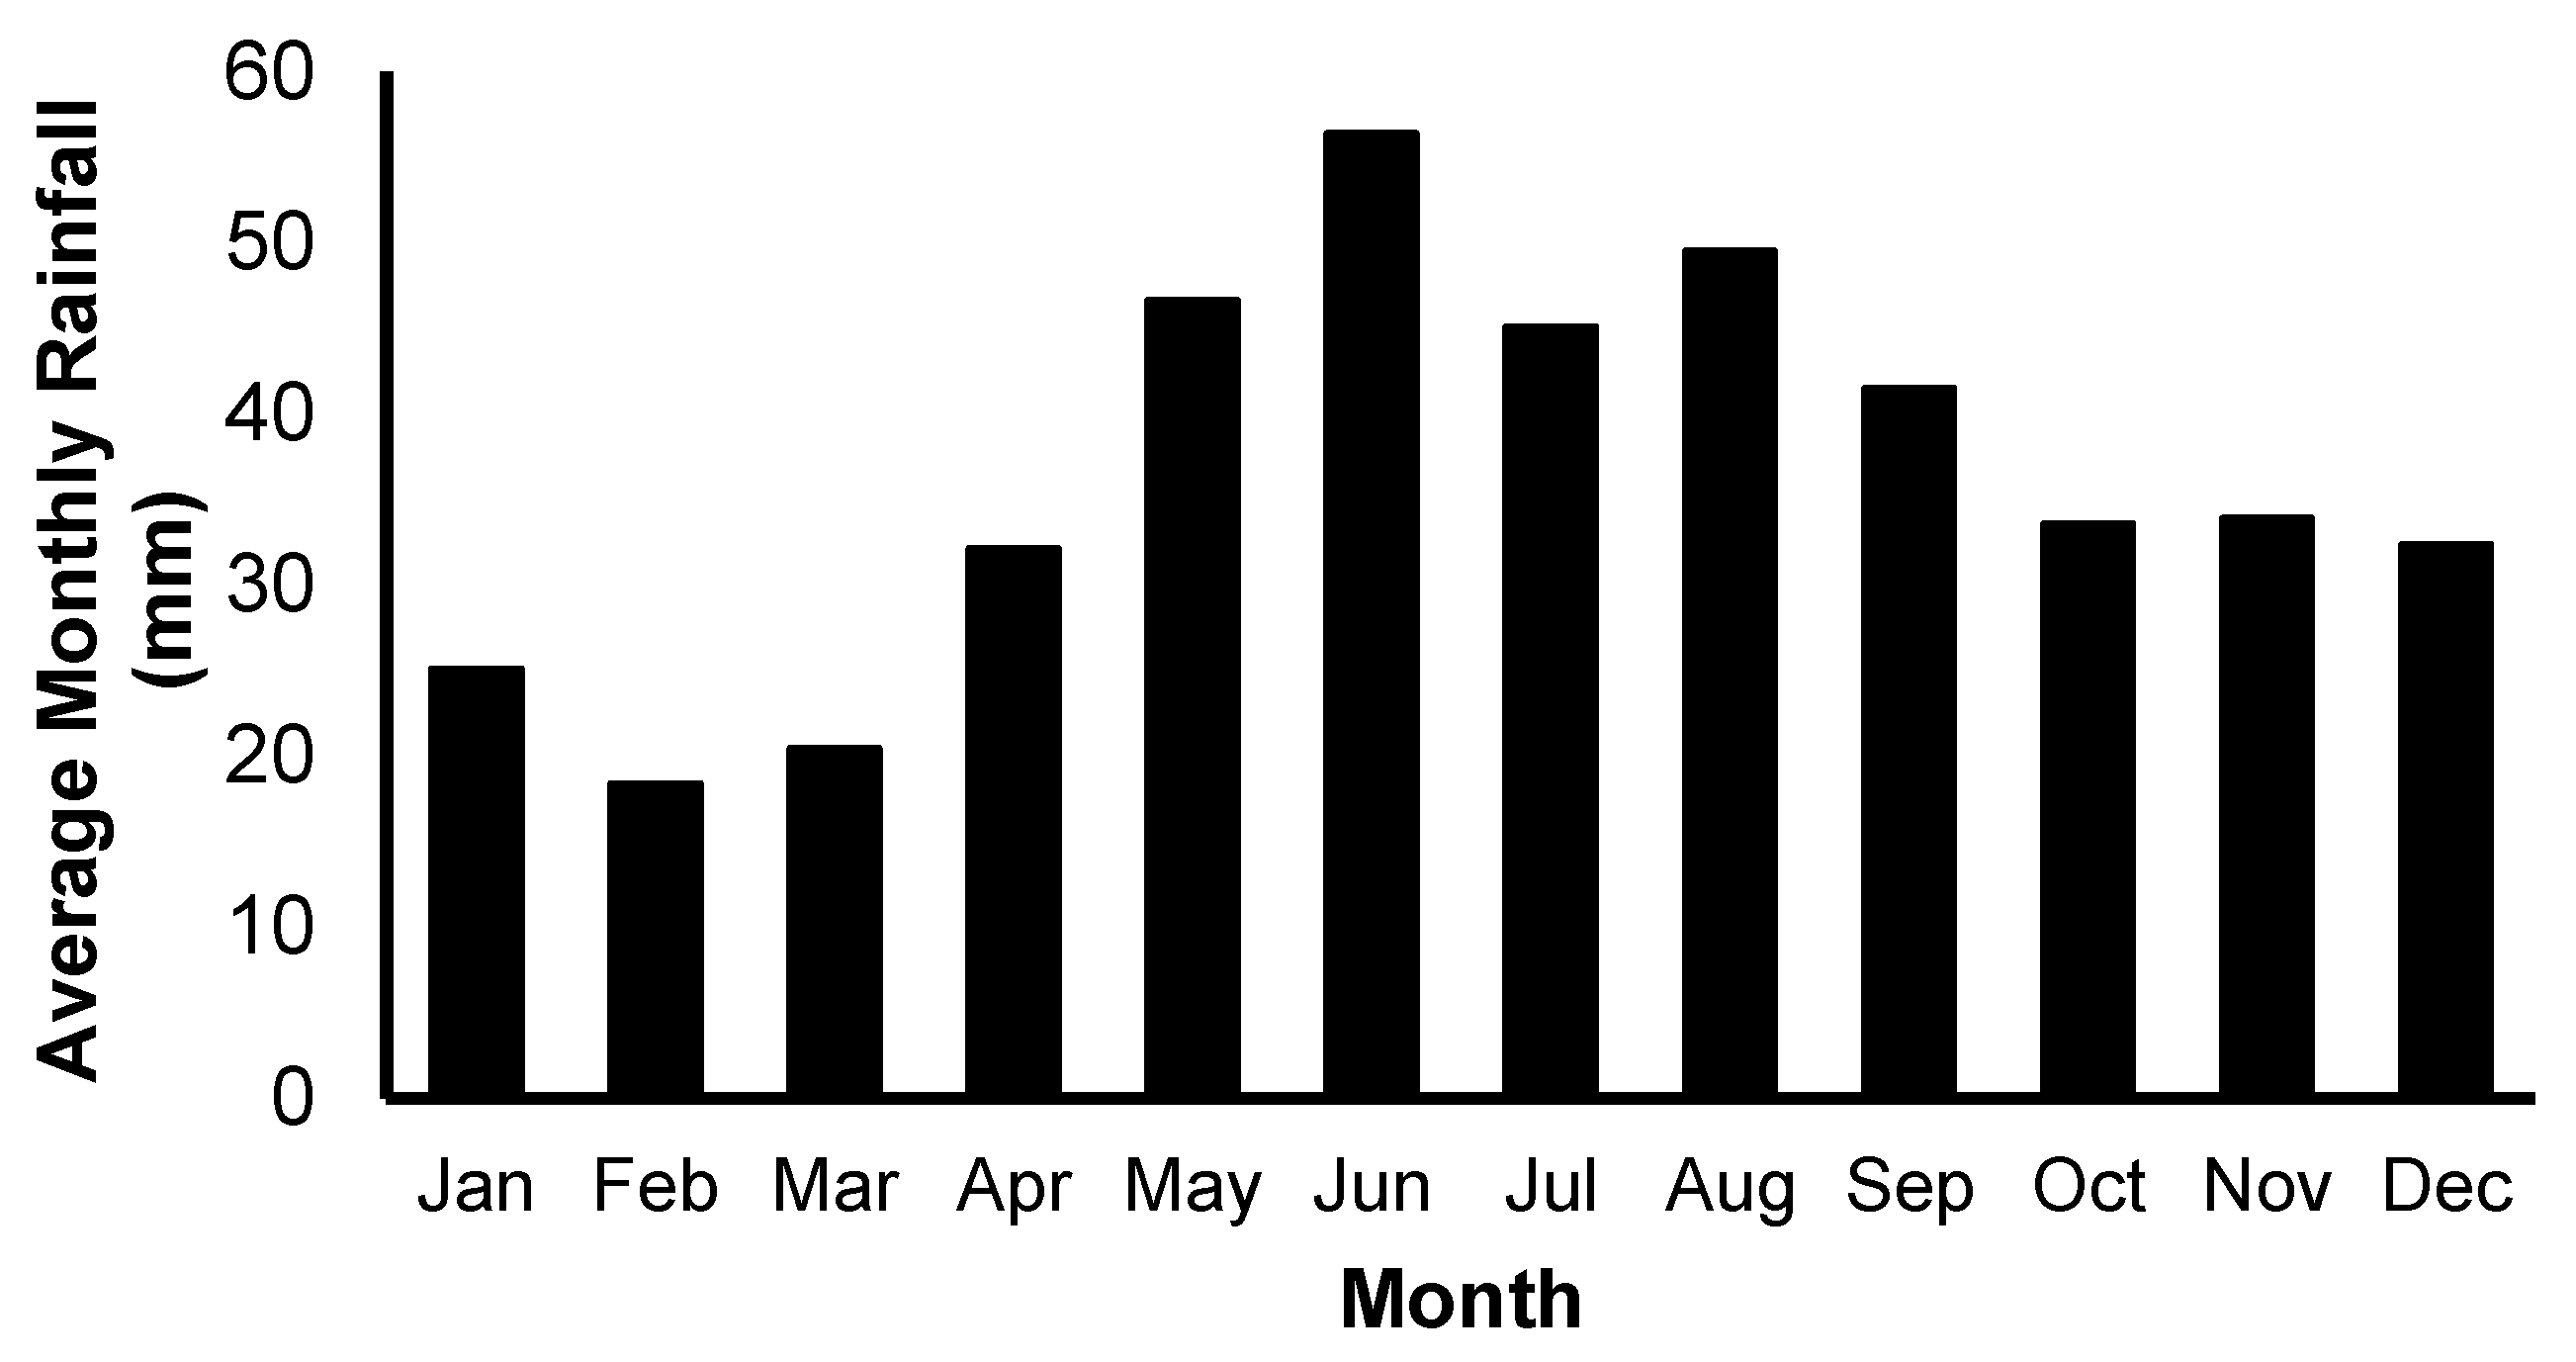
The climate of the study area is semi-arid with hot, dry summers, and cold, wet winters. The highest recorded rainfall (
Figure 2) is observed in June and July and August and September (winter and spring). The lowest rainfall values are recorded in January, February, and March (Summer and Autumn). According to Reference [
42], the average annual rainfall shows a significant increase from the southwestern areas (650 mm) to the northern areas (250 mm). In contrast, the potential annual evaporation varies from 2600 mm in the north to 2400 mm in the south of the basin.
3. Geology and Hydrogeology
The Willochra Basin is an intermountain (between ranges) basin located approximately 300 km north of Adelaide. The basin covers an area of 1165 km
2, being 80 km in length and has a maximum width of 25 km. Geologically, Willochra basin consists of a sediment-filled series of bedrock depressions between Murray town in the south and Mount Eyre in the north. It is stretching in a north–south orientation and bounding by late Proterozoic and Cambrian rocks of the Adelaide Geosyncline [
44]. The geosyncline consists of a thick sedimentary succession that extends as a continuous fold belt trending north–south, from Kangaroo Island in the south towards the north and north-east. It formed initially from undeformed sediments with a total thickness of over 12 km resulting from ongoing deposition in Neoproterozoic to lower Cambrian [
44]. The deposition followed by a continuous rifting during the Delamerian Orogeny [
45,
46]. As a result of the Delamerian Orogeny, a number of tectonic domains, included from north to south: North Flinders Zone, Central Flinders Zone, Nackara Arc, Fleurieu Arc, and the Torrens Hinge Zone, were formed [
44]. Each of these domains has their own particular deformation history, tectonic styles, and stratigraphy.
Within the basin, the Cainozoic sediments overlie the Delamerian Fold Thrust Belt, a north–south arcuate tectonogene formed during a major Cambro-Ordovician Orogeny [
47]. The geologic succession consists of Cambrian limestone and Pound Quartzites, spreading downwards to Sturtian Tillite and Torrensian slates [
48]. On the western fringes of the basin, the outcropped rocks are dominated by the hard rocks of the Ryanie Sandstone, Angepina Formation, Wilmington Formation, and ABC Range Quartzite. To the east, rock types become more fine and are dominated by the Saddleworth Formation, Auburn Dolomite, Appila Tillite, Tarcowie Siltstone, Tapley Hill Formation, Brachina Formation, and Cradock Quartzite [
44].
The major structural features encountered in the study area are E–NE and N–NW trending folding, and the linear structural features associated with it [
48,
49,
50]. The heterogeneity of the bedrock, and/or regional tectonic, structural and stress variations suggests that there may be a local variation in lineament orientations, length and density, throughout the study area [
49,
50,
51].
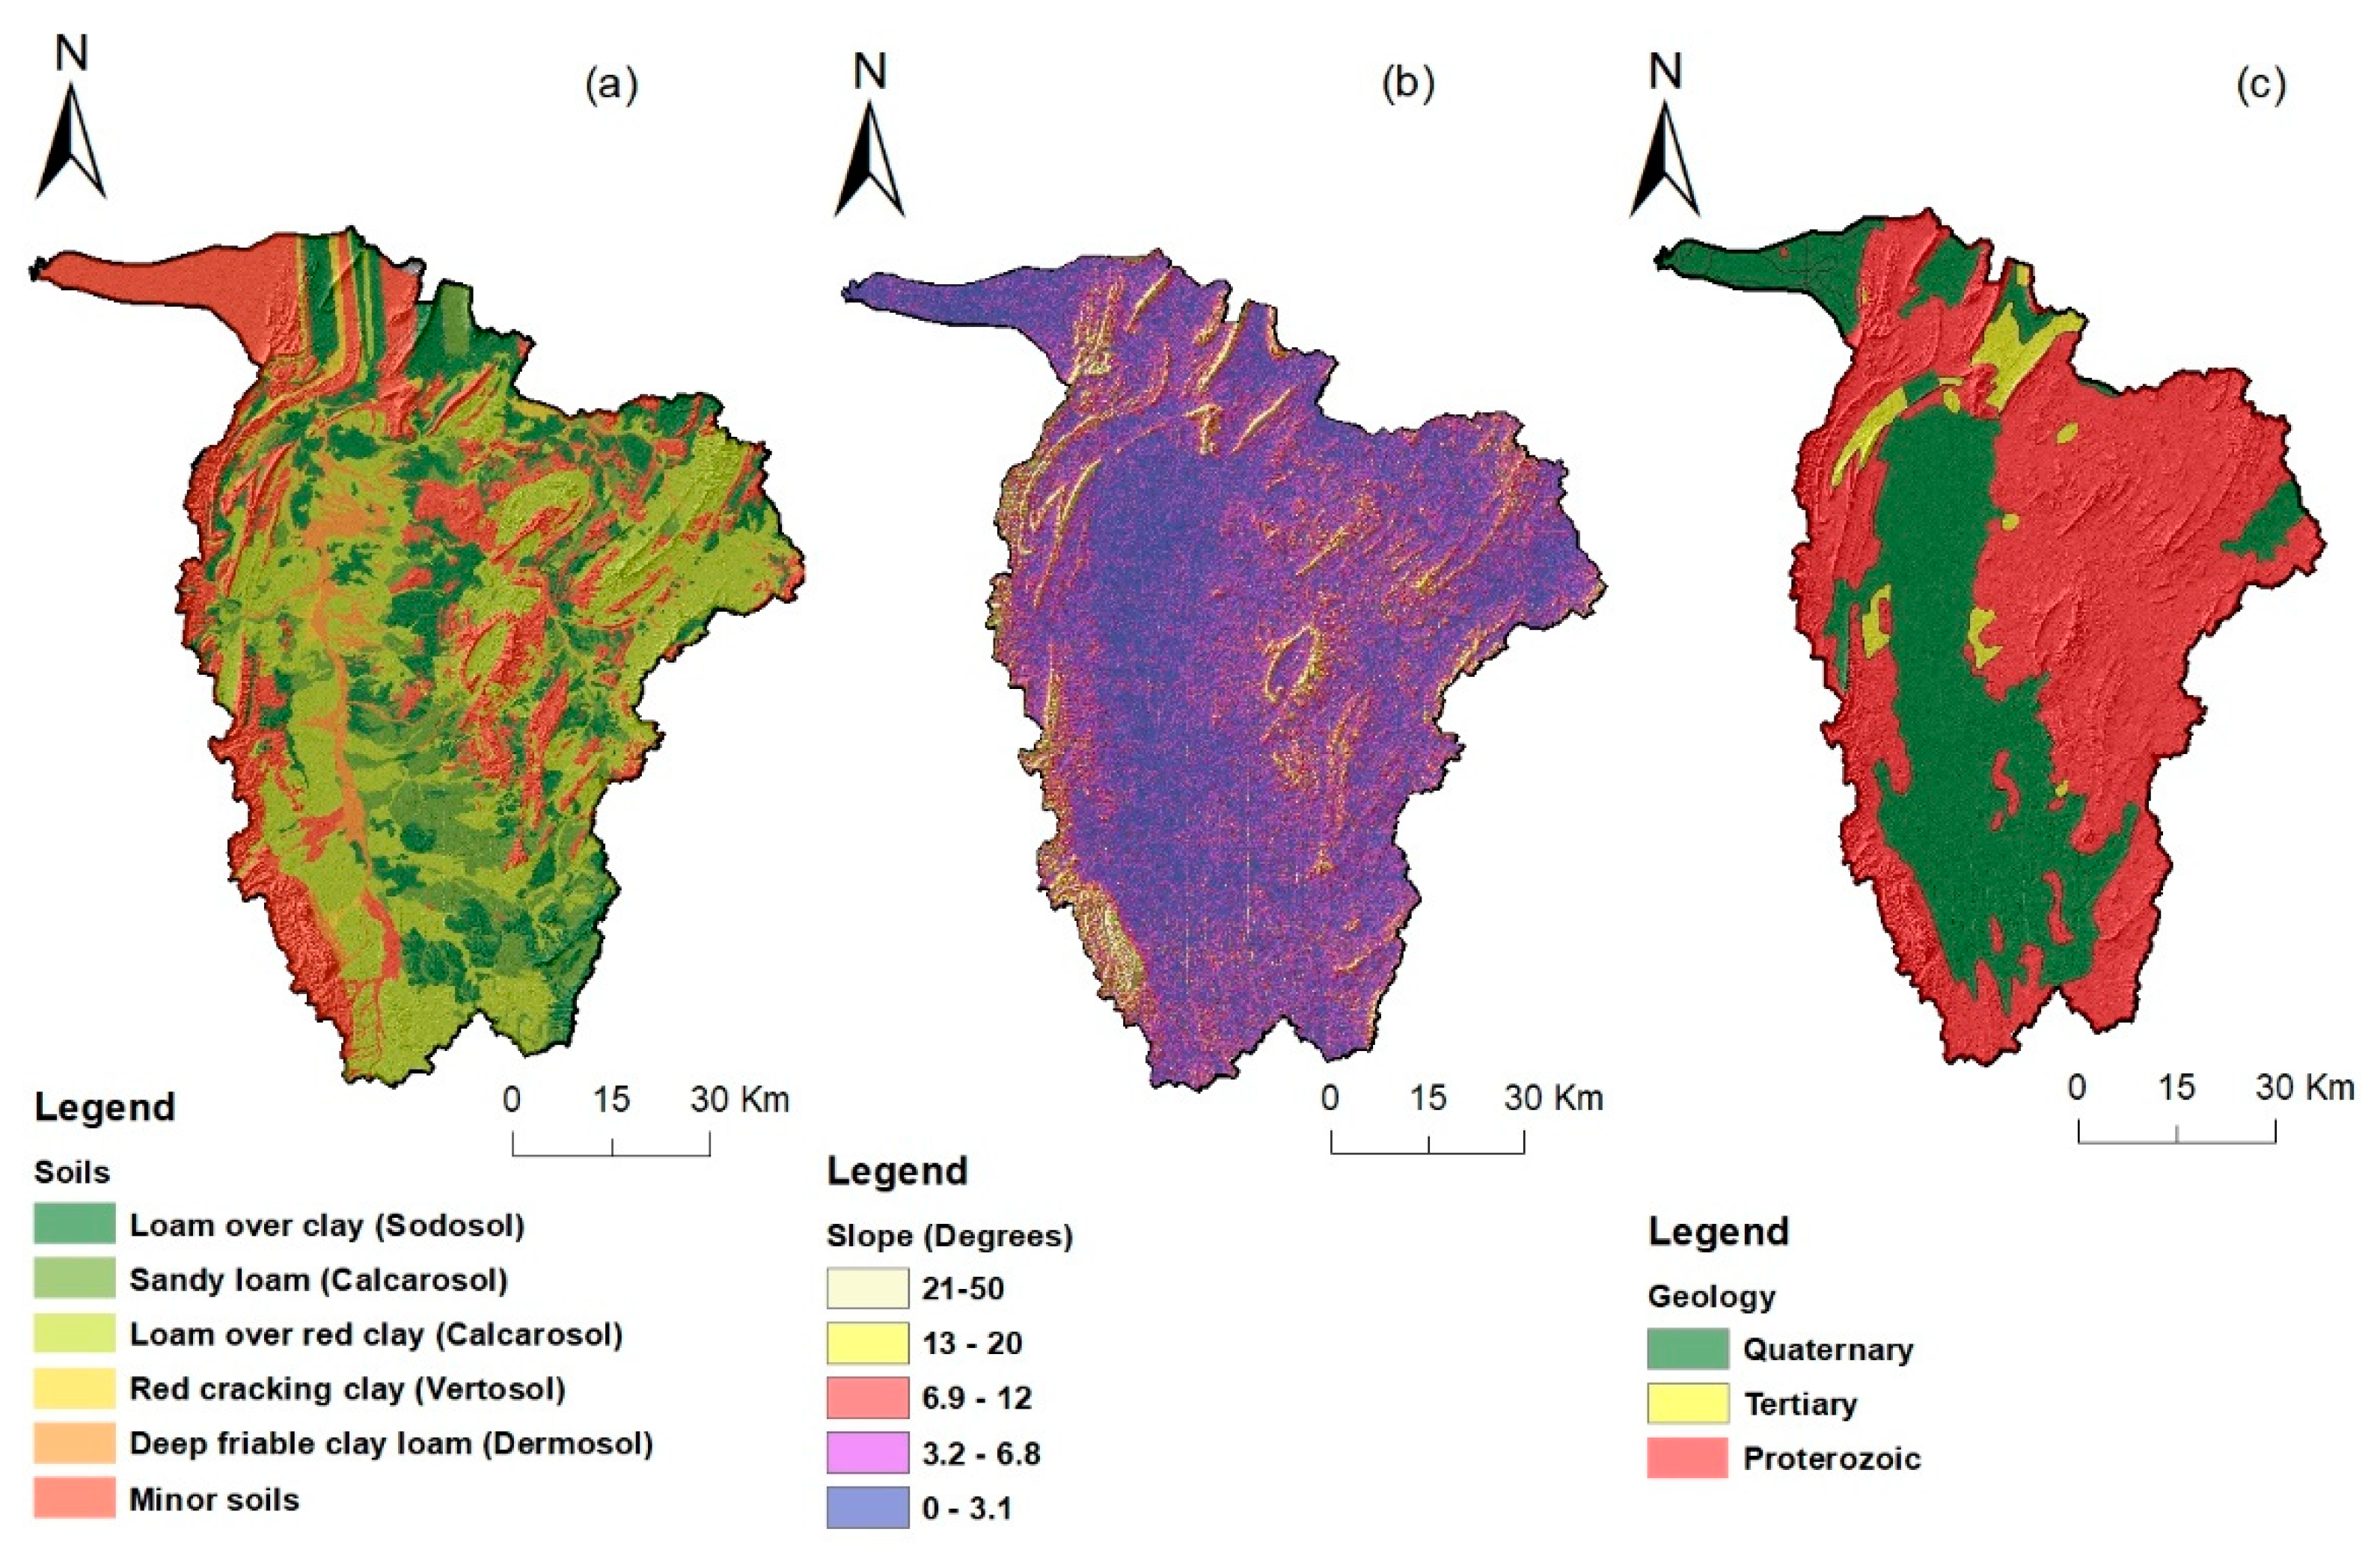
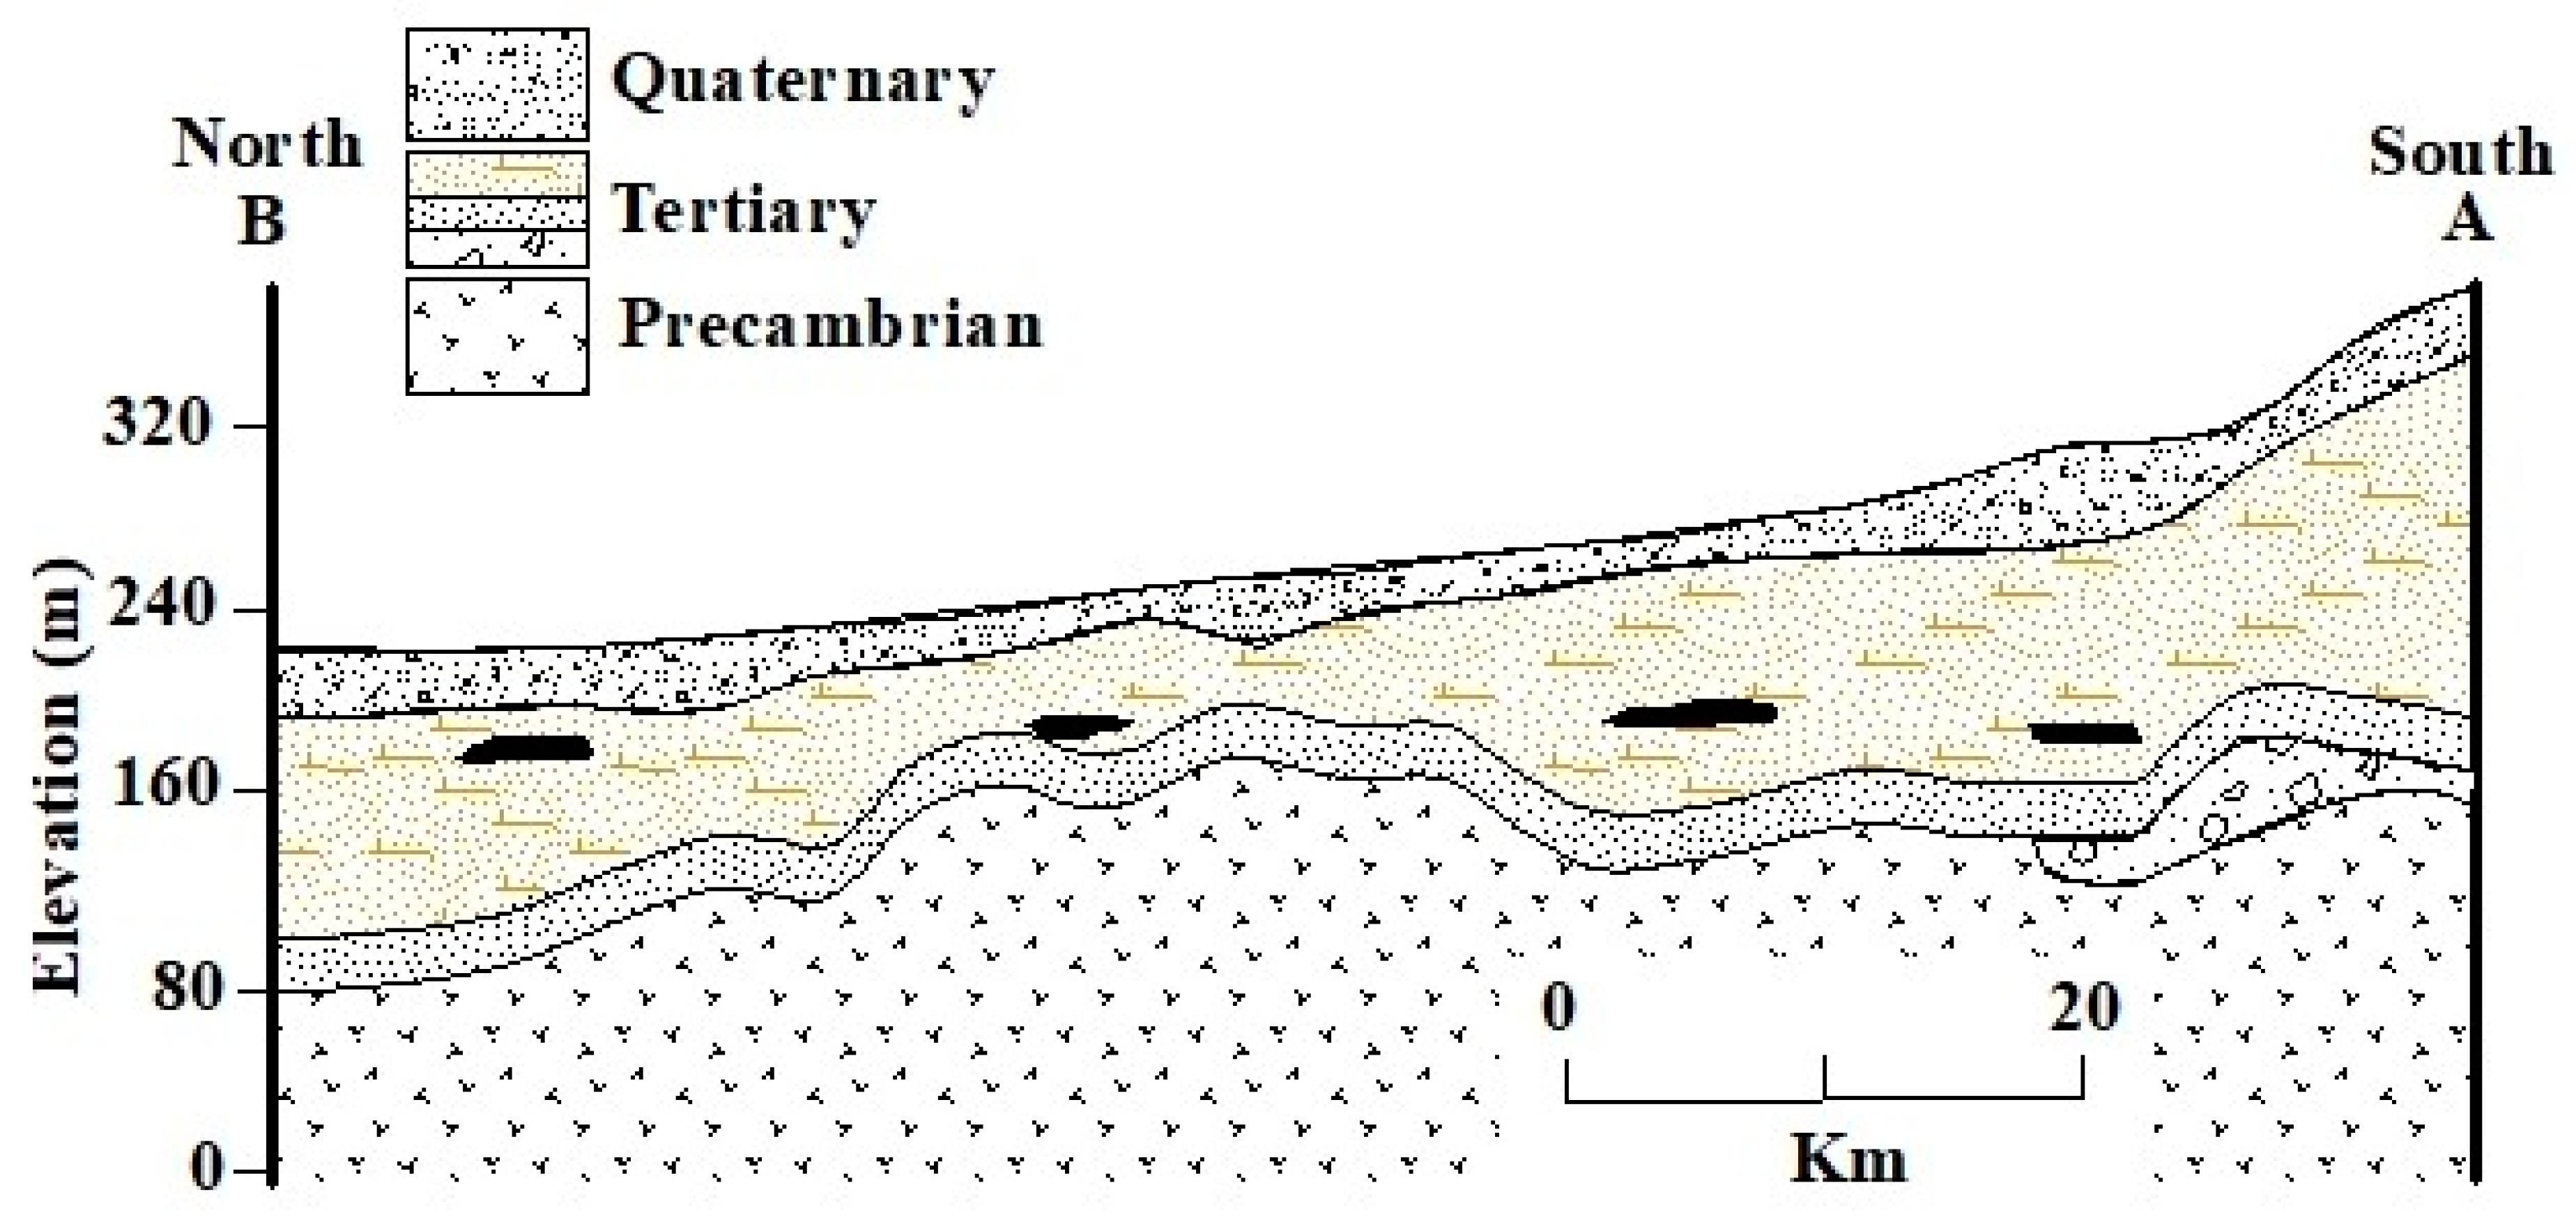
Hydrogeologically, three major aquifers are dominant (
Figure 3): (1) The Quaternary sediments consist mainly of interbedded clays, sand, and gravel beds, particularly near drainage lines, and form unconfined aquifer that indirectly recharge the deep Tertiary confined aquifer [
48]. The maximum thickness of Quaternary sediments is estimated at 90 m. Salinity of the aquifer is variable throughout the basin, signifying that local recharge and flow influences are important. Recharge is mainly from the south and south-west and from runoff of creeks and upward leakage from the underlying Tertiary aquifer, particularly in the north [
48]. All over the basin, the Quaternary aquifer provides stock quality groundwater, with small areas having groundwater of suitable quality for irrigation. The best water quality is found to be in the vicinity of creeks where salinities are as low as 400 mg/L [
42].
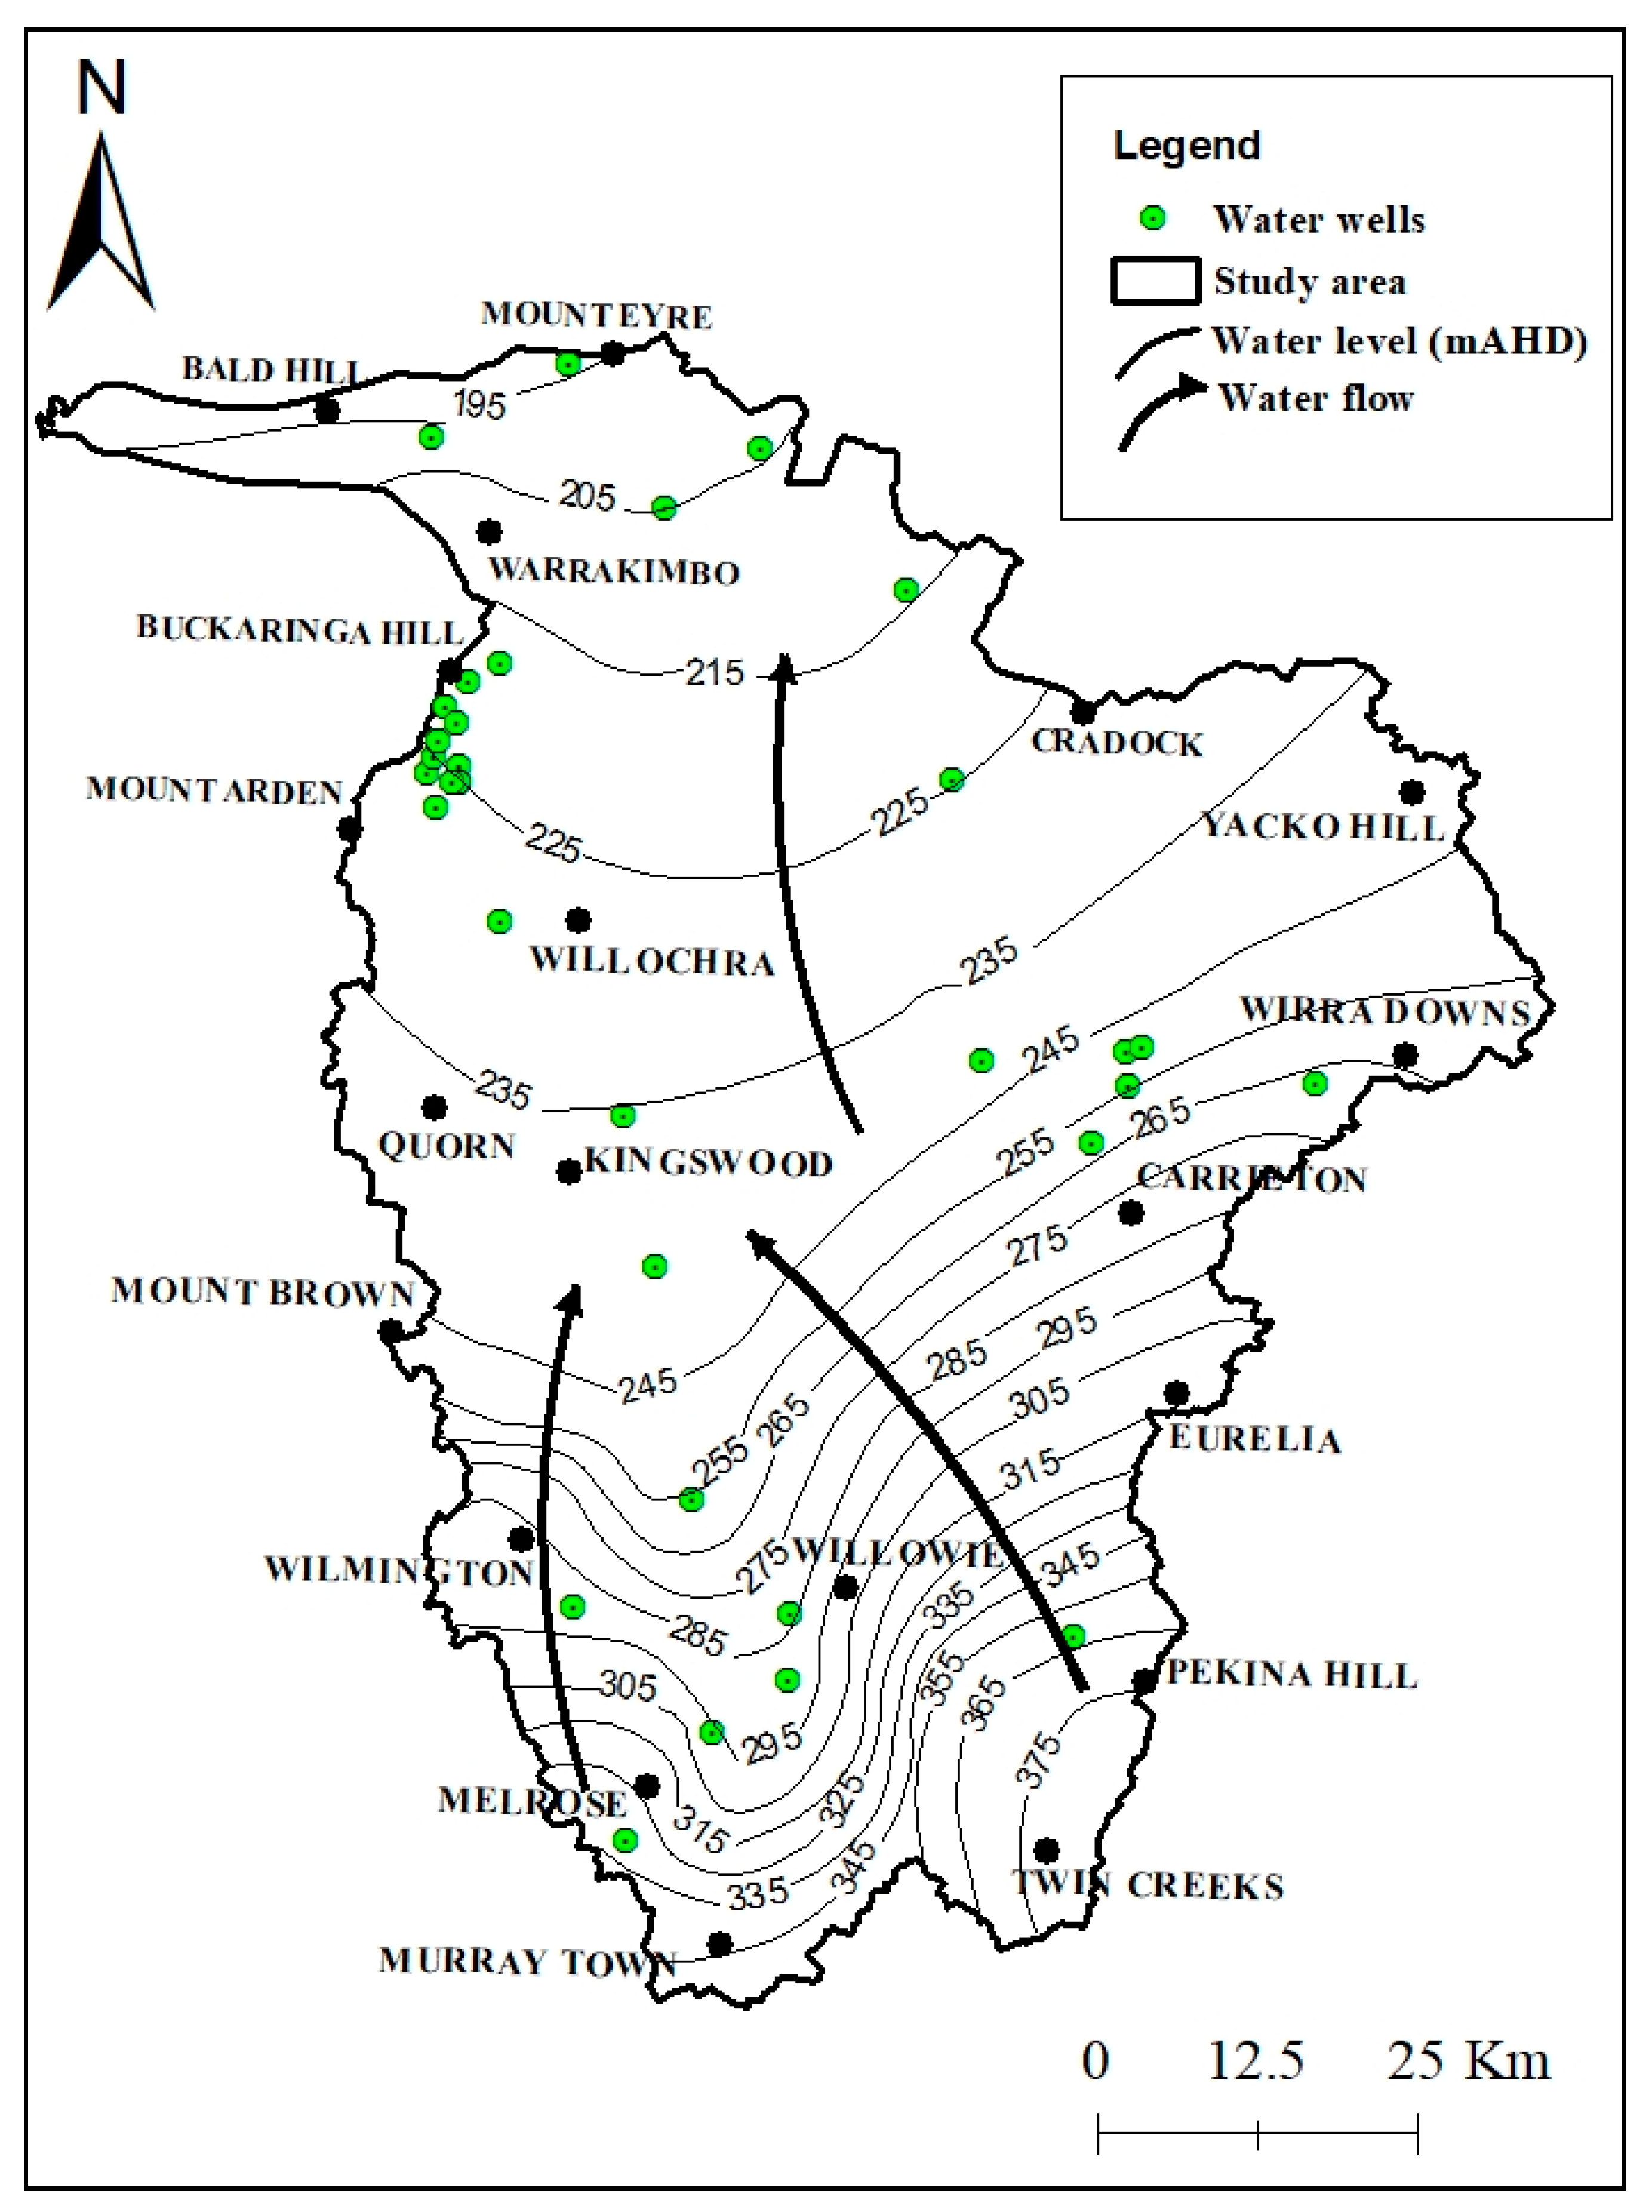
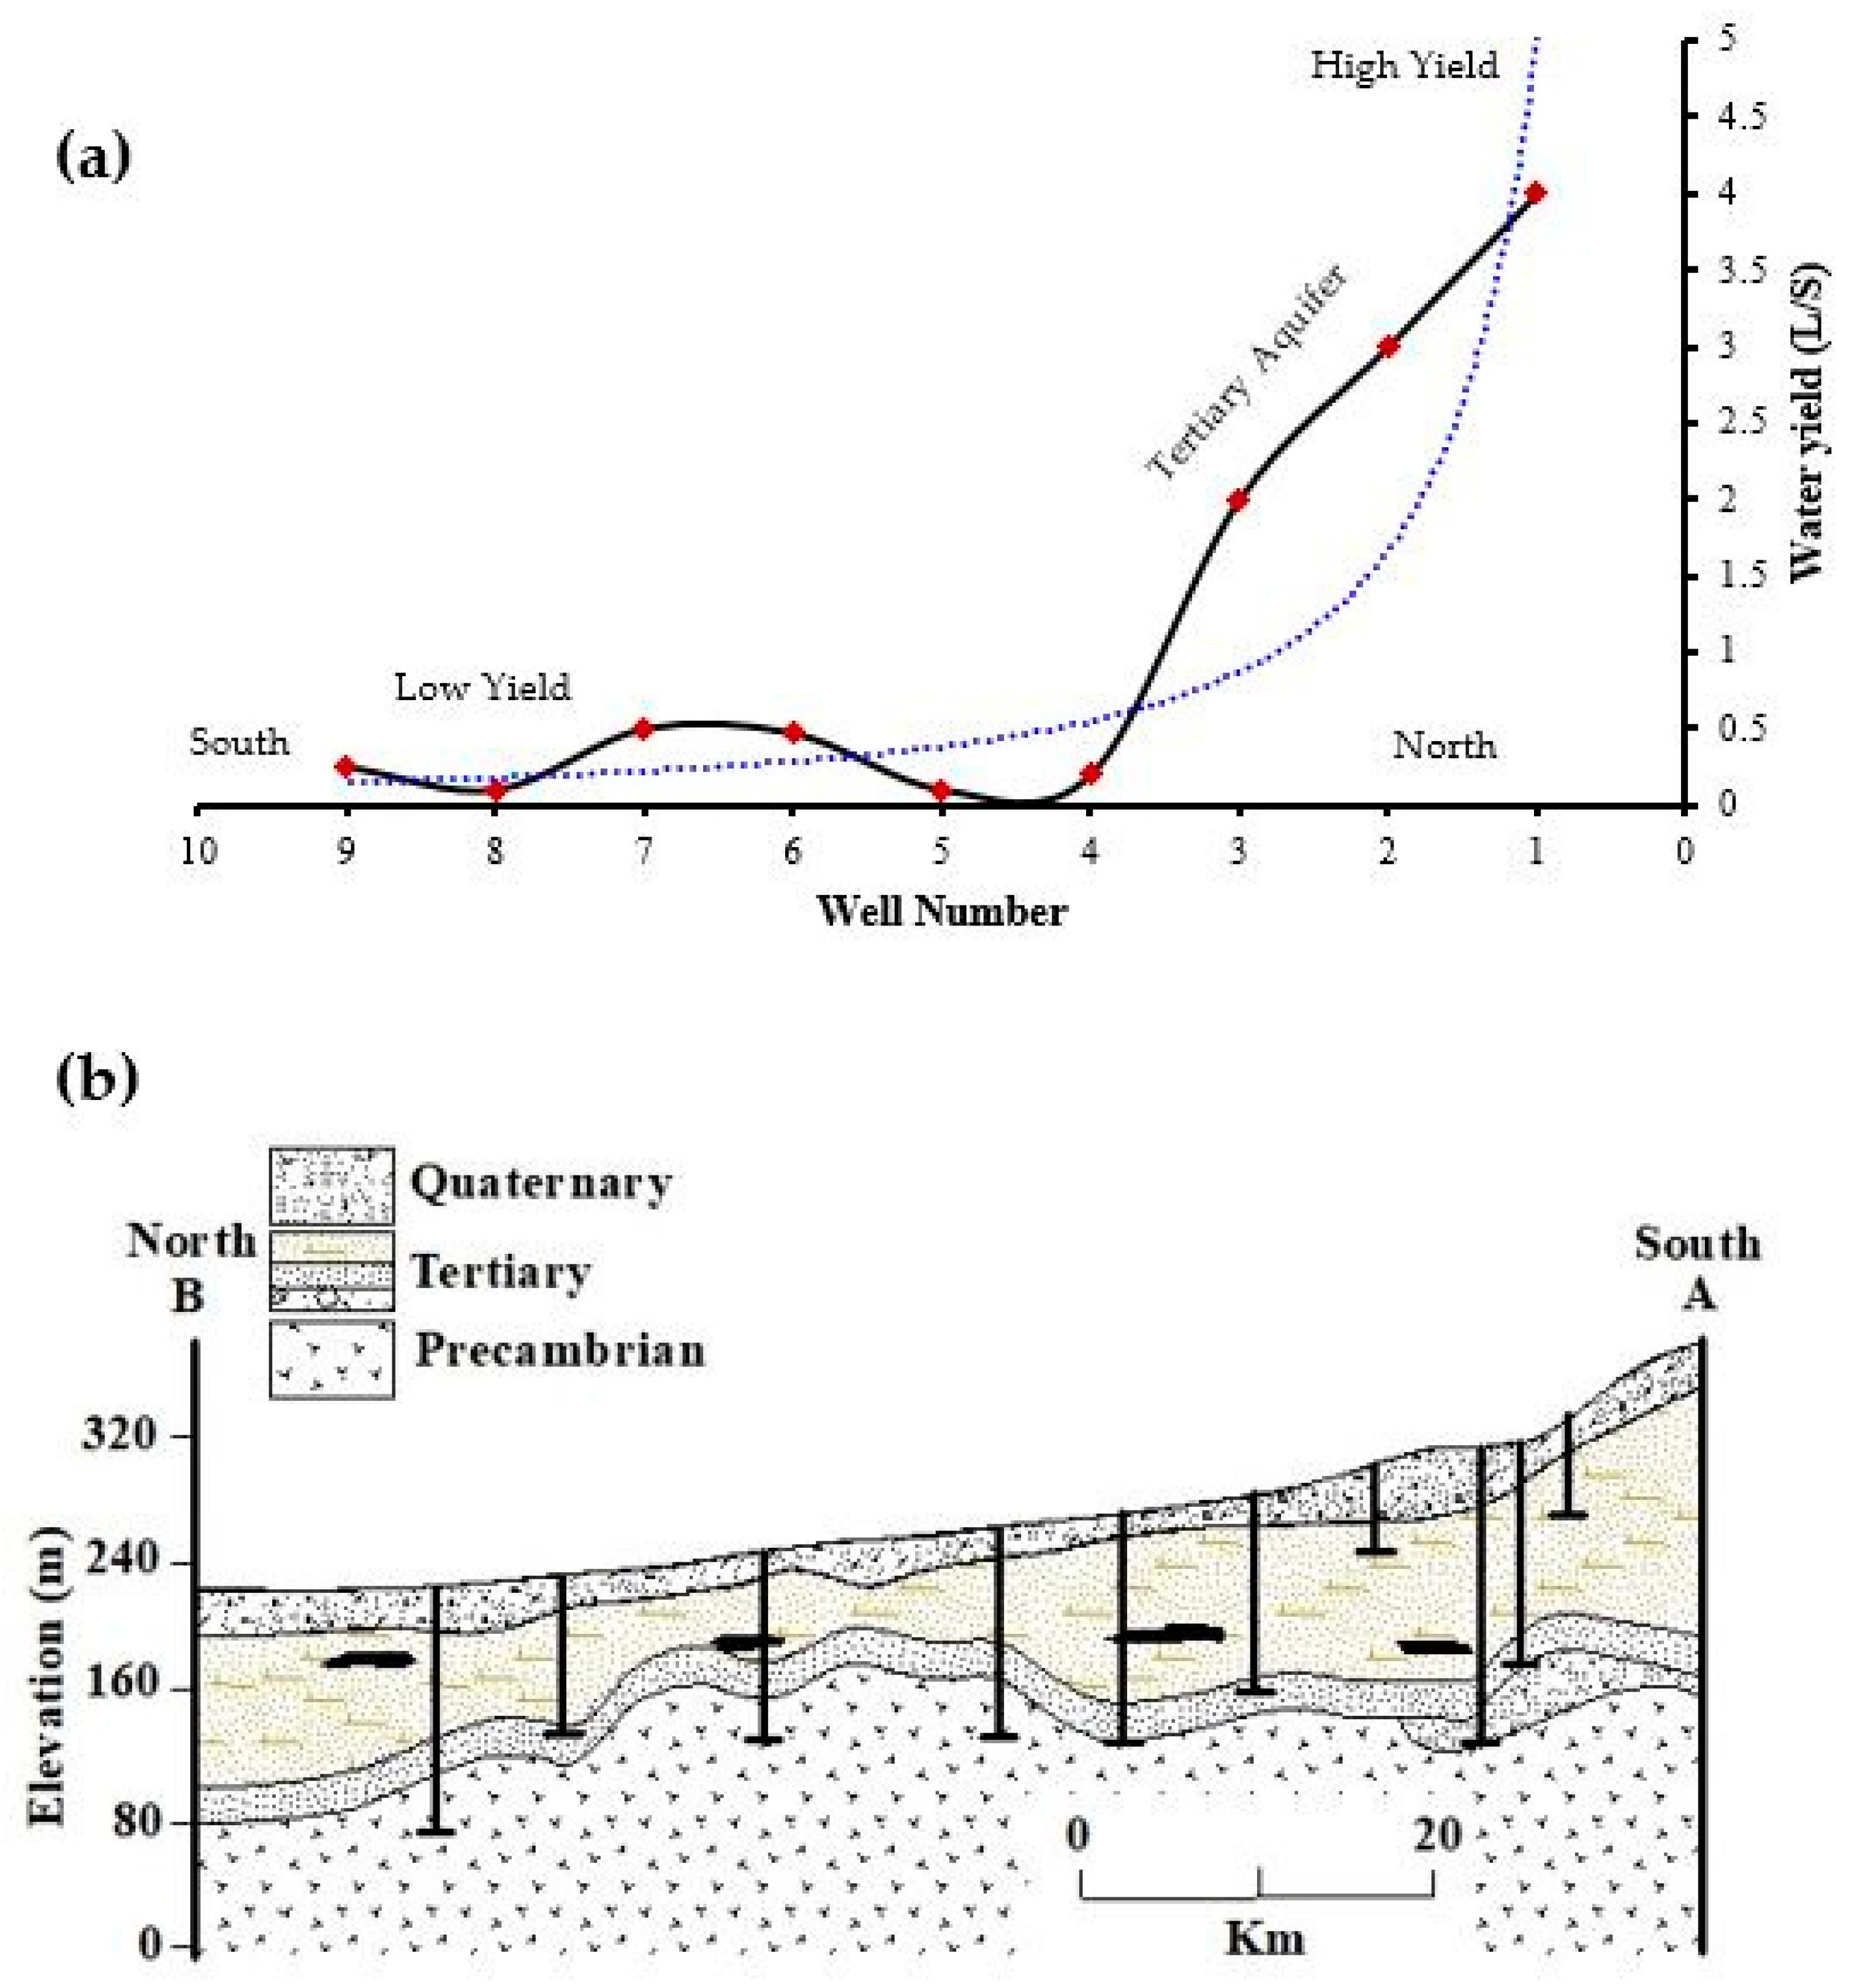
(2) Tertiary rocks are continuously outcropped over the basin, resulting in a confined aquifer with relatively fine-grained sand beds and maximum thickness ranging from 15 m in the south to 6 m in the north [
42]. Groundwater flow in the Tertiary confined aquifer is mainly from the recharge areas in the south toward the north [
42,
52]. The aquifer is recharged by direct infiltration through outcrops in the high topographic ranges (
Figure 4). This is supported by low salinity in areas proximity to these ranges. The water salinity is less than 1400 mg/L in the south, increasing gradually across the basin to greater than 7000 mg/L in the north.
(3) Fractured rocks are directly covered by Tertiary Sediments, indicating a direct hydraulic connection [
42]. The water yield and volume of groundwater stored in the fractured rocks is unknown and was not given considerable attention. In addition, no recent investigation has been done to estimate sustainable yield of these aquifers.
6. Conclusions
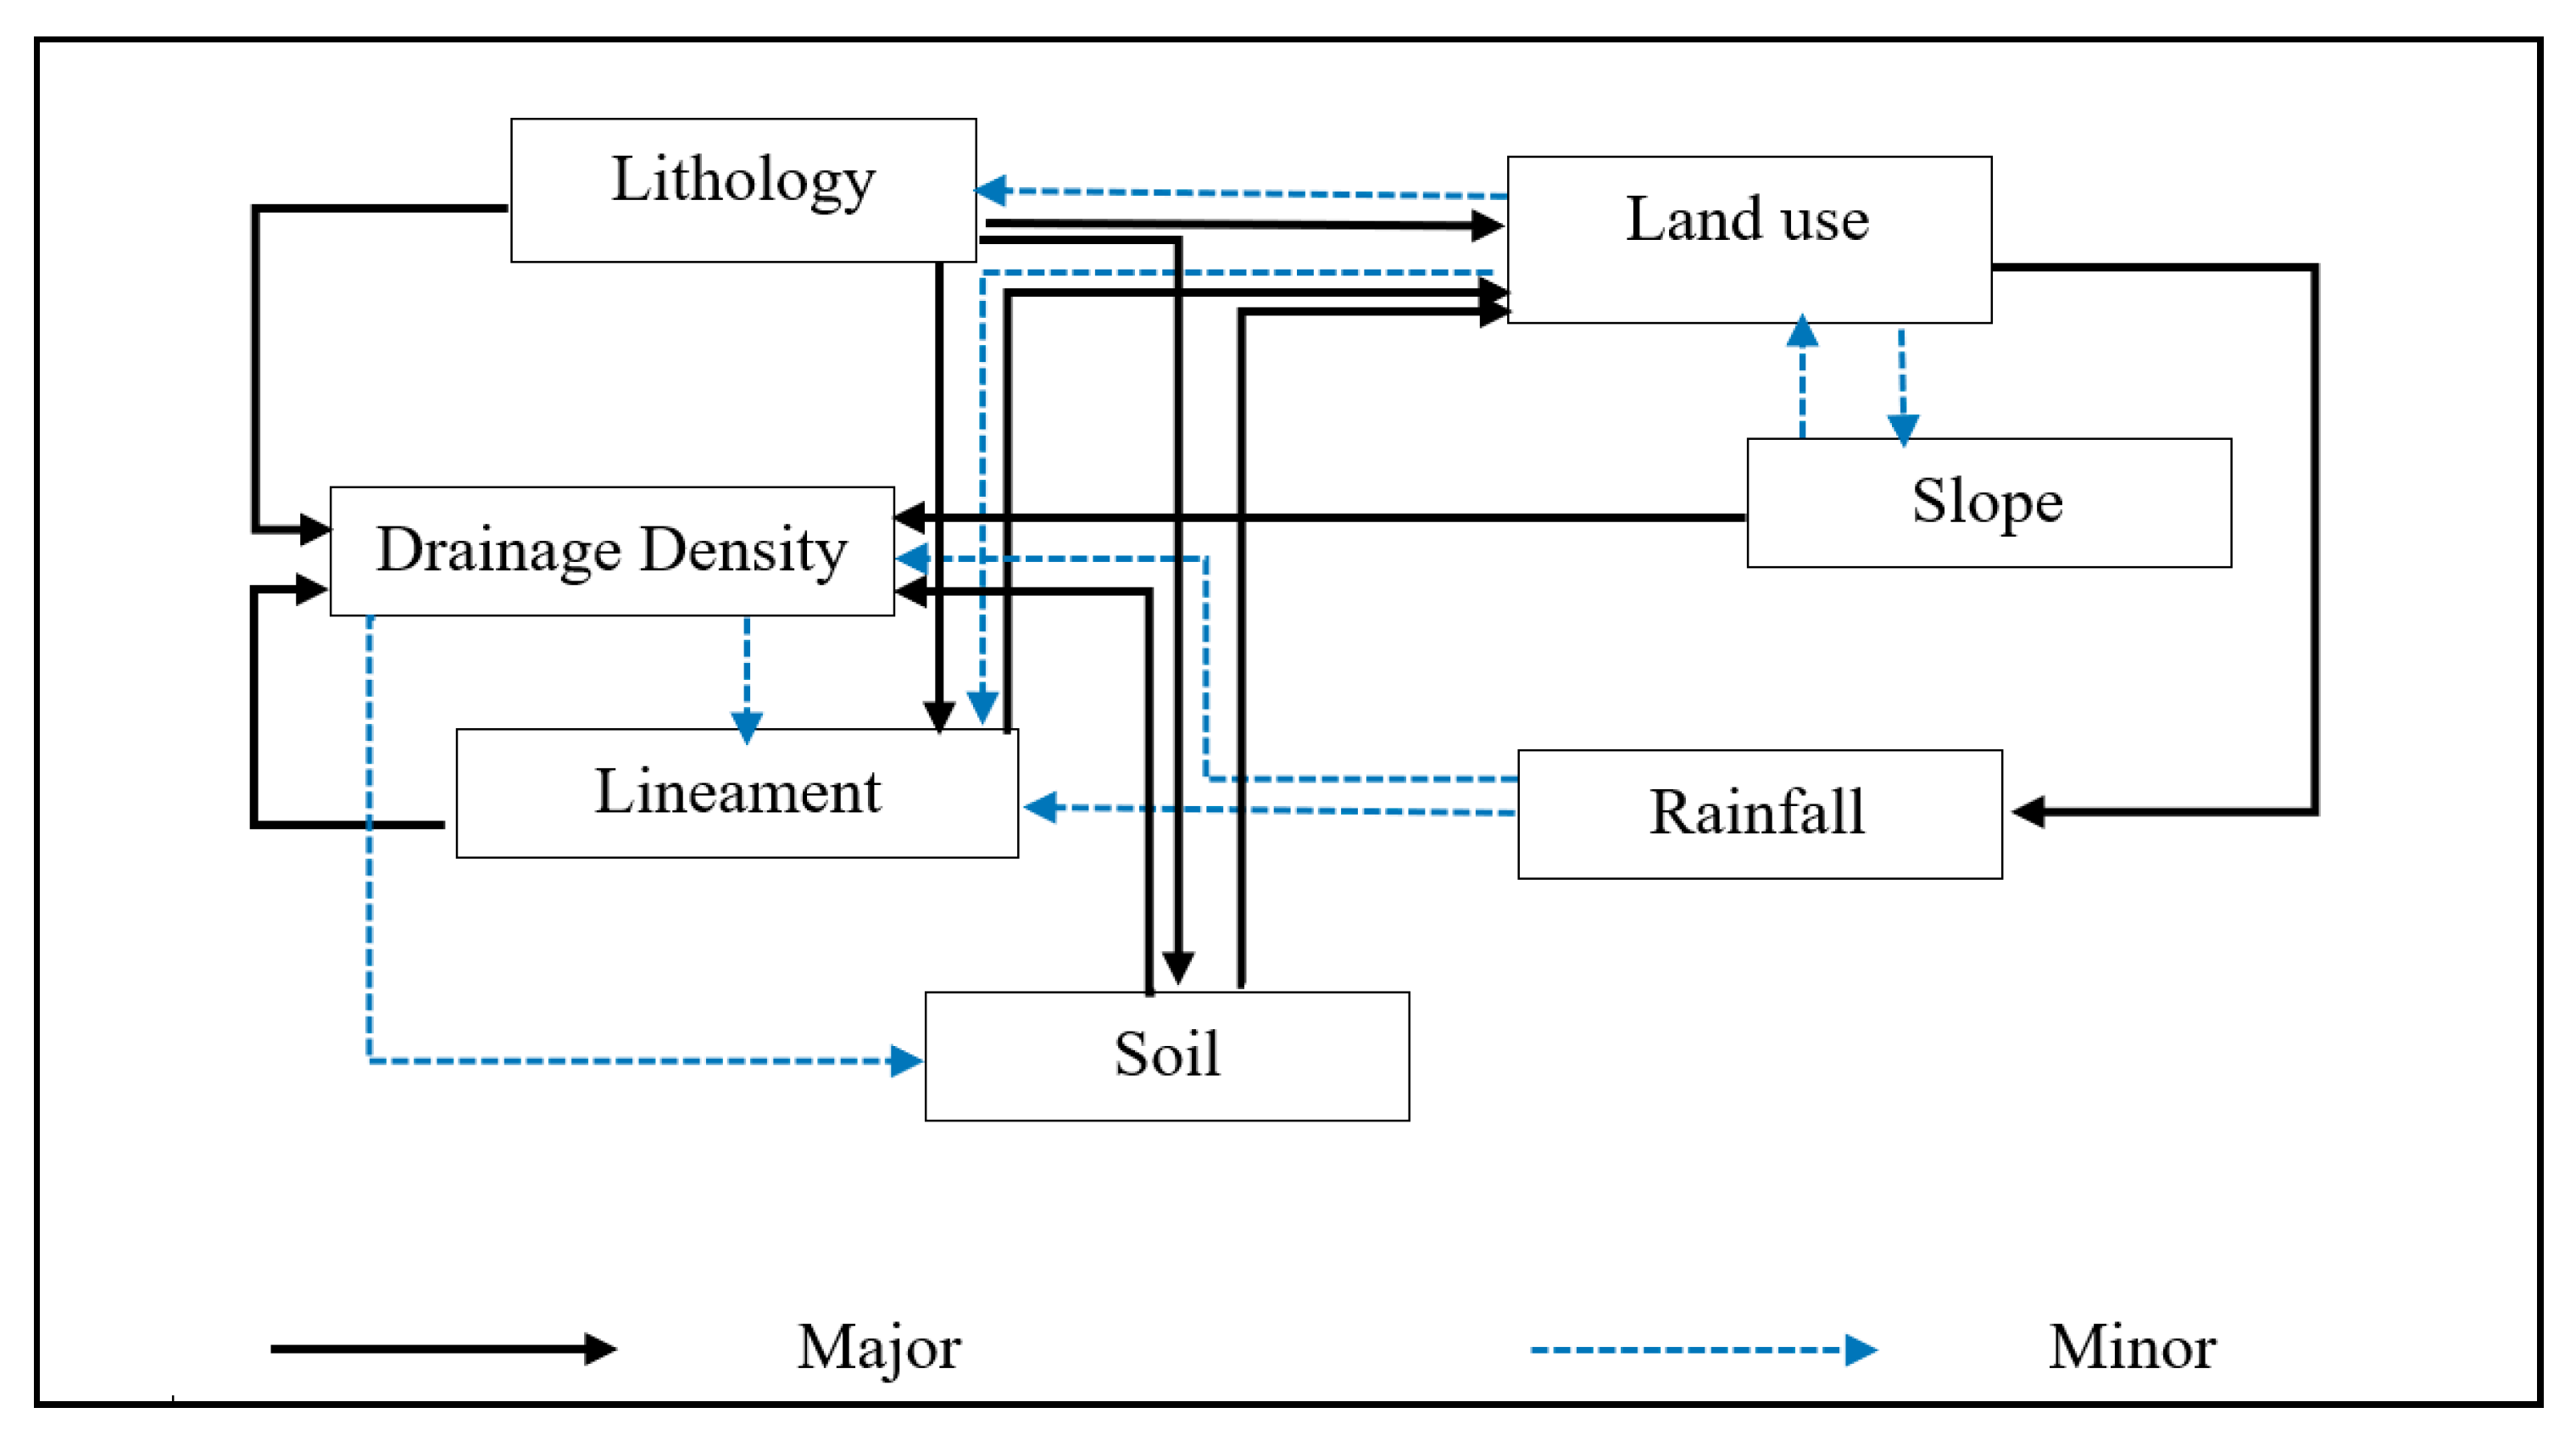
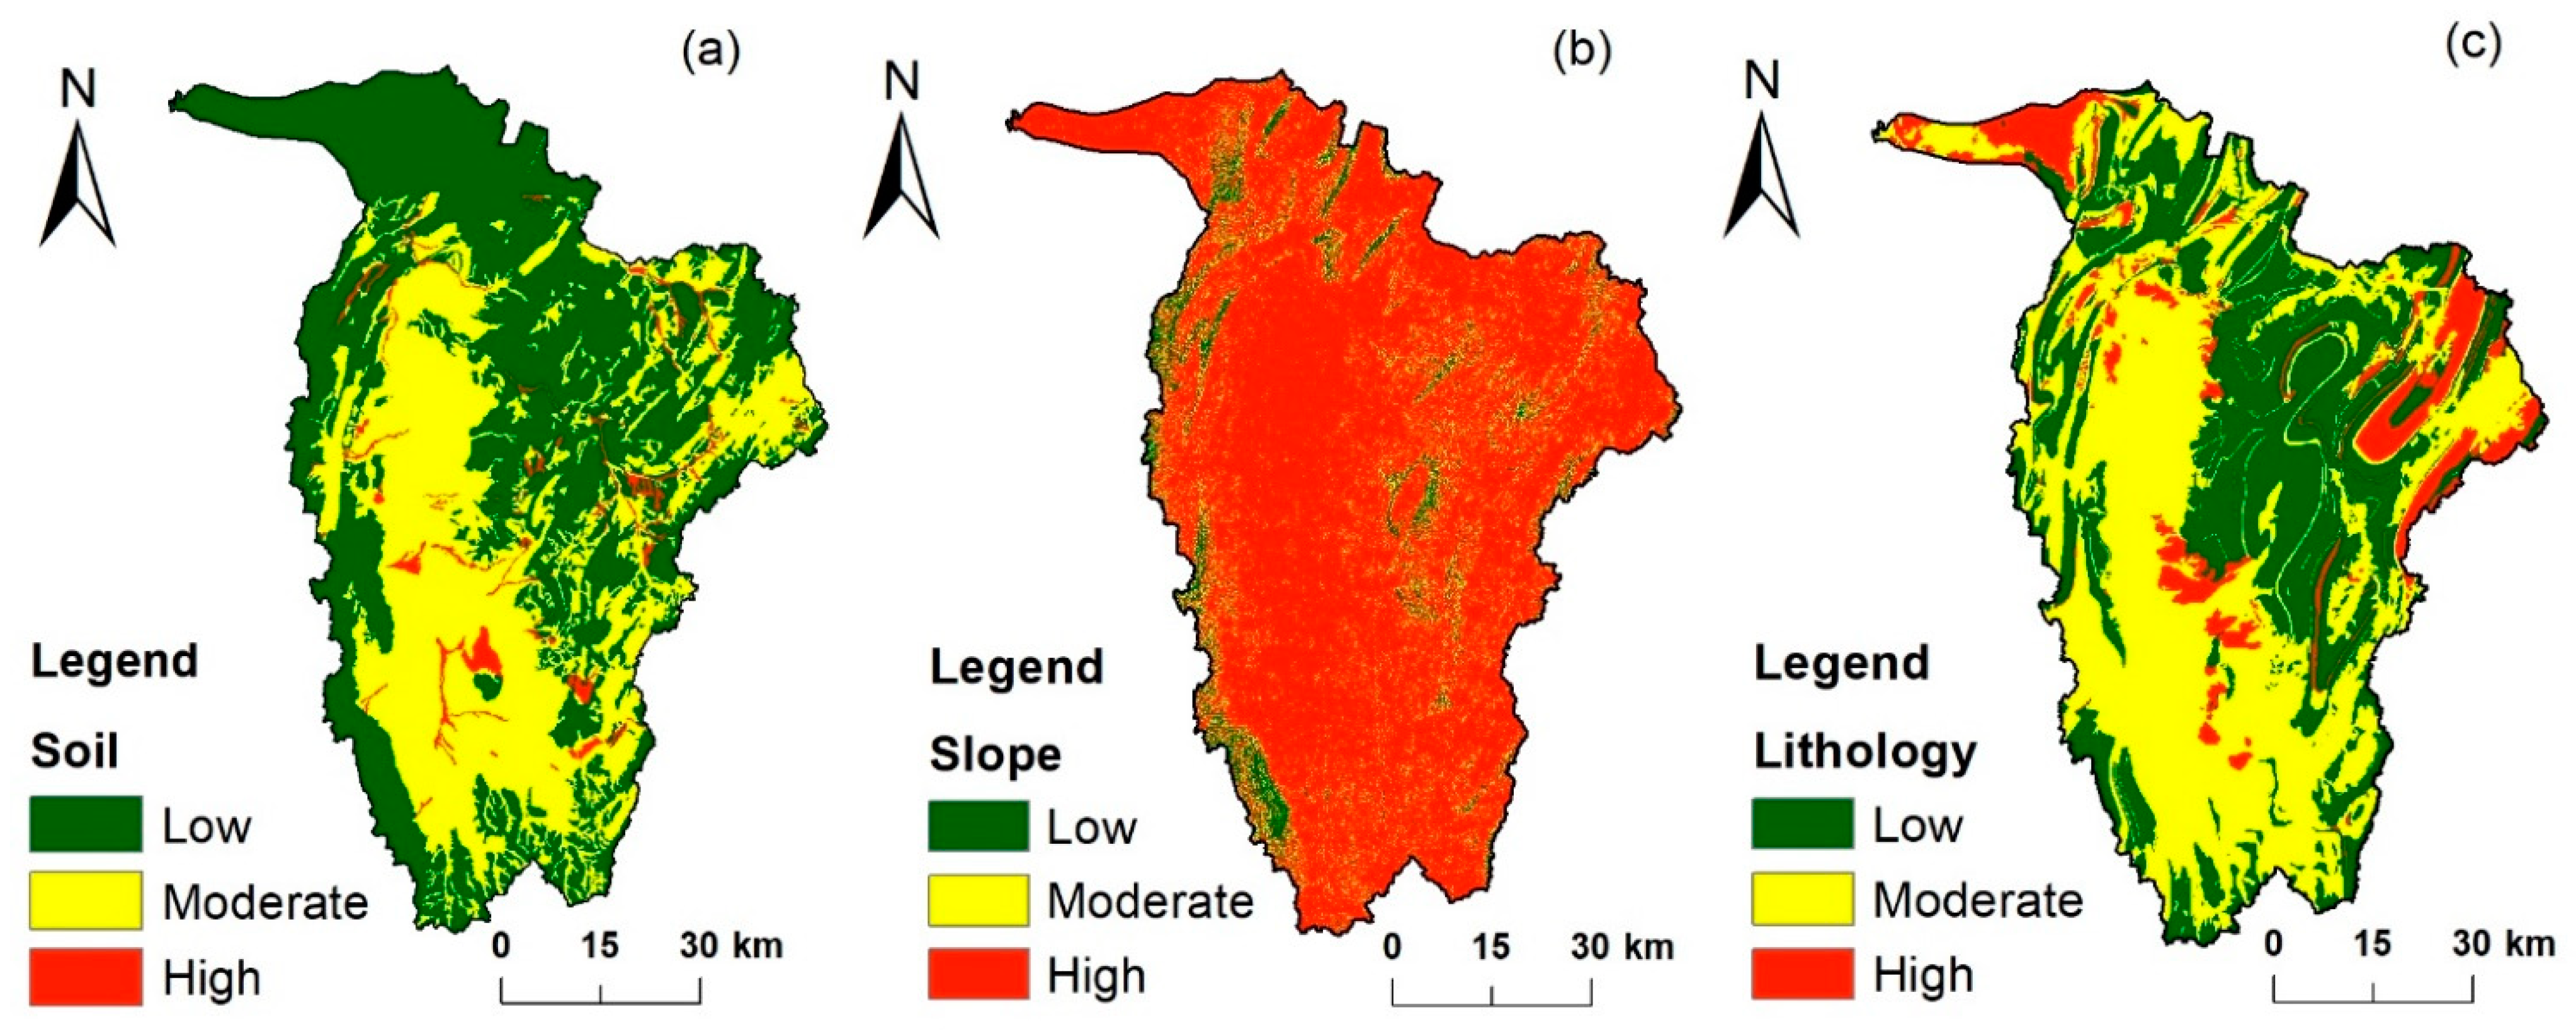
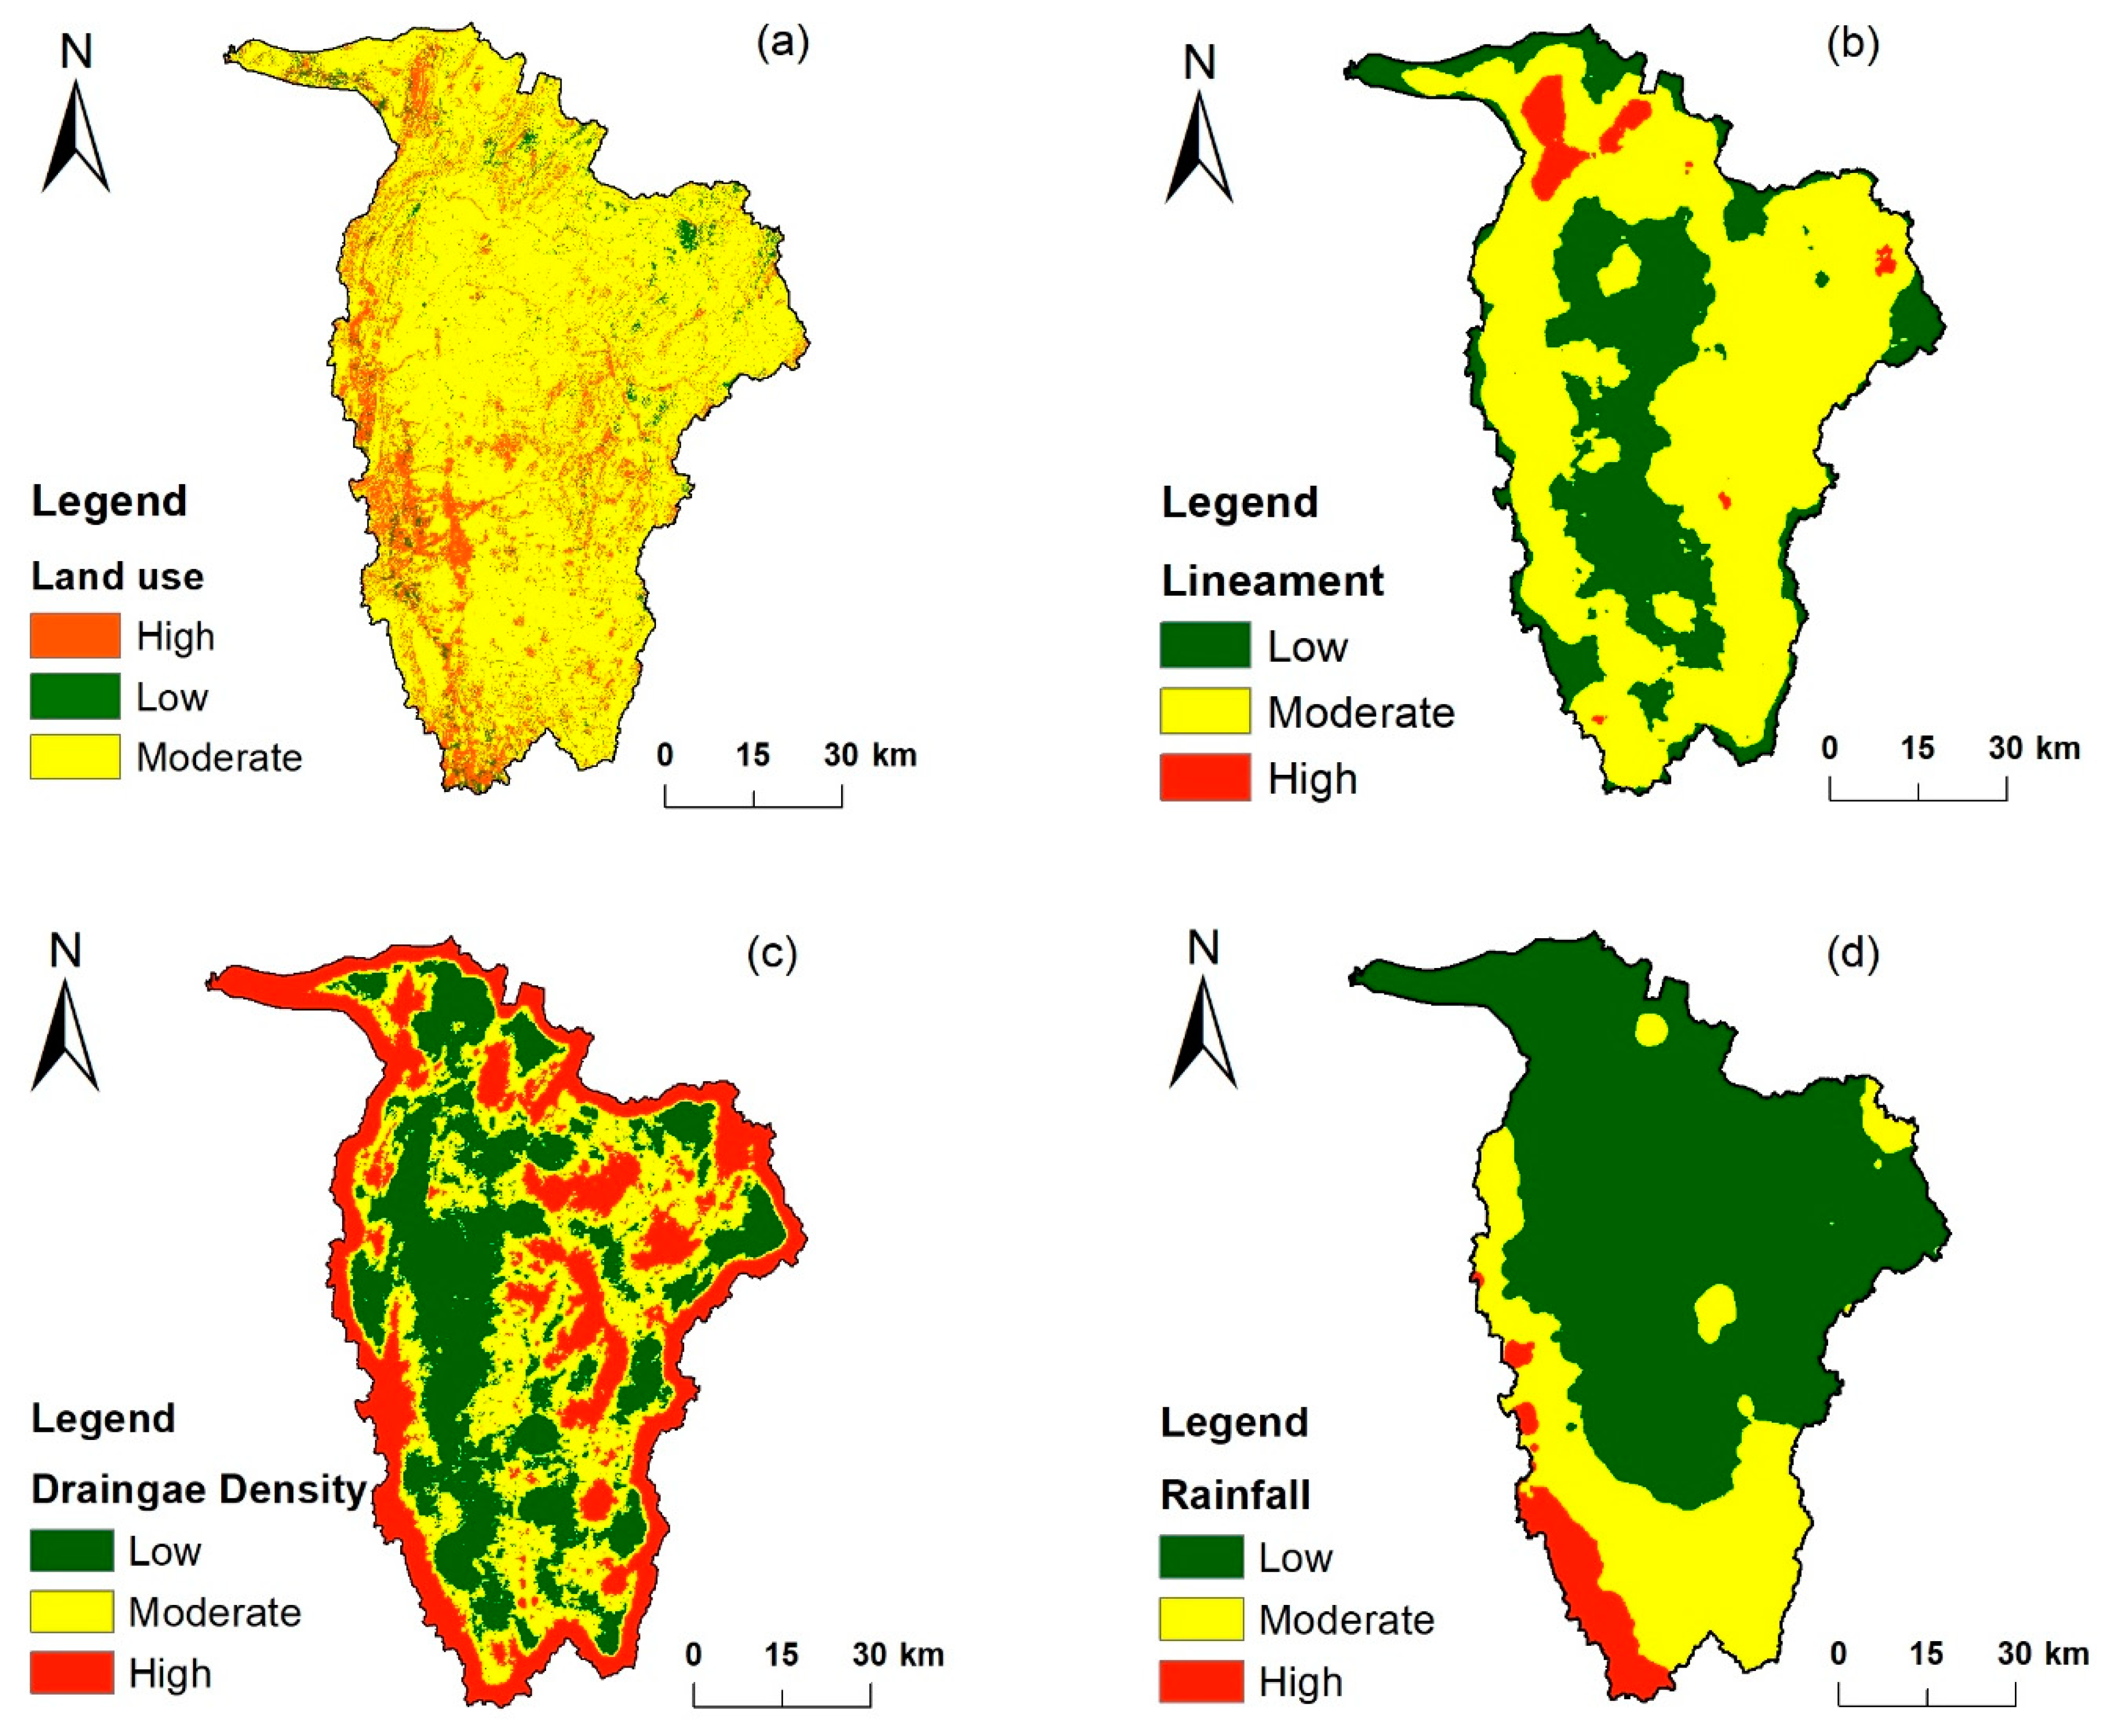
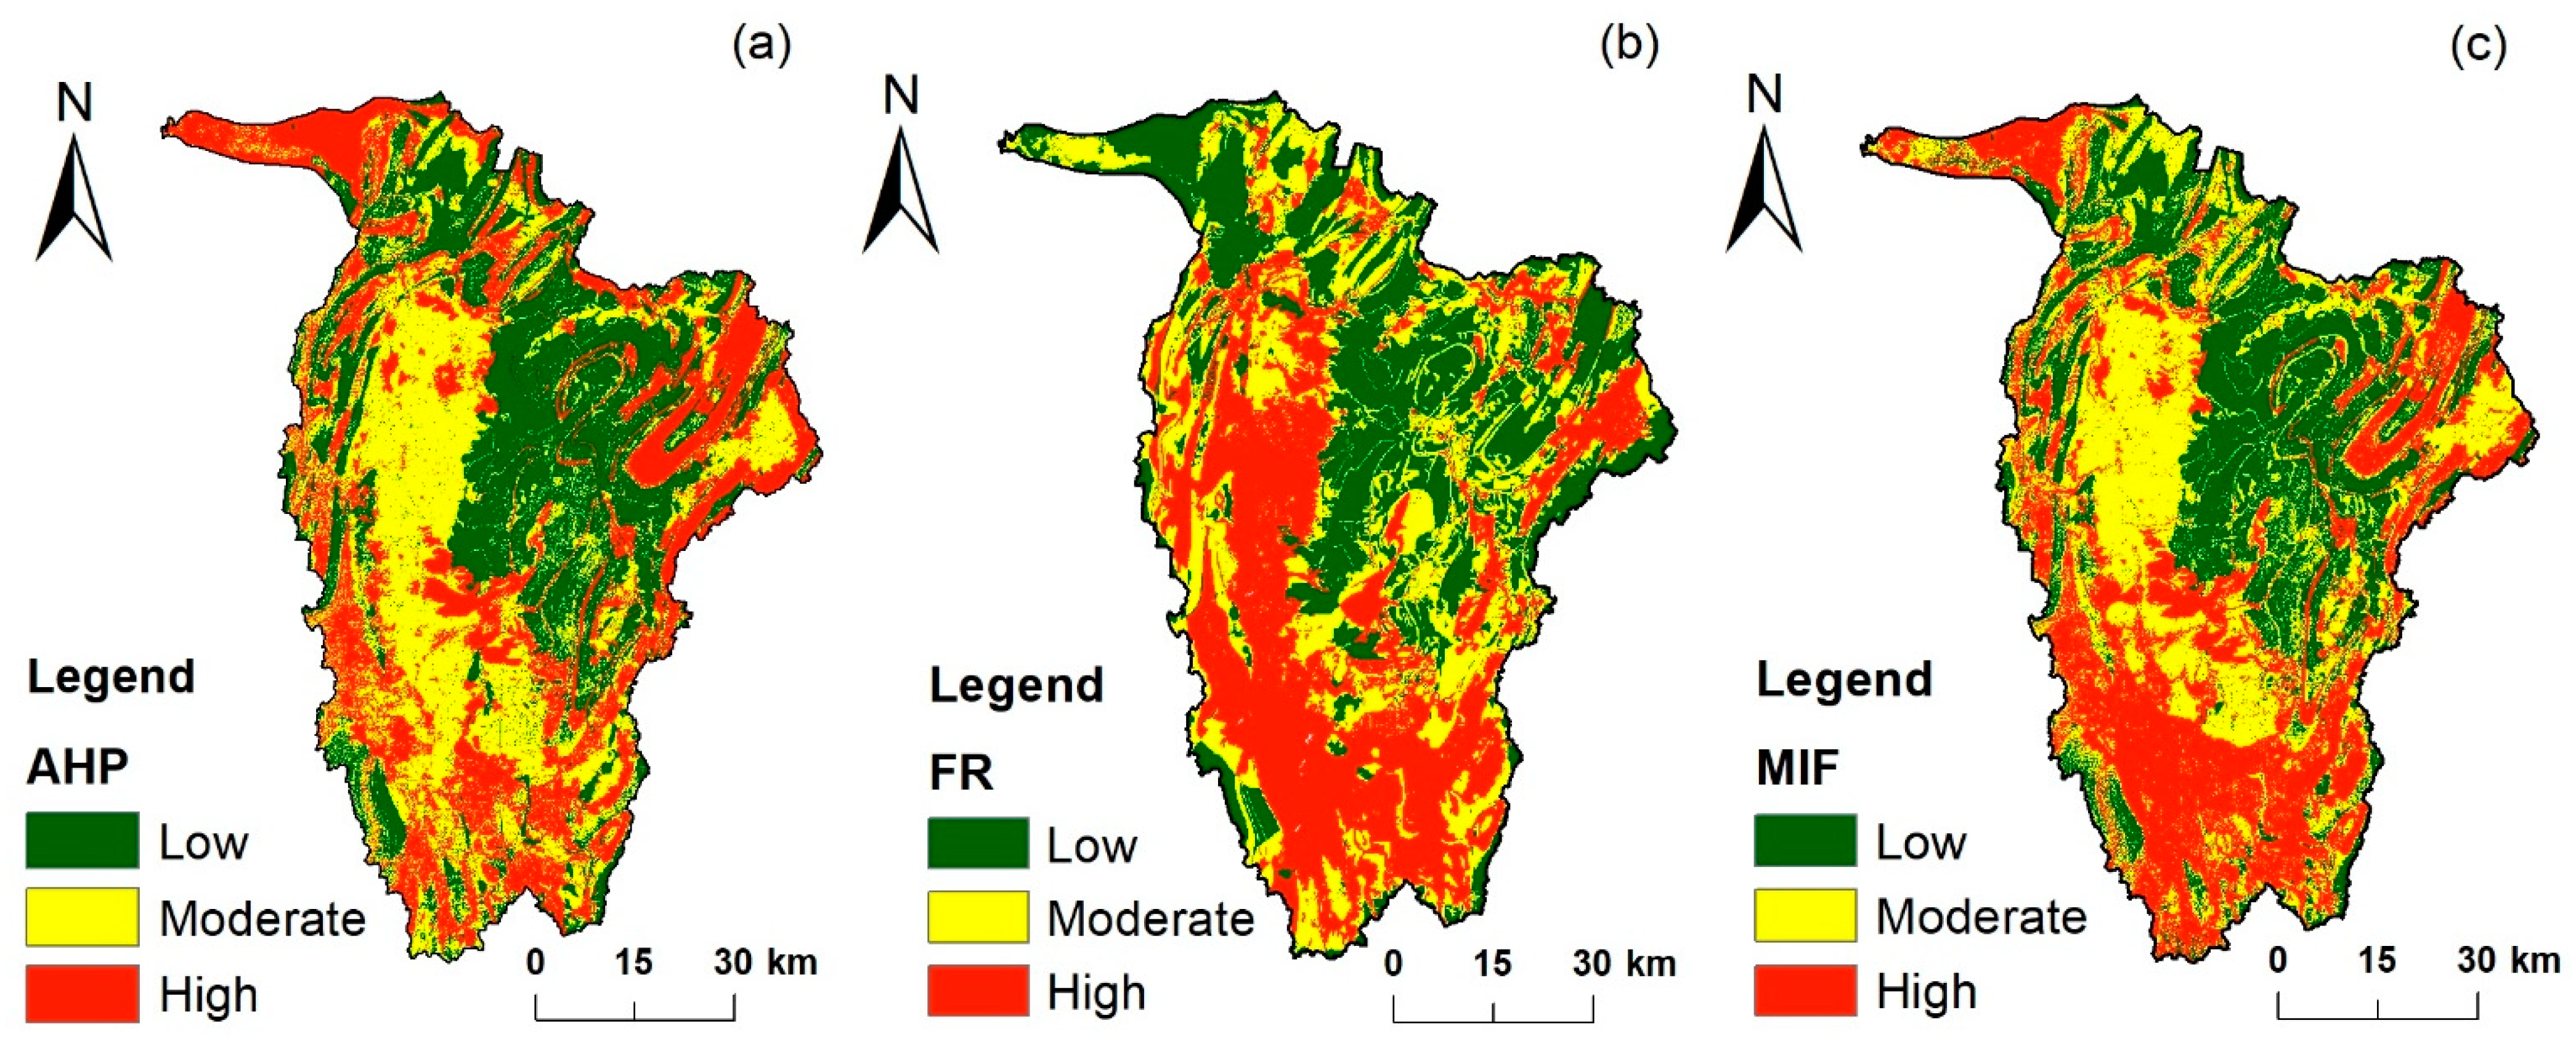
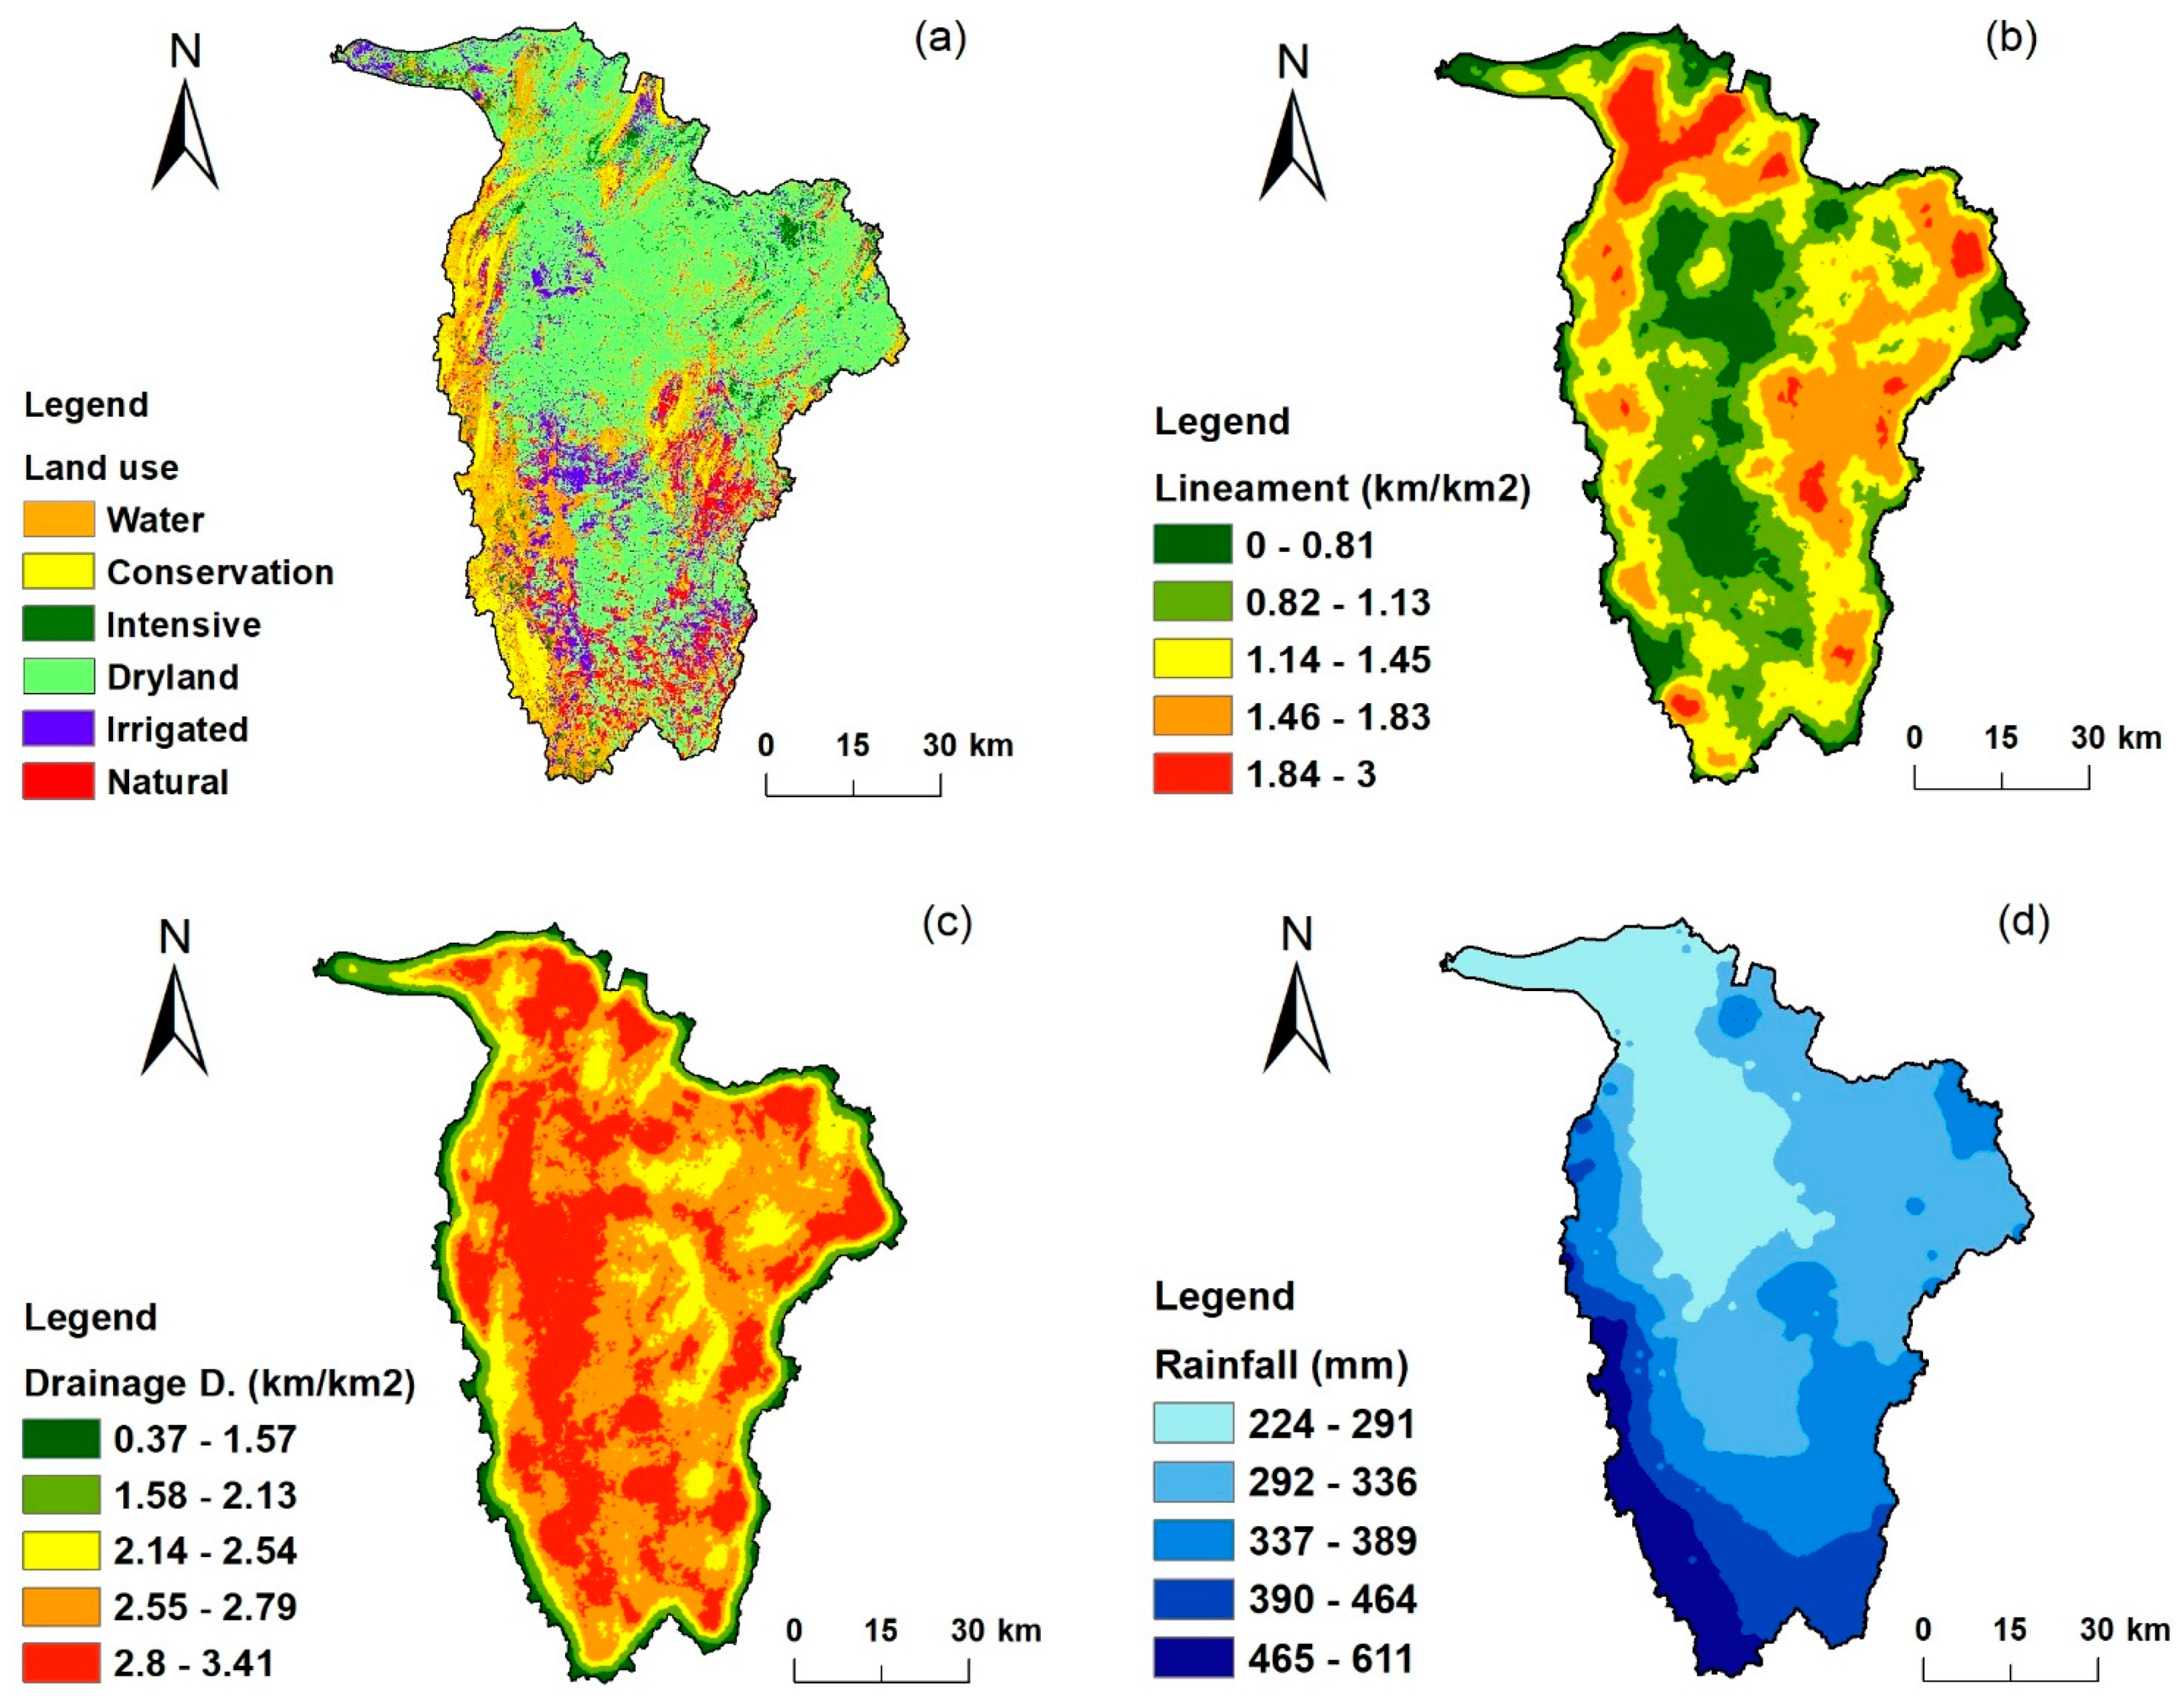
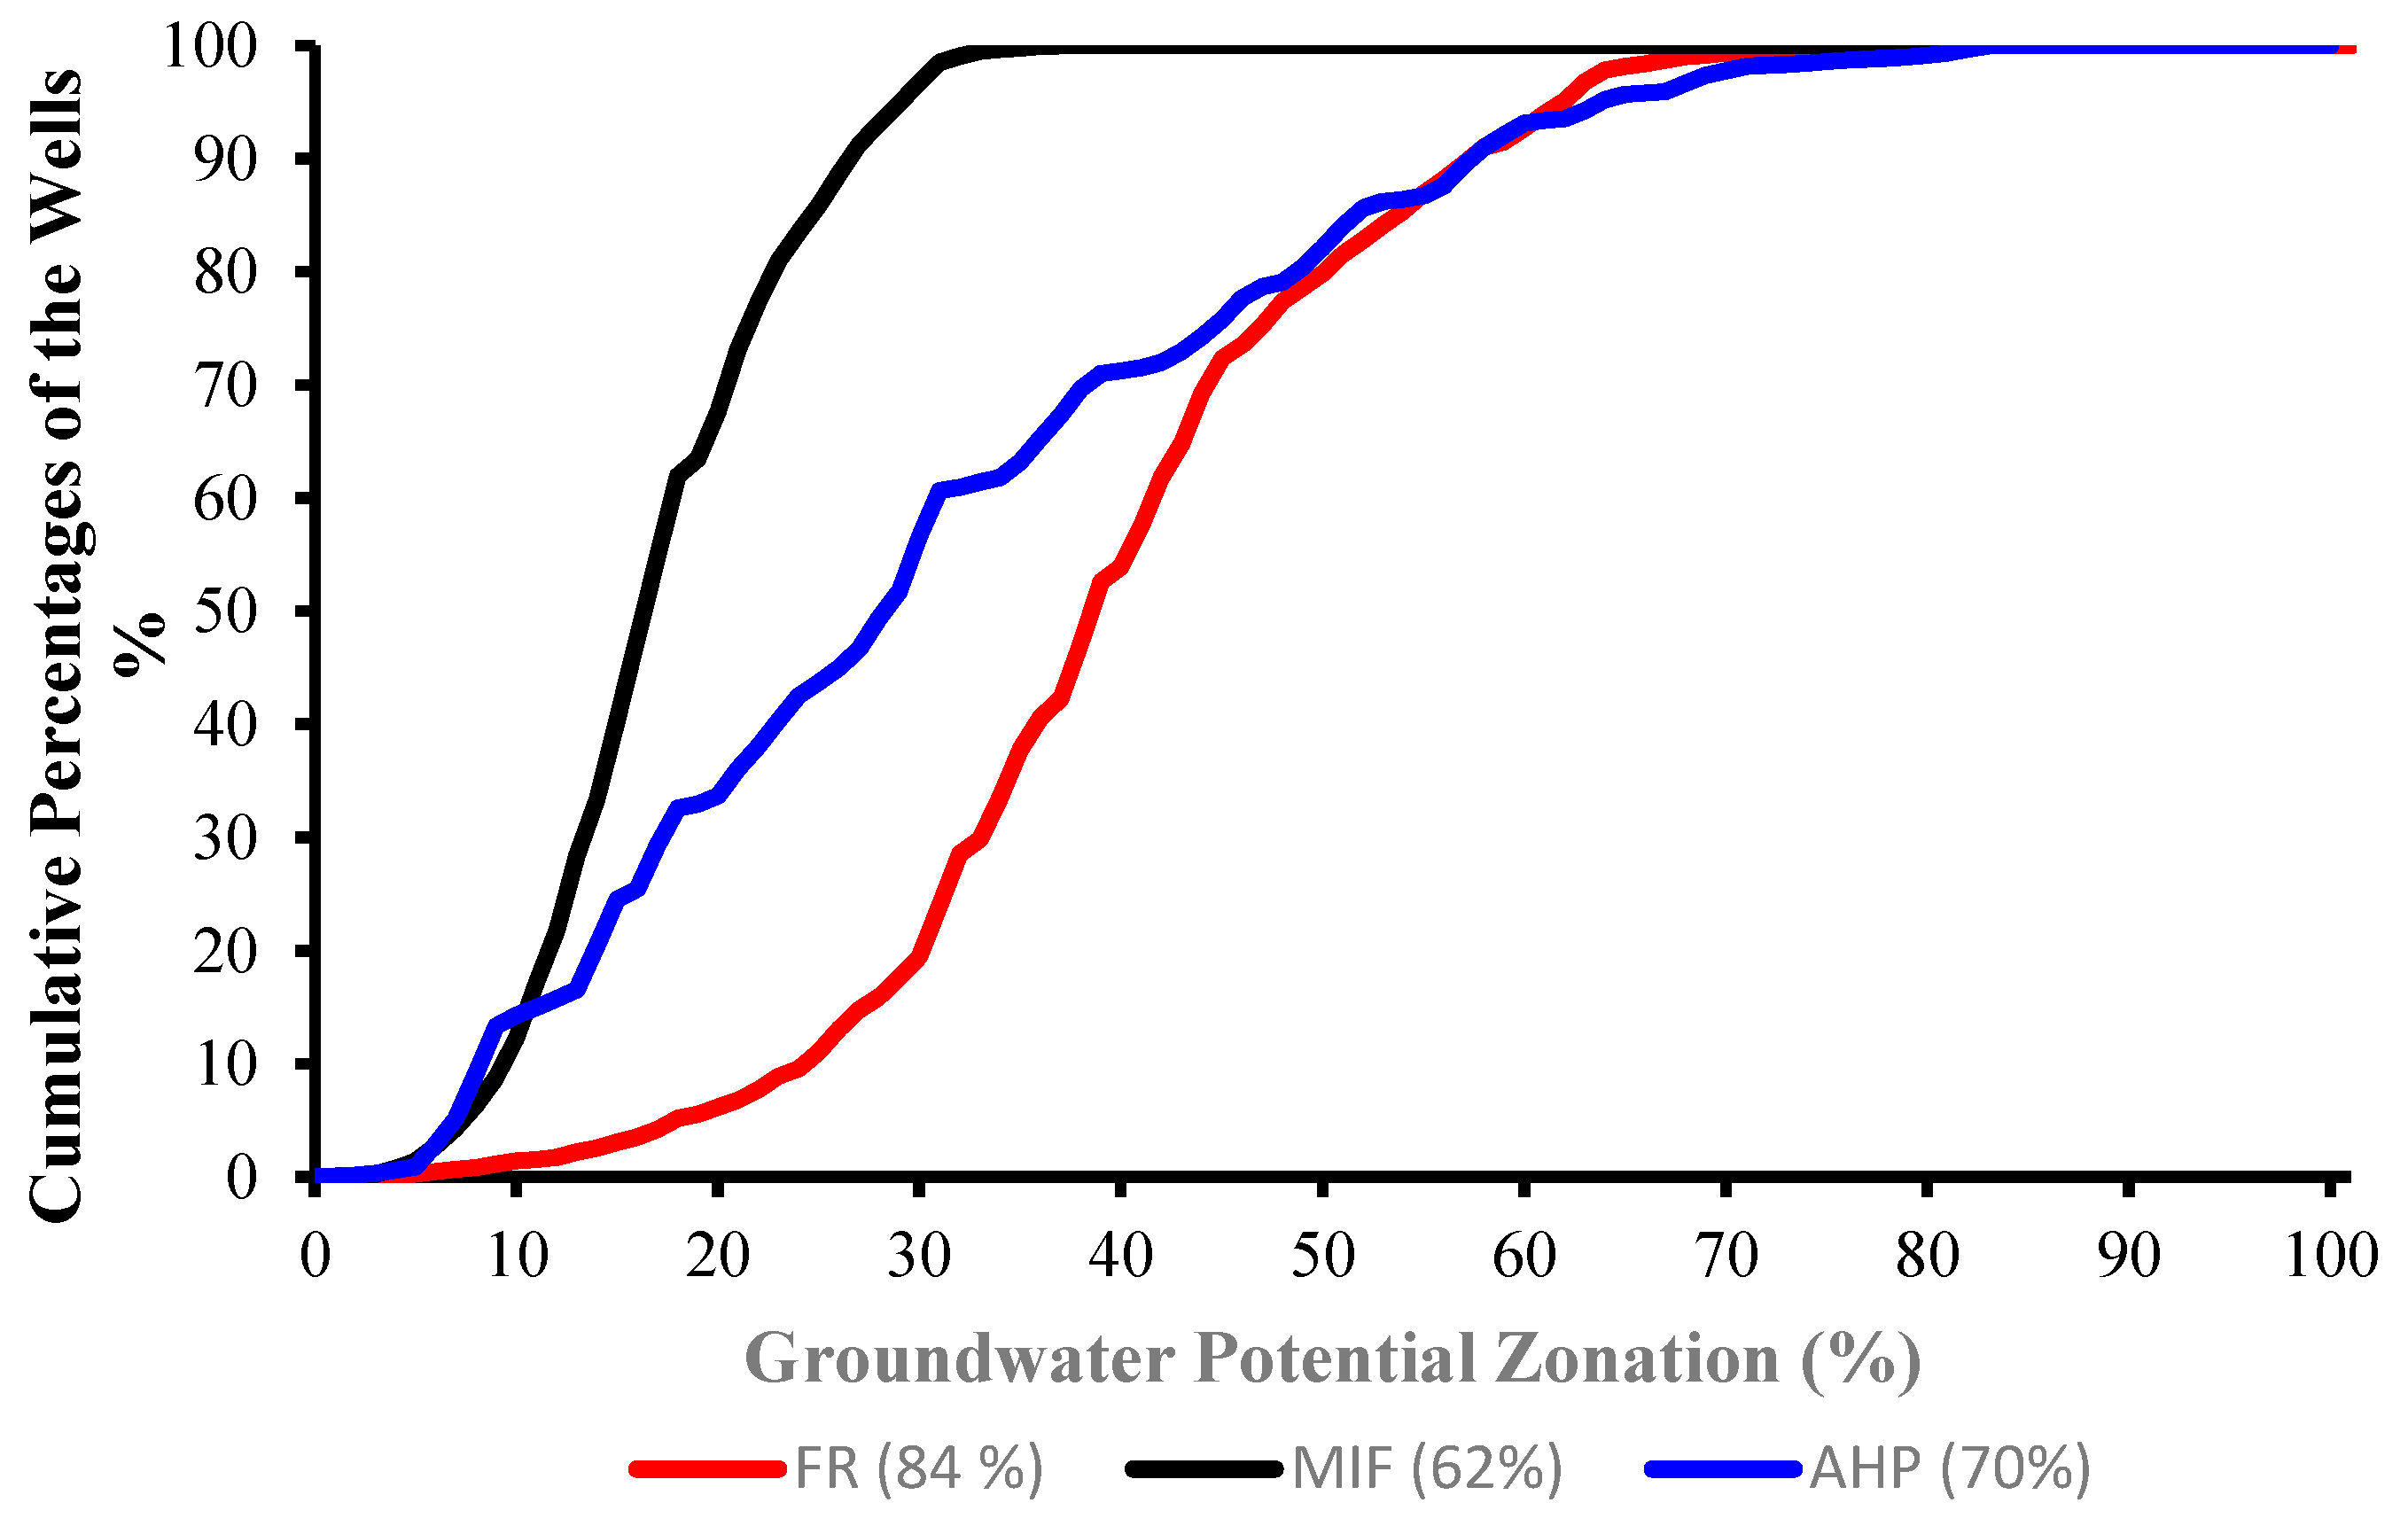
To sustain groundwater resources, delineation of the most favourable recharge zones is urgently needed. The integration of RS and GIS, along with the MIF, AHP, and FR techniques, has been recognised as an efficient and powerful tool for mapping and identification of groundwater recharge potential zones. The main objective of this study was to evaluate the applicability of MIF, AHP, FR, GIS, and RS techniques to map groundwater potential. The groundwater recharge potential of a region depends on the direct and indirect influences of several factors. In the present study, seven thematic layers representing the main influencing factors including (lithology, slope, drainage density, land use, lineament density, rainfall, and soil) were integrated together using GIS to generate groundwater recharge potential maps for the Willochra Basin, South Australia. According to the final output map, the study area could be classified into three distinct groundwater recharge potential zones, such as high, moderate, and low. Of the basin area, 33–38% was identified as high potential areas for groundwater recharge and correspond to the southern region of the area. Moderate groundwater potential zone covered an area of 30–37% and low groundwater recharge potential ranged from 29% to 33% of the study area. To check the accuracy of the resultant maps, the data were validated using the AUC and available well data along a hydrogeological cross-section. The AUC of the FR technique was high (84%), indicating that this method was highly accurate, and more accurate than the MIF and AHP techniques. Moreover, well data showed a good agreement with the findings from the mapping and AUC. This study proved that the multicriteria decision analysis can be effectively integrated with RS and GIS techniques for an accurate and cost-effective assessment of groundwater recharge potential. The methodology in this study can be straightforwardly applied for sustainable development and management of the precious water resources in other data-limited areas. The resultant maps could be used as a blueprint for any future groundwater assessment and management in Willochra Basin. The groundwater potential maps would help policymakers to formulate better decisions. In addition, it could support the decision-makers in the selection of appropriate locations for drilling wells based on demand.


