Article

Hydrogenotrophic Denitrification of Groundwater Using a Simplified Reactor for Drinking Water: A Case Study in the Kathmandu Valley, Nepal

1
Integrated Graduate School of Medicine, Engineering and Agricultural Sciences, University of Yamanashi, 4-4-37 Takeda, Kofu, Yamanashi 400-8510, Japan
2
Interdisciplinary Research Centre for River Basin Environment, University of Yamanashi, 4-4-37 Takeda, Kofu, Yamanashi 400-8510, Japan
3
Department of Civil Engineering, Pulchowk Campus, Institute of Engineering, Tribhuvan University, PatanDhokha Road, Lalitpur 44600, Nepal
4
Interdisciplinary Graduate School of Medicine and Engineering, University of Yamanashi, 4-4-37 Takeda, Kofu, Yamanashi 400-0016, Japan
5
Department of Life and Environmental Sciences, University of Yamanashi, 4-4-37 Takeda Kofu, Yamanashi 400-8510, Japan
6
Department of Environmental Science, Faculty of Science, Ramkhamhaeng University, Bangkok 10240, Thailand
*
Author to whom correspondence should be addressed.
Water 2021, 13(4), 444; https://doi.org/10.3390/w13040444
Submission received: 8 January 2021 / Revised: 1 February 2021 / Accepted: 3 February 2021 / Published: 8 February 2021
(This article belongs to the Section Hydrology)

Abstract

:
High nitrate-nitrogen (NO3–N) content is a typical feature of groundwater, which is the primary water source in the Kathmandu Valley, Nepal. Considering the Kathmandu Valley’s current problem of water scarcity, a user-friendly system for removing NO3–N from groundwater is promptly desired. In this study, a simplified hydrogenotrophic denitrification (HD) reactor was developed for the Kathmandu Valley, and its effectiveness was evaluated by its ability to treat raw groundwater. The reactor operated for 157 days and showed stability and robustness. It had an average nitrogen removal efficiency of 80.9 ± 16.1%, and its nitrogen loading rate and nitrogen removal rate varied from 23.8 to 92.3 g–N/(m3∙d) and from 18.3 to 73.7 g–N/(m3∙d), respectively. Compared to previous HD reactors, this simplified HD reactor is a more user-friendly option for the Kathmandu Valley, as most of the materials used for the reactor were locally available and require less maintenance. The reactor is recommended for groundwater treatment at the household level. It has a current treatment capacity of 40 L/d, which can fulfill the daily requirements for drinking and cooking water in a household with 4–5 people.

1. Introduction

Drinking water is indispensable to human life, and the United Nations Sustainable Development Goal 6 (SDG) targets the securement of universal and equitable access to safe and affordable drinking water for all people [1]. The Kathmandu Valley includes Kathmandu, the capital and the largest city of Nepal, and it is facing water shortages due to the rapidly expanding population [2] and continued urbanization [3]. There is a considerable discrepancy between the water demand and the water supply in the Kathmandu Valley (the total water demand is 430 million liters per day (MLD), but the water supply averages only 103 MLD) [4]. To address the deficit in water supply, the locals have been compelled to find alternative water sources [5,6,7,8,9,10]. Among them, groundwater has been a principal source of drinking water in the valley [11], and household dependency on groundwater is high [5]. However, nitrogenous contaminants, mainly ammonium-nitrogen (NH4+–N) and nitrate-nitrogen (NO3–N), are often observed in the groundwater [11,12,13,14,15], limiting its usage. Excess NH4+–N can be associated with the creation of offensive odors and taste, and it can diminish the efficacy of chlorine disinfection, resulting in higher risks of pathogenic contamination [16]. Furthermore, NH4+–N can be converted into nitrite-nitrogen (NO2–N) or NO3–N by microbial activity, and a high intake of nitrate-contaminated water is known to have adverse effects on human health, leading to serious diseases such as methemoglobinemia, gastric cancer, and non-Hodgkin’s lymphoma [17]. Therefore, it is necessary to eliminate contaminants from groundwater.
Although ceramic filtration has conventionally been used in households to purify water [8], this method is not effective in removing nitrogenous contaminants. The development of alternative removal processes, especially for nitrogen species, is therefore necessary. A promising reactor for NH4+–N removal from groundwater, which is low-cost, low-maintenance, and has excellent performance, has been developed [18,19,20]. However, the system is capable of removing only NH4+–N through oxidation of NH4+–N to NO3–N by nitrifying bacteria, and the NO3−N produced during nitrification remains of great concern [20]. Therefore, it is imperative to develop a suitable system for the removal of both preexisting and NH4+–N–derived NO3–N in the groundwater of the Kathmandu Valley.
Myriad approaches for removing NO3–N from groundwater have been studied. However, the current economic situation and the energy affairs of the Kathmandu Valley could pose a challenge for the selection of water treatment technology, and the compatibility of these systems with the current social situation must be considered [8,9]. In this context, user-friendly water treatment systems that are low-cost, energy-efficient, compact, and easy to operate and maintain are desirable to ensure their sustainability [8,21]. From this perspective, physicochemical approaches, including ion exchange, reverse osmosis, and electrodialysis may be ineligible due to high capital infrastructure costs, high energy consumption, and the costs related to the disposal of waste brine [22]. The use of a biological treatment seems to be a preferable alternative [22]. Biological denitrification processes are broadly classified into two groups: heterotrophic and autotrophic denitrification, and the former has been conventionally studied for NO3–N removal. The addition of organic carbon entailed in the activation of heterotrophic denitrification raises concerns regarding the increased risk of secondary pollution associated with elevated levels of total organic carbon [21,23,24,25].
Recently, hydrogenotrophic denitrification (HD), which is a type of autotrophic denitrification, has drawn much attention as a promising technology for nitrate removal from groundwater [19,21,23,24,25,26,27,28,29,30,31,32,33,34,35,36] because it offers certain advantages over heterotrophic denitrification systems. First, biomass generation can be reduced, thereby reducing clogging and the cost of post-treatment [33]. Second, there is no production of toxic waste as HD is a clean process [21,24]. Third, organic carbon is not necessary, leading to lower operational costs and lower risk of secondary contamination [23]. Fourth, H2 is economical for nitrogen removal per electron equivalent compared to other electron donors [23,33].
The HD process is generally applied using a hollow fiber membrane reactor, a gas-permeable reactor, a membrane bioreactor, or a packed bed reactor. This leads to high costs for infrastructure and operation, frequent cleaning, post-treatment requirements, and high maintenance. In contrast, simplified HD systems, for example, using an attached growth reactor, can be well suited for application in developing countries owing to their user-friendliness [19,21,23]. To date, most research on the development of HD reactors for groundwater has been conducted in the laboratory using synthetic groundwater, and little information is available on the application of HD for raw groundwater treatment and the behavior of HD systems under on-site conditions.
Therefore, the objective of this research is to develop a simplified, user-friendly HD reactor for people in the Kathmandu Valley, Nepal, and use it for raw groundwater treatment to evaluate its effectiveness, understand its behavior under on-site conditions, and fill the gap in knowledge between laboratory and practical applications. In this research, groundwater from the Jwagal area located in the Kathmandu Valley, Nepal, where the groundwater is highly contaminated by NH4+–N, at levels up to 60 mg–N/L [11], was selected for a case study. The simplified HD reactor was developed using as many locally available materials as possible and installed after a nitrification system, in order to eliminate the NO3–N generated during the nitrification process. This research was designed to support future efforts for deeper insight into the simplified HD reactor, which could potentially have important implications for the application of this technology in developing countries.

2. Materials and Methods

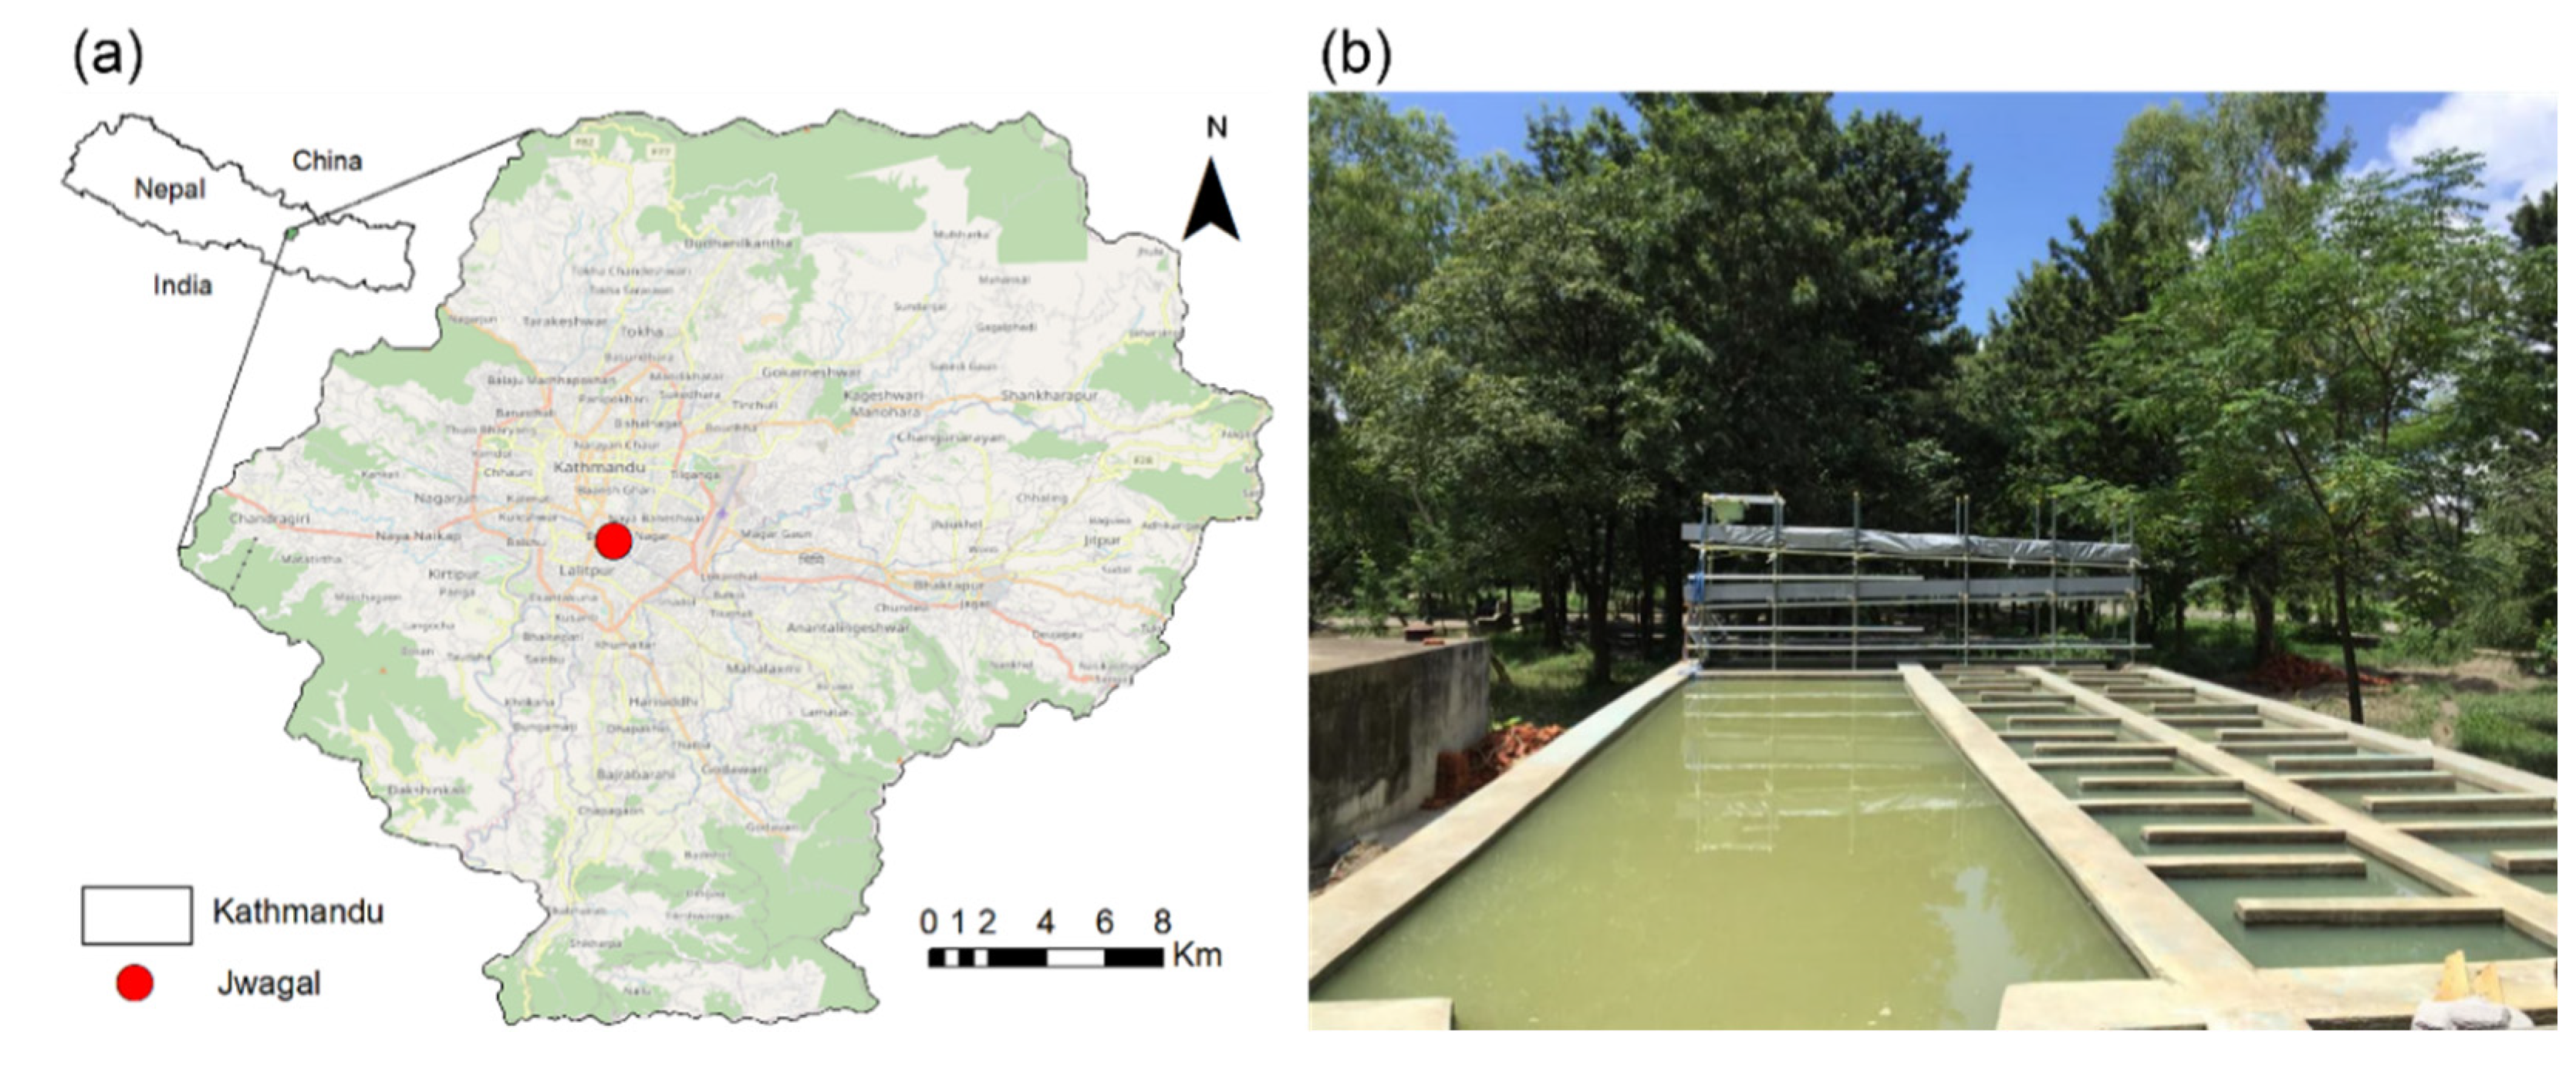
2.1. Description of the Study Area

The Kathmandu Valley is situated between the latitudes 27°32′13″ and 27°49′10″ N, and the longitudes 85°11′31″ and 85°31′38″ E. The study area, Jwagal, is located in the middle of the Kathmandu Valley (Figure 1). In Jwagal, Kathmandu Upatyaka Khanepani Limited (KUKL) operates a water treatment unit to extract deep groundwater for intermittent distribution. The extracted groundwater is treated by aeration, coagulation and flocculation, sedimentation, sand filtration, and chlorination, as shown in Figure 2, before distribution to households.

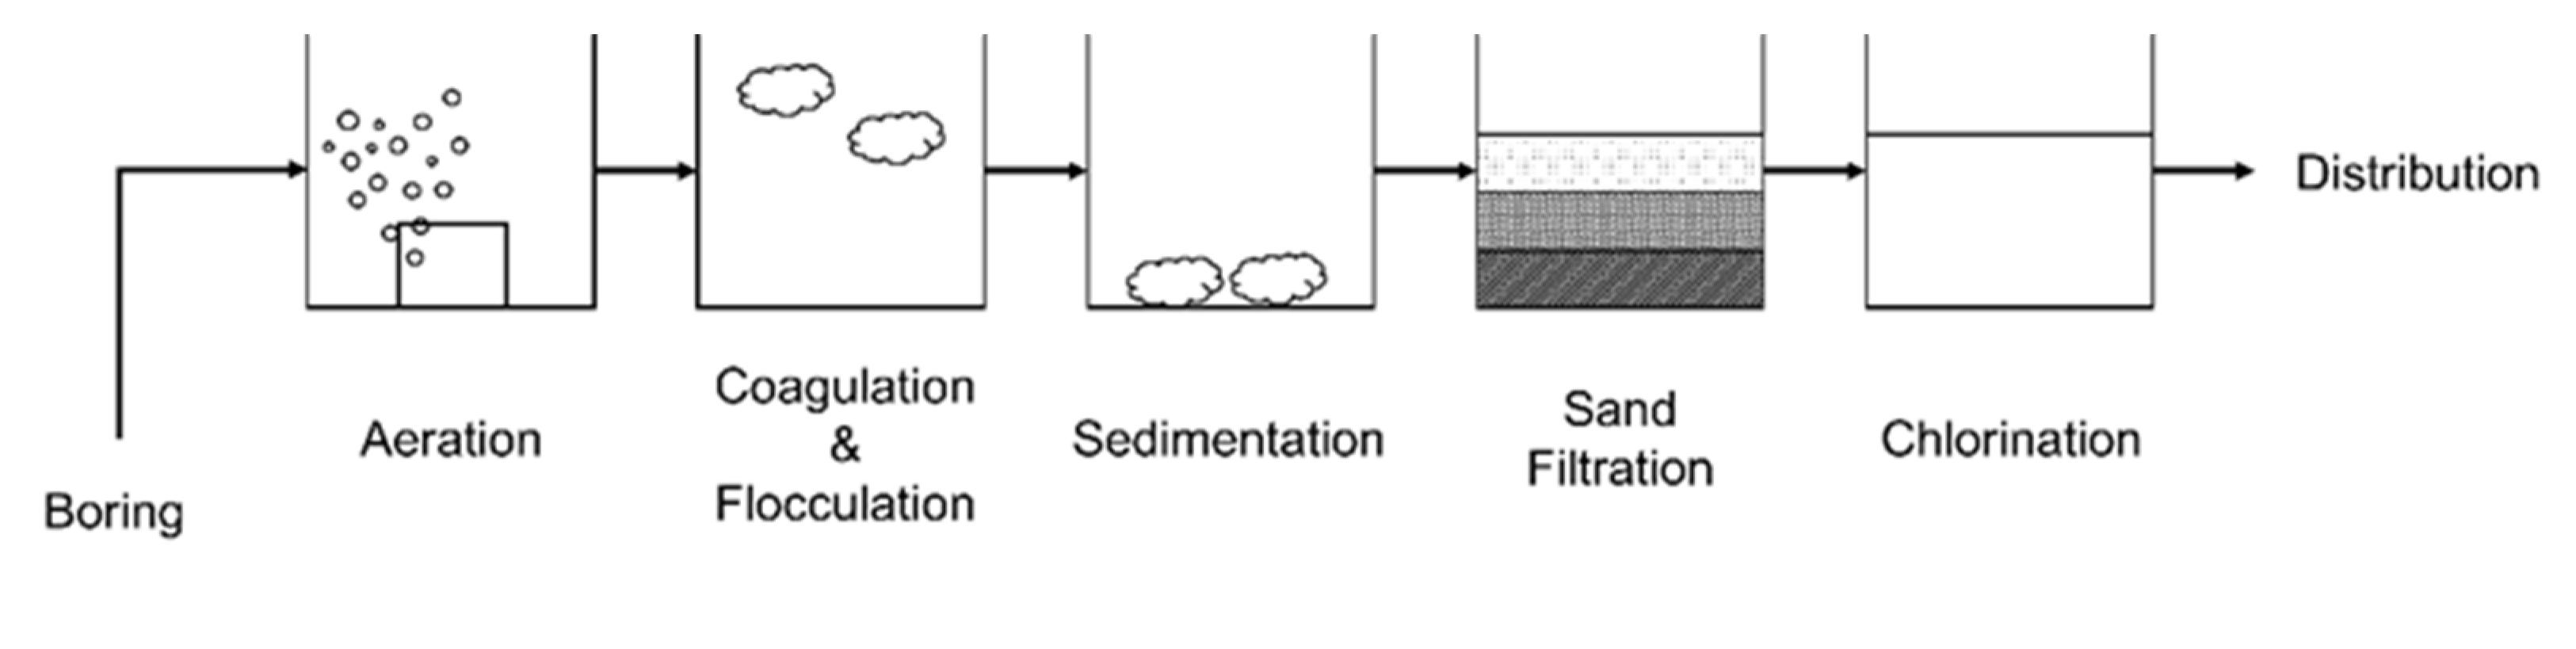
2.2. Characteristics of Groundwater at Jwagal

Table 1 summarizes the groundwater quality of Jwagal, with data partially adapted from previous reports [11,37]. As can be seen in Figure 1b, the groundwater is turbid. The groundwater is heavily contaminated by NH4+–N at concentrations ranging from 41.2 to 57.3 mg–N/L, which exceeds the drinking water standard (1.2 mg–N/L) set by the World Health Organization (WHO) [16], and which cannot be removed by the current treatment process [9]. Thus, a nitrification system described by the Japan International Cooperation Agency (JICA) in 2019 [38] was supplementarily installed after the sedimentation system to remove NH4+–N from the groundwater.

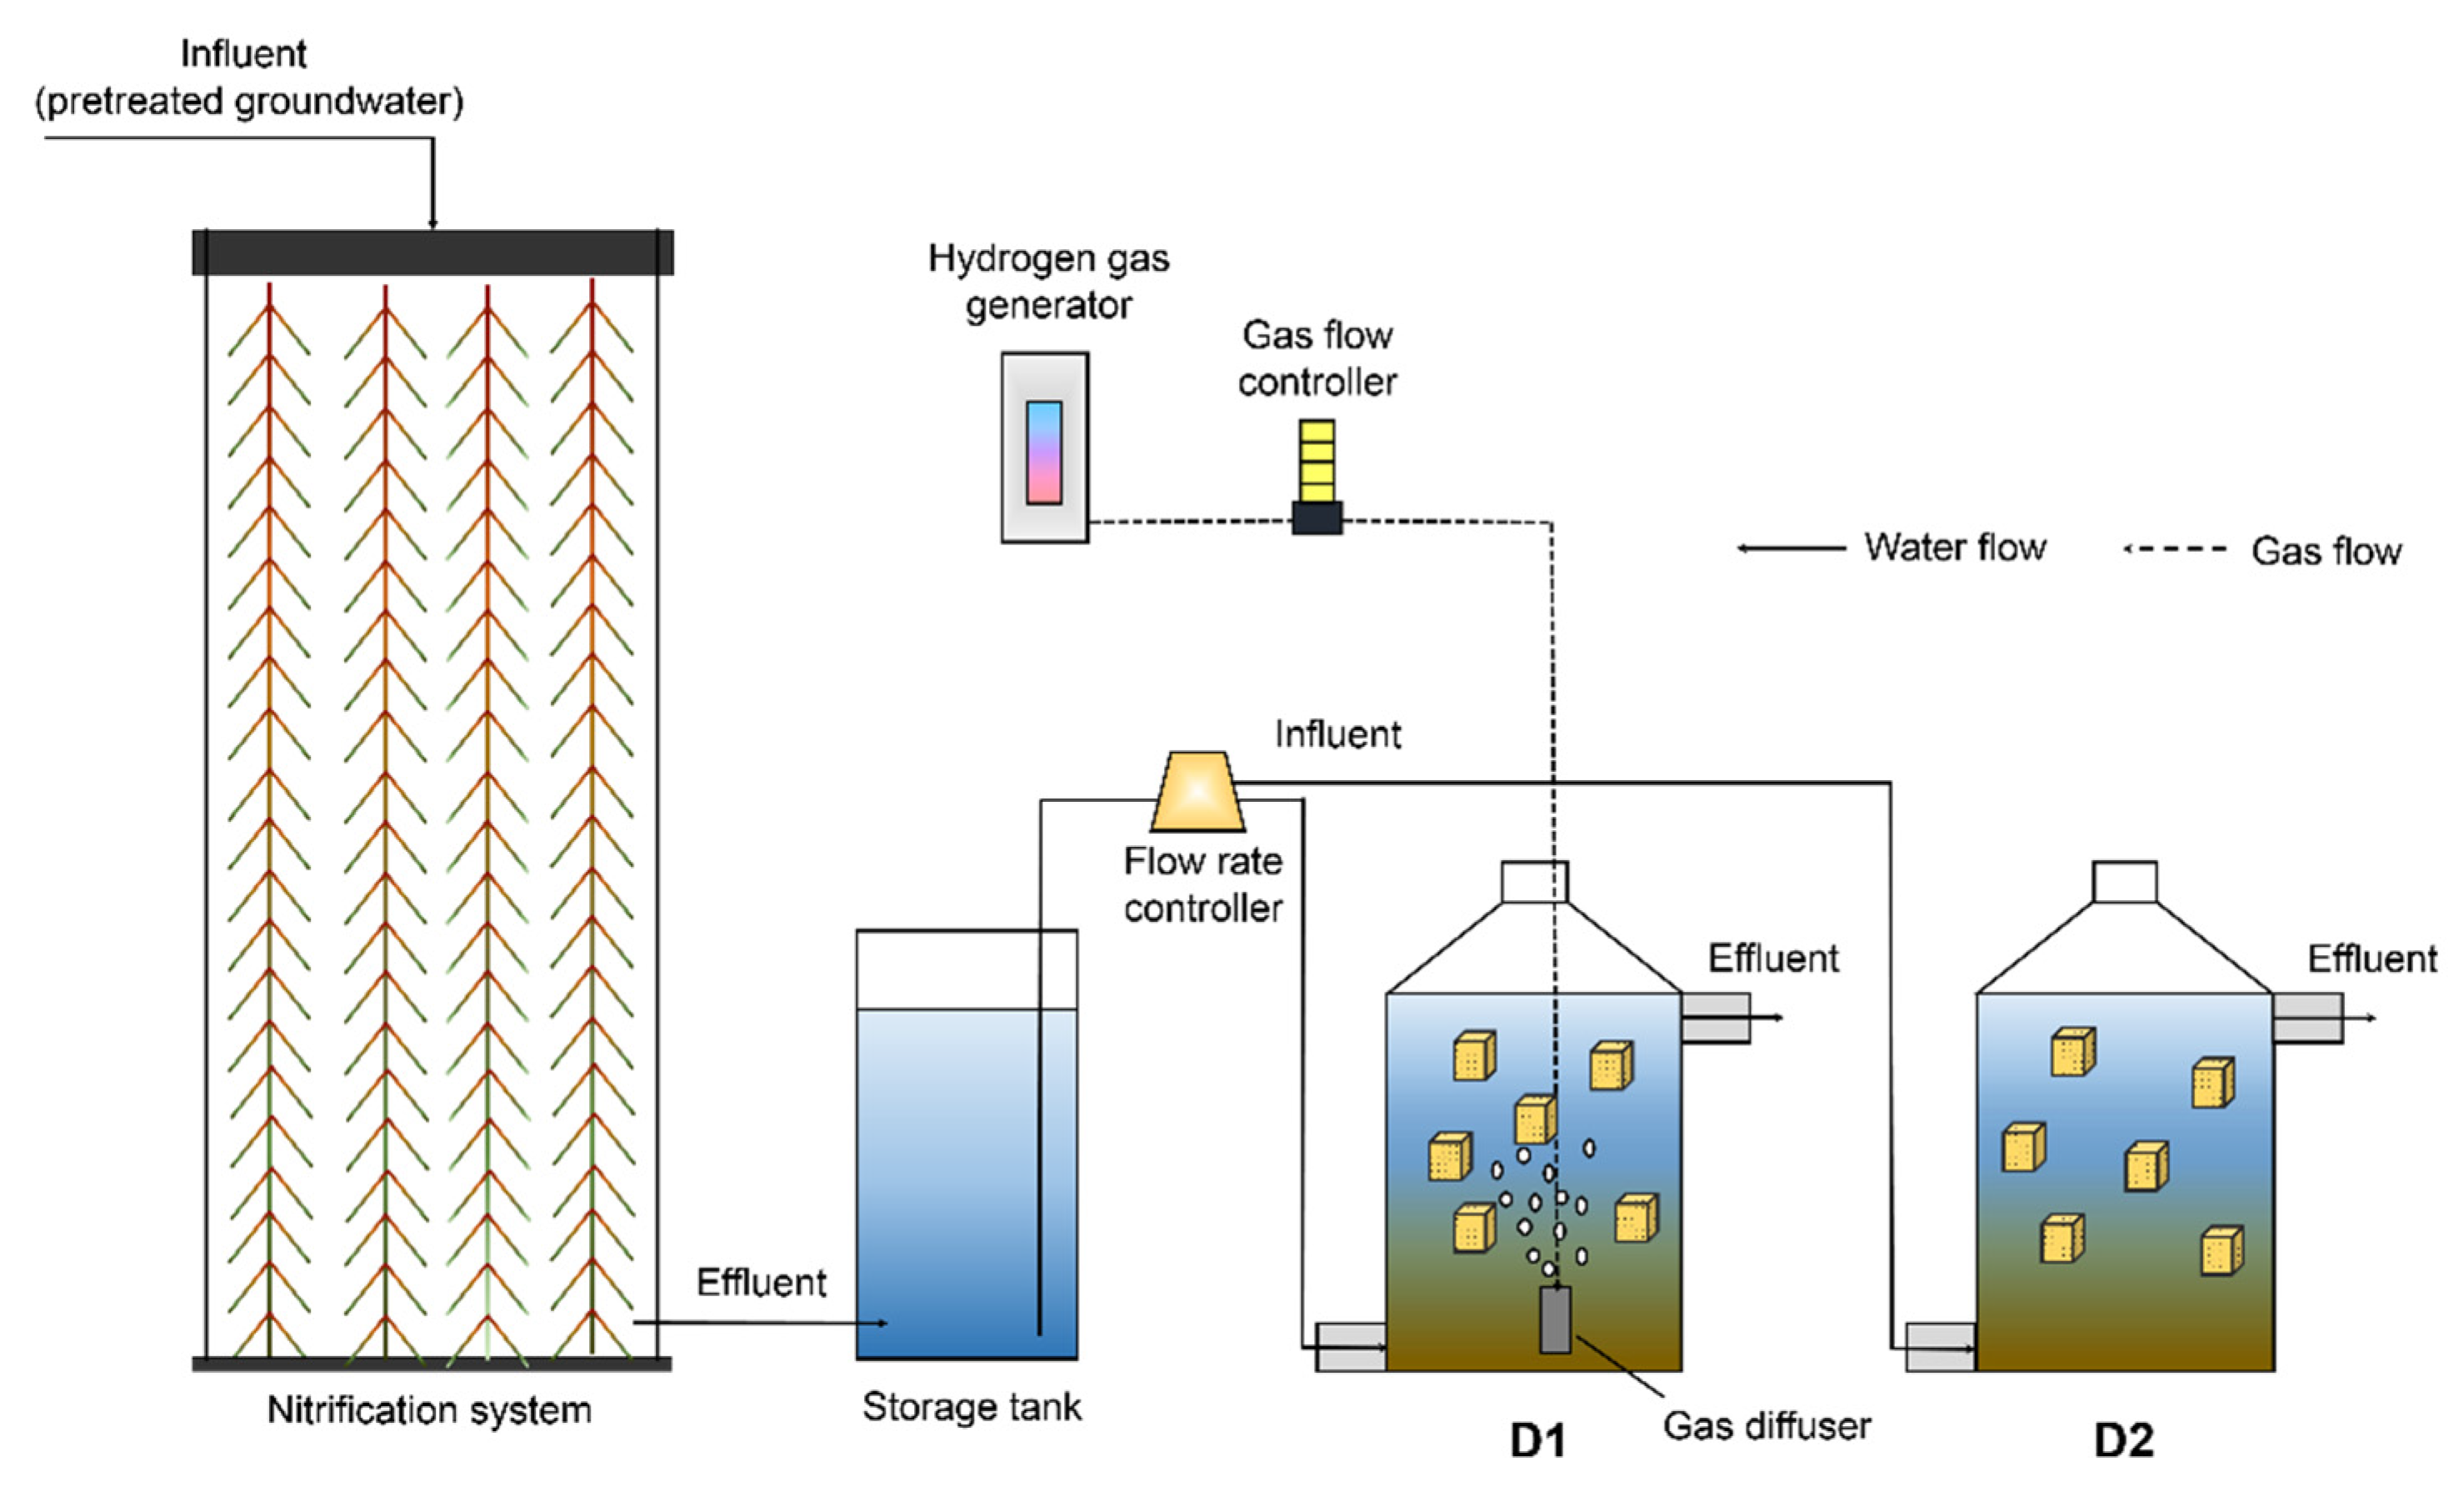
2.3. Simplified HD Reactor

Figure 3 shows a schematic of the on-site HD reactors. To ensure the sustainability of the water treatment unit and its compatibility with local conditions, reactors were made using as many locally available materials as possible. A cylindrical plastic water jar that is commonly used by households in Nepal [5,39] was selected for two attached growth reactors with a working volume of approximately 20 L. Polyolefin sponges (1 cm × 1 cm × 1 cm; Sekisui Aqua Systems Co., Ltd., Japan) were selected as the durable carrier material for better bacterial attachment and long-term applicability, and 1000 pieces were introduced into the inside of each reactor. The seed sludge for the on-site HD reactor was obtained from an HD reactor in operation [38,40]. A fiber carrier with 1.5 ± 0.4 g of volatile suspended solid (VSS) was used for acclimatizing the reactor. The two reactors were continuously operated in parallel from May 2017 to November 2017 with H2 (hereafter D1) and without H2 (hereafter D2) gas supply. The H2 flow rate, flow rate of the influent, and hydraulic retention time (HRT) were maintained at 120 mL/min, 28 mL/min, and 12 h, respectively, during the operation. H2 gas was supplied from a water electrolytic H2 generator (HG-26; GL Science, Tokyo, Japan) through a commercially available aeration diffuser designed for aquariums (WP-1680, Sobo, China). Two reactors were installed after a nitrification system that treated the pretreated groundwater. The nitrification system comprises a dropping nitrification system, where the groundwater drips down from the top to the bottom by gravity. Nitrifying bacteria on the hanging materials consume oxygen in the air to convert NH4+–N to NO3–N [20,40]. The nitrified groundwater was then supplied to the bottom of the HD reactors and passed through the carriers towards the outlet. The reactors were installed inside a room (dark) to prevent the algal growth. D1 and D2 were continuously operated for 157 and 113 d, respectively, without any internal cleaning. Samples of the influent and the effluents of D1 and D2 were taken randomly (at least once in every 10 days) to monitor the nitrogen concentrations, pH, dissolved oxygen (DO), water temperature, and turbidity during the operation period. In total, 21 samples from D1 and 18 samples from D2 were collected.

2.4. Batch Test for the Determination of NO3−N Removal and Denitrification Rate

Batch tests were conducted immediately before the start of the long-term operation and on Day 112 to determine the NO3–N and denitrification (NO3–N and NO2–N) rates in the same manner as previously described [21]. The rate was obtained from linear regressions based on the results of the test. The H2 flow rate was maintained at 120 mL/min during the batch test. The samples were collected from the reactor at regular intervals.

2.5. Analytical Methods

Collected samples were immediately filtered using a 0.45 μm pore-size membrane filter and stored in a freezer (−18 °C) until water quality analysis was performed. NO3–N, NO2–N, NH4+–N, and bicarbonate (HCO3) concentrations were analyzed by ultraviolet spectrophotometric screening, colorimetric, colorimetric-phenate, and titration methods, respectively, in accordance with standard methods [41]. The pH, DO, water temperature, and turbidity were measured using a pH meter (Horiba-B712, Kyoto, Japan), a portable DO meter (Multi 3410; WTW, Weilheim, Germany), a digital thermometer (WT-6, China), and a digital turbidity meter (TU-2016, Sato Shouji Inc., Saitama, Japan), respectively. The average temperature data of Kathmandu from May 2017 to November 2017 were obtained from the Historical Weather and Climate Data [42].

2.6. Performance of the Simplified HD Reactor

The nitrogen loading rate (NLR), nitrogen removal rate (NRR), and nitrogen removal efficiency were calculated based on Equations (1)–(3).
NLR   [ g N / ( m 3 · d ) ] = ( NO 3 N In + NO 2 N In )   [ g N L ]   ×   Flow   rate   [ L d ] Reactor   volume   [ m 3 ]
NRR   [ g N / ( m 3 · d ) ] = { ( NO 3 N + NO 2 N ) In ( NO 3 N + NO 2 N ) Eff }   [ g N L ]   ×   Flow   rate   [ L d ] Reactor   volume   [ m 3 ]
Nitrogen   removal   efficiency   ( % ) = NRR   [ g N / ( m 3 · d ) ] NLR   [ g N / ( m 3 · d ) ] × 100
where NO3–NIn, NO2–NIn, NO3–NEff, and NO2–NEff represent the influent NO3–N, influent NO2–N, effluent NO3–N, and effluent NO2–N concentrations, respectively.
In this study, NH4+–N concentration was not considered for NLR, NRR, or nitrogen removal efficiency, as HD is not meant to remove NH4+–N, and the difference in NH4+–N concentrations between the influent and effluent were not significant. Furthermore, the NH4+–N observed in the influent is attributed to the degraded performance of the nitrification system (NH4+–N concentrations should be less than 1.2 mg–N/L for drinking water).

2.7. Statistical Analysis

Data were first tested for normality using the Shapiro-Wilks test, and it was found that the data did not meet the normality assumption. Thus, to compare statistical differences among the three groups (influent, D1 effluent, D2 effluent) the non-parametric Kruskal-Wallis test and Dann-Bonferroni test were used. In all data, a p-value of less than 0.05 was considered statistically significant. The data were processed using the statistical analysis software package SPSS v.22 (IBM Corp., Armonk, NY, USA).

3. Results and Discussion

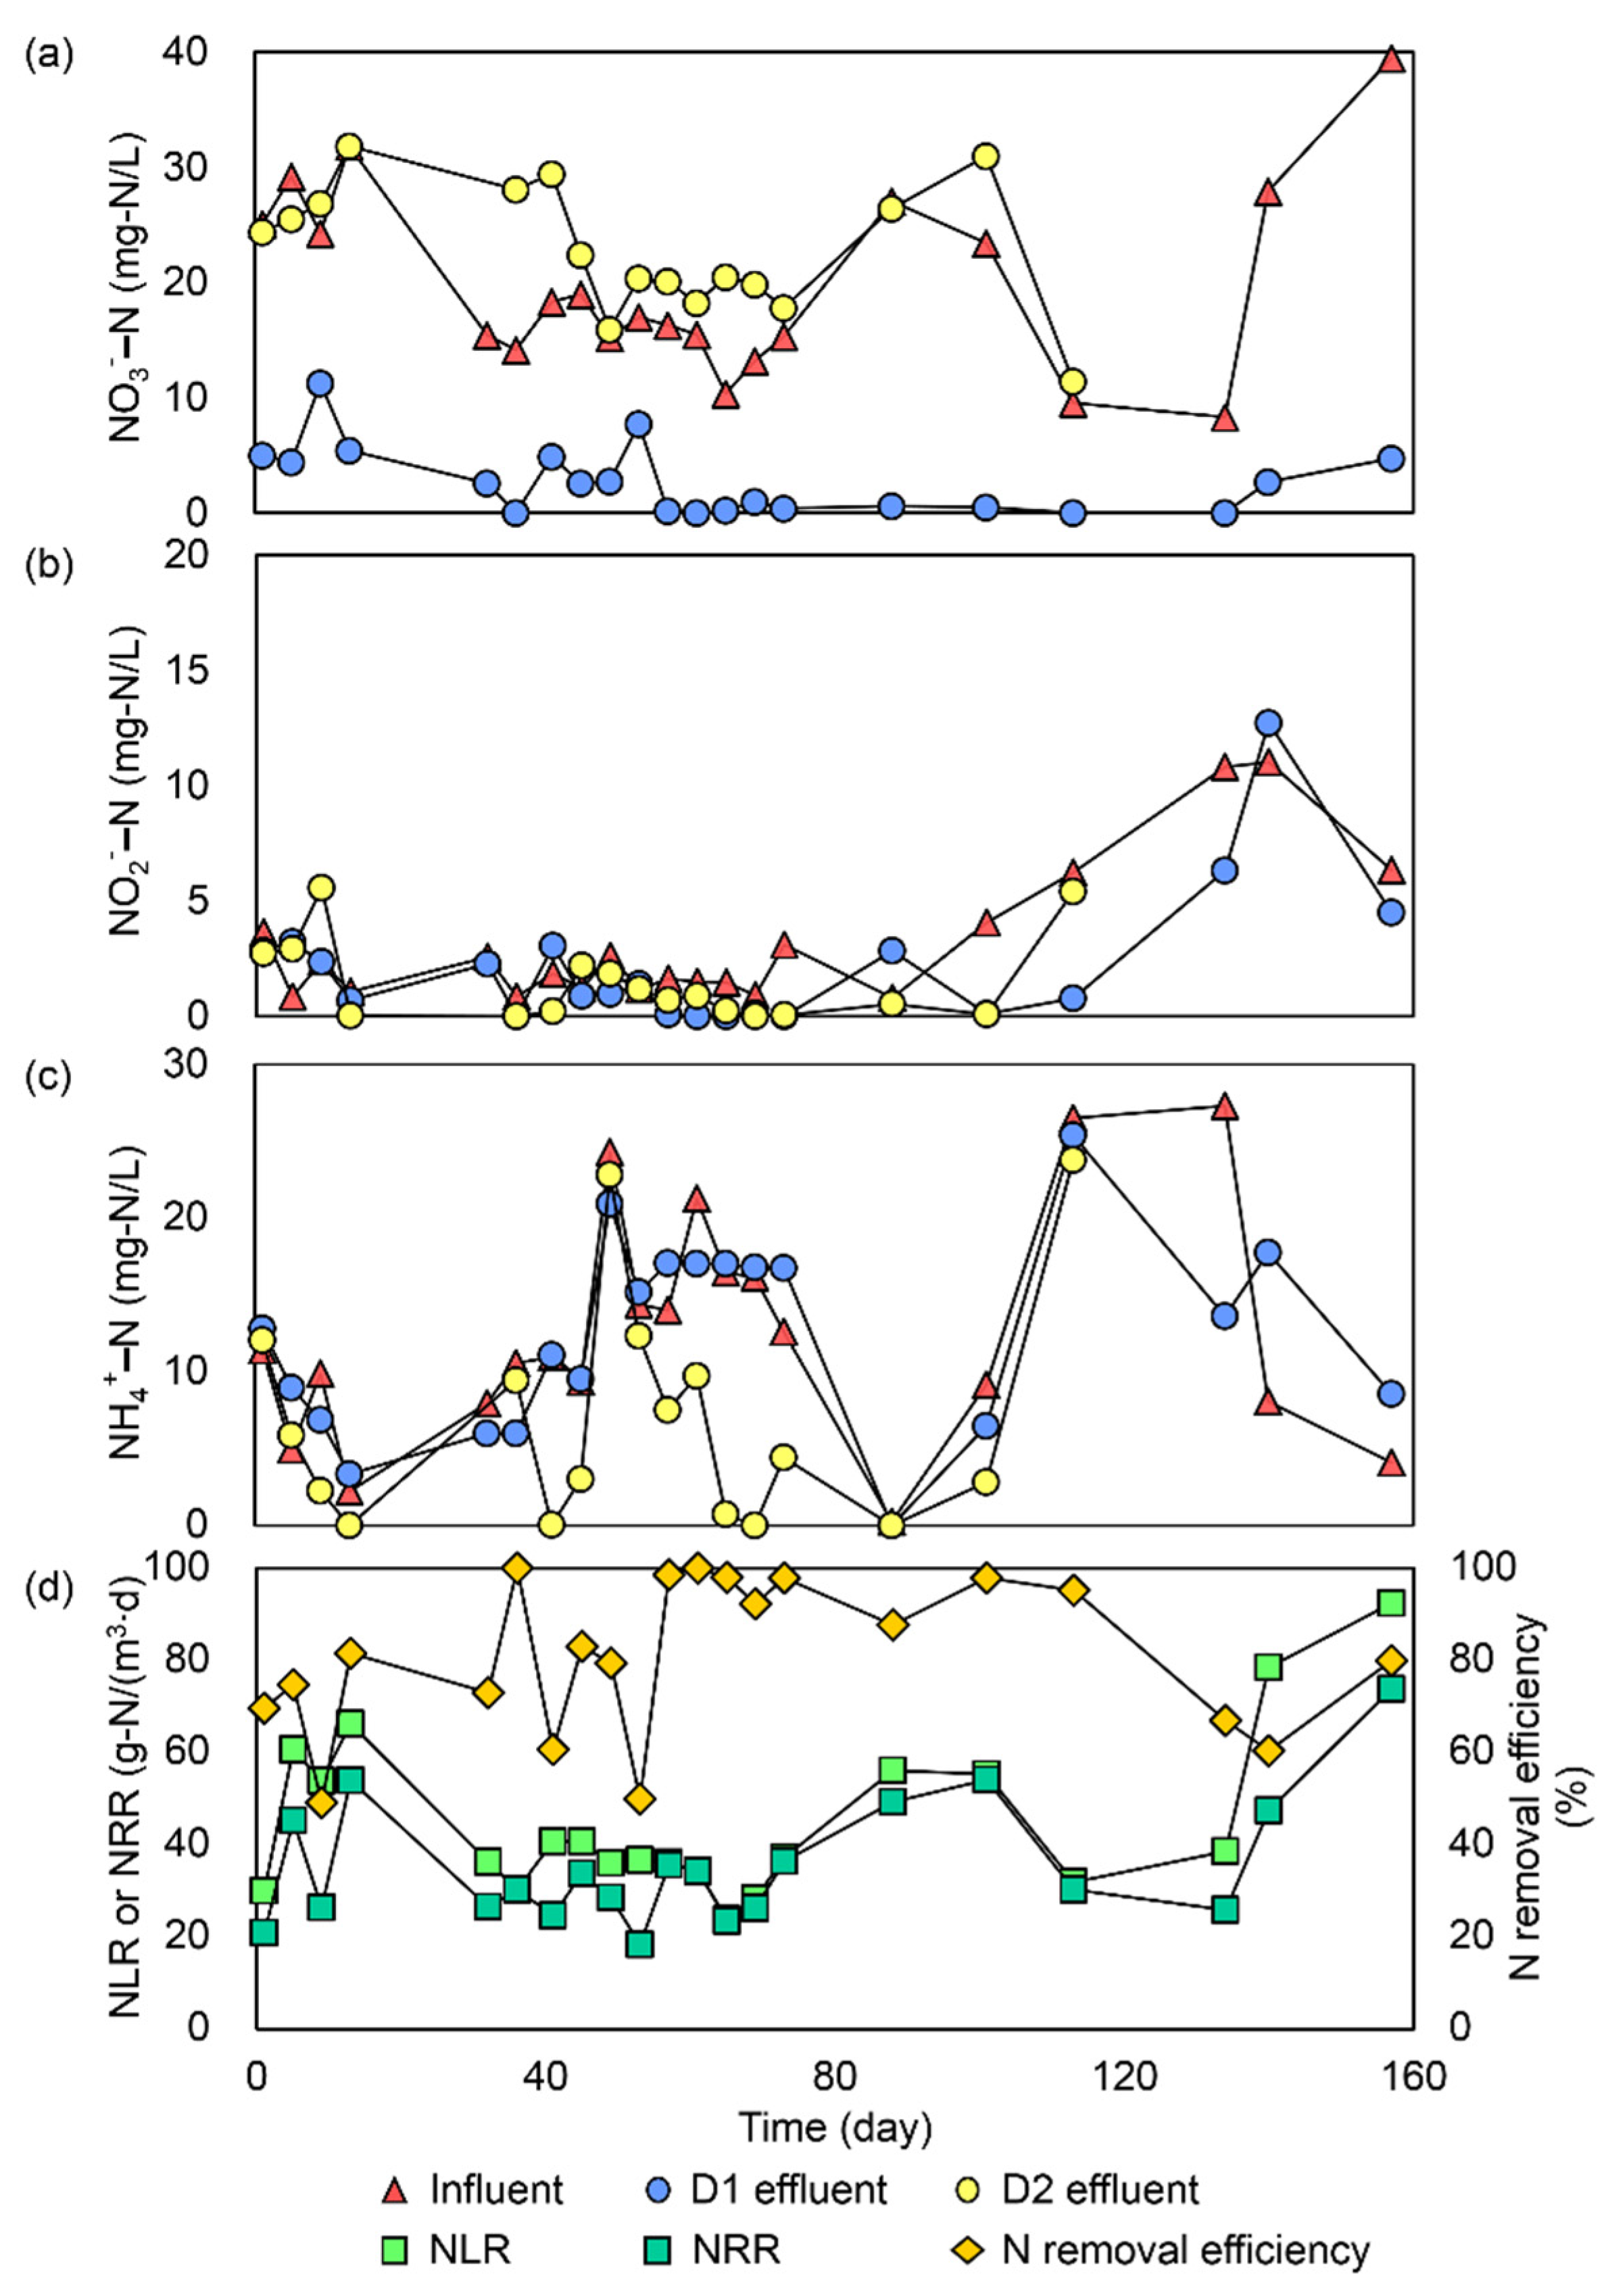
3.1. Variations in Nitrogen Concentrations

Figure 4 presents the variation in N-species concentrations. Clear NO3–N removal was observed in D1 as soon as the operation was initiated, and the NO3–N concentrations remained low with an average value of 2.7 ± 2.9 mg–N/L, even though the NO3–N concentrations in the influent fluctuated from 8.3 to 39.5 mg-N/L (Figure 4a). This demonstrates the rapid start-up ability of the HD and its stable performance even with the pretreated groundwater. The NO3–N threshold for drinking water, 11.3 mg–N/L [16], was met for the entire test period. D2, however, showed a slight increase in NO3–N concentration and a decrease in NH4+–N. The average NO3–N concentration of the D1 effluent was significantly lower (p < 0.001) than that of the influent and D2 effluent, which clearly shows the effectiveness of the HD process for NO3–N removal from raw groundwater.
The NO2–N concentration should be less than 0.9 mg-N/L for drinking water [16]. Although NO2–N concentrations in the D1 effluent were found to be close to 0 mg-N/L (Figure 4b), the average was 2.1 ± 2.9 mg-N/L and the NO2–N concentrations exceeded the limit in 11 out of the 21 samples taken. To avoid undesirable NO2–N accumulation in the system and enhance the complete denitrification, the abundant addition of HCO3 (more than 3000 mg/L) could be a potential option [25].
The fluctuation of NH4+–N concentrations in the influent is attributed to the performance of the nitrification system (Figure 4c), which should produce concentrations lower than 1.2 mg–N/L for drinking water in practical application. The simplified HD reactor did not significantly affect the changes in NH4+–N concentrations, which is consistent with previous research [43,44].
The nitrogen removal efficiencies of D1 gradually increased throughout the experiment and reached 100% on Day 61, with an average of 80.9 ± 16.1% (Figure 4d), whereas nitrogen removal was not found in D2. Additionally, NRR varied from 18.3 to 73.7 g–N/(m3∙d), while NLR fluctuated from 23.8 to 92.3 g–N/(m3∙d). Furthermore, the batch experiments revealed that the NO3–N removal and denitrification rate drastically increased compared to before the operation and Day 112 (Table 2). These results confirmed that the simplified HD reactor has rapid start-up ability, stability, and robustness for processing pretreated groundwater.

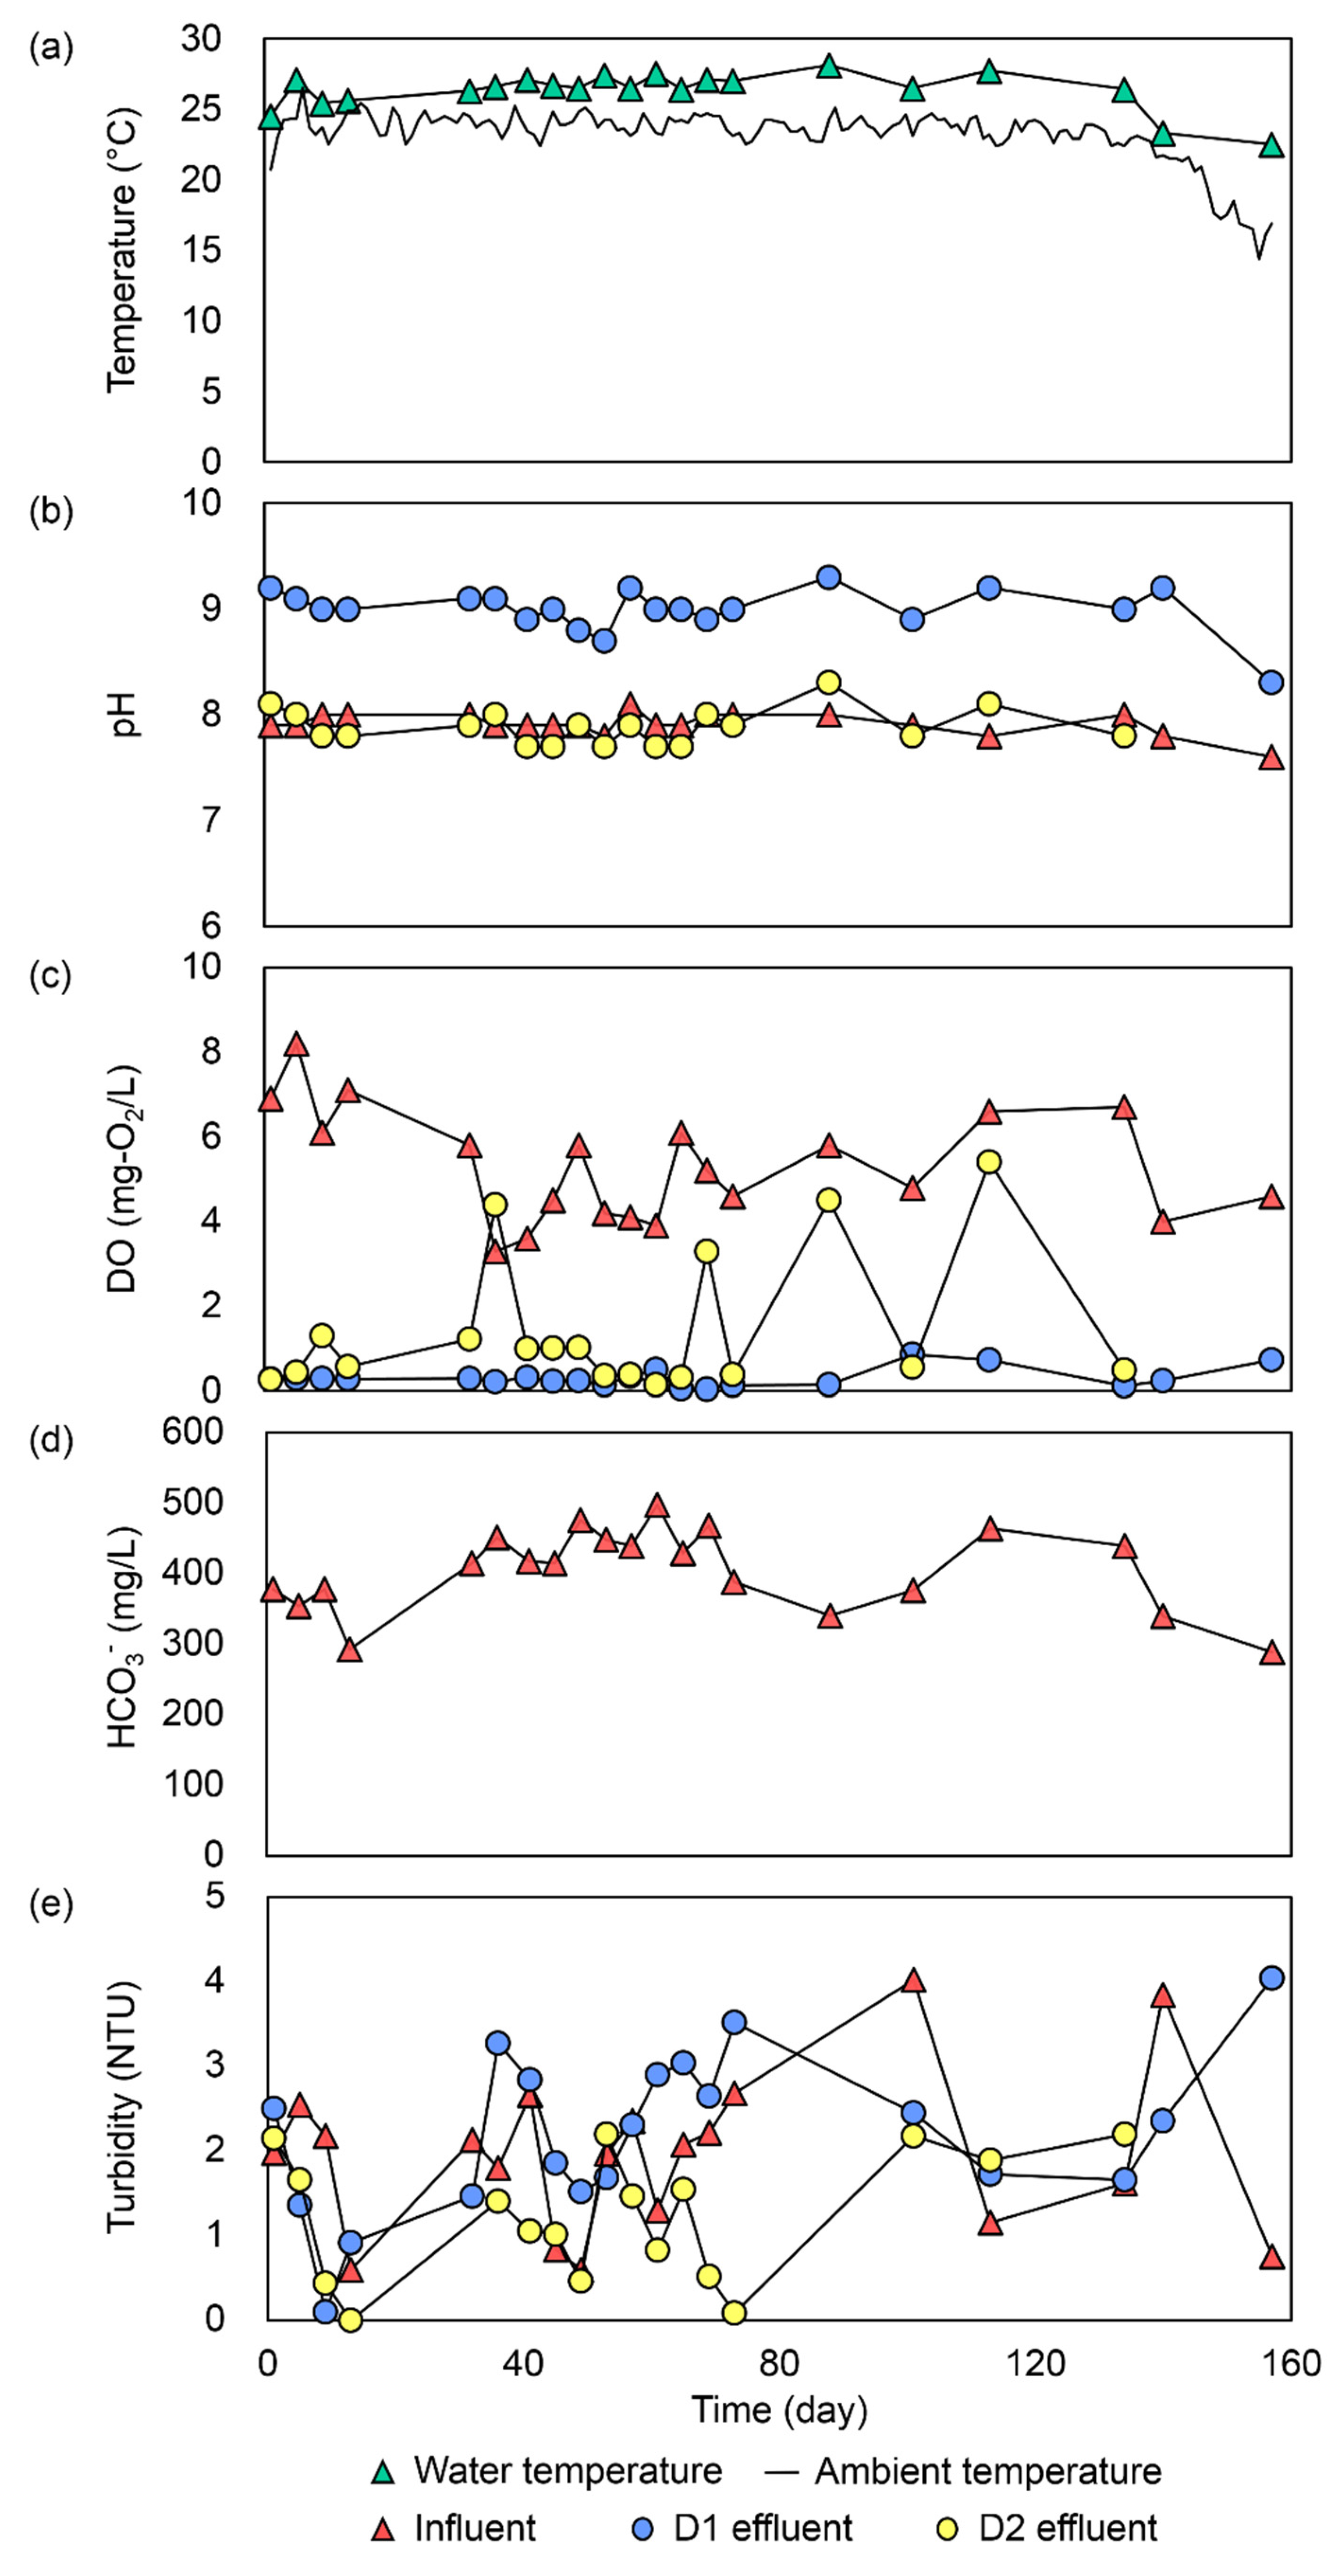
3.2. Ambient Condition and Changes in Operational Parameters

Figure 5a shows the variation of the average ambient temperature and the water temperature inside the reactors. The ambient temperature varied in the range of 14.4–26.5 °C, while the water temperature ranged from 22.5 to 28.1 °C. It is known that denitrification can occur over a wide range of temperatures, from 2 to 50 °C [45], and that HD occurs at temperatures between 15 and 50 °C [46]. Although a higher nitrate removal rate was obtained at higher temperatures [46], the HD efficiencies were maintained at a certain level (>70%) with a water temperature range of 15–30 °C [31]. In the present study, the water temperature inside the reactor stayed within this range for HD performance without temperature control.
The pH during HD usually increases because the process produces OH ions as a byproduct [25]. The average pH of the influent and the effluents of D1 and D2 were 7.9 ± 0.1, 9.0 ± 0.2, and 7.9 ± 0.2, respectively. The pH of the D1 effluent was significantly higher (p < 0.001) than that of the influent and D2 effluent (Figure 5b). These results indicate the occurrence of microbial activity in the D1 reactor.
The DO concentration in D1 was kept low, ranging from 0.05 to 0.87 (Figure 5c), with an average value of 0.3 ± 0.2 mg–O2/L, which could be the result of H2 gas supply and denitrification. Meanwhile, the DO concentrations in the influent and D2 ranged from 3.2 to 8.2 and 0.15 to 5.40 mg–O2/L, respectively. The effluent of the nitrification system contains high DO as previously reported [20], which is the same as the influent of the simplified HD reactor. However, the HD system can be inhibited by high DO concentrations [47,48], and Singhopon et al. has suggested that the DO value should be between 0.5 and 0.8 mg–O2/L to improve NRR [48]. In the present study, supplying H2 gas into the reactor was instrumental in maintaining the preferred range of DO concentrations for HD.
Figure 5d depicts the variations in HCO3 concentration during the operation. A total of 0.171 moles of HCO3 was consumed to remove 1 mole of NO3 based on the stoichiometry of the HD [49]. The maximum NO3–N concentration found in the influent during the operation was 39.5 mg–N/L; thus, approximately 30 mg/L of HCO3 would be required for the complete removal of NO3–N. In previous research, inorganic carbon sources were added to HD systems to improve stability [50], but this increases their operational costs. The average HCO3 concentration in the influent was 404.5 ± 56.8 mg/L. This shows that the groundwater in Jwagal naturally contains enough bicarbonate for the HD to proceed without additional inorganic carbon input.
Figure 5e profiles turbidity in the simplified HD reactor. Turbidity during the HD process has not been widely reported to date. The turbidity can influence not only the aesthetics or acceptability of drinking water but also disinfection treatment [51]; thus, it is important to know the impact of the simplified HD reactor on turbidity. In the case of household water treatment, the WHO suggests that turbidity should be at least less than 5 NTU, and ideally turbidity should be less than 1 NTU as regards aesthetics and disinfection efficiency [51]. In this study, turbidity was higher than 1 NTU, with averages of 2.0 ± 0.9, 2.2 ± 0.9, and 1.2 ± 0.7 NTU for the influent, D1 effluent, and D2 effluent, respectively. Thus, a post-treatment after the simplified HD reactor is recommended.

3.3. Comparison with Various HD Reactors

Most research on HD technologies developed for groundwater treatment has been conducted in laboratories using synthetic groundwater. To compare the reactor performance between synthetic and raw groundwater treatment, various studies on HD reactors are summarized in Table 3. In the table, experiments using different types of reactor, substrates, bacteria inoculums, temperatures, HRTs, H2 availability, influent NO3–N concentrations, carrier materials, reactor volumes, NLR, NRR, and nitrogen removal efficiencies are compared. The simplified HD reactor developed in this research exhibited nitrogen removal efficiencies as high as those of other reactors in Table 3 (~100%), and showed 73 g–N/(m3∙d) of NRR, which is higher than other techniques shown in Table 3, such as bio-ceramite reactors [31], heterotrophic denitrification coupled with electro-autotrophic denitrifying packed bed reactors [32], and HD with electrolytic reactors [36]. Although hollow fiber reactors [26], submerged membrane reactors [28], and membrane biofilm reactors [30] possessed higher NRR (110–770 g–N/(m3∙d)) than attached growth reactors, clogging often occurs using these techniques, necessitating frequent cleaning and cost for the replacement of the fiber or membrane [45]. Fluidized bed reactors can also achieve a high NRR (2160 g–N/(m3∙d)) [29]; however, the system itself is far more complicated and hence is difficult to control [45]. The unsaturated flow pressurized reactor also exhibited a high NRR (2100 g–N/(m3∙d)) and has simplicity, a small size, and is safe, although frequent cleaning of these reactors might be needed [33].
The NRR of the simplified HD reactor (73 g–N/(m3∙d)) was similar to that of suspended or attached growth reactors (e.g., 69.1 [23], 77.2 [24], and 78.4 g–N/(m3∙d) [34]). Higher NRRs of 167 and 107 g–N/(m3∙d) were obtained using attached growth reactors [19] for synthetic and raw groundwater, respectively. However, the supplied H2 gas for these two reactors was 23 mL/(min∙L), whereas 6 mL/(min∙L) was supplied for the simplified HD reactor developed in this study.
To ensure sustainability and the compatibility of the water treatment unit with local conditions, the simplified HD reactor was made out of an inexpensive jar that is available all over Nepal, resulting in a low initial cost for the installation of the reactor. It should be noted that the reactor was continuously operated for 157 days without temperature control, cleaning, or complex maintenance. This demonstrates the ease and simplicity of the system, which facilitates local engagement with the technology. Therefore, the simplified HD reactor is a more user-friendly option for NO3–N removal from groundwater in the Kathmandu Valley, Nepal.

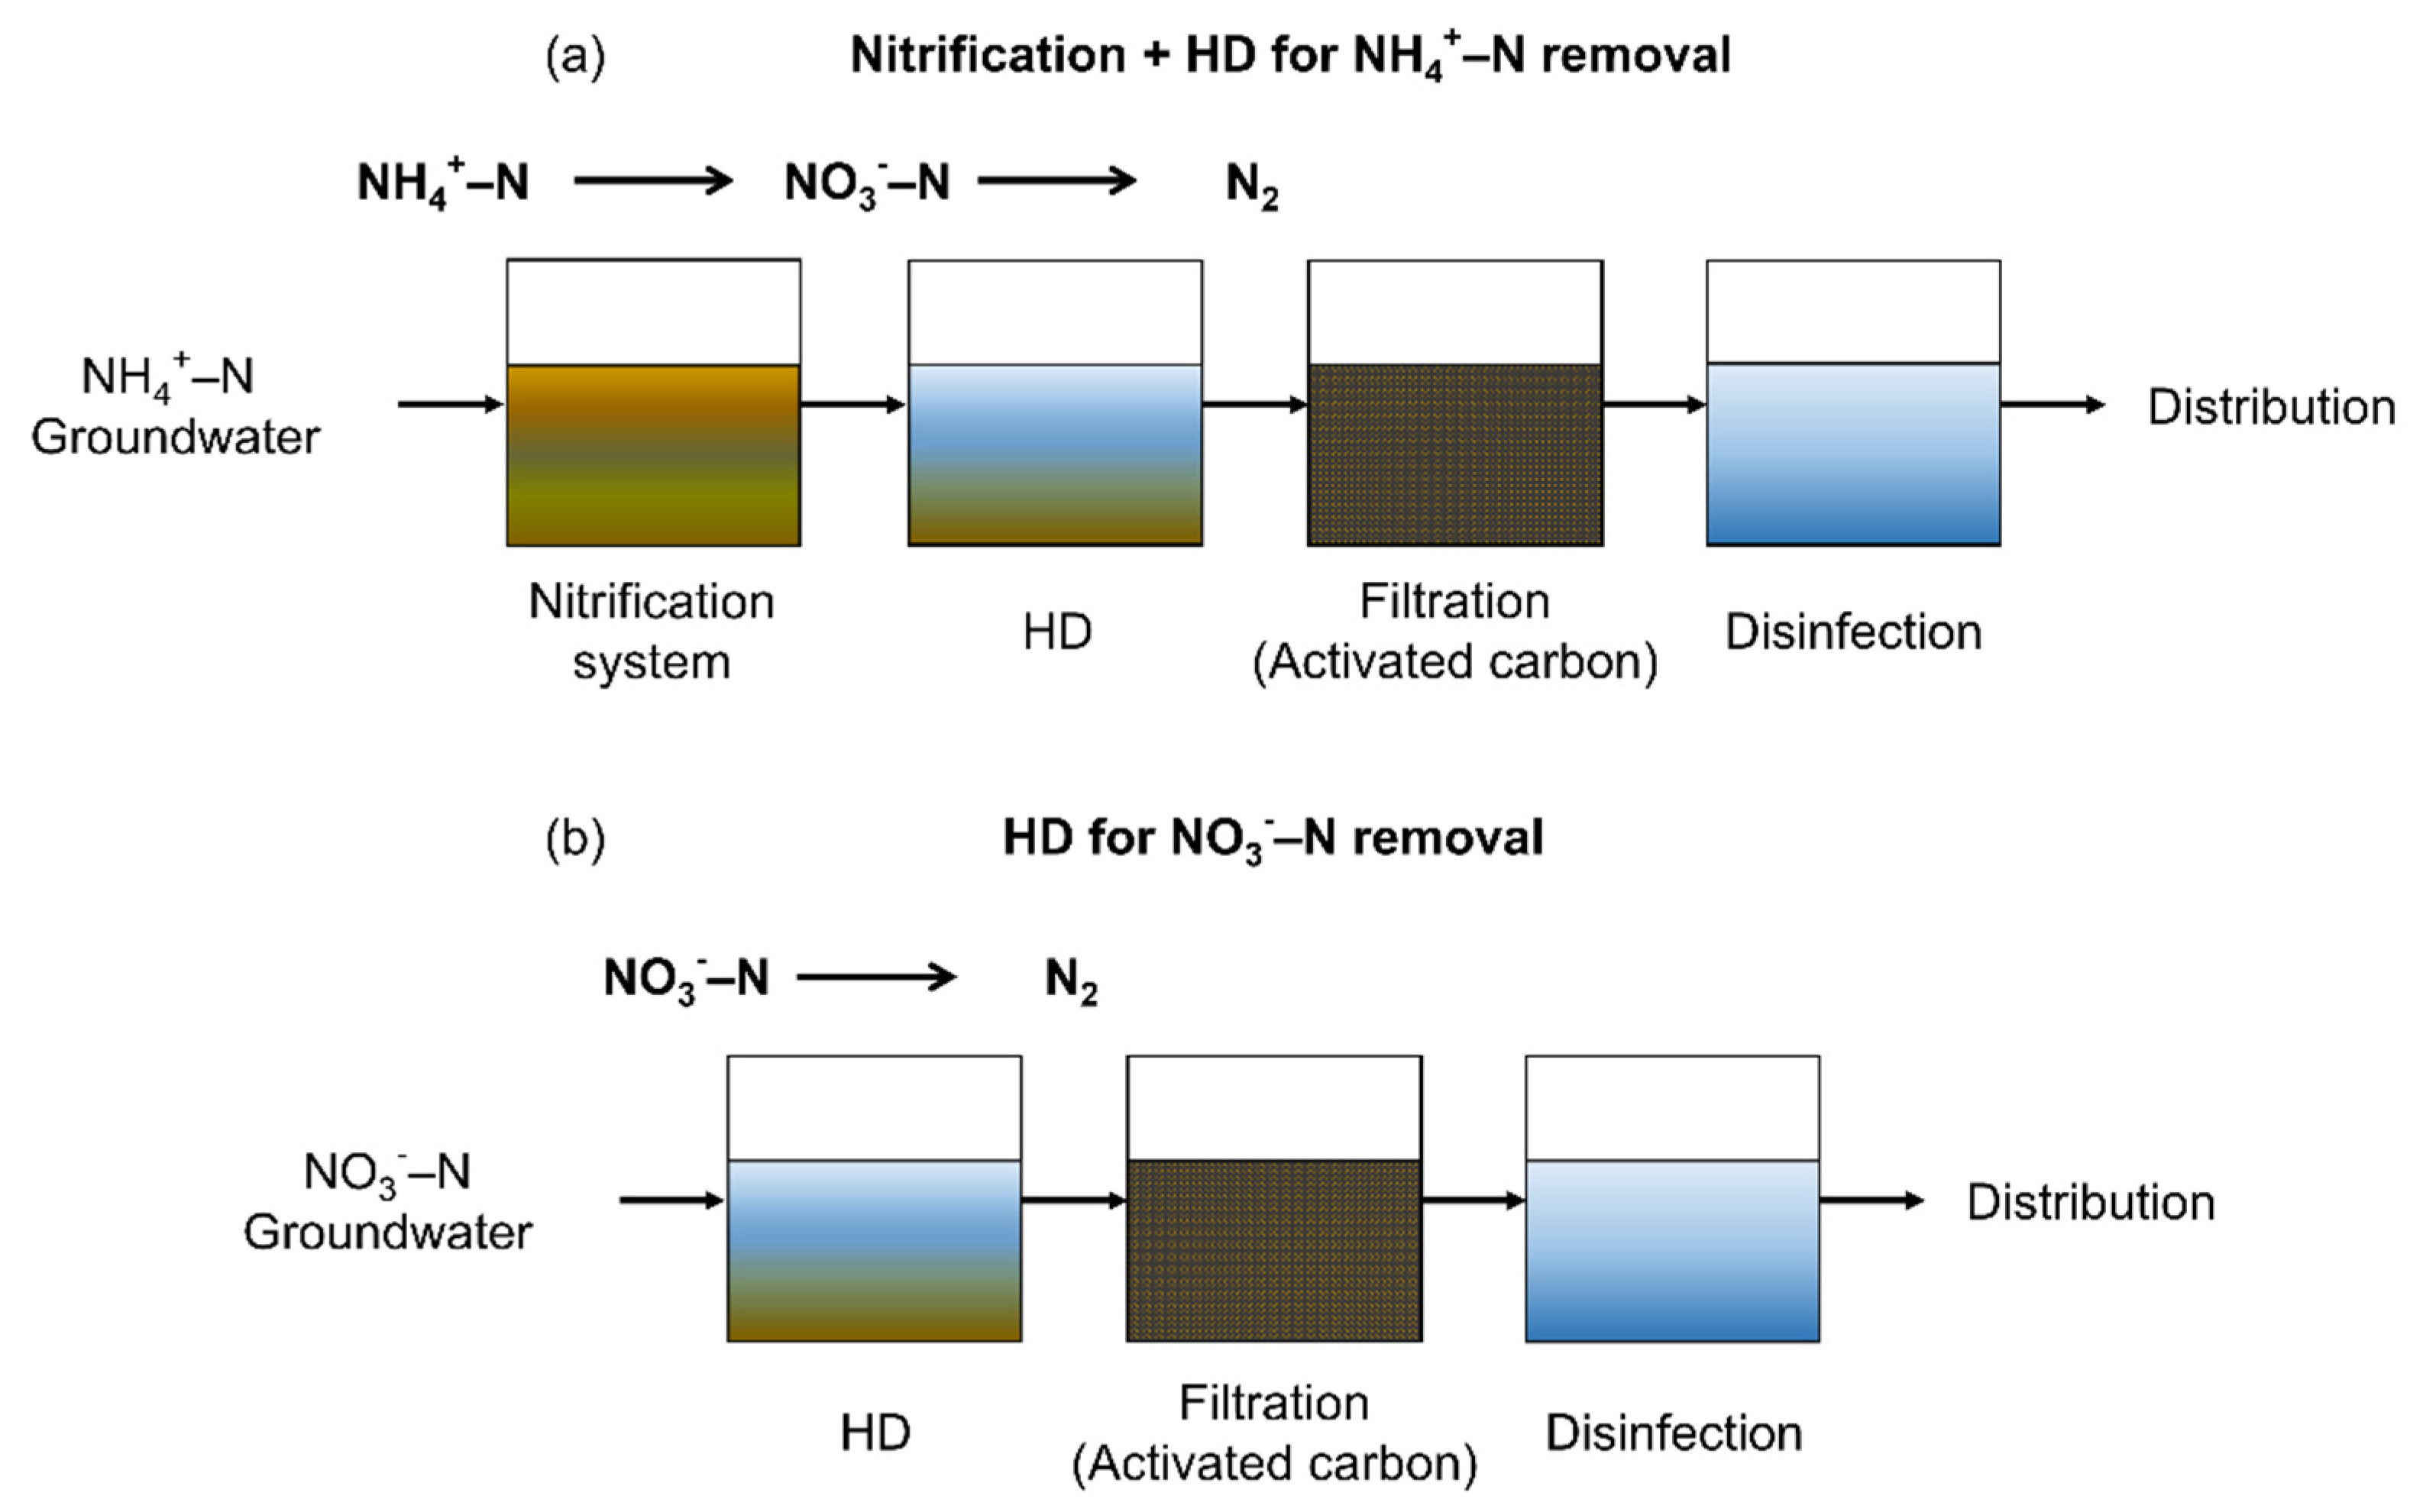
3.4. Application and Implementation of the Simplified HD Reactor

Groundwater in the Kathmandu Valley is contaminated by NH4+–N and NO3–N, as previously reported [11,12,13,14,15]. NH4+–N removal can be conducted by combining the previously developed nitrification system [18,19,20] and the simplified HD reactor developed in this study (Figure 6a), whereas NO3–N removal can be performed using the simplified HD reactor alone (Figure 6b). However, the simplified HD reactor sporadically emitted an odor during operation, which might affect the acceptability of the treated water. Therefore, filtration with activated carbon, followed by disinfection, is recommended for installation after the simplified HD reactor. The filtration with activated carbon is to remove the odor, turbidity, and dissolved organic compounds (if any) [40]. The activated carbon is recommended to be replaced on a yearly basis [40]. Although chlorination is more common in Nepal for water disinfection, ultra-violet (UV) disinfection could be a better alternative for household scale.
According to the results obtained in this study, the simplified HD reactor can currently produce 40 L of drinking water per day, operating with a working volume of 20 L and an HRT of 12 h. Basic water requirements comprise four basic human needs: drinking water for survival, water for human hygiene, water for sanitation services, and modest household needs for preparing food [52], and these needs are estimated to require 50 L per capita per day (LPCD) [52]. Although the current simplified HD reactor is not capable of meeting all of these basic water requirements, it could provide the drinking water and water for cooking for a household. The WHO estimates that daily drinking water consumption per capita is 2 L for adults, and it is reported that the average size of a family in Nepal is 4.6 persons [53]. Thus, it can be assumed that a household requires approximately 9–10 L of drinking water per day, which is consistent with the value of 9.4 L from previously reported questionnaire survey results [8]. Furthermore, water consumption for cooking was reported to be 3–6.5 LPCD, depending on household income [54], which is equivalent to 12–33 L for a household per day. Therefore, the simplified HD reactor can cover the water requirements for drinking and cooking purposes at the household level.
In the present study, H2 gas was supplied from a water electrolytic H2 generator, resulting in high installation costs and frequent maintenance, such as the need to add water and replace the generator’s drying agent [40]. Frequent power cuts in Nepal [55], which interrupt the operation of H2 generators, should also be considered. In the long run, the generator should be substituted with easier and cheaper alternatives, and H2 should be efficiently used to reduce maintenance and cost. Furthermore, the sponge materials used in this study were not locally available; thus, a simplified HD reactor with locally available materials should be tested to investigate treatment capacities using possible substitutes for the current sponge material.

4. Conclusions

A case study was conducted to develop a simplified HD reactor using as many locally available materials as possible, and the reactor was installed in the Kathmandu Valley, Nepal to evaluate its effectiveness, understand its behavior under on-site conditions, and fill the gap in knowledge between laboratory and practical applications. NO3–N removal by the reactor was found to be effective, and the reactor showed rapid start-up ability, stability, and robustness against pretreated groundwater. The reactor had an average nitrogen removal efficiency of 80.9 ± 16.1%, while NLR and NRR varied from 23.8 to 92.3 g–N/(m3∙d) and from 18.3 to 73.7 g−N/(m3∙d), respectively. The simplified HD reactor can be operated under on-site conditions without temperature control, supplementary DO concentration control, an additional inorganic carbon source, or internal cleaning. Compared to the results of previous research, the simplified HD reactor was considered a more user-friendly option for people in the Kathmandu Valley, Nepal. Additionally, the reactor is recommended for groundwater treatment at the household level, as it can currently produce 40 L/d, fulfilling the daily requirements for drinking and cooking water in a household with 4–5 people. The findings of this research would be helpful for practical applications of HD in developing countries.

Author Contributions

Writing—original draft, K.S.; Writing—review and editing, A.K.M., T.S., S.R., B.M.S., T.K., R.E., and F.K.; Conceptualization, K.S., R.E., and F.K.; Investigation, K.S., A.K.M., R.M., and Y.T.; formal analysis, K.S., R.M., and Y.T.; Methodology, K.S., Y.T., and R.E.; Visualization, K.S. and B.M.S.; Supervision, F.K. All authors have read and agreed to the published version of the manuscript.

Funding

This research received no external funding.

Institutional Review Board Statement

Not applicable.

Informed Consent Statement

Not applicable.

Data Availability Statement

Data sharing not applicable.

Acknowledgments

We would like to thank Assoc. Iswar Man Amatya from Tribhuvan University for his useful suggestions on this study. This research was performed with partial financial assistance from the “Project for Hydro-Microbiological Approach for Water Security in Kathmandu Valley, Nepal” under the Science and Technology Research Partnership for Sustainable Development (SATREPS) program of the Japan Science and Technology Agency (JST) and JICA, Japan Society for the Promotion of Science (JSPS) KAKENHI, Japan, Grant Number 19J13824, and the “Study Abroad and Human Resources Development Grant for Young Students” funded by Yamanashi Prefecture.

Conflicts of Interest

The authors declare no conflict of interest.

References

  1. United Nations (UN). Sustainable Development Goals. 2016. Available online: http://www.un.org/sustainabledevelopment/sustainable-development-goals/ (accessed on 18 November 2020).
  2. Tamrakar, N.K.; Manandhar, K.C. Institutional Capacity Assessment of KUKL; Ministry of Urban Development (MOUD): Kathmandu, Nepal; Japan International Cooperation Agency (JICA): Tokyo, Japan, 2016.
  3. Pradhan, B.; Sharma, P.; Pradhan, K.P. Urban Growth and Environment and Health Hazards in Kathmandu Valley, Nepal. In Urban Health Risk and Resilience in Asian Cities; Singh, R.B., Srinagesh, B., Anand, S., Eds.; Springer: Singapore, 2020; pp. 293–324. [Google Scholar] [CrossRef]
  4. Kathmandu Upatyaka Khanepani Limited (KUKL). Annual Report of Kathmandu Upatyaka Khanepani Limited; Kathmandu Upatyaka Khanepani Limited: Kathmandu, Nepal, 2020. [Google Scholar]
  5. Shrestha, S.; Aihara, Y.; Bhattarai, A.P.; Bista, N.; Rajbhandari, S.; Kondo, N.; Kazama, F.; Nishida, K.; Shindo, J. Dynamics of domestic water consumption in the urban area of the Kathmandu Valley: Situation analysis pre and post 2015 Gorkha earthquake. Water 2017, 9, 222. [Google Scholar] [CrossRef] [Green Version]
  6. Ojha, R.; Thapa, B.R.; Shrestha, S.; Shindo, J.; Ishidaira, H.; Kazama, F. Water price optimization after the Melamchi Water Supply Project: Ensuring affordability and equitability for consumer’s water use and sustainability for utilities. Water 2018, 10, 249. [Google Scholar] [CrossRef] [Green Version]
  7. Ojha, R.; Thapa, B.R.; Shrestha, S.; Shindo, J.; Ishidaira, H.; Kazama, F. Water taxation and subsidy analysis based on consumer water use behavior and water sources inside the Kathmandu Valley. Water 2018, 10, 1802. [Google Scholar] [CrossRef] [Green Version]
  8. Shrestha, K.B.; Thapa, B.R.; Aihara, Y.; Shrestha, S.; Bhattarai, A.P.; Bista, N.; Kazama, F.; Shindo, J. Hidden cost of drinking water treatment and its relation with socioeconomic status in Nepalese urban context. Water 2018, 10, 607. [Google Scholar] [CrossRef] [Green Version]
  9. Shrestha, K.B.; Kamei, T.; Shrestha, S.; Aihara, Y.; Bhattarai, A.P.; Bista, N.; Thapa, B.R.; Kazama, F.; Shindo, J. Socioeconomic impacts of LCD-treated drinking water distribution in an urban community in the Kathmandu Valley, Nepal. Water 2019, 11, 1323. [Google Scholar] [CrossRef] [Green Version]
  10. Ito, Y.; Malla, S.S.; Bhattarai, A.P.; Haramoto, E.; Shindo, J.; Nishida, K. Waterborne diarrhoeal infection risk from multiple water sources and the impact of an earthquake. J. Water Health 2020, 18, 464–476. [Google Scholar] [CrossRef]
  11. Shakya, B.M.; Nakamura, T.; Kamei, T.; Shrestha, S.D.; Nishida, K. Seasonal groundwater quality status and nitrogen contamination in the shallow aquifer system of the Kathmandu Valley, Nepal. Water 2019, 11, 2184. [Google Scholar] [CrossRef] [Green Version]
  12. Khatiwada, N.R.; Takizawa, S.; Tran, T.V.N.; Inoue, M. Groundwater contamination assessment for sustainable water supply in Kathmandu Valley, Nepal. Water Sci. Technol. 2002, 46, 147–154. [Google Scholar] [CrossRef]
  13. Warner, N.R.; Levy, J.; Harpp, K.; Farruggia, F. Drinking water quality in Nepal’s Kathmandu Valley: A survey and assessment of selected controlling site characteristics. Hydrogeol. J. 2008, 16, 321–334. [Google Scholar] [CrossRef]
  14. Pathak, D.R.; Hiratsuka, A. An investigation of nitrate and iron concentrations and their relationship in shallow groundwater systems of Kathmandu. Desalin. Water Treat. 2010, 19, 191–197. [Google Scholar] [CrossRef]
  15. Chapagain, S.K.; Pandey, V.P.; Shrestha, S.; Nakamura, T.; Kazama, F. Assessment of deep groundwater quality in Kathmandu Valley using multivariate statistical techniques. Water Air Soil Pollut. 2009, 210, 277–288. [Google Scholar] [CrossRef]
  16. World Health Organization (WHO). Guidelines for Drinking-Water Quality, 4th ed.; World Health Organization (WHO): Geneva, Switzerland, 2017. [Google Scholar]
  17. Ward, M.; Jones, R.; Brender, J.; de Kok, T.; Weyer, P.; Nolan, B.; Villanueva, C.; van Breda, S. Drinking water nitrate and human health: An updated review. Int. J. Environ. Res. Public Health 2018, 15, 1557. [Google Scholar] [CrossRef] [PubMed] [Green Version]
  18. Khanitchaidecha, W.; Shakya, M.; Nagano, Y.; Kazama, F. NH4-N removal from groundwater using attached growth reactor: Case study in Chyasal, Nepal. In IPCBEE Vol. 18; International Conference on Biotechnology and Environment Management, Singapore, 2011; IACSIT Press: Singapore, 2011. [Google Scholar]
  19. Khanitchaidecha, W.; Shakya, M.; Kamei, T.; Kazama, F. NH4-N removal through nitrification and hydrogenotrophic denitrification in simple attached growth reactors. Water Air Soil Pollut. 2012, 223, 3939–3953. [Google Scholar] [CrossRef]
  20. Maharjan, A.K.; Kamei, T.; Amatya, I.M.; Mori, K.; Kazama, F.; Toyama, T. Ammonium-nitrogen (NH4+–N) removal from groundwater by a dropping nitrification reactor: Characterization of NH4+–N transformation and bacterial community in the reactor. Water 2020, 12, 599. [Google Scholar] [CrossRef] [Green Version]
  21. Shinoda, K.; Rujakom, S.; Singhopon, T.; Eamrat, R.; Kamei, T.; Kazama, F. Effects of Carrier Filling Ratio on Hydrogenotrophic Denitrification (HD) Performance. Jpn. J. Water Treat. Biol. 2020, 56, 67–78. [Google Scholar] [CrossRef]
  22. Rezvani, F.; Sarrafzadeh, M.-H.; Ebrahimi, S.; Oh, H.-M. Nitrate removal from drinking water with a focus on biological methods: A review. Environ. Sci. Pollut. Res. 2019, 26, 1124–1141. [Google Scholar] [CrossRef] [PubMed]
  23. Khanitchaidecha, W.; Kazama, F. Hydrogenotrophic denitrification in an attached growth reactor under various operating conditions. Water Supply 2012, 12, 72–81. [Google Scholar] [CrossRef]
  24. Eamrat, R.; Tsutsumi, Y.; Kamei, T.; Khanichaidecha, W.; Tanaka, Y.; Kazama, F. Optimization of hydrogenotrophic denitrification behavior using continuous and intermittent hydrogen gas supply. J. Water Environ. Technol. 2017, 15, 65–75. [Google Scholar] [CrossRef] [Green Version]
  25. Rujakom, S.; Shinoda, K.; Singhopon, T.; Nakano, M.; Kamei, T.; Kazama, F. Effect of Bicarbonate on the Performance of Hydrogen-based Denitrification at Different Hydraulic Retention Times. Jpn. J. Water Treat. Biol. 2020, 56, 33–45. [Google Scholar] [CrossRef]
  26. Ergas, S.J.; Reuss, A.F. Hydrogenotrophic denitrification of drinking water using a hollow fibre membrane bioreactor. J. Water Supply Res. Tech. Aqua 2001, 50, 161–171. [Google Scholar] [CrossRef]
  27. Mo, H.; Oleszkiewicz, J.A.; Cicek, N.; Rezania, B. Incorporating membrane gas diffusion into a membrane bioreactor for hydrogenotrophic denitrification of groundwater. Water Sci. Technol. 2005, 51, 357–364. [Google Scholar] [CrossRef]
  28. Rezania, B.; Oleszkiewicz, J.A.; Cicek, N. Hydrogen-dependent denitrification of water in an anaerobic submerged membrane bioreactor coupled with a novel hydrogen delivery system. Water Res. 2007, 41, 1074–1080. [Google Scholar] [CrossRef]
  29. Komori, M.; Sakakibara, Y. High-rate hydrogenotrophic denitrification in a fluidized-bed biofilm reactor using solidpolymer-electrolyte membrane electrode (SPEME). Water Sci. Technol. 2008, 58, 1441–1446. [Google Scholar] [CrossRef]
  30. Xia, S.; Zhong, F.; Zhang, Y.; Li, H.; Yang, X. Bio-reduction of nitrate from groundwater using a hydrogen-based membrane biofilm reactor. J. Environ. Sci. 2010, 22, 257–262. [Google Scholar] [CrossRef]
  31. Chen, D.; Yang, K.; Wang, H.; Lv, B. Nitrate removal from groundwater by hydrogen-fed autotrophic denitrification in a bio-ceramsite reactor. Water Sci. Technol. 2014, 69, 2417–2422. [Google Scholar] [CrossRef]
  32. Peng, T.; Feng, C.; Hu, W.; Chen, N.; He, Q.; Dong, S.; Xu, Y.; Gao, Y.; Li, M. Treatment of nitrate-contaminated groundwater by heterotrophic denitrification coupled with electro-autotrophic denitrifying packed bed reactor. Biochem. Eng. J. 2018, 134, 12–21. [Google Scholar] [CrossRef]
  33. Epsztein, R.; Beliavski, M.; Tarre, S.; Green, M. Pressurized hydrogenotrophic denitrification reactor for small water systems. J. Environ. Manag. 2018, 216, 315–319. [Google Scholar] [CrossRef] [PubMed]
  34. Eamrat, R.; Tsutsumi, Y.; Kamei, T.; Khanitchaidecha, W.; Ito, T.; Kazama, F. Microbubble application to enhance hydrogenotrophic denitrification for groundwater treatment. Env. Nat. Res. J. 2020, 18, 156–165. [Google Scholar] [CrossRef] [Green Version]
  35. Rezvani, F.; Sarrafzadeh, M.-H.; Oh, H.-M. Hydrogen producer microalgae in interaction with hydrogen consumer denitrifiers as a novel strategy for nitrate removal from groundwater and biomass production. Algal Res. 2020, 45, 101747. [Google Scholar] [CrossRef]
  36. Inagaki, Y.; Yamada, D.; Komori, M.; Sakakibara, Y. Field application of hydrogenotrophic denitrification with two-stage injection of electrolytic hydrogen. J. Water Process Eng. 2020, 38, 101685. [Google Scholar] [CrossRef]
  37. Shakya, B.M.; Nakamura, T.; Shrestha, S.D.; Nishida, K. Identifying the deep groundwater recharge processes in an intermountain basin using the hydrochemical and water isotope characteristics. Hydrol. Res. 2019, 50, 1216–1229. [Google Scholar] [CrossRef] [Green Version]
  38. Japan International Cooperation Agency (JICA). Report of JICA WaSH-Mia/SATREPS Project for Symposium on Hydro-Microbiological Approach for Water Security in Kathmandu Valley, Nepal; Japan International Cooperation Agency (JICA): Kathmandu, Nepal, 2019.
  39. Raina, A.; Zhao, J.; Wu, X.; Kunwar, L.; Whittington, D. The structure of water vending markets in Kathmandu, Nepal. Water Policy 2019, 21, 50–75. [Google Scholar] [CrossRef]
  40. Interdisciplinary Centre for River Basin Environment (ICRE). WaSH-Mia/SATREPS: Manual No. 4-2 Handbook for Installation, Operation, and Maintenance of Locally Fitted, Compact, and Distributed (LCD) Water Treatment System; Japan International Cooperation Agency (JICA): Kathmandu, Nepal, 2019.
  41. APHA/AWWA/WEF. Standard Methods for the Examination of Water and Wastewater, 22nd ed.; Rice, E.W., Baird, R.B., Eaton, A.D., Clesceri, L.S., Eds.; American Public Health Association, American Water Works Association, Water Environment Federation: Washington, DC, USA, 2012. [Google Scholar]
  42. Historical Weather and Climate Data. Available online: https://meteostat.net/en/place/NP-0W5S?t=2017-05-30/2017-11-23 (accessed on 7 December 2020).
  43. Sunger, N.; Bose, P. Autotrophic denitrification using hydrogen generated from metallic iron corrosion. Bioresour. Technol. 2009, 100, 4077–4082. [Google Scholar] [CrossRef] [PubMed]
  44. Wang, H.; He, Q.; Chen, D.; Wei, L.; Zou, Z.; Zhou, J.; Yang, K.; Zhang, H. Microbial community in a hydrogenotrophic denitrification reactor based on pyrosequencing. Environ. Biotech. 2015, 99, 10829–10837. [Google Scholar] [CrossRef]
  45. Karanasios, K.A.; Vasiliadou, I.A.; Pavlou, S.; Vayenas, D.V. Hydrogenotrophic denitrification of potable water: A review. J. Hazard. Mater. 2010, 180, 20–37. [Google Scholar] [CrossRef]
  46. Li, P.; Wang, Y.; Zuo, J.; Wang, R.; Zhao, J.; Du, Y. Nitrogen removal and N2O accumulation during hydrogenotrophic denitrification: Influence of environmental factors and microbial community characteristics. Environ. Sci. Technol. 2017, 51, 870–879. [Google Scholar] [CrossRef] [PubMed]
  47. Grießmeier, V.; Leberecht, K.; Gescher, J. NO3 removal efficiency in field denitrification beds: Key controlling factors and main implications. Environ. Microbiol. Rep. 2019, 11, 316–329. [Google Scholar] [CrossRef]
  48. Singhopon, T.; Shinoda, K.; Rujakom, S.; Kazama, F. Hydrogenotrophic denitrification for treating nitrate contaminated without/with reactive black 5 dye. J. Water Reuse Desalin. 2020, 10, 200–213. [Google Scholar] [CrossRef]
  49. Rujakom, S.; Shinoda, K.; Kamei, T.; Kazama, F. Investigation of hydrogen-based denitrification performance on nitrite accumulation under various bicarbonate doses. Env. Asia 2019, 12, 54–63. [Google Scholar] [CrossRef]
  50. Zhao, Y.; Zhang, B.; Feng, C.; Huang, F.; Zhang, P.; Zhang, Z.; Yang, Y.; Sugiura, N. Behavior of autotrophic denitrification and heterotrophic denitrification in an intensified biofilm-electrode reactor for nitrate-contaminated drinking water treatment. Bioresour. Technol. 2012, 107, 159–165. [Google Scholar] [CrossRef]
  51. World Health Organization (WHO). Water Quality and Health-Review of Turbidity: Information for Regulators and Water Suppliers; World Health Organization (WHO): Geneva, Switzerland, 2017. [Google Scholar]
  52. Gleick, P.H. Basic water requirements for human activities: Meeting basic needs. Water Int. 1996, 21, 83–92. [Google Scholar] [CrossRef]
  53. Central Bureau of Statistics—National Planning Commission Secretariat, Government of Nepal. Annual Household Survey 2015–2016; Central Bureau of Statistics: Kathmandu, Nepal, 2017.
  54. Pasakhala, B.; Harada, H.; Fujii, S.; Tanaka, S.; Shivakoti, B.R.; Shrestha, S. Household coping measures with water scarcity: A case study in Kathmandu, Nepal. J. Japan Soc. Civ. Eng. 2013, 69, 73–81. [Google Scholar] [CrossRef] [Green Version]
  55. Shrestha, R.S. Electricity crisis (Load Shedding) in Nepal, Its Manifestations and Ramifications. Hydro Nepal 2010, 6, 7–17. [Google Scholar] [CrossRef]
Figure 1. (a) Location and (b) picture of the experiment site in Jwagal in the Kathmandu Valley.
Water 13 00444 g001
Figure 2. Schematic of the existing water treatment system operated by KUKL in Jwagal.
Water 13 00444 g002
Figure 3. Schematic of the simplified HD reactor.
Water 13 00444 g003
Figure 4. Profiles of (a) NO3–Nconcentrations, (b) NO2–N concentrations, (c) NH4+–N concentrations, and (d) the nitrogen loading rate (NLR), nitrogen removal rate (NRR), and nitrogen (NO3–N + NO2–N) removal efficiencies of D1.
Water 13 00444 g004
Figure 5. Variations of operating conditions: (a) temperature, (b) pH, (c), dissolved oxygen (DO) concentrations, (d) HCO3 concentrations, (e) turbidity during the operation.
Water 13 00444 g005
Figure 6. Proposed layout ((a) NH4+–N removal and (b) NO3–N removal) of groundwater treatment in the Kathmandu Valley.
Water 13 00444 g006
Table 1. Composition of the raw groundwater in Jwagal in the Kathmandu Valley.
ParameterConcentrations (mg/L)Reference
NH4+–N41.2–57.3[11]
NO3–N0.4–3.4[11]
Na+61[37]
K+12[37]
Ca2+68.8[37]
Mg2+14[37]
Cl2.1[37]
SO42-Not detected[37]
HCO3-579.5[37]
Fe2+9.9–10.9This study
DOC (dissolved organic carbon)10.6–14.0This study
pH6.29–6.79This study
Table 2. Changes in nitrogen removal rate resulting from the batch experiments.
DayNO3–N Removal Rate
(mg-N/L/d)
Denitrification Rate
(mg-N/L/d)
Before Operation7.54.2
Day 11220.326.7
Table 3. Comparison of reactor performance and operating conditions.
ReactorSubstrateBacteria InoculumTemperature (°C)HRT
(d or h)
Flow Rate (mL/min)
H2 Flow Rate (mL/min)
H2 Pressure (MPa or atm)
DH (mg/L)
Applied Current (A)
NO3–N (mg-N/L)Carrier Materials Reactor Volume (L)NLR
(g-N/(m3∙d))
NRR
(g-N/(m3∙d))
Max or Average Efficiency (%)Reference
Hollow fiber Well water and synthetic groundwater Biomass from an anoxic rotating biological reactor in a wastewater treatment plant 4.1 h0.3–0.6 atm145Polypropylene hollow fiber1.2770770100[26]
Suspended growth membraneSynthetic groundwater Enriched autotrophic denitrifying biomass16.0 ± 1.112 hDH 1.648 737.737.7100[27]
Submerged membraneSynthetic groundwater HD bacteria25–283 hDH 1.625Hollow fiber membrane5.6110110100[28]
Fluidized-bed biofilm using solid-polymer electrolyte membraneSynthetic groundwater 301 h4.0 A20–90Polyvinyl alcohol2.221602160100[29]
Membrane biofilmSynthetic drinking water Anaerobic activated sludge 0.5 h0.05 MPa10Hollow fiber0.02448038480[30]
Attached growth Synthetic groundwater Activated sludge306.7 h70 mL/min20Fiber371.769.196.4[23]
Attached growthSynthetic groundwater Activated sludge 2.7 h70 mL/min20Fiber carrier317616790[19]
Bio-ceramiteSynthetic wastewaterAnaerobic activated sludge3024 h 0.01 MPa30Ceramite2.33028.996.2[31]
Suspended growthSynthetic groundwater Enriched HD bacteria in lab32 ± 0.512 h 15 mL/min 40 28077.296.5[24]
Heterotrophic denitrification coupled with electro-autotrophic denitrifying packed bed Synthetic groundwater Activated sludge Room temperature24 h0.1 A50Haycite
Pine sawdust
27.527.299[32]
Unsaturated-flow pressurized Synthetic groundwater HD bacteria in lab25.5 ± 1430 mL/minDH1.525Plastic biofilm 21002100100[33]
Suspended growthSynthetic groundwaterEnriched HD bacteria in lab32 ± 0.512 h1 mL/min40 28078.498[34]
Attached growth Synthetic groundwater Enriched HD bacteria in lab32 ± 14 h40 mL/min40Polyolefin sponge2210209.998[21]
Attached growthRaw groundwater treated by on-site nitrification reactor in Chyasal, NepalBacteria from on-site nitrification 13.3 h70 mL/min10 Fiber carrier3133107>8019
HD with two stage injection of electrolytic H2Raw groundwater in Saitama, JapanBacteria from their lab29.0 ± 3.14.2 d2 A8.1 ± 0.6Sand gravel1290 1.91.681.6 ± 4.436
Attached growth Raw groundwater treated by on-site dropping nitrification in Jwagal, NepalBacteria from on-site HD reactor20.7–28.112 h120 mL/min8.3–45.9Polyolefin sponge2073.773.7100This study
Publisher’s Note: MDPI stays neutral with regard to jurisdictional claims in published maps and institutional affiliations.

