
Flow and Transport Numerical Model of a Coastal Aquifer Based on the Hydraulic Importance of a Dyke and Its Impact on Water Quality. Manglaralto—Ecuador

 , , , ,
  and
and
Abstract
1. Introduction
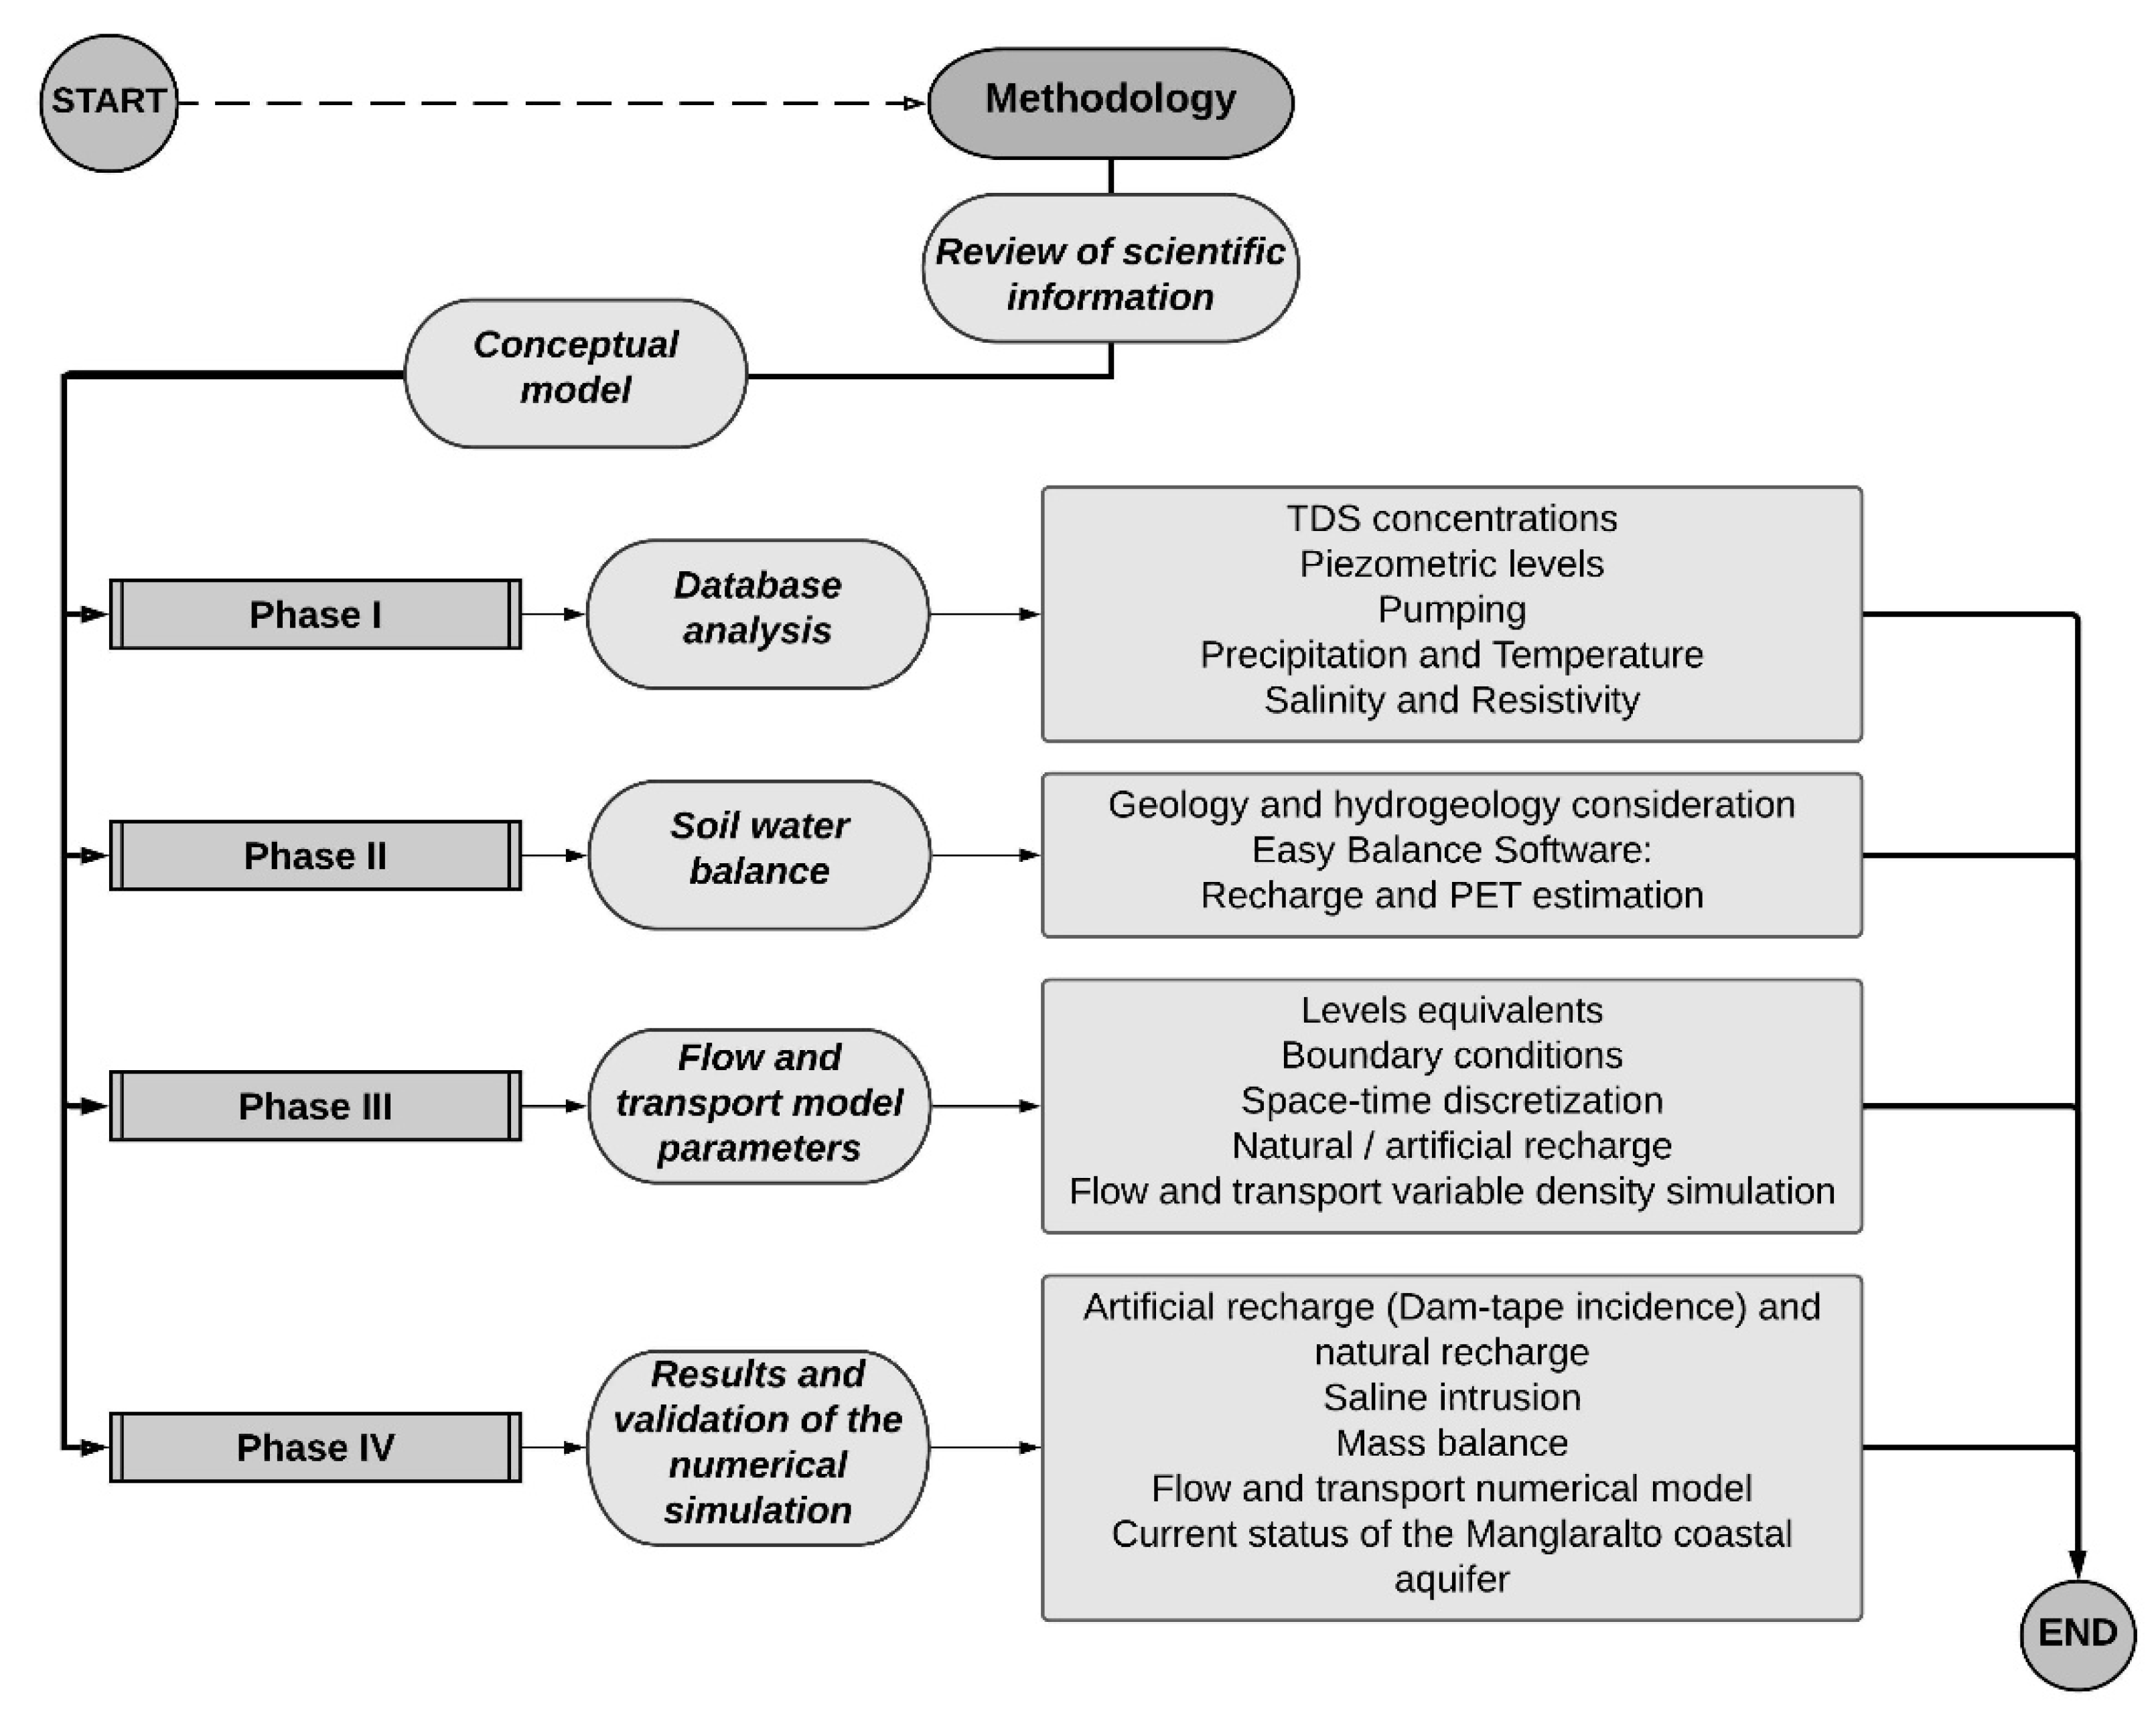
2. Materials and Methods
2.1. Phase I
2.2. Phase II
2.3. Phase III
2.4. Phase IV
3. Results
3.1. Soil Water Balance
3.2. Mass Balance
3.3. Numerical Model of Flow and Transport
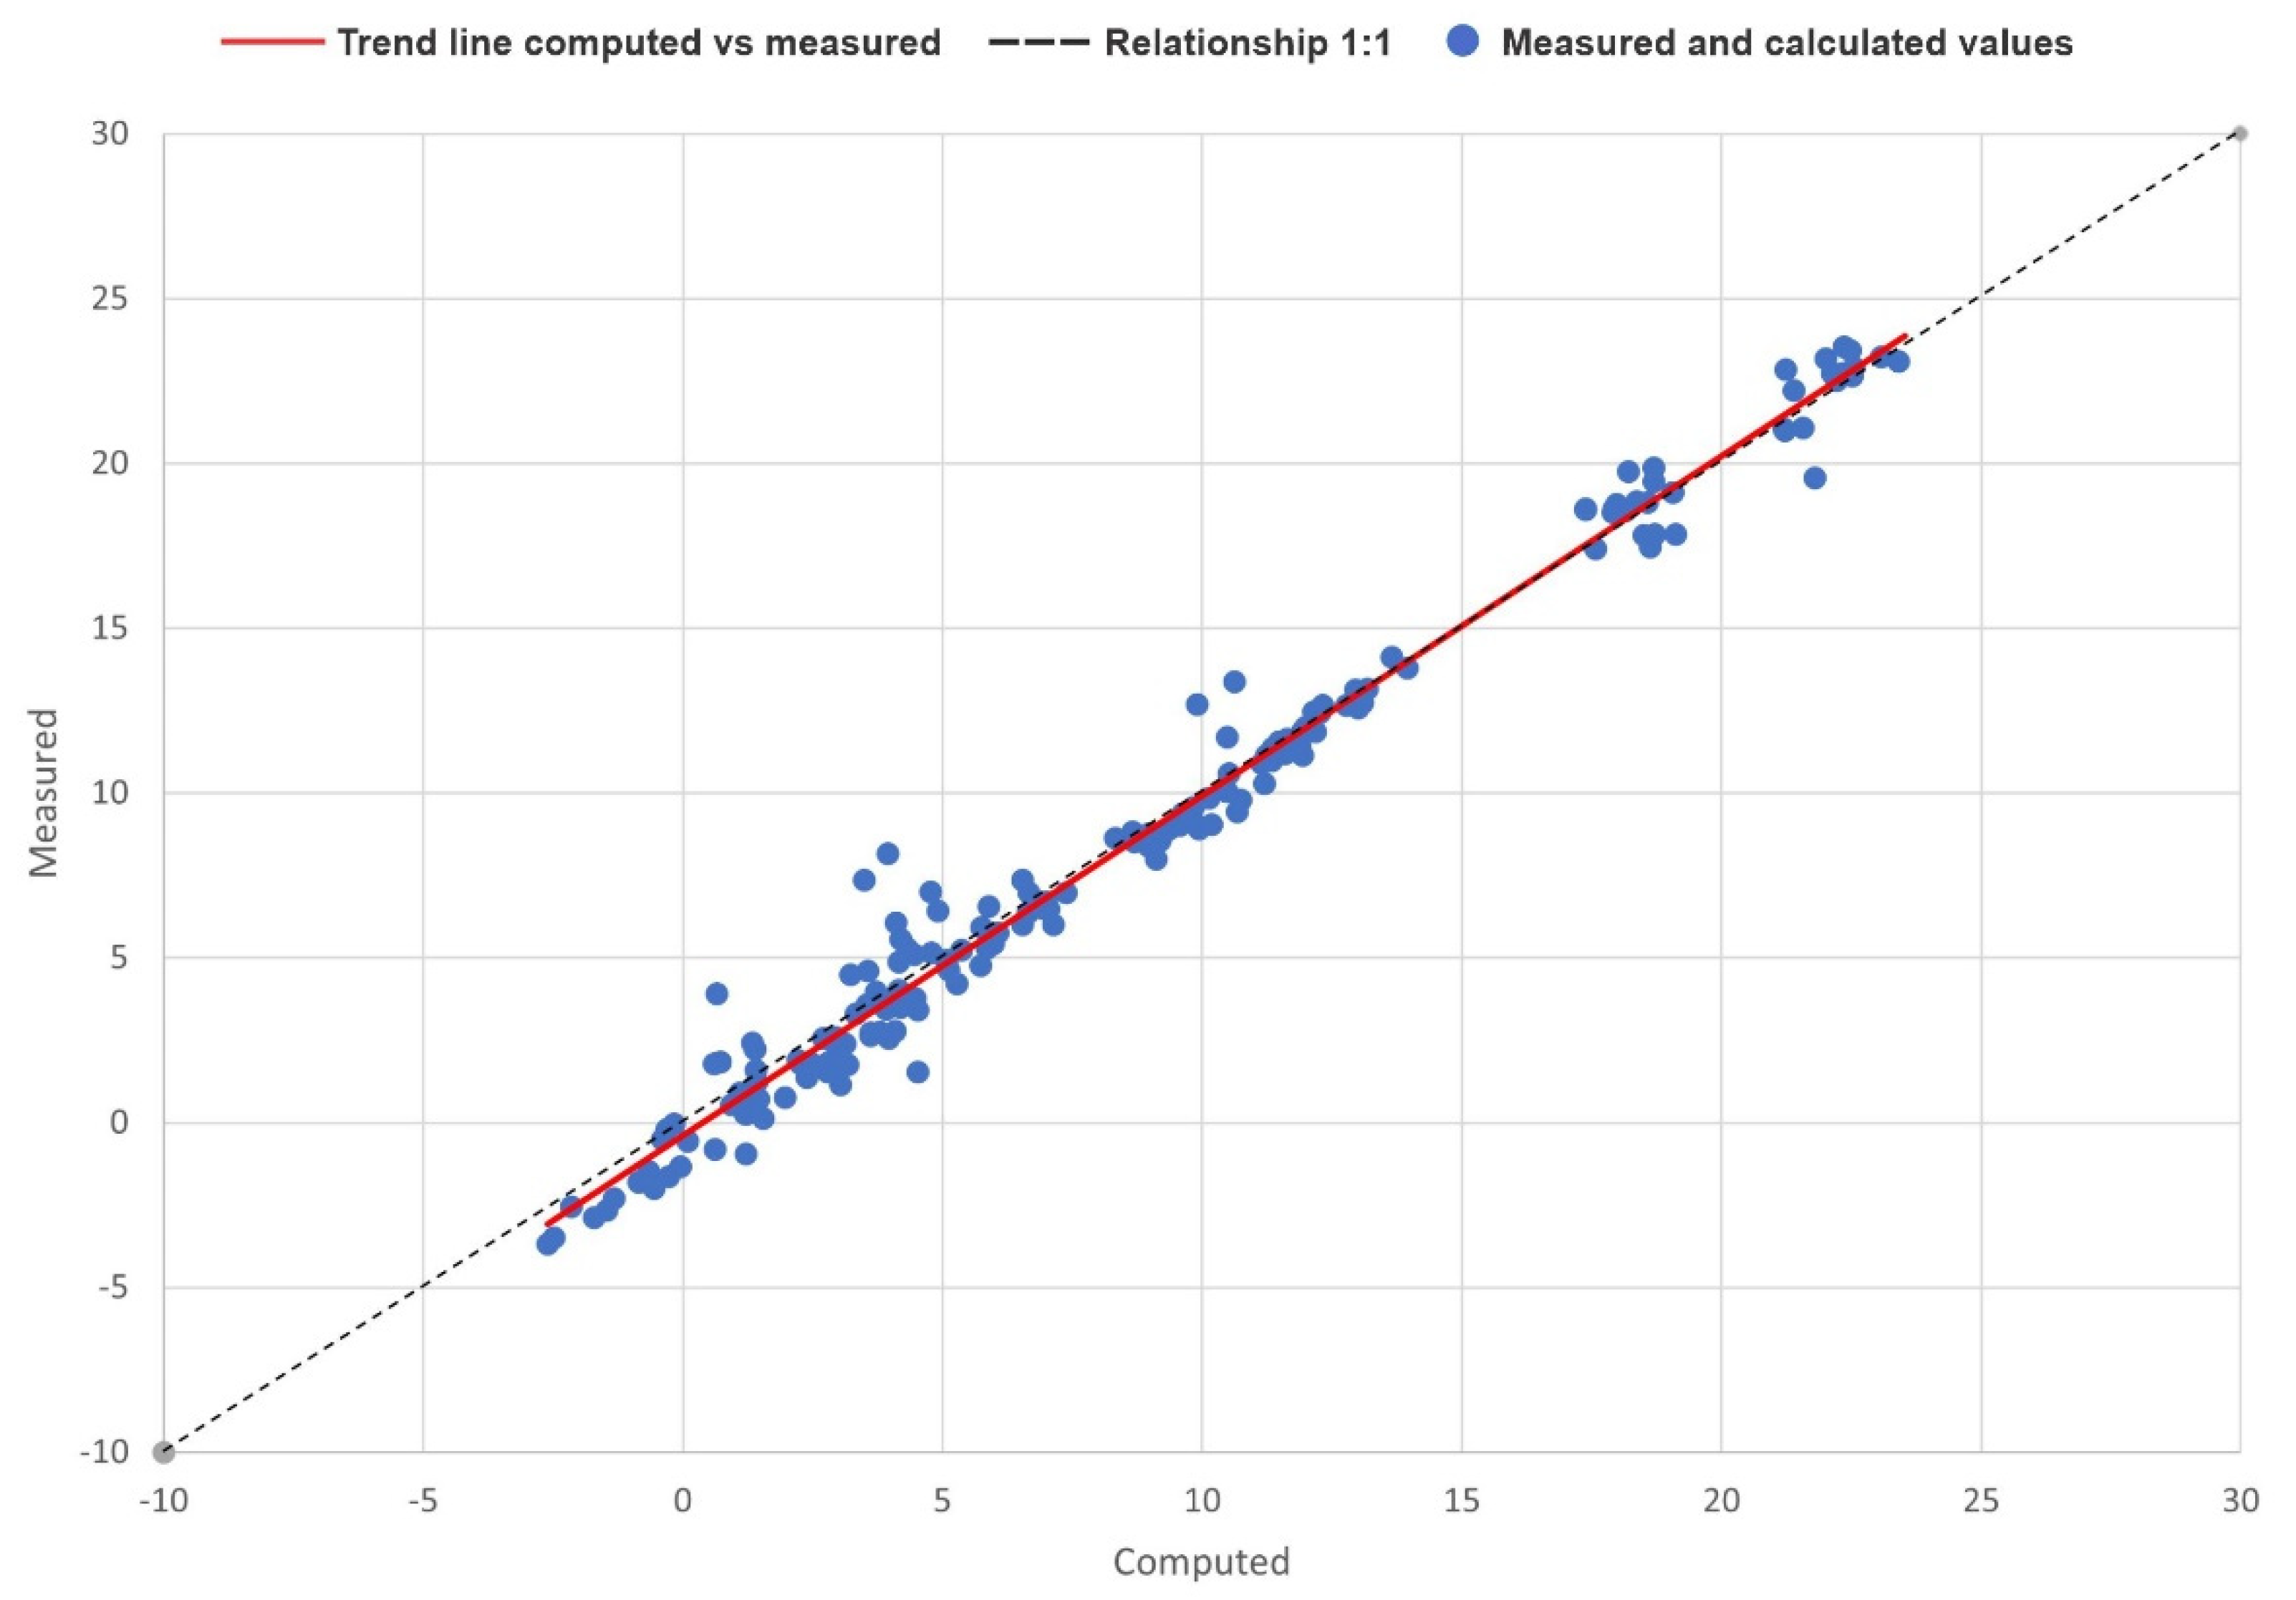
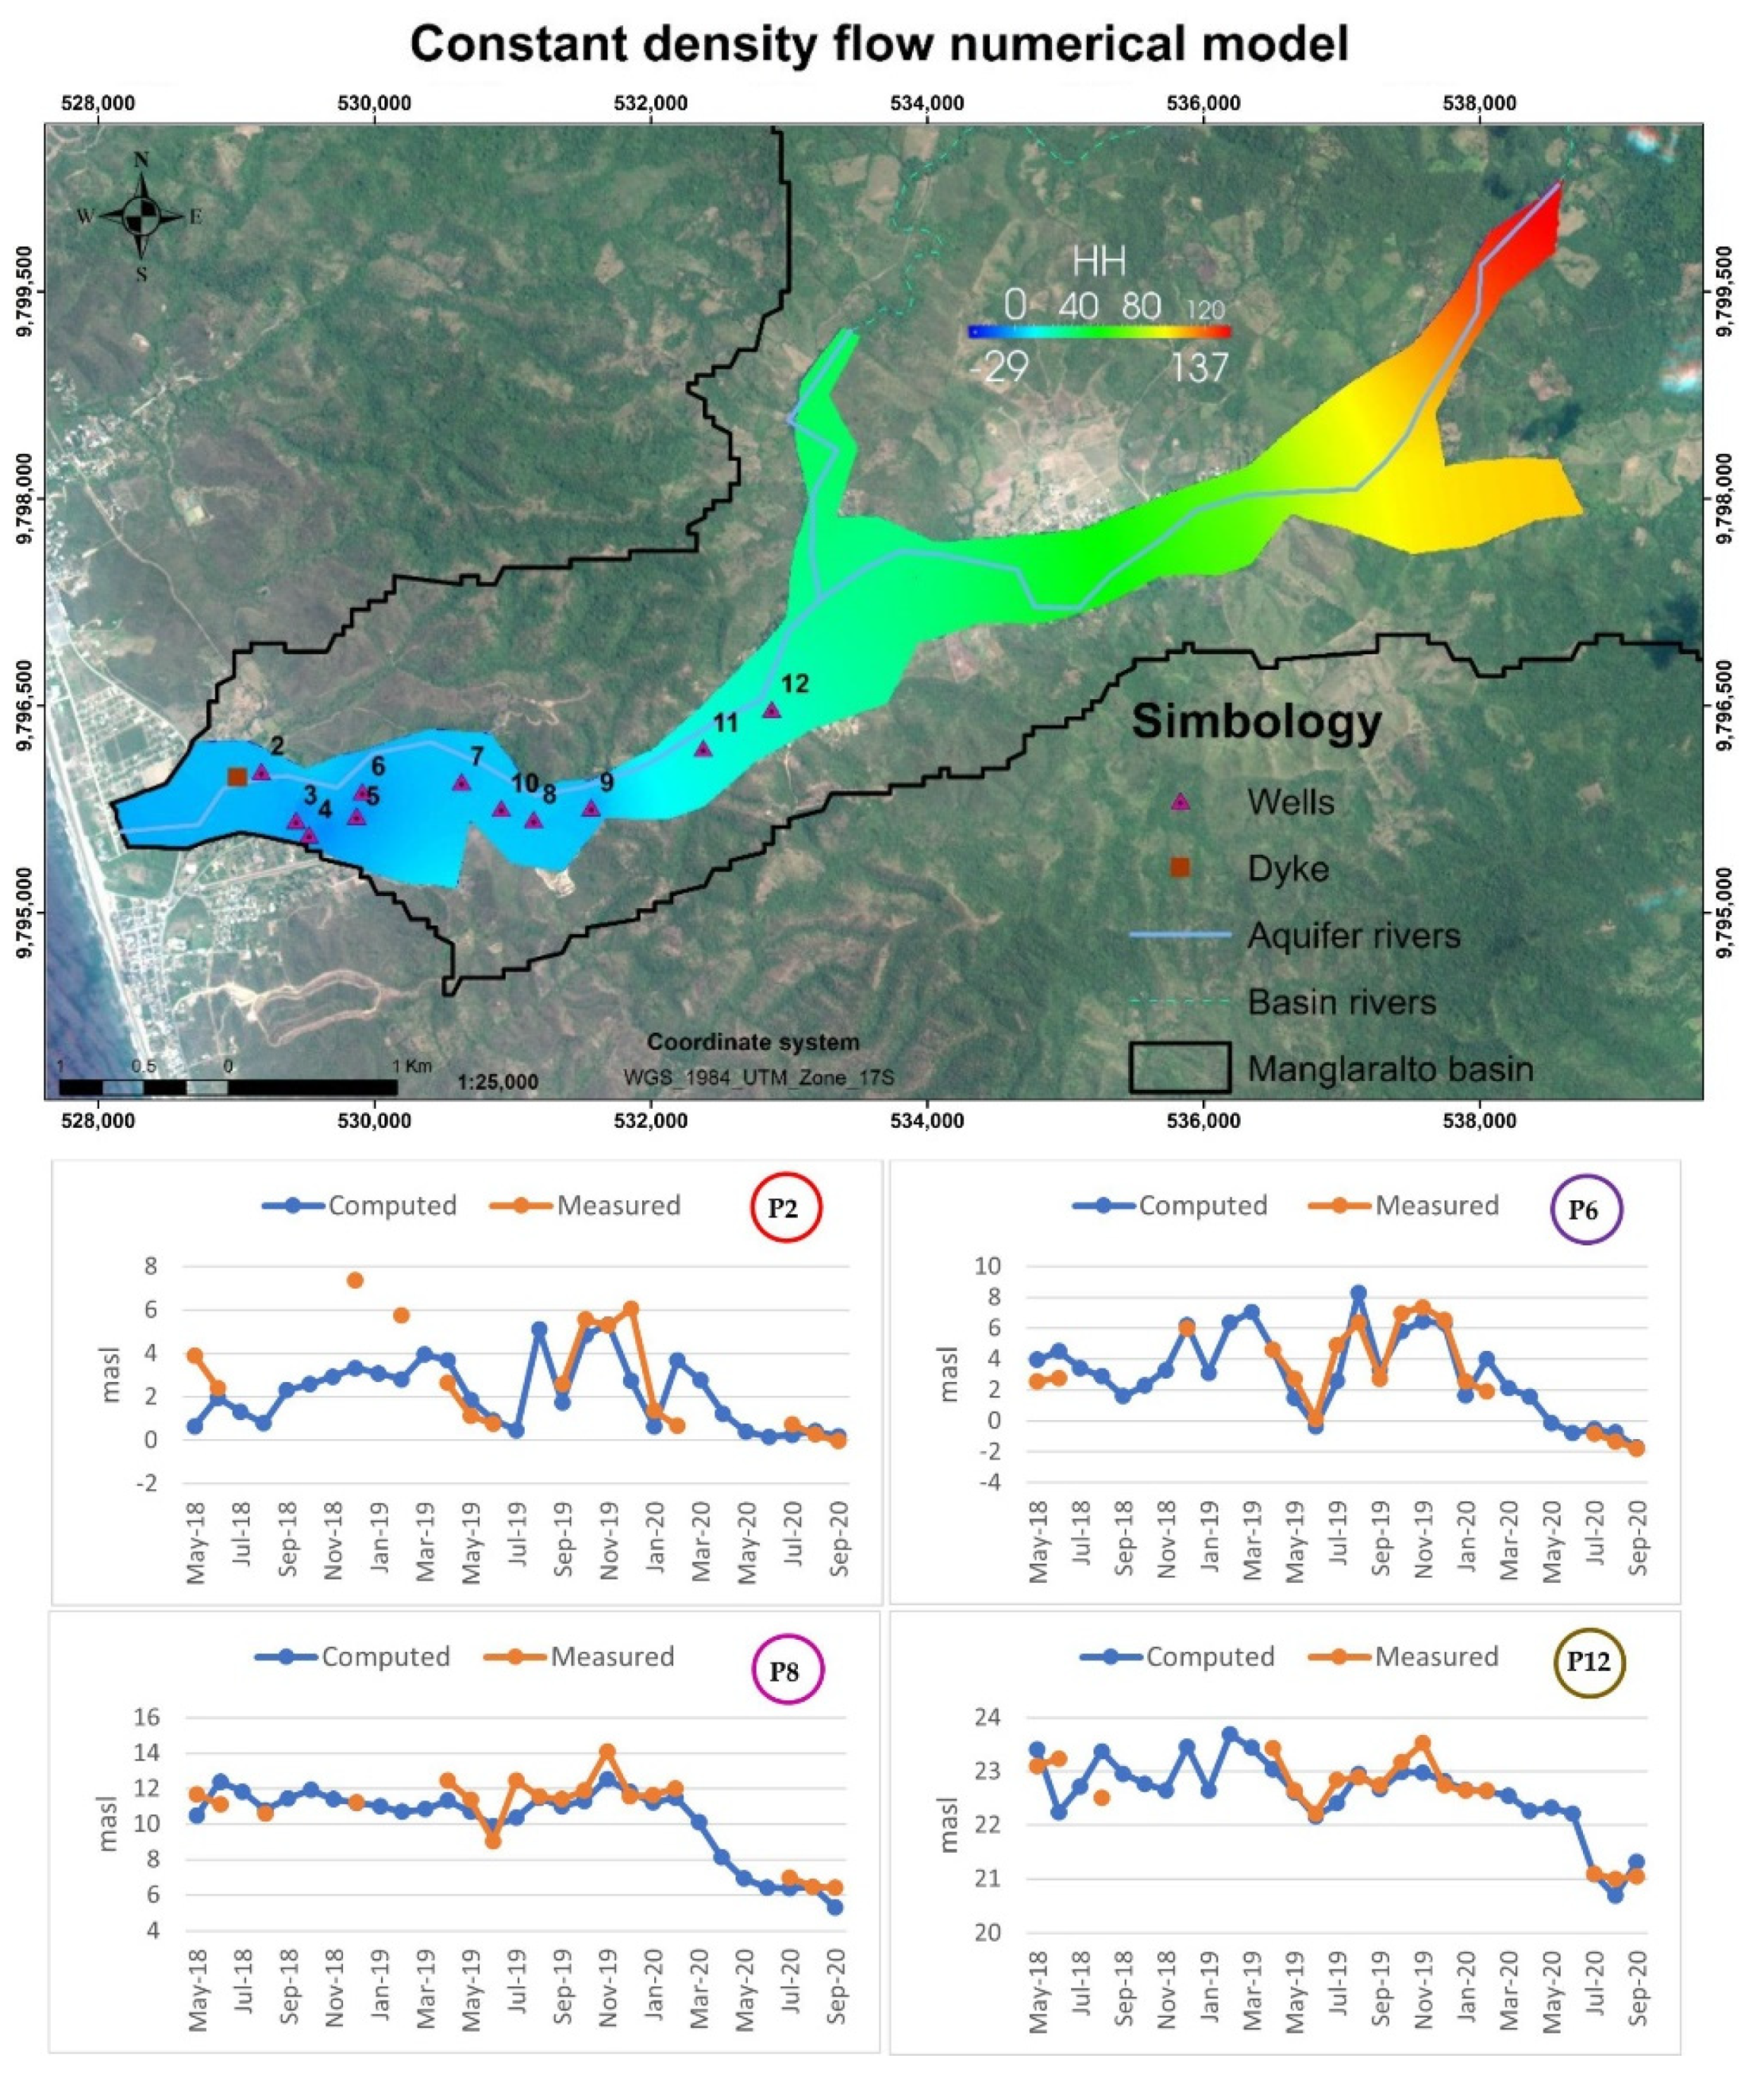
3.3.1. Calibration
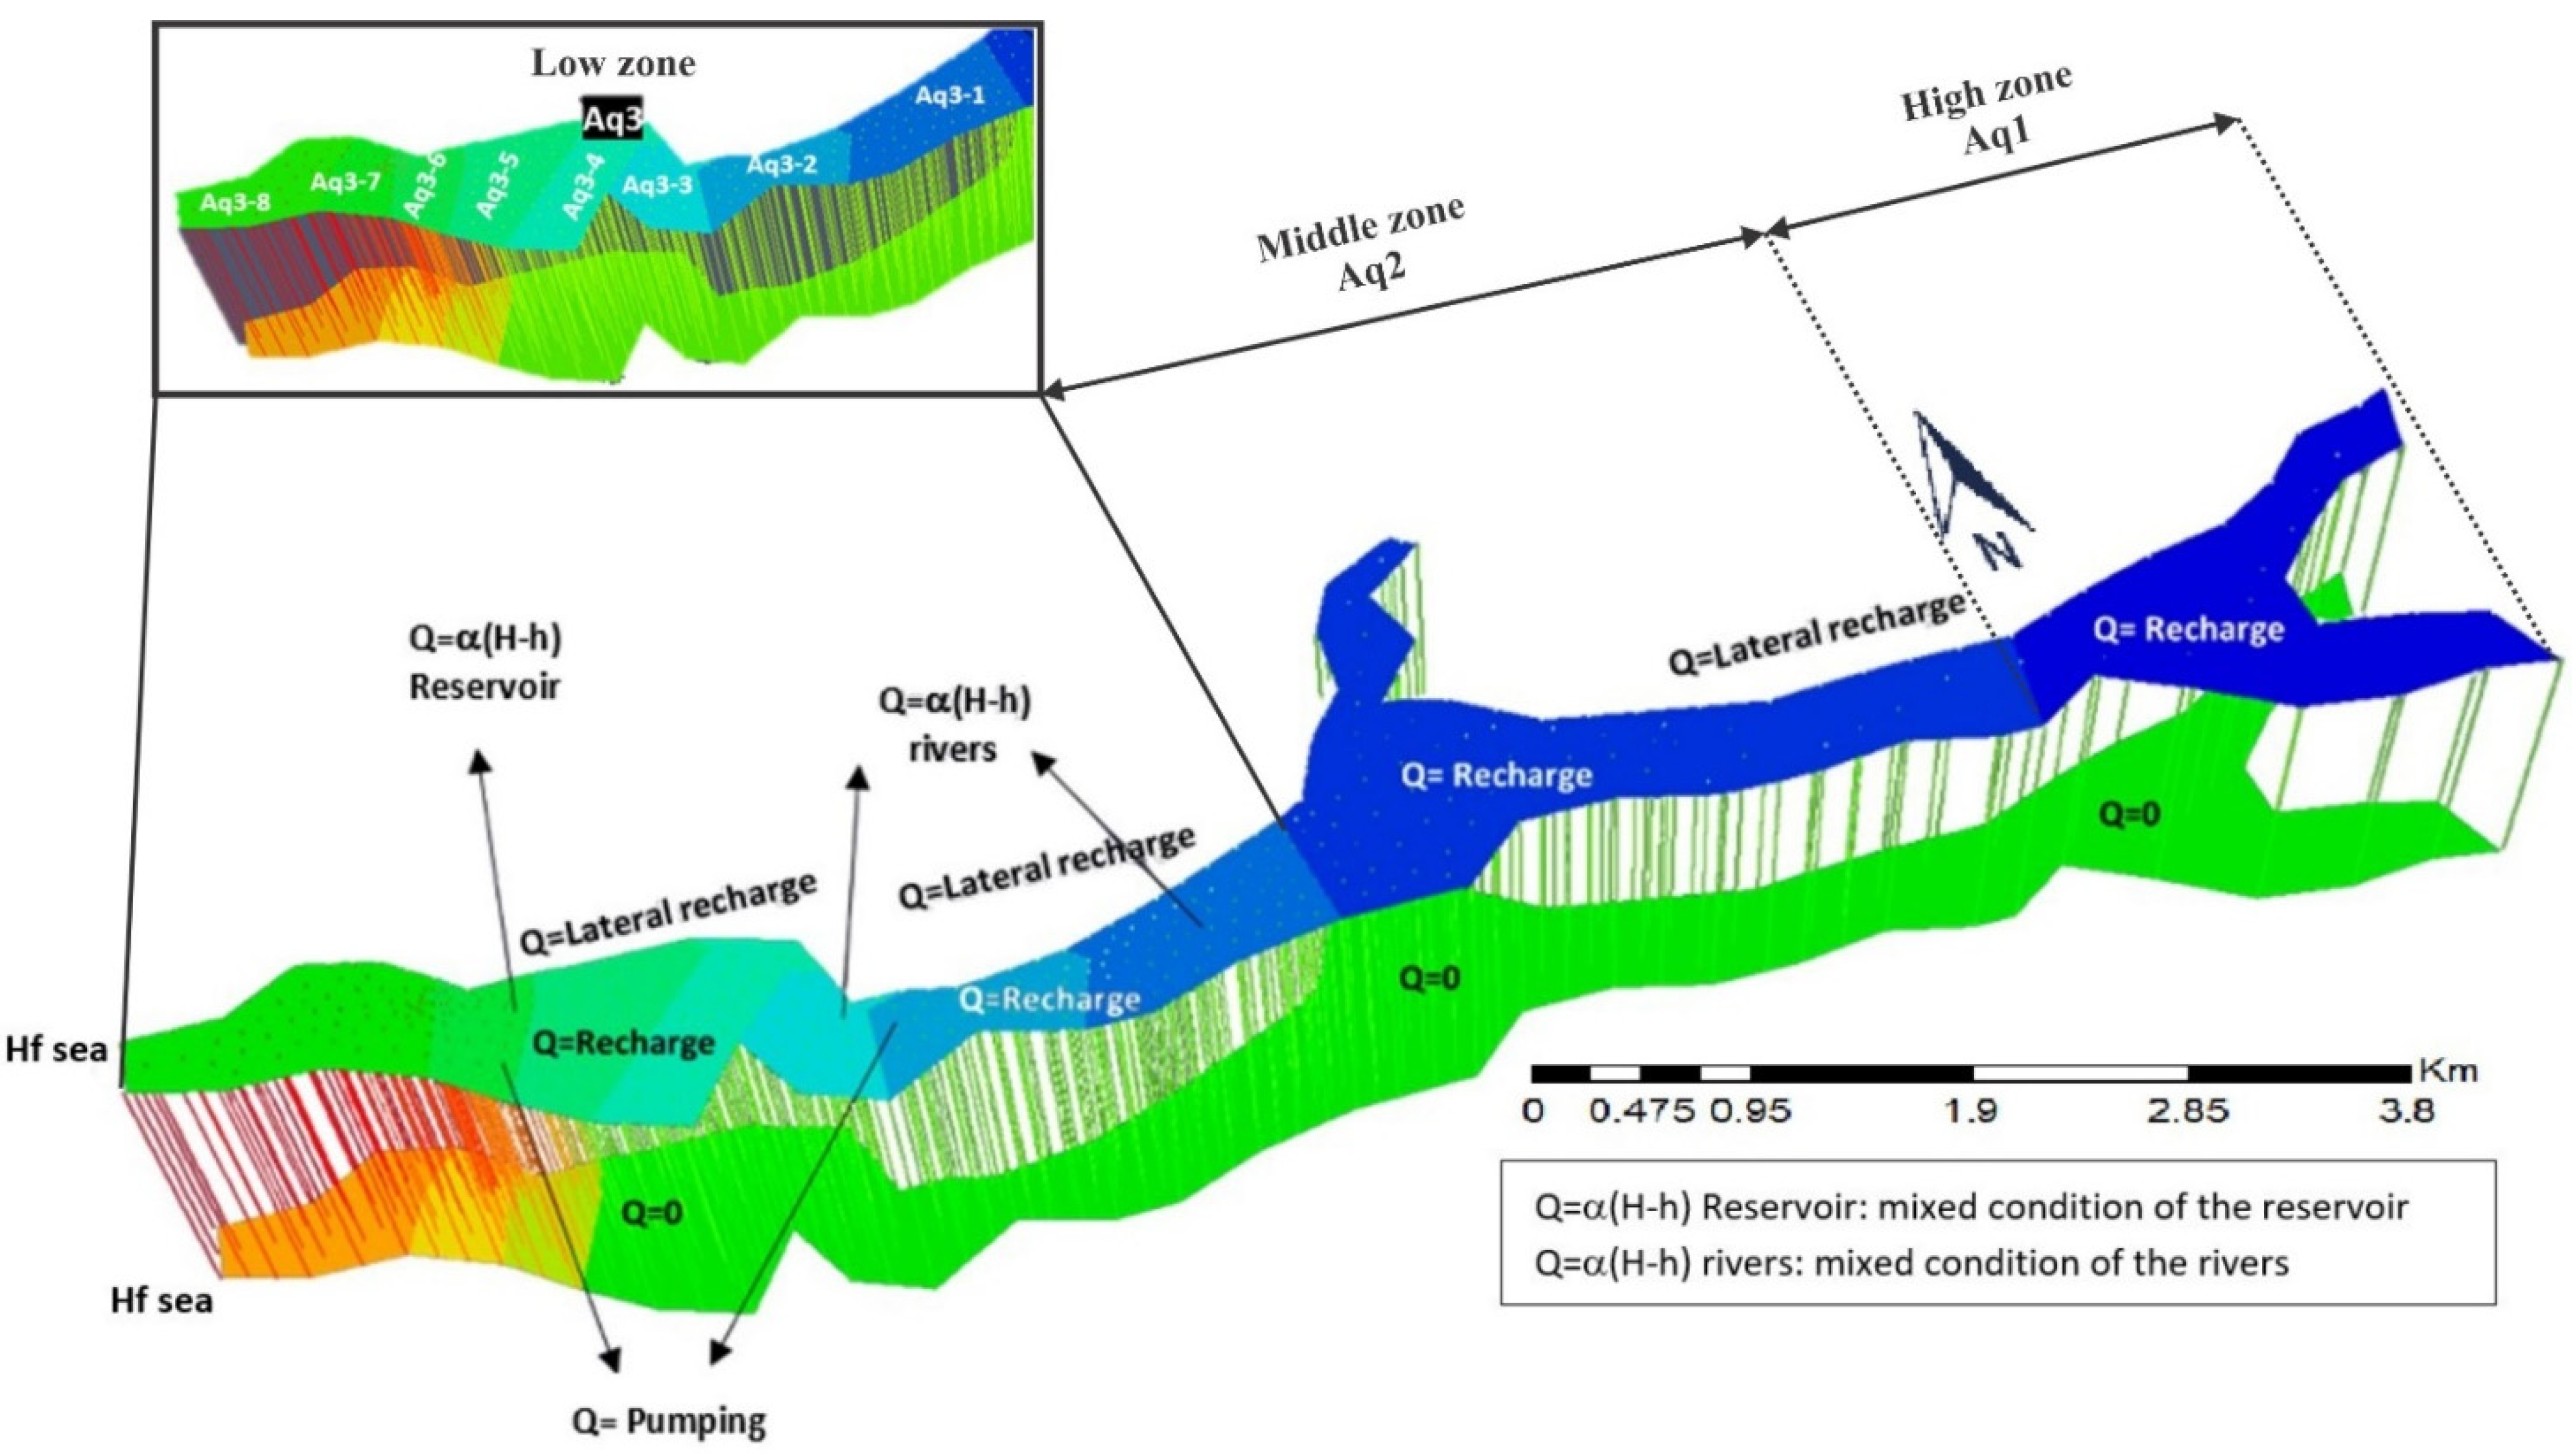
3.3.2. Lateral Recharge
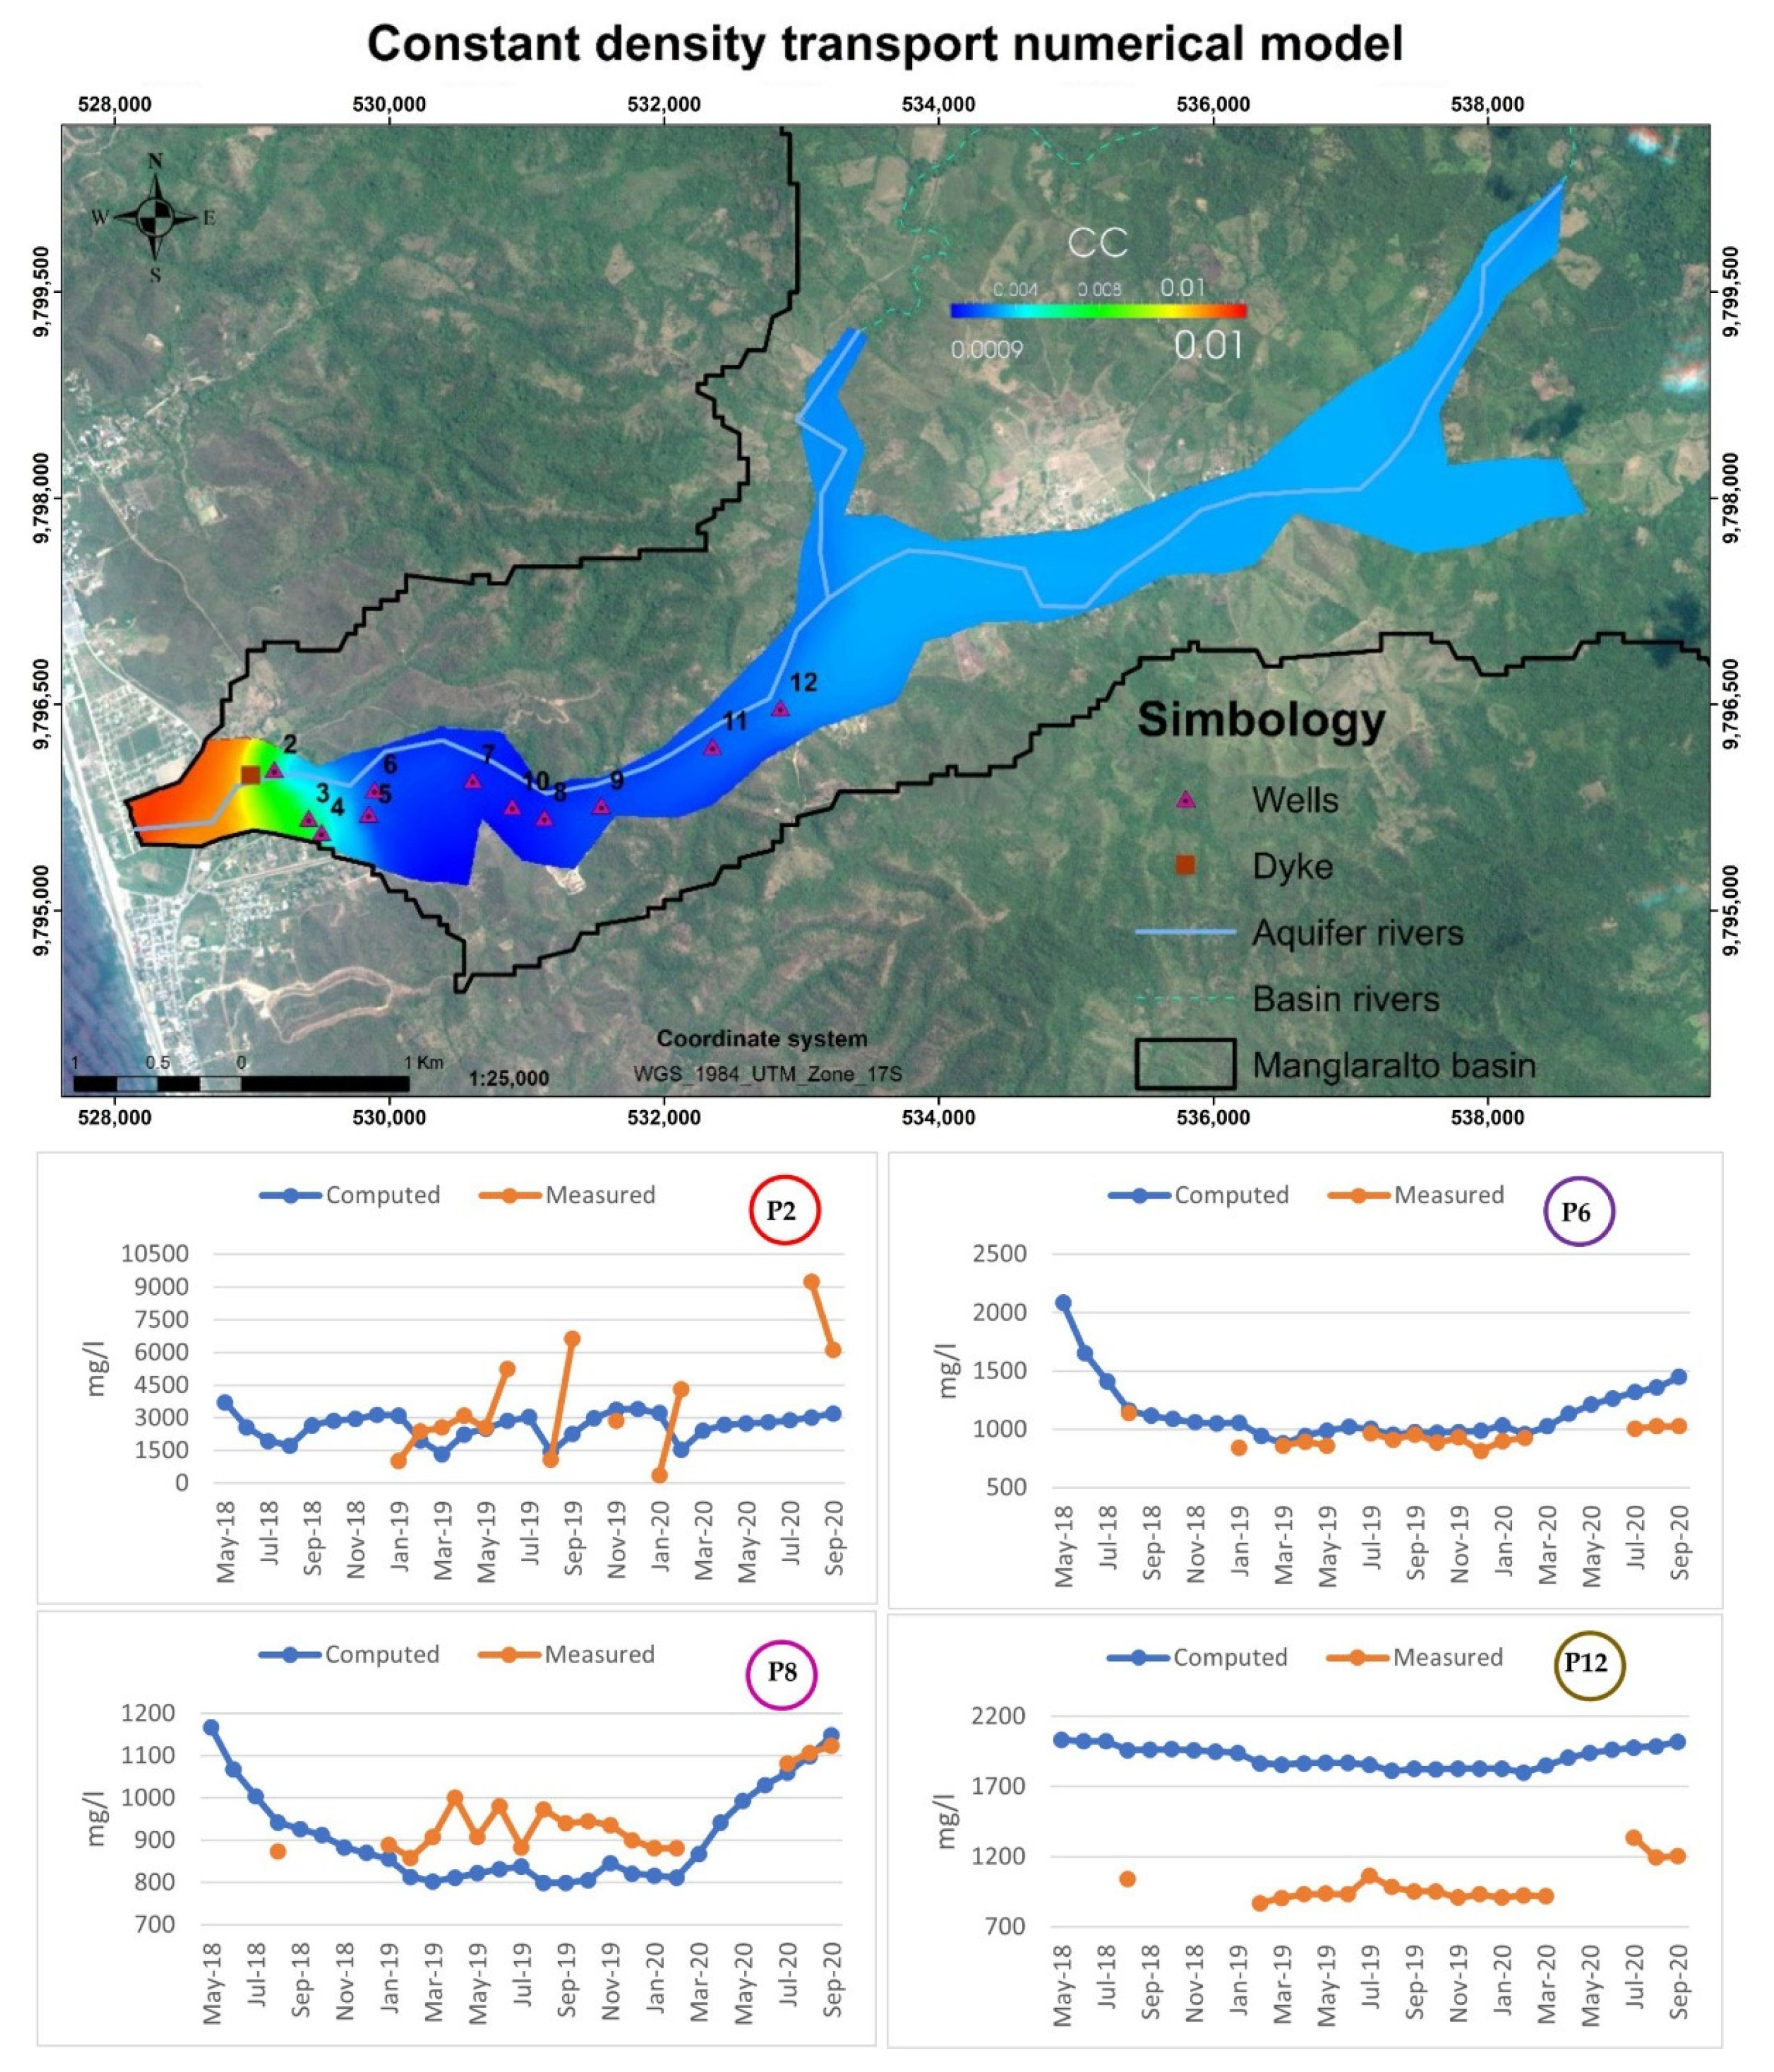
3.3.3. Constant Density
Flow Model
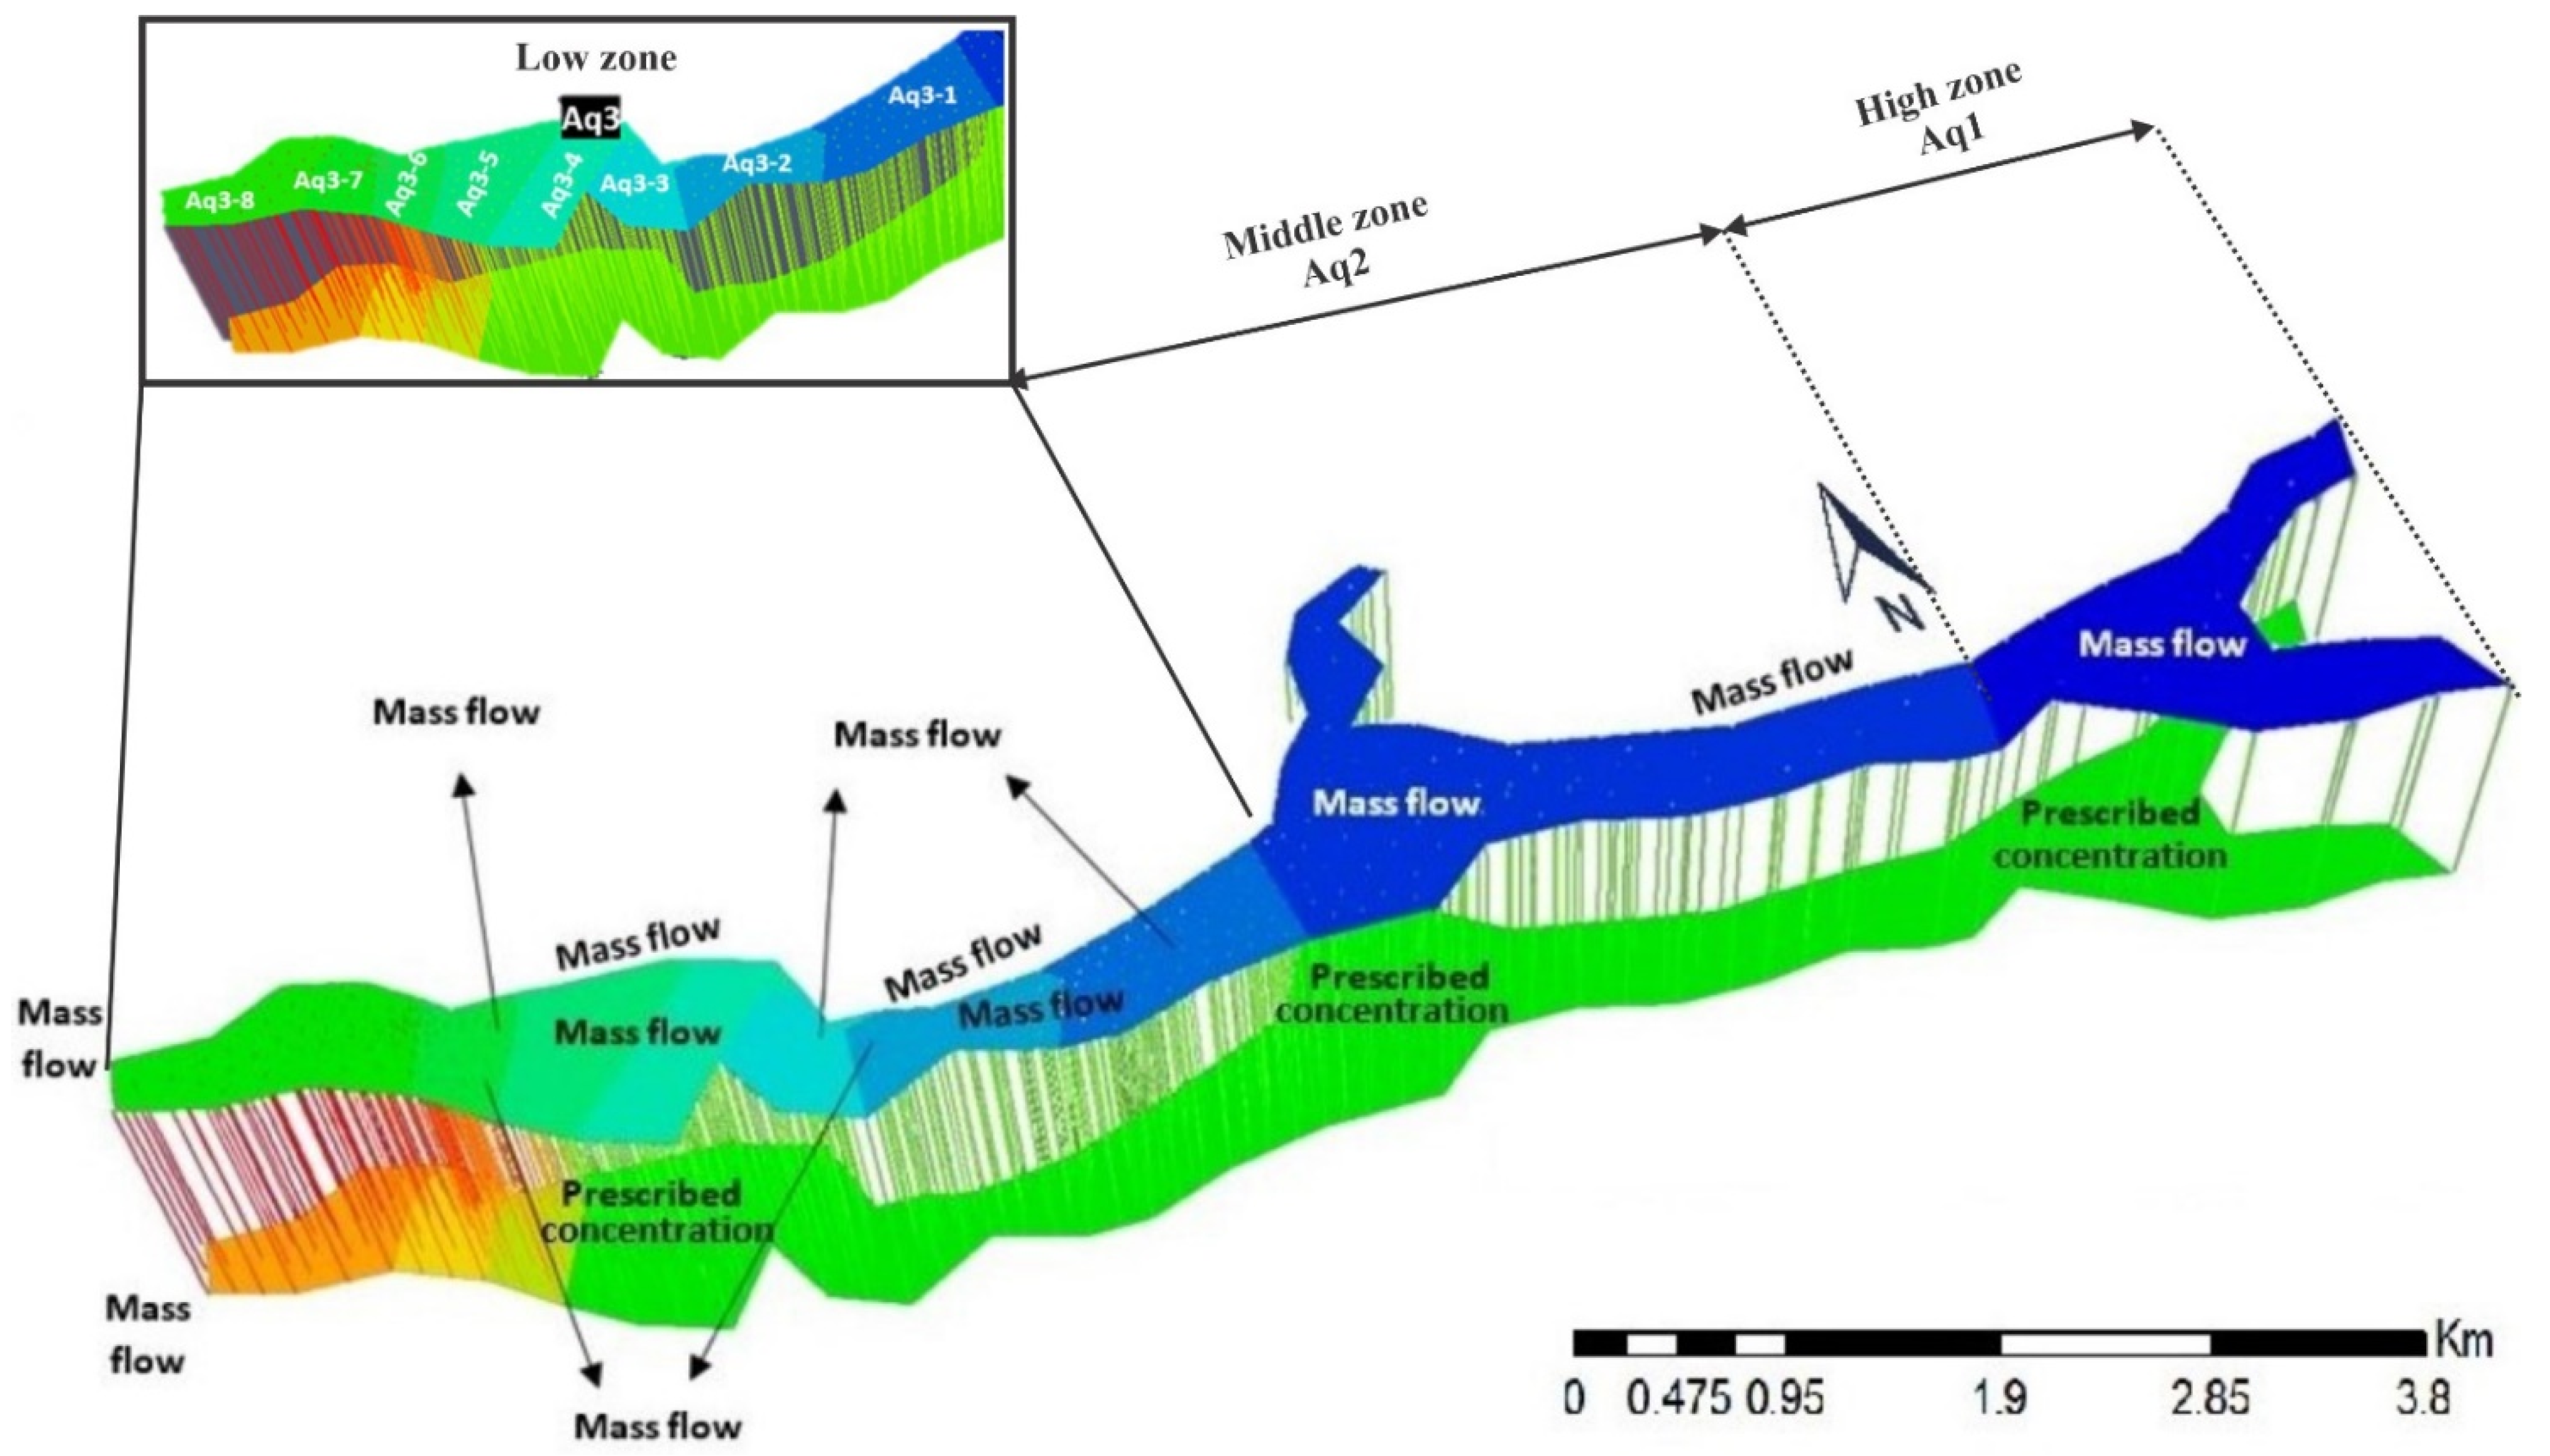
Transport Model
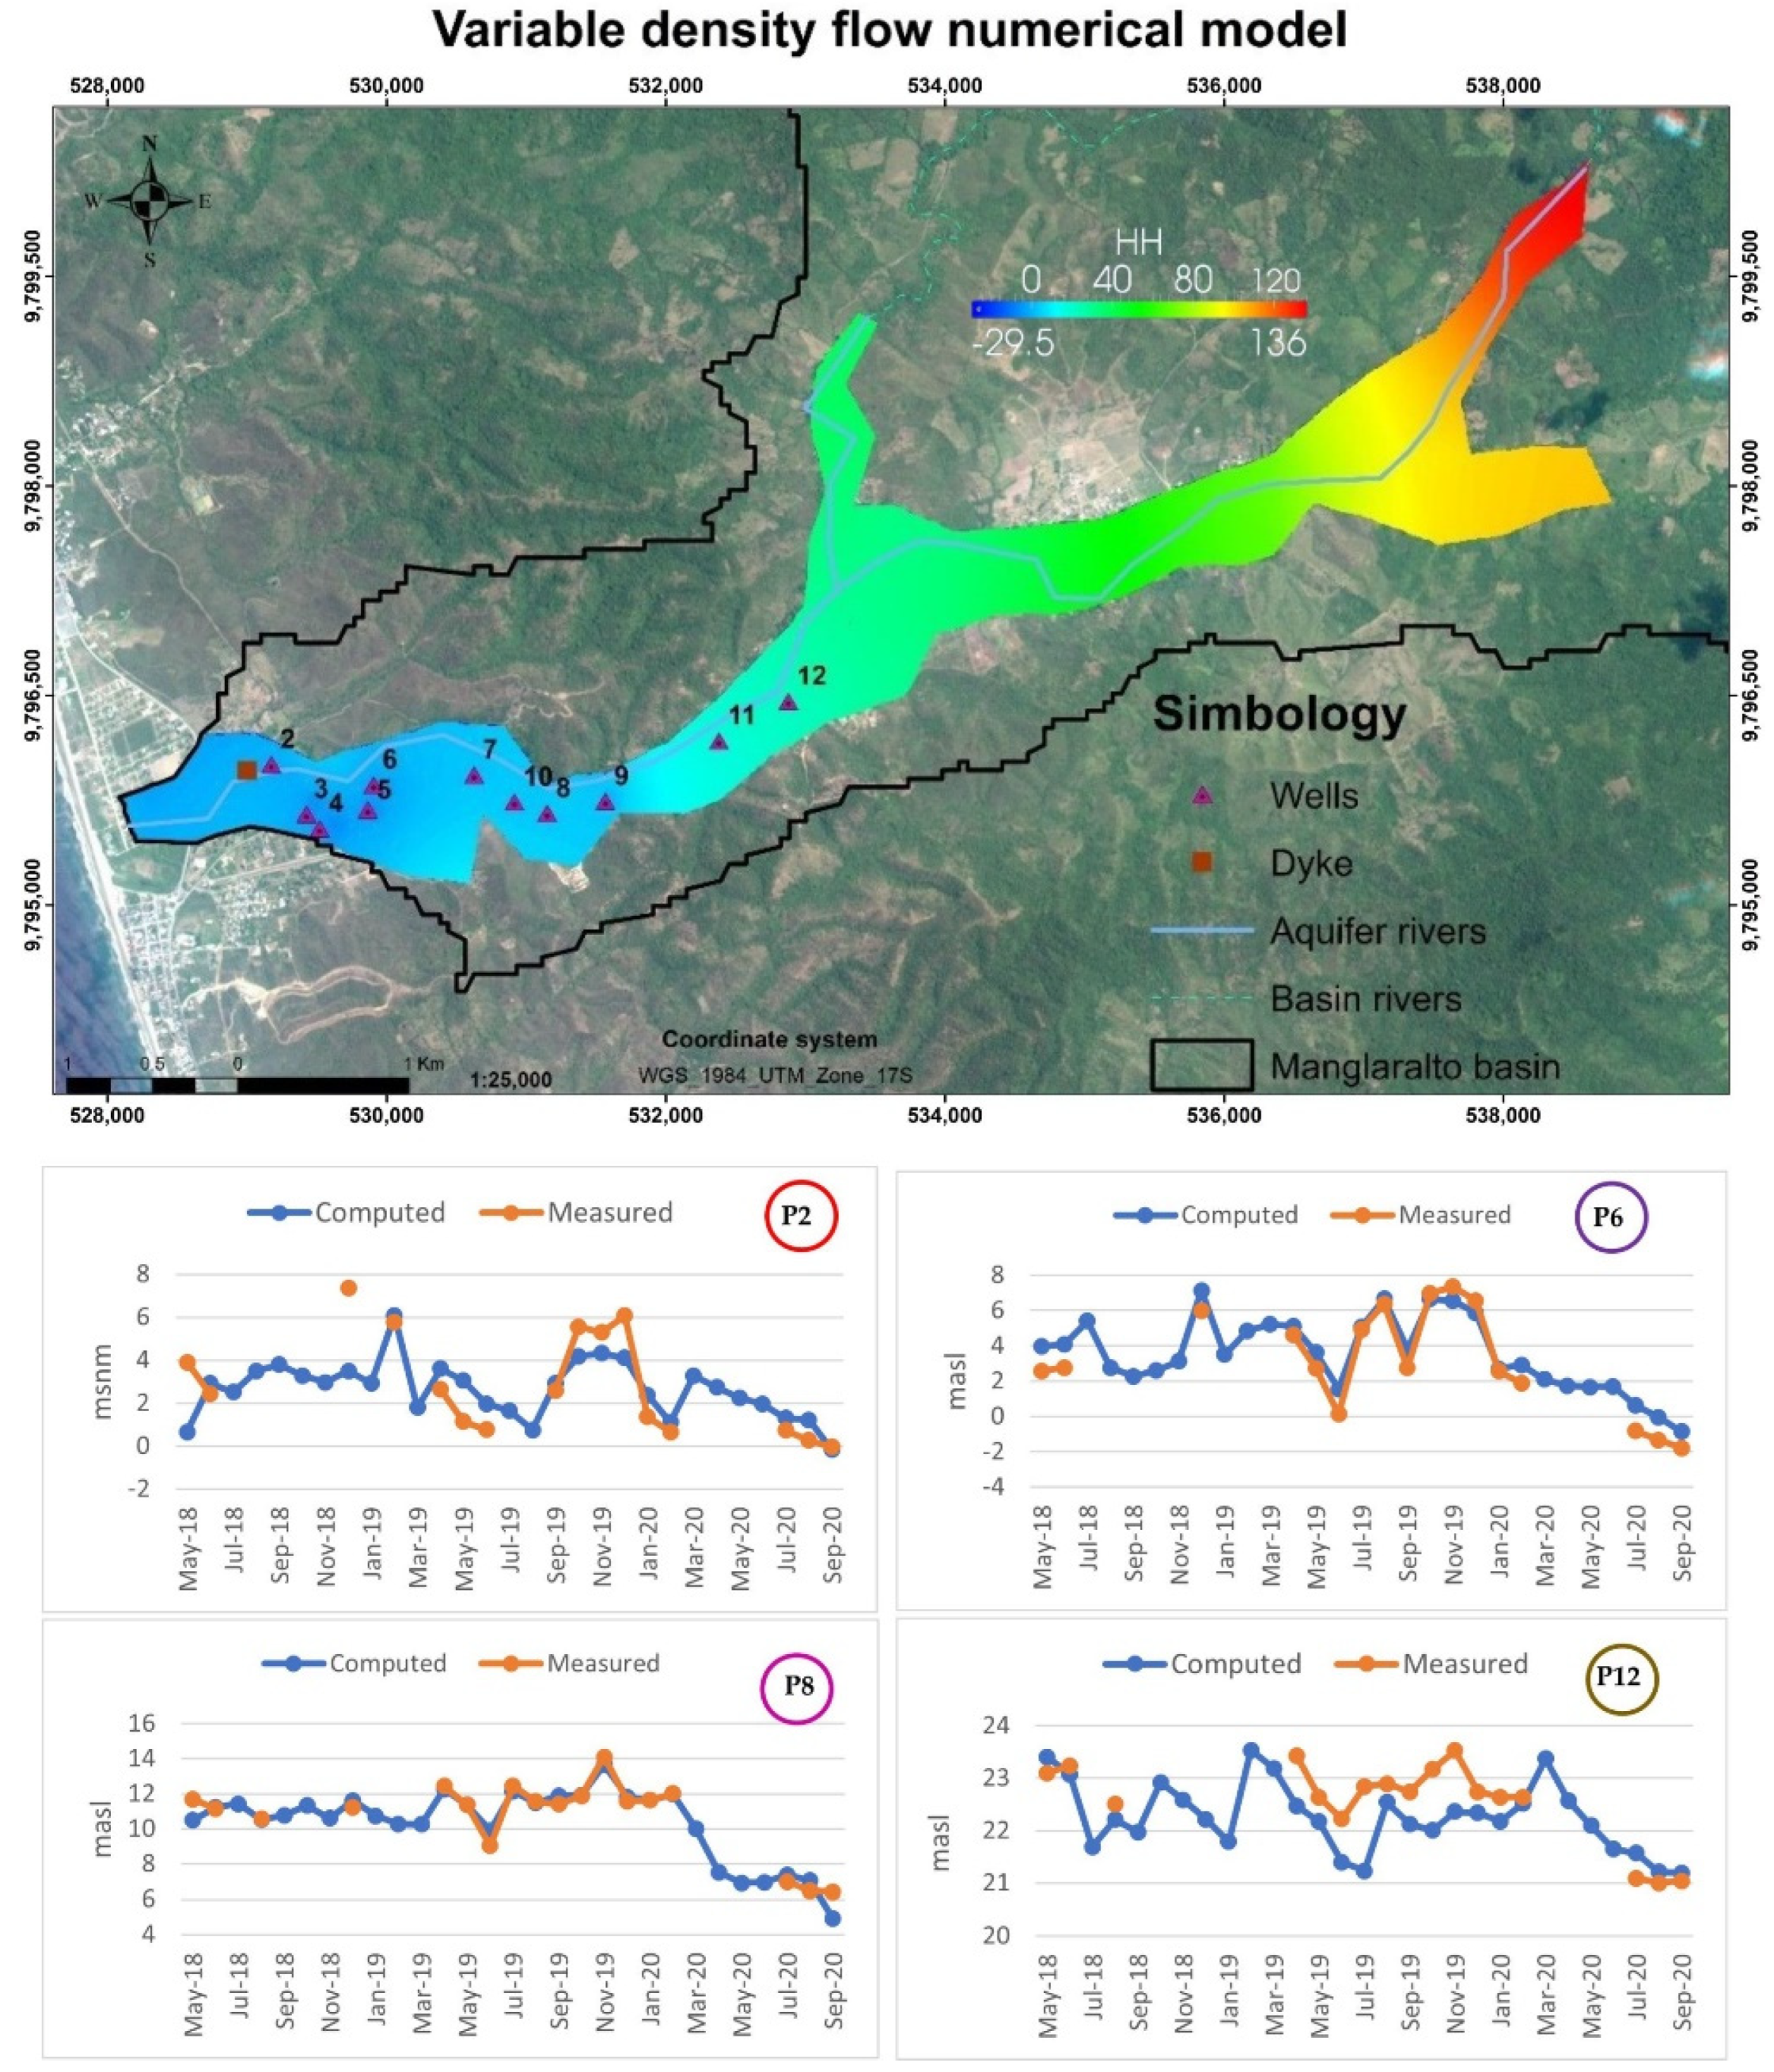
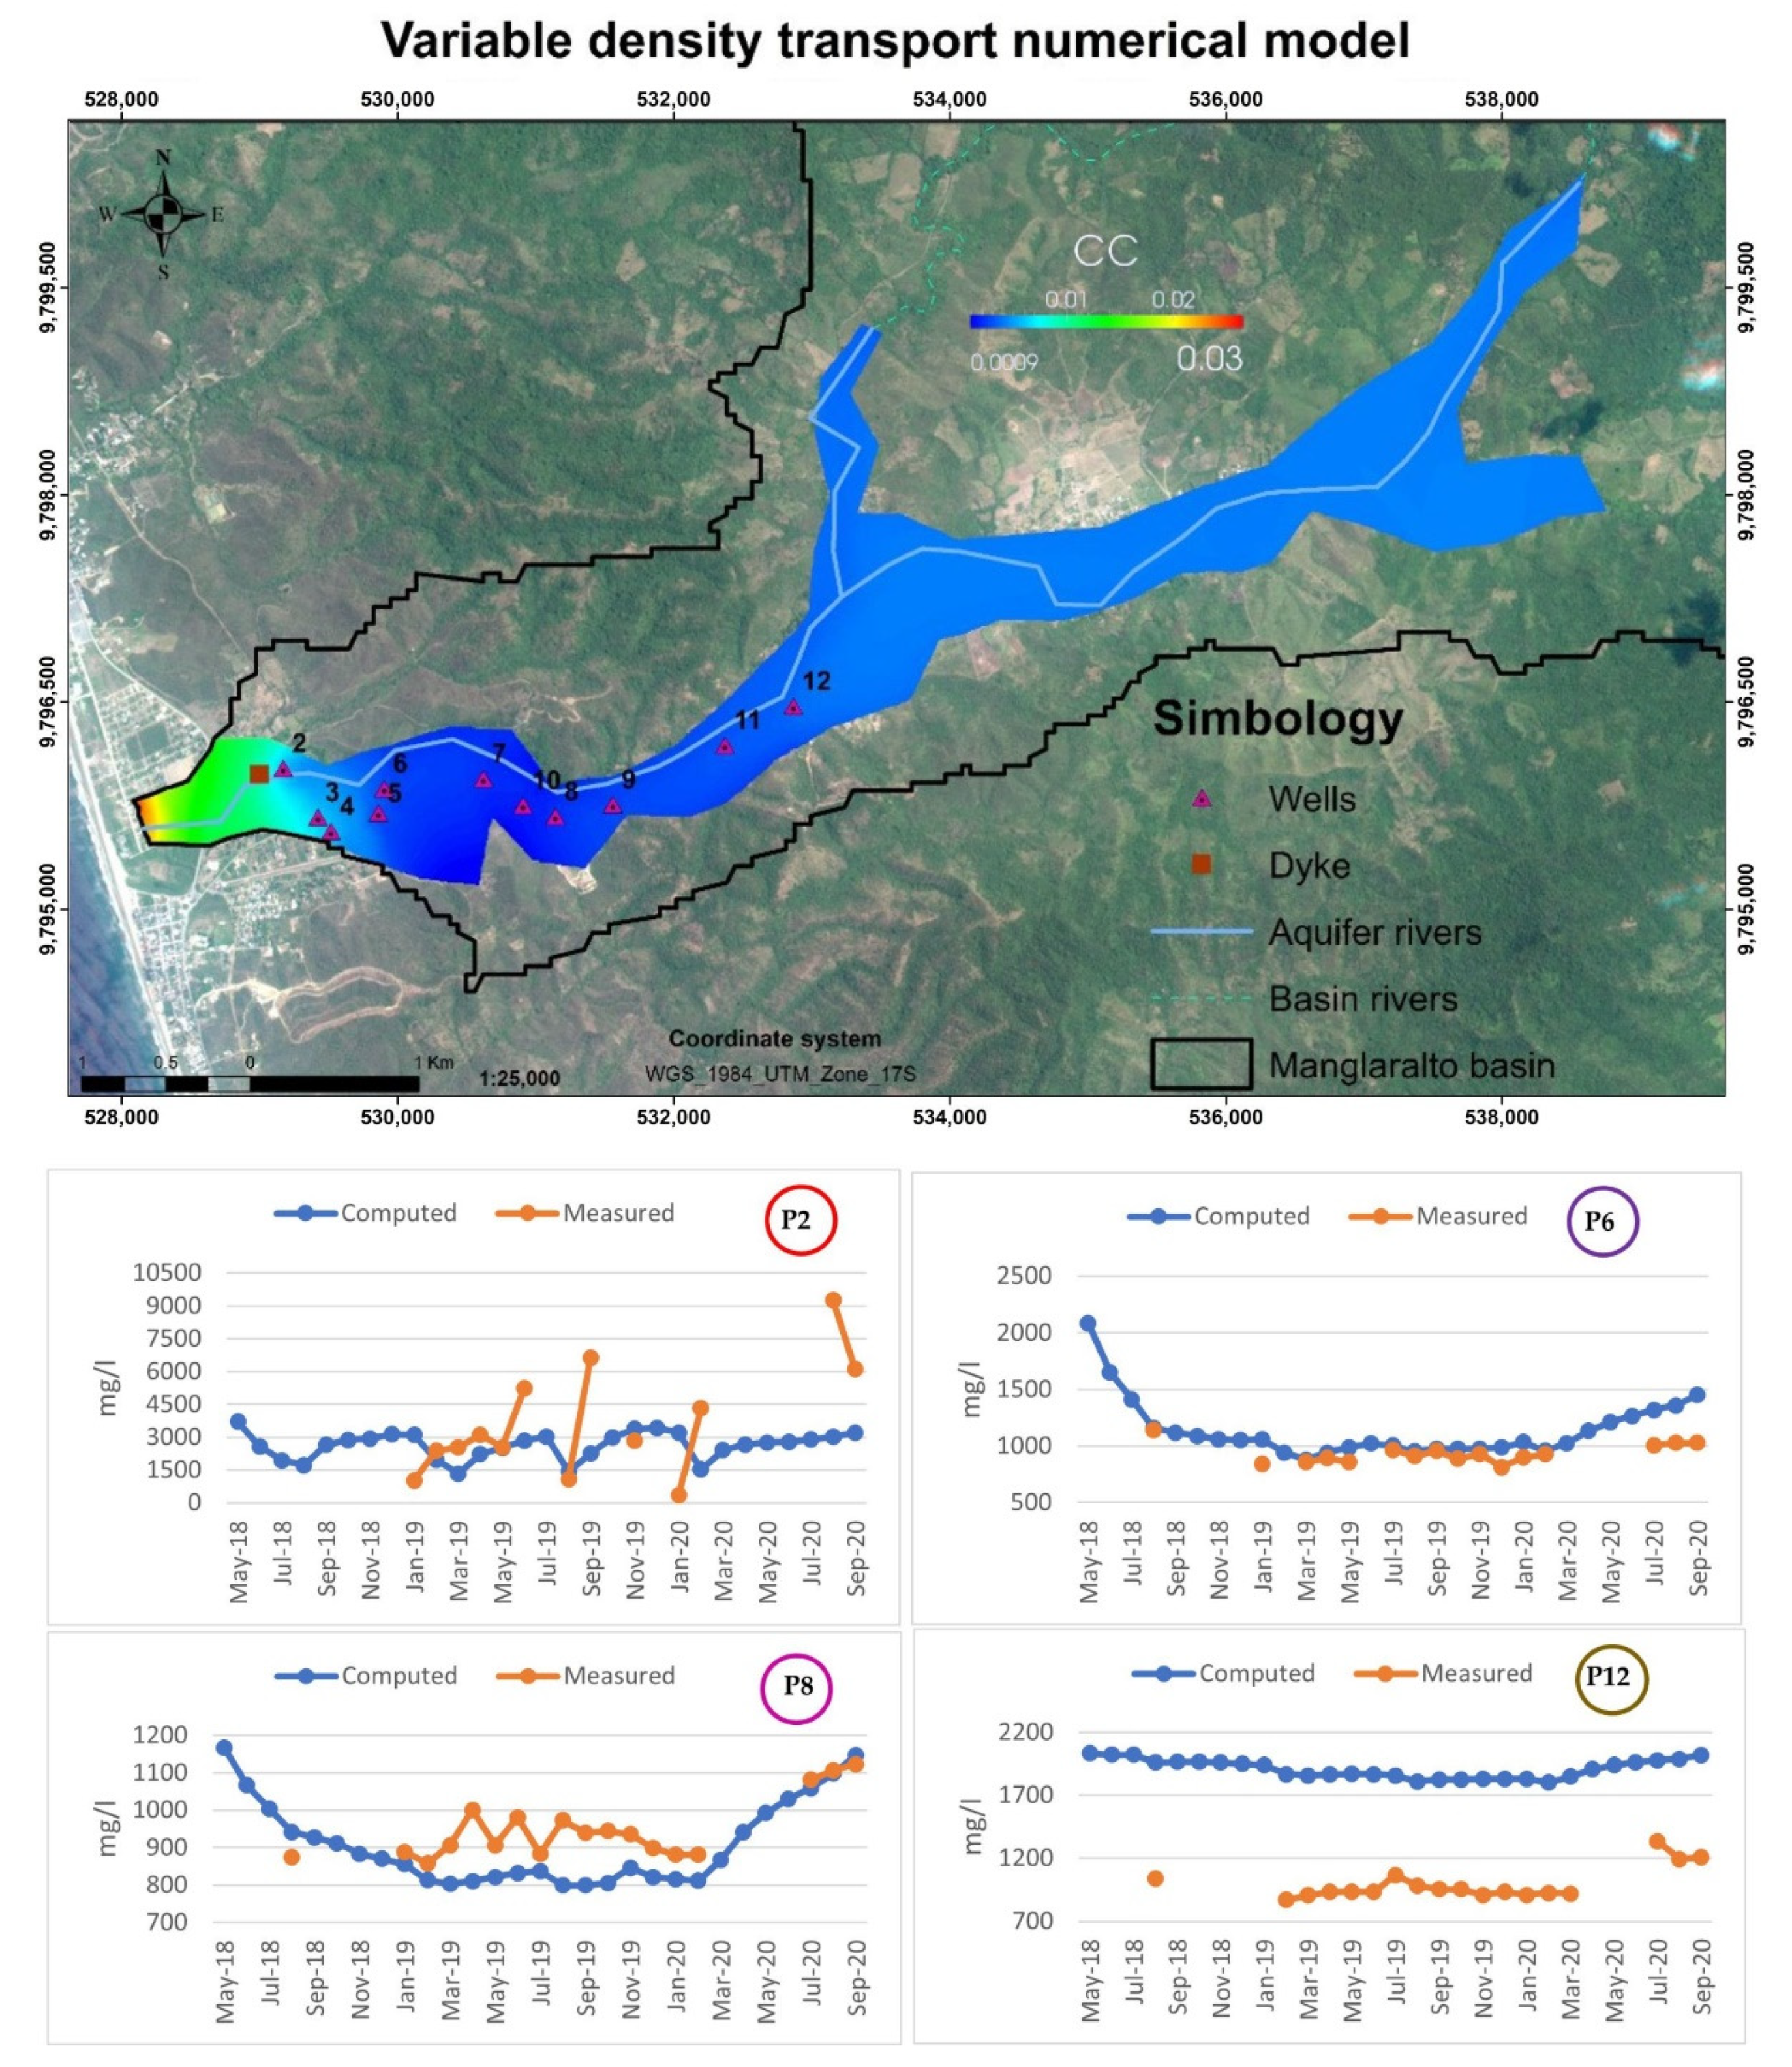
3.3.4. Variable Density
Flow Model
Transport Model
4. Discussion
5. Conclusions
Supplementary Materials
Author Contributions
Funding
Institutional Review Board Statement
Informed Consent Statement
Data Availability Statement
Acknowledgments
Conflicts of Interest
References
- USGS. Water Science Basics. Available online: http://www.nysenvirothon.org/Referencesandother/Water_Science_Basics.pdf (accessed on 30 November 2020).
- Astrálaga, M. La Convención Ramsar y los ecosistemas de Manglar. Secr. Conv. Ramsar. 2006, 1–6. Available online: https://barqueroweb.synthasite.com/resources/SRN_I/Astr%C3%A1laga%202006.pdf (accessed on 30 November 2020).
- Astrálaga, M. La Convención sobre los Humedales Ramsar. Trop. J. Environ. Sci. 2001, 21, 23–29. [Google Scholar] [CrossRef]
- Erwin, K.L. Wetlands and global climate change: The role of wetland restoration in a changing world. Wetl. Ecol. Manag. 2008, 17, 71–84. [Google Scholar] [CrossRef]
- Zedler, J.B.; Kercher, S.; Davidson, N.C. Wetland resources: Status, trends, ecosystem services, and restorability. Mar. Freshw. Res. 2014, 65, 934–941. [Google Scholar] [CrossRef]
- Valsero, D.J.J.; De Domingo, G.A.; Ardila, R.P. Propuesta de clasificación genético-geológica de humedales. Aplicación a los humedales españoles incluidos en el convenio de Ramsar. Bol. Geol. Min. 2009, 120, 335–346. [Google Scholar]
- Arias-García, J.; Gómez-Zotano, J. La planificación y gestión de los humedales de Andalucía en el marco del Convenio Ramsar. Investig. Geográficas 2015, 120, 117. [Google Scholar] [CrossRef]
- Herrera, G.; Alavarado-Macancela, N.; Gavín-Quinchuela, T.; Carrión, P. Puesta en valor del sistema río-acuífero costero manglaralto en el contexto del proyecto geoparque ancón-santa elena: Motor de desarrollo en áreas rurales de la parroquia manglaralto, ecuador. Proc. LACCEI Int. Multi-Conf. Eng. Educ. Technol. 2019, 2019. [Google Scholar] [CrossRef]
- Da Silva, G.C.; Bocanegra, E.; Custodio, E.; Manzano, M.; Montenegro, S. State of knowledge and management of Iberoamerican coastal aquifers with different geo-hydrological settings. Episodes 2010, 33, 91–101. [Google Scholar] [CrossRef]
- Ferguson, G.; Gleeson, T. Vulnerability of coastal aquifers to groundwater use and climate change. Nat. Clim. Chang. 2012, 2, 342–345. [Google Scholar] [CrossRef]
- Gleeson, T.; Wada, Y.; Bierkens, M.F.P.; Van Beek, L.P.H. Water balance of global aquifers revealed by groundwater footprint. Nature 2012, 488, 197–200. [Google Scholar] [CrossRef]
- Kinniburgh, D.G.; Gale, I.N.; Smedley, P.L.; Darling, W.G.; West, J.M.; Aldous, P.J.; O’Shea, M.J. The effects of historic abstraction of groundwater from the London Basin aquifers on groundwater quality. Appl. Geochem. 1994, 9, 175–195. [Google Scholar] [CrossRef]
- Datta, P.S.; Bhattacharya, S.K.; Tyagi, S.K. 18O studies on recharge of phreatic aquifers and groundwater flow-paths of mixing in the Delhi area. J. Hydrol. 1996, 176, 25–36. [Google Scholar] [CrossRef]
- Martínez, D.E.; Bocanegra, E.M. Hydrogeochemistry and cation-exchange processes in the coastal aquifer of Mar Del Plata, Argentina. Hydrogeol. J. 2002, 10, 393–408. [Google Scholar] [CrossRef]
- Pool, M.; Carrera, J.; Alcolea, A.; Bocanegra, E.M. A comparison of deterministic and stochastic approaches for regional scale inverse modeling on the Mar del Plata aquifer. J. Hydrol. 2015, 531, 214–229. [Google Scholar] [CrossRef]
- Wada, Y.; Van Beek, L.P.H.; Van Kempen, C.M.; Reckman, J.W.T.M.; Vasak, S.; Bierkens, M.F.P. Global depletion of groundwater resources. Geophys. Res. Lett. 2010, 37. [Google Scholar] [CrossRef]
- Hani, A.; Lallahem, S.; Mania, J.; Djabri, L. On the use of finite-difference and neural-network models to evaluate the impact of underground water overexploitation. Hydrol. Process. 2006, 20, 4381–4390. [Google Scholar] [CrossRef]
- Carrión, P.; Herrera, G.; Briones, J.; Sánchez, C.; Limón, J. Practical adaptations of ancestral knowledge for groundwater artificial recharge management of Manglaralto coastal aquifer, Ecuador. WIT Trans. Ecol. Environ. 2018, 217, 375–386. [Google Scholar] [CrossRef]
- Bouwer, H. Artificial recharge of groundwater: Hydrogeology and engineering. Hydrogeol. J. 2002, 10, 121–142. [Google Scholar] [CrossRef]
- Voss, C.; Souza, W. Variable density flow and solute transport simulation of regional aquifers containing a narrow freshwater-saltwater transition zone. Water Resour. 1987, 23, 1851–1866. [Google Scholar] [CrossRef]
- Tweed, S.O.; Weaver, T.R.; Cartwright, I. Distinguishing groundwater flow paths in different fractured-rock aquifers using groundwater chemistry: Dandenong Ranges, southeast Australia. Hydrogeol. J. 2005, 13, 771–786. [Google Scholar] [CrossRef]
- Shu, L.; Zou, Z.; Li, F.; Wu, P.; Chen, H.; Xu, Z. Laboratory and numerical simulations of spatio-temporal variability of water exchange between the fissures and conduits in a karstic aquifer. J. Hydrol. 2020, 590, 125219. [Google Scholar] [CrossRef]
- Song, K.; Ren, X.; Mohamed, A.K.; Liu, J.; Wang, F. Research on drinking-groundwater source safety management based on numerical simulation. Sci. Rep. 2020, 10, 1–17. [Google Scholar] [CrossRef]
- Huyakorn, P.S.; Andersen, P.F.; Mercer, J.W.; White, H.O. Saltwater intrusion in aquifers: Development and testing of a three-dimensional finite element model. Water Resour. Res. 1987, 23, 293–312. [Google Scholar] [CrossRef]
- Werner, A.D.; Bakker, M.; Post, V.E.A.; Vandenbohede, A.; Lu, C.; Ataie-Ashtiani, B.; Simmons, C.T.; Barry, D.A. Seawater intrusion processes, investigation and management: Recent advances and future challenges. Adv. Water Resour. 2013, 51, 3–26. [Google Scholar] [CrossRef]
- Lathashri, U.A.; Mahesha, A. Simulation of saltwater intrusion in a coastal aquifer in Karnataka, India. Aquat. Procedia 2015, 4, 700–705. [Google Scholar] [CrossRef]
- Santos, M.R.P.; Santiago, M.M.F.; Mendonça, L.A.R.; Frischkorn, H.; Filho, J.M. Modelagem do transporte de cloreto proveniente de esgoto urbano em um aquífero sedimentar usando MT3D: O caso da bateria de poços de Juazeiro do Norte (CE). Eng. Sanit. Ambient. 2014, 19, 283–292. [Google Scholar] [CrossRef]
- Hirata, R.; Cagnon, F.; Bernice, A.; Maldaner, C.H.; Galvão, P.; Marques, C.; Terada, R.; Varnier, C.; Ryan, M.C.; Bertolo, R. Nitrate contamination in brazilian urban aquifers: A tenacious problem. Water 2020, 12, 2709. [Google Scholar] [CrossRef]
- Tojeda, I.; Cienfuegos, R.; Muñoz, J.; Durán, M. Numerical modeling of saline intrusion in Salar de Atacama. J. Hydrol. Eng. 2003, 25–34. [Google Scholar] [CrossRef]
- Vásquez, C.; Ortiz, C.; Suárez, F.; Muñoz, J.F. Modeling flow and reactive transport to explain mineral zoning in the Atacama salt flat aquifer, Chile. J. Hydrol. 2013, 490, 114–125. [Google Scholar] [CrossRef]
- Hugman, R.; Stigter, T.; Costa, L.; Monteiro, J.P. Numerical modelling assessment of climate-change impacts and mitigation measures on the Querença-Silves coastal aquifer (Algarve, Portugal). Hydrogeol. J. 2017, 25, 2105–2121. [Google Scholar] [CrossRef]
- Datta, B.; Vennalakanti, H.; Dhar, A. Modeling and control of saltwater intrusion in a coastal aquifer of Andhra Pradesh, India. J. Hydro-Environ. Res. 2009, 3, 148–159. [Google Scholar] [CrossRef]
- Mascioli, S.; Benavente, M.; Martínez, D.E. Estimation of transport hydraulic parameters in loessic sediment, Argentina: Application of column tests. Hydrogeol. J. 2005, 13, 849–857. [Google Scholar] [CrossRef]
- Xu, Z.; Hu, B.X.; Xu, Z.; Wu, X. Simulating seawater intrusion in a complex coastal karst aquifer using an improved variable-density flow and solute transport—Conduit flow process model. Hydrogeol. J. 2019, 53. [Google Scholar] [CrossRef]
- Jinno, K.; Tsutsumi, A.; Hiroshiro, Y. Three dimensional solute transport numerical modeling of salinity fluctuations in a coastal aquifer. In Proceedings of the 18th World IMACS Congress and MODSIM09 International Congress on Modelling and Simulation, Cairns, Australia, 13–17 July 2009; pp. 4128–4134. [Google Scholar]
- Herrera-Franco, G.; Carrión-Mero, P.; Alvarado, N.; Morante-Carballo, F.; Maldonado, A.; Caldevilla, P.; Briones-Bitar, J.; Berrezueta, E. Geosites and georesources to foster geotourism in communities: Case study of the santa elena peninsula geopark project in ecuador. Sustainability 2020, 12, 4484. [Google Scholar] [CrossRef]
- El Universo Problemas en Manglaralto. Available online: www.eluniverso.com/opinion/2015/10/19/nota/5192870/problemas-manglaralto (accessed on 30 November 2020).
- Morante, F.; Montalván, F.J.; Carrión, P.; Herrera, G.; Heredia, J.; Elorza, F.J.; Pilco, D.; Solórzano, J. Hydrochemical and geological correlation to establish the groundwater salinity of the coastal aquifer of the Manglaralto River basin, Ecuador. WIT Trans. Ecol. Environ. 2019, 229, 139–149. [Google Scholar] [CrossRef]
- Herrera-Franco, G. Estudio Para Un Modelo de Gestión de Un Acuífero Costero, Mediante Metodologías Participativas y Análisis Geoestadístico en El Marco Del Desarrollo Local. Manglaralto, Ecuador. Doctoral Dissertation, Universidad Politécnica de Madrid, Madrid, Spain, 2015. [Google Scholar]
- Gricelda, H.F.; Paúl, C.M.; Niurka, A.M. Participatory process for local development: Sustainability of water resources in rural communities: Case manglaralto-santa elena, ecuador. World Sustain. Ser. 2018, 663–676. [Google Scholar] [CrossRef]
- Franco, G.H.; Quinchuelaa, T.G.; Macancela, N.A.; Mero, P.C. Participative analysis of socio-ecological dynamics and interactions. A case study of the Manglaralto Coastal Aquifer, Santa Elena-Ecuador. Malays. J. Sustain. Agric. 2017, 1, 19–22. [Google Scholar] [CrossRef]
- Carballo, F.M.; Brito, L.M.; Mero, P.C.; Aguilar, M.A.; Ramírez, J.T. Urban wastewater treatment through a system of green filters in the Montañita commune, Santa elena, Ecuador. WIT Trans. Ecol. Environ. 2019, 239, 233–249. [Google Scholar] [CrossRef]
- Thiel, M.; Macaya, E.C.; Acuña, E.; Arntz, W.E.; Bastias, H.; Brokordt, K.; Camus, P.A.; Castilla, J.C.; Castro, L.R.; Cortés, M.; et al. The humboldt current system of northern and central chile oceanographic processes, ecological interactions and socioeconomic feedback. Oceanogr. Mar. Biol. 2007, 45, 195–344. [Google Scholar]
- Montecino, V.; Lange, C.B. The Humboldt Current System: Ecosystem components and processes, fisheries, and sediment studies. Prog. Oceanogr. 2009, 83, 65–79. [Google Scholar] [CrossRef]
- Peel, M.C.; Finlayson, B.L.; McMahon, T.A. Updated world map of the Köppen-Geiger climate classification. Hydrol. Earth Syst. Sci. 2007, 11, 1633–1644. [Google Scholar] [CrossRef]
- Herrera-Franco, G.; Carrión-Mero, P.; Aguilar-Aguilar, M.; Morante-Carballo, F.; Jaya-Montalvo, M.; Morillo-Balsera, M.C. Groundwater resilience assessment in a communal coastal aquifer system. The case of Manglaralto in Santa Elena, Ecuador. Sustainability 2020, 19, 8290. [Google Scholar] [CrossRef]
- Herrera Franco, G.; Flores Ruíz, D.; Herrera Franco, D.; Flores Ruiz, G. Aspectos socioeconómicos de la gestión del agua y el turismo en las comunas Olón y Manglaralto de la provincia de Santa Elena (Ecuador). In Cooperación Transfronteriza Andalucía-Algarve-Alentejo; Universidad de Huelva: Huelva, Spain, 2009; pp. 250–252. [Google Scholar]
- Groundwater Hydrology Group Visual Transin. Available online: https://h2ogeo.upc.edu/en/investigation-hydrogeology/software/152-visual-transin-en (accessed on 30 November 2020).
- Heredia, J.; Murillo Díaz, J.M. Estado del arte sobre la representación numérica de sistemas de flujo bajo condiciones de densidad variable. Bol. Geol. Min. 2007, 118, 555–576. [Google Scholar]
- Franco, H.G.; Mero, C.P.; Bitar, B.J. Management practices for a sustainable community and its impact on development, Manglaralto-Santa elena, Ecuador. Proc. LACCEI Int. Multi-Conf. Eng. Educ. Technol. 2019, 2019, 24–26. [Google Scholar] [CrossRef]
- Nuñez del Arco, E. Geología del Ecuador; Escuela Superior Politécnica del Litoral: Guayaquil, Ecuador, 2003. [Google Scholar]
- Ávila-Dávila, L.; Soler-Méndez, M.; Madrona-Sánchez, P.; Ruiz-Canales, A.; Bautista-Capetillo, C.F.; González-Trinidad, J.; Molina-Martínez, J.M. Análisis de la velocidad de infiltración del agua en el suelo saturados mediante lisímetros de pesada. 2019, pp. 642–648. Available online: https://zaguan.unizar.es/record/84426?ln=en (accessed on 30 November 2020). [CrossRef]
- Ojeda, A.; Mc Leod, C.; Águila, K.; Pino, M.T. Bases para la determinación de las necesidades hídricas del cultivo del calafate in situ, para su adaptación al manejo agronómico. Inf. INIA Kampenaike 2018, 79, 1–6. Available online: https://biblioteca.inia.cl/handle/123456789/4880 (accessed on 30 November 2020).
- Toala, J.M.F.; Quinde, M.C.M.; Gómez, G.R. Hydrological modeling of the manglaralto river for the generation of flood maps (Santa Elena-Ecuador). Proc. LACCEI Int. Multi-Conf. Eng. Educ. Technol. 2020, 27–31. [Google Scholar] [CrossRef]
- Catuto, M. Modelación Hidrológica del río Manglaralto para la Generación de Mapas de Inundación de la Parroquia Manglaralto Provincia de Santa Elena. Bachelor’s Thesis, Universidad Estatal Península de Santa Elena, Santa Elena, Ecuador, 2020. [Google Scholar]
- Sanchez, J. Evapotranspiración. Univ. Salamanca 2015, 1, 1–9. [Google Scholar]
- Motallebian, M.; Ahmadi, H.; Raoof, A.; Cartwright, N. An alternative approach to control saltwater intrusion in coastal aquifers using a freshwater surface recharge canal. J. Contam. Hydrol. 2019, 222, 56–64. [Google Scholar] [CrossRef]
- Lèye, B.; Koko, J.; Kane, S.; Sy, M. Numerical simulation of saltwater intrusion in coastal aquifers with anisotropic mesh adaptation. Math. Comput. Simul. 2018, 154, 1–18. [Google Scholar] [CrossRef]


| International Projects | Name |
|---|---|
| International Atomic Energy Agency (IAEA): | Characterization of Coastal Aquifers in the Santa Elena Peninsula-ECU/8/026 |
| Application of Isotopic Tools for Integrated Management of Coastal Aquifers-RLA/8/041 | |
| Improving Knowledge of Groundwater Resources to Contribute to Their Protection, Integrates Management and Governance (CXXVII)-RLA 7/018 | |
| Integrating Isotope Hydrology in National Comprehensive Water Resources Assessments-RLA 7/024 | |
| Improvement of the Management of Coastal Aquifers by Studying the Recharge Rate of the Alluvial Aquifer of the Manglaralto River Basin-ECU/7/005 | |
| Use of Isotopes for the Hydrogeological Evaluation of Excessively Exploited Aquifers in Latin America (CXXVII)-RLA/7/016 | |
| National Projects | Name |
| Social Link Project of Polytechnic University (ESPOL) | Hydrology and Hydrogeology Applied to the Coastal Aquifer of Manglaralto (Phase I, II, and III) -PG03-PY18-13 |
| Comprehensive Water Management in the Hydrogramic Basins of the Manglaralto Parish-PG03-PY19-09 | |
| Resilience in Water Management, in the Face of COVID-19, Manglaralto-PG03-PY20-03 | |
| University of Santa Elena (UPSE) | Geophysical and Hydrochemical Characterization of the Manglaralto Aquifer for the Sustainability of the Water Resource- 91870000.0000.382444 |
| Boundary Condition | First Layer | Second Layer |
|---|---|---|
| Prescribed level | Sea level | Sea level |
| Reservoir (tape) Rivers | ||
| Prescribed flow | Pumping Lateral recharge | Q = 0 |
| Mixed condition or Cauchy (leaked) | Reservoir (tape) Rivers | - |
| Boundary Condition | First Layer (Mass Flow) | Second Layer |
|---|---|---|
| External concentrations | Sea level Reservoir (tape) Rivers Lateral recharge Pumping | Sea level (mass flow) Basement (prescribed concentration) |
| Year | Recharge [mm] | PET [mm] | ||
|---|---|---|---|---|
| February | March | August | March | |
| 2018 | 5.6 | - | 7.3 | 200.16 |
| 2019 | 9.9 | 3.2 | 7.3 | 197.55 |
| 2020 | 3.8 | - | - | 193.70 |
| Year | Recharge [mm] | PET [mm] | Precipitation [mm] |
|---|---|---|---|
| 2018 | 12.9 | 1584.89 | 127.3 |
| 2019 | 20.3 | 1596.95 | 213.4 |
| 2020 | 3.8 | 1303.27 | 38 |
| Soil Characteristics | Value |
|---|---|
| Field capacity (volumetric content) | 0.1 |
| Initial humidity (volumetric content) | 0 |
| Soil root thickness (m) | 0.25 |
| Wilting point (volumetric content) | 0.100 |
| Rolling value (mm) | 10 |
| Layers | Zones | Transmissivity (m2/d) | Storage Coefficient | |
|---|---|---|---|---|
| Value | Value | |||
| Layer 1 | High zone | Aq1 | 200 | 0.1 |
| Middle zone | Aq2 | 600 | 0.1 | |
| Low zone (Aq3) | Aq3-1 | 1000 | 0.1 | |
| Aq3-2 | 1000 | 0.1 | ||
| Aq3-3 | 1000 | 0.1 | ||
| Aq3-4 | 1000 | 0.1 | ||
| Aq3-5 | 1000 | 0.1 | ||
| Aq3-6 | 1000 | 0.2 | ||
| Aq3-7 | 2000 | 0.2 | ||
| Aq3-8 | 1000 | 0.1 | ||
| Layer 2 | One zone for the whole domain | 0.00000001 | 0.2 | |
Publisher’s Note: MDPI stays neutral with regard to jurisdictional claims in published maps and institutional affiliations. |
© 2021 by the authors. Licensee MDPI, Basel, Switzerland. This article is an open access article distributed under the terms and conditions of the Creative Commons Attribution (CC BY) license (http://creativecommons.org/licenses/by/4.0/).
Share and Cite
Carrión-Mero, P.; Montalván, F.J.; Morante-Carballo, F.; Loor-Flores de Valgas, C.; Apolo-Masache, B.; Heredia, J. Flow and Transport Numerical Model of a Coastal Aquifer Based on the Hydraulic Importance of a Dyke and Its Impact on Water Quality. Manglaralto—Ecuador. Water 2021, 13, 443. https://doi.org/10.3390/w13040443
Carrión-Mero P, Montalván FJ, Morante-Carballo F, Loor-Flores de Valgas C, Apolo-Masache B, Heredia J. Flow and Transport Numerical Model of a Coastal Aquifer Based on the Hydraulic Importance of a Dyke and Its Impact on Water Quality. Manglaralto—Ecuador. Water. 2021; 13(4):443. https://doi.org/10.3390/w13040443
Chicago/Turabian StyleCarrión-Mero, Paúl, F. Javier Montalván, Fernando Morante-Carballo, Carolina Loor-Flores de Valgas, Boris Apolo-Masache, and Javier Heredia. 2021. "Flow and Transport Numerical Model of a Coastal Aquifer Based on the Hydraulic Importance of a Dyke and Its Impact on Water Quality. Manglaralto—Ecuador" Water 13, no. 4: 443. https://doi.org/10.3390/w13040443
APA StyleCarrión-Mero, P., Montalván, F. J., Morante-Carballo, F., Loor-Flores de Valgas, C., Apolo-Masache, B., & Heredia, J. (2021). Flow and Transport Numerical Model of a Coastal Aquifer Based on the Hydraulic Importance of a Dyke and Its Impact on Water Quality. Manglaralto—Ecuador. Water, 13(4), 443. https://doi.org/10.3390/w13040443