
Construction and Application of Reservoir Flood Control Operation Rules Using the Decision Tree Algorithm


Abstract
:1. Introduction
2. Proposed Method
2.1. DT Algorithm
2.2. Construction of DT-Based Flood Control Operation Rules
2.2.1. Generation of Reservoir Flood Control Operation Dataset
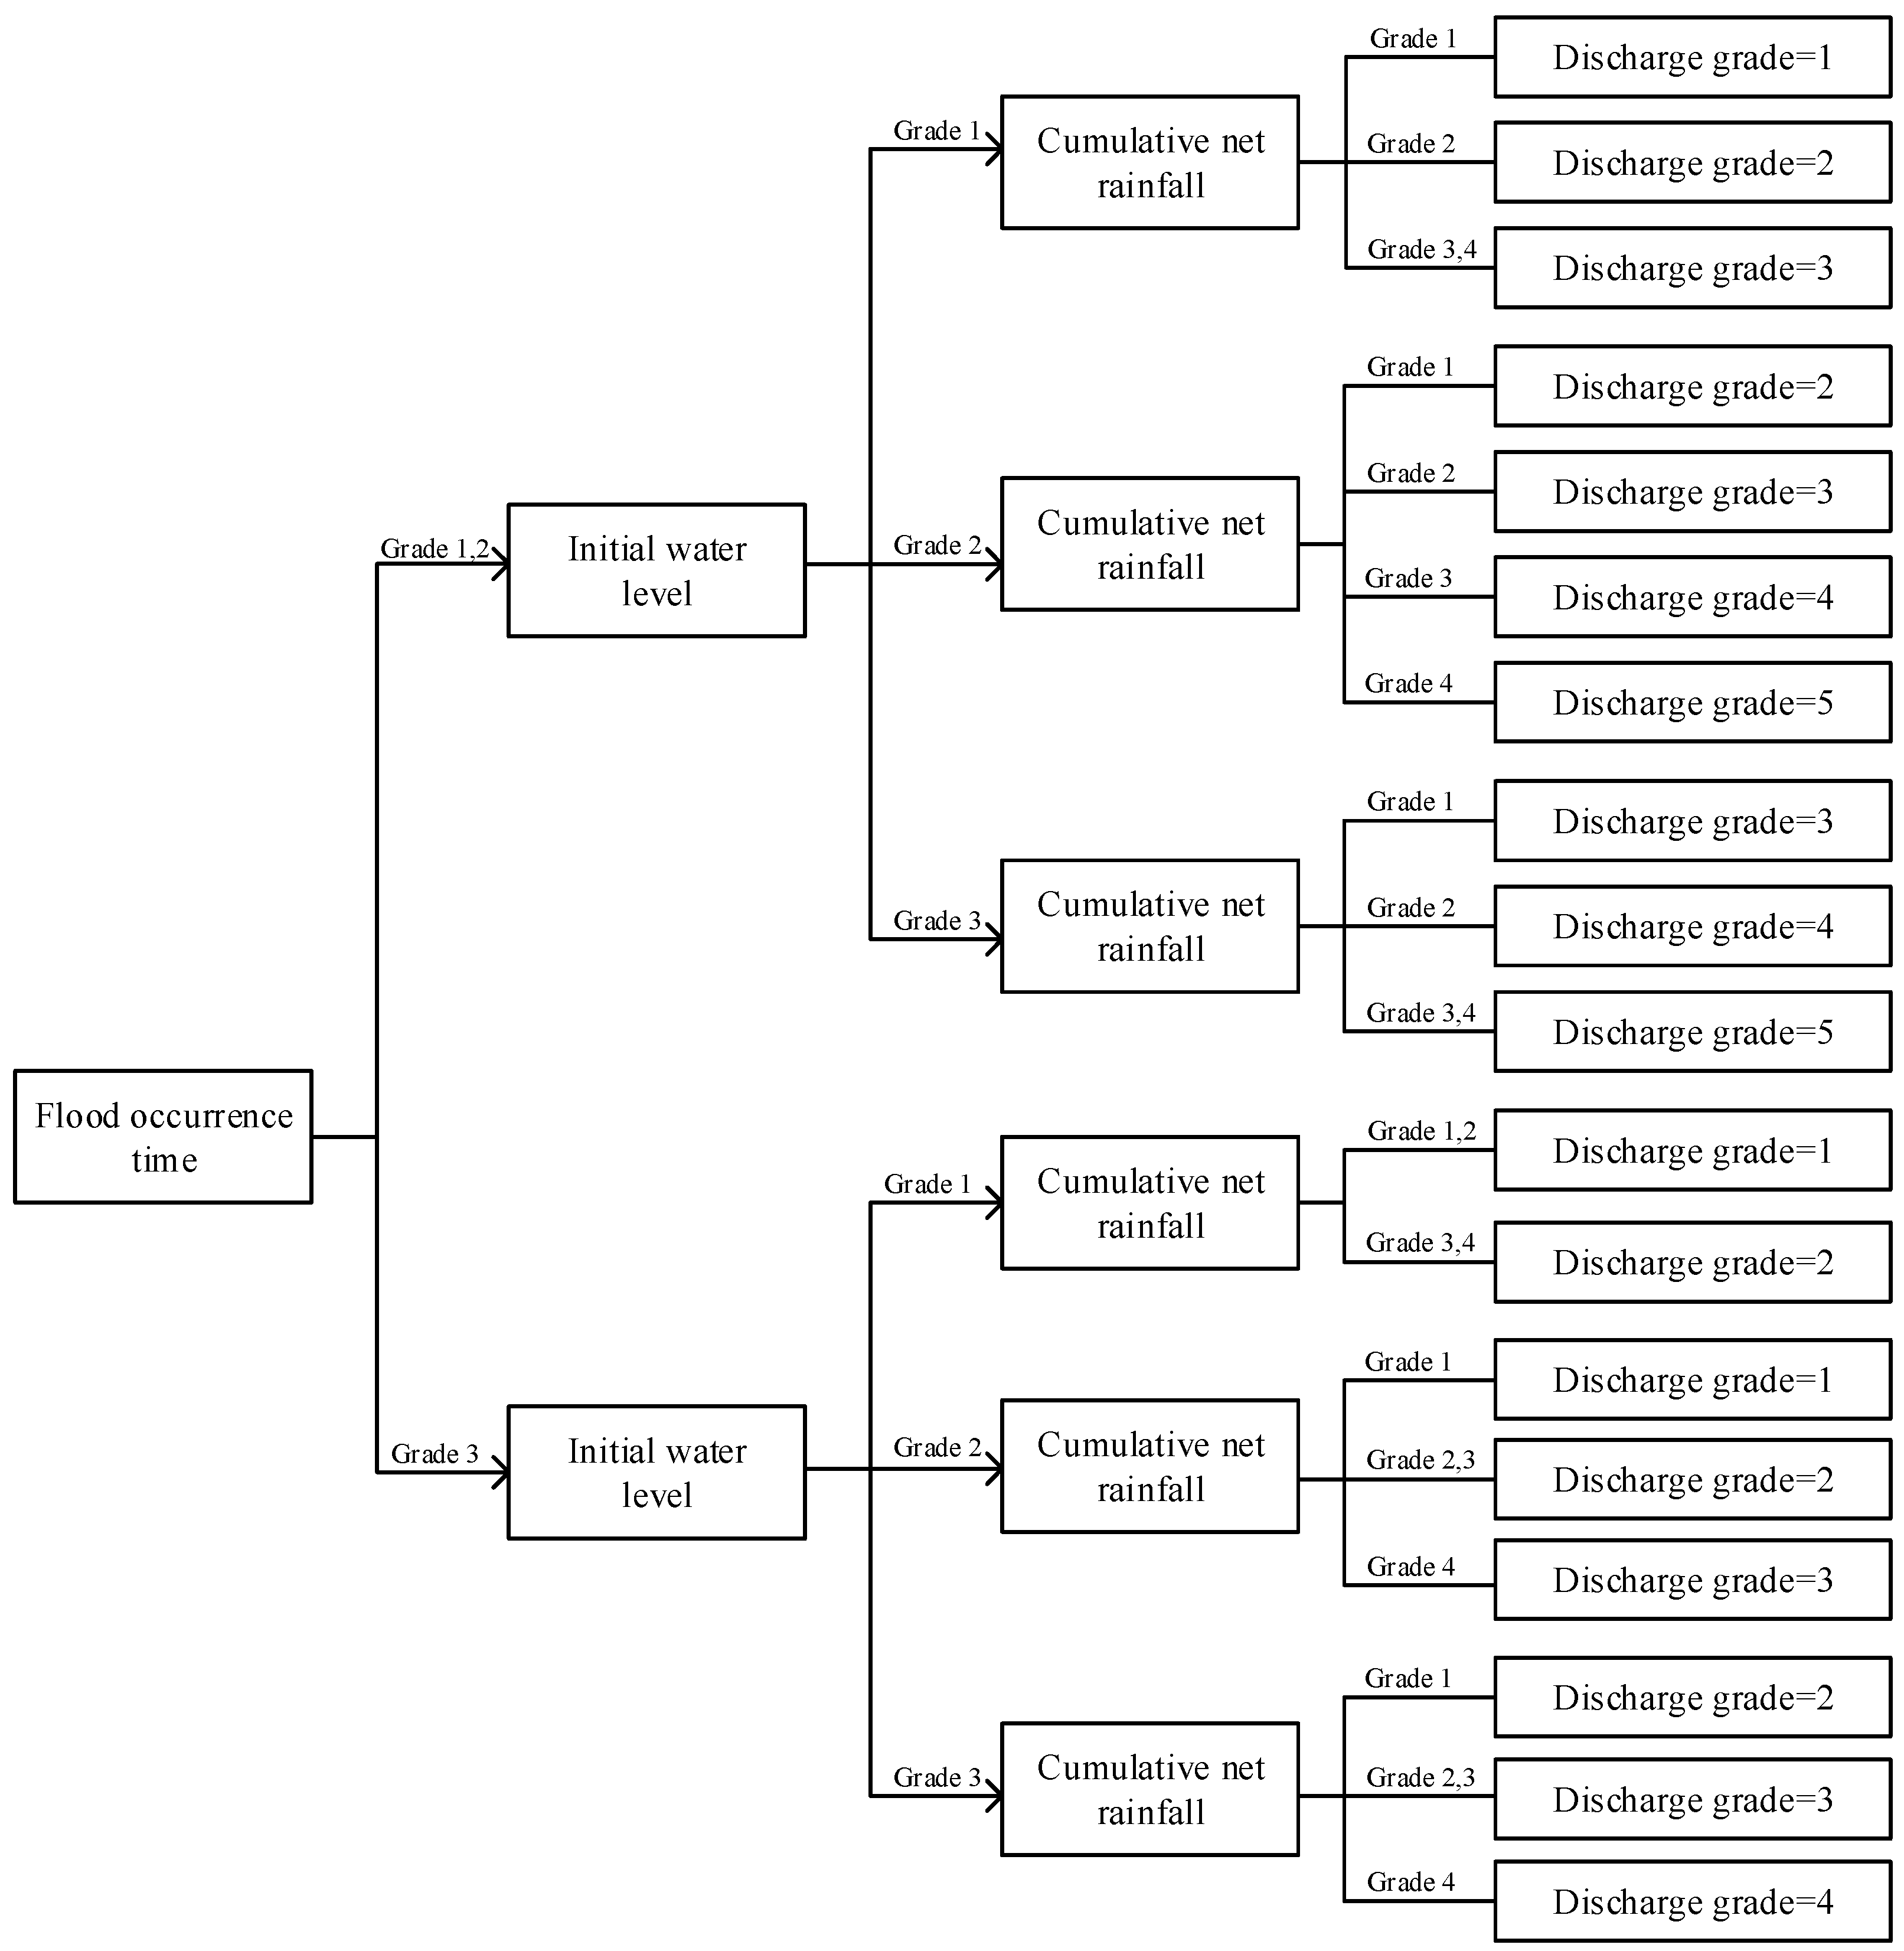
2.2.2. Construction of DT-Based Rules
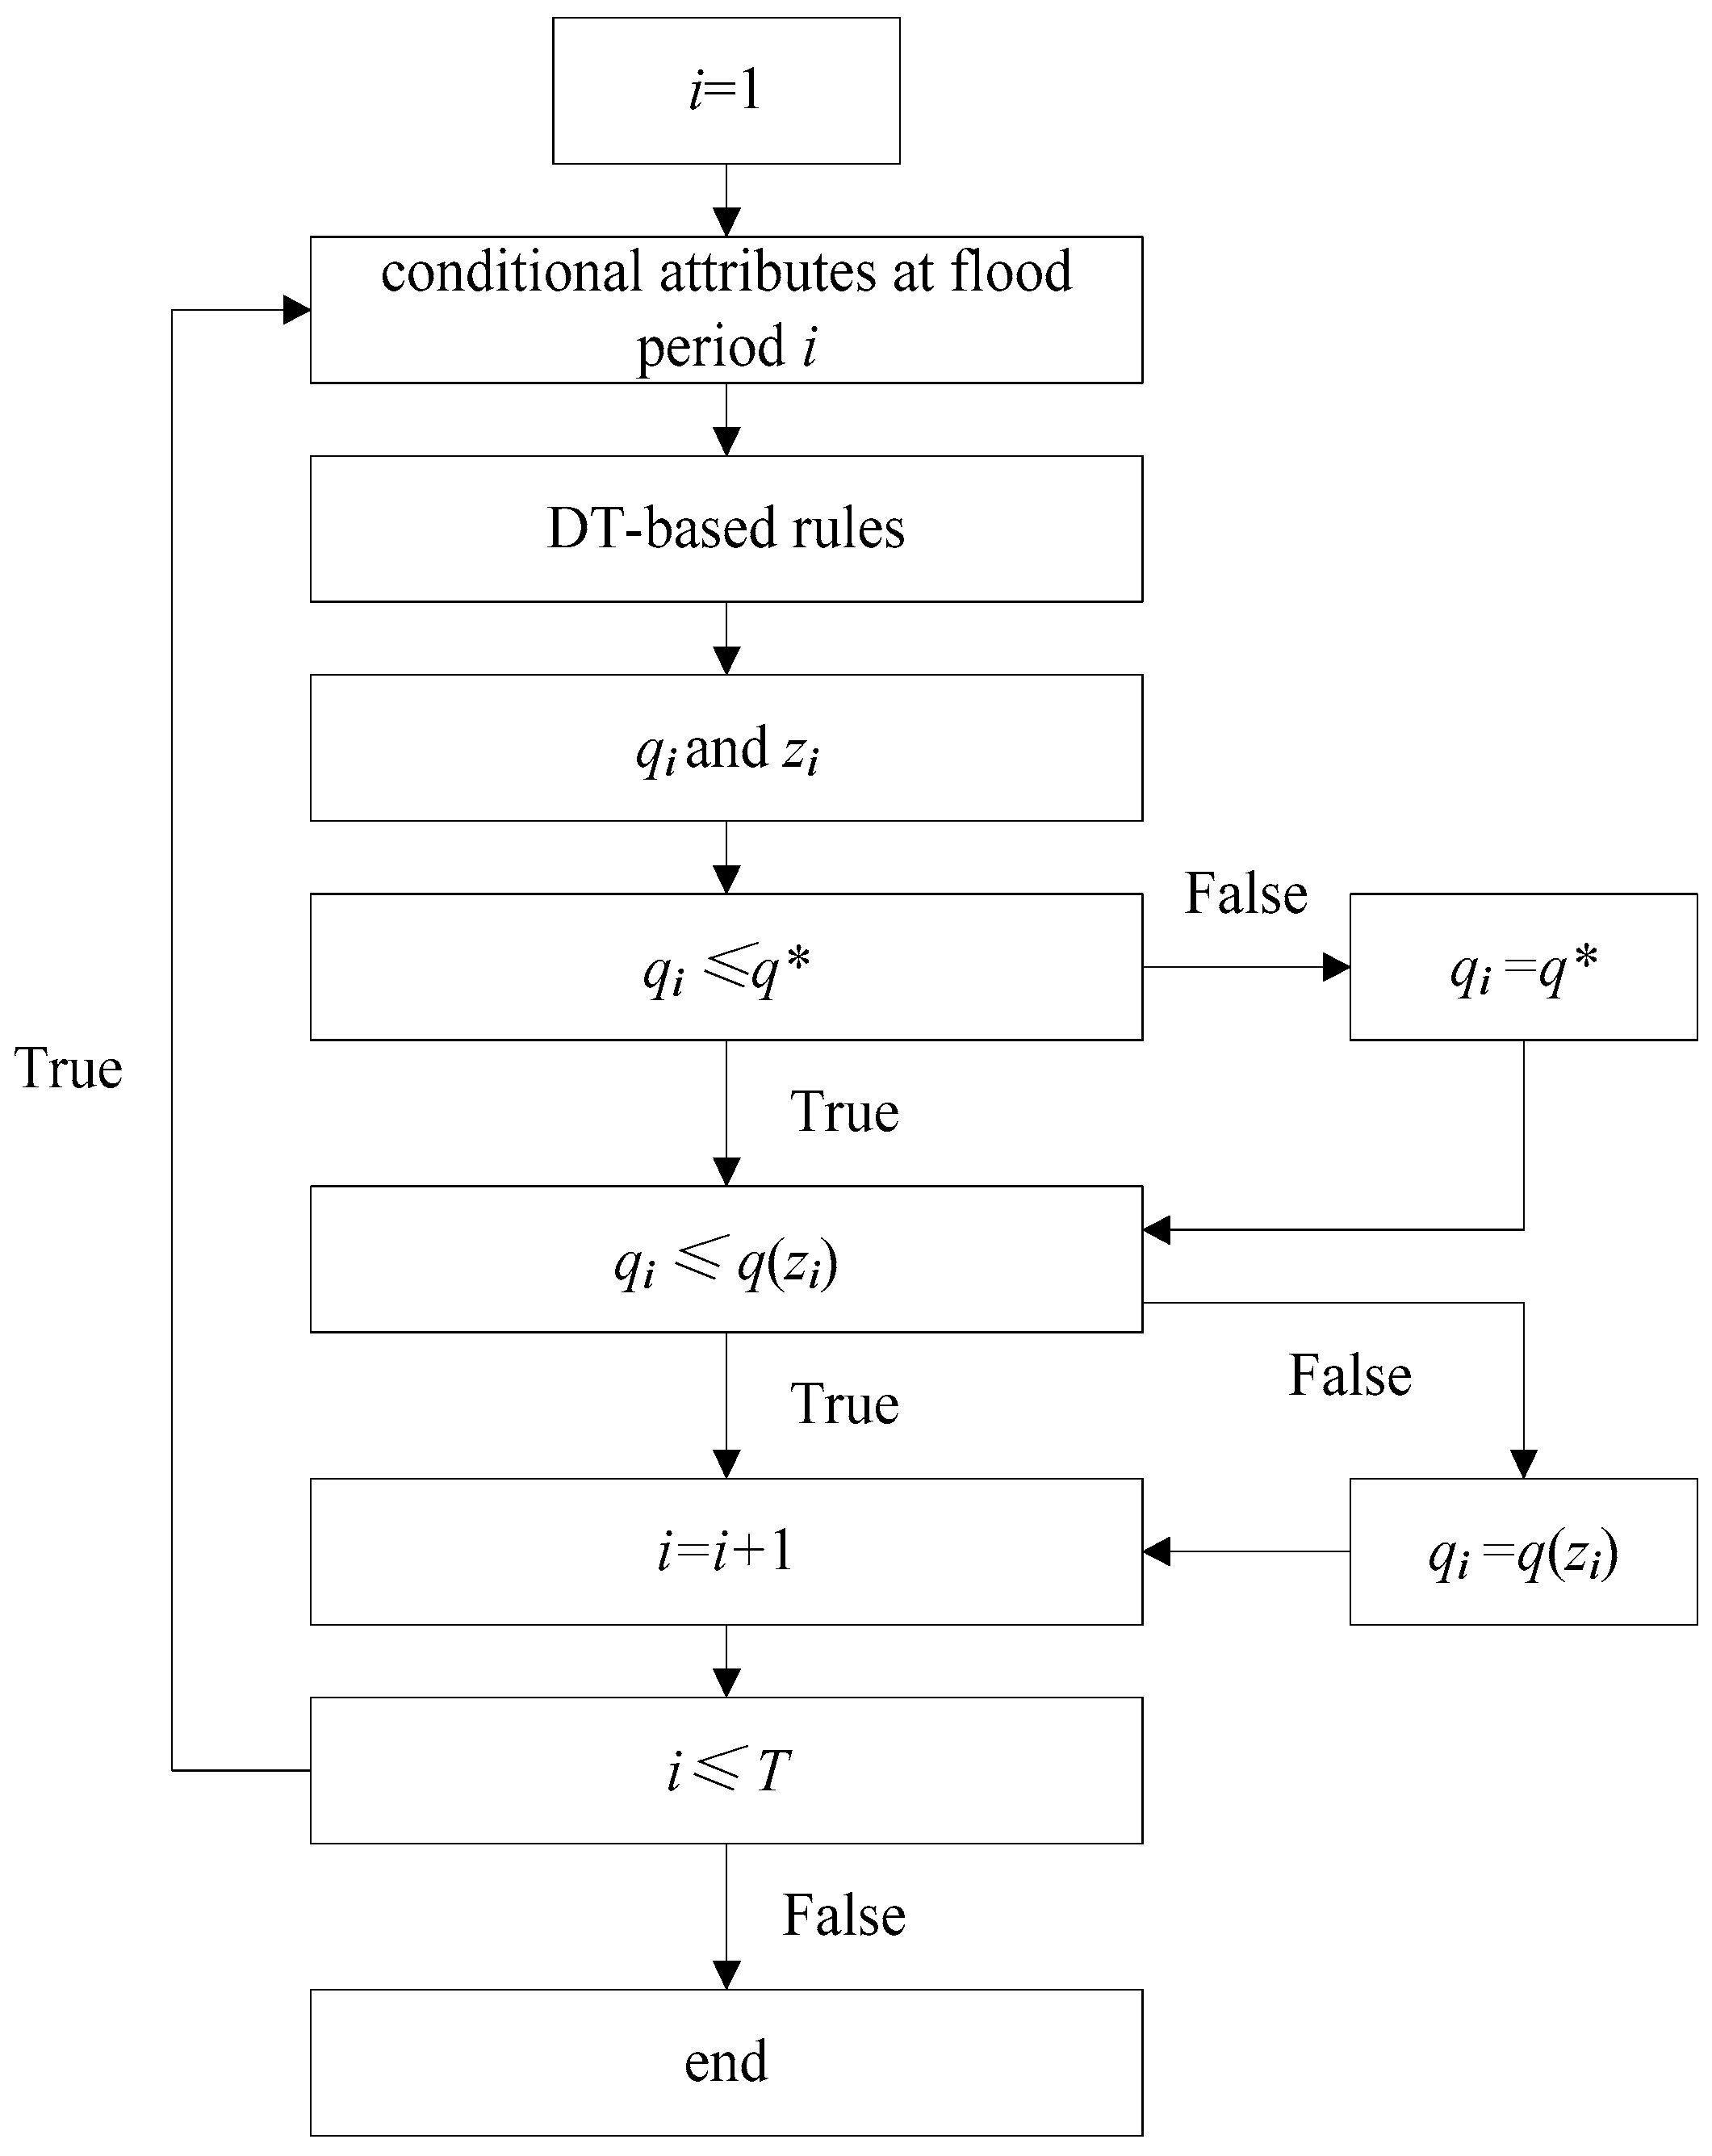
2.3. Real-Time Operation Procedure
3. Case Study
3.1. Study Area
3.2. Flood Control Operation Dataset for the Rizhao Reservoir
3.3. Construction of DT-Based Rules for the Rizhao Reservoir
3.4. Results and Discussion
- (1)
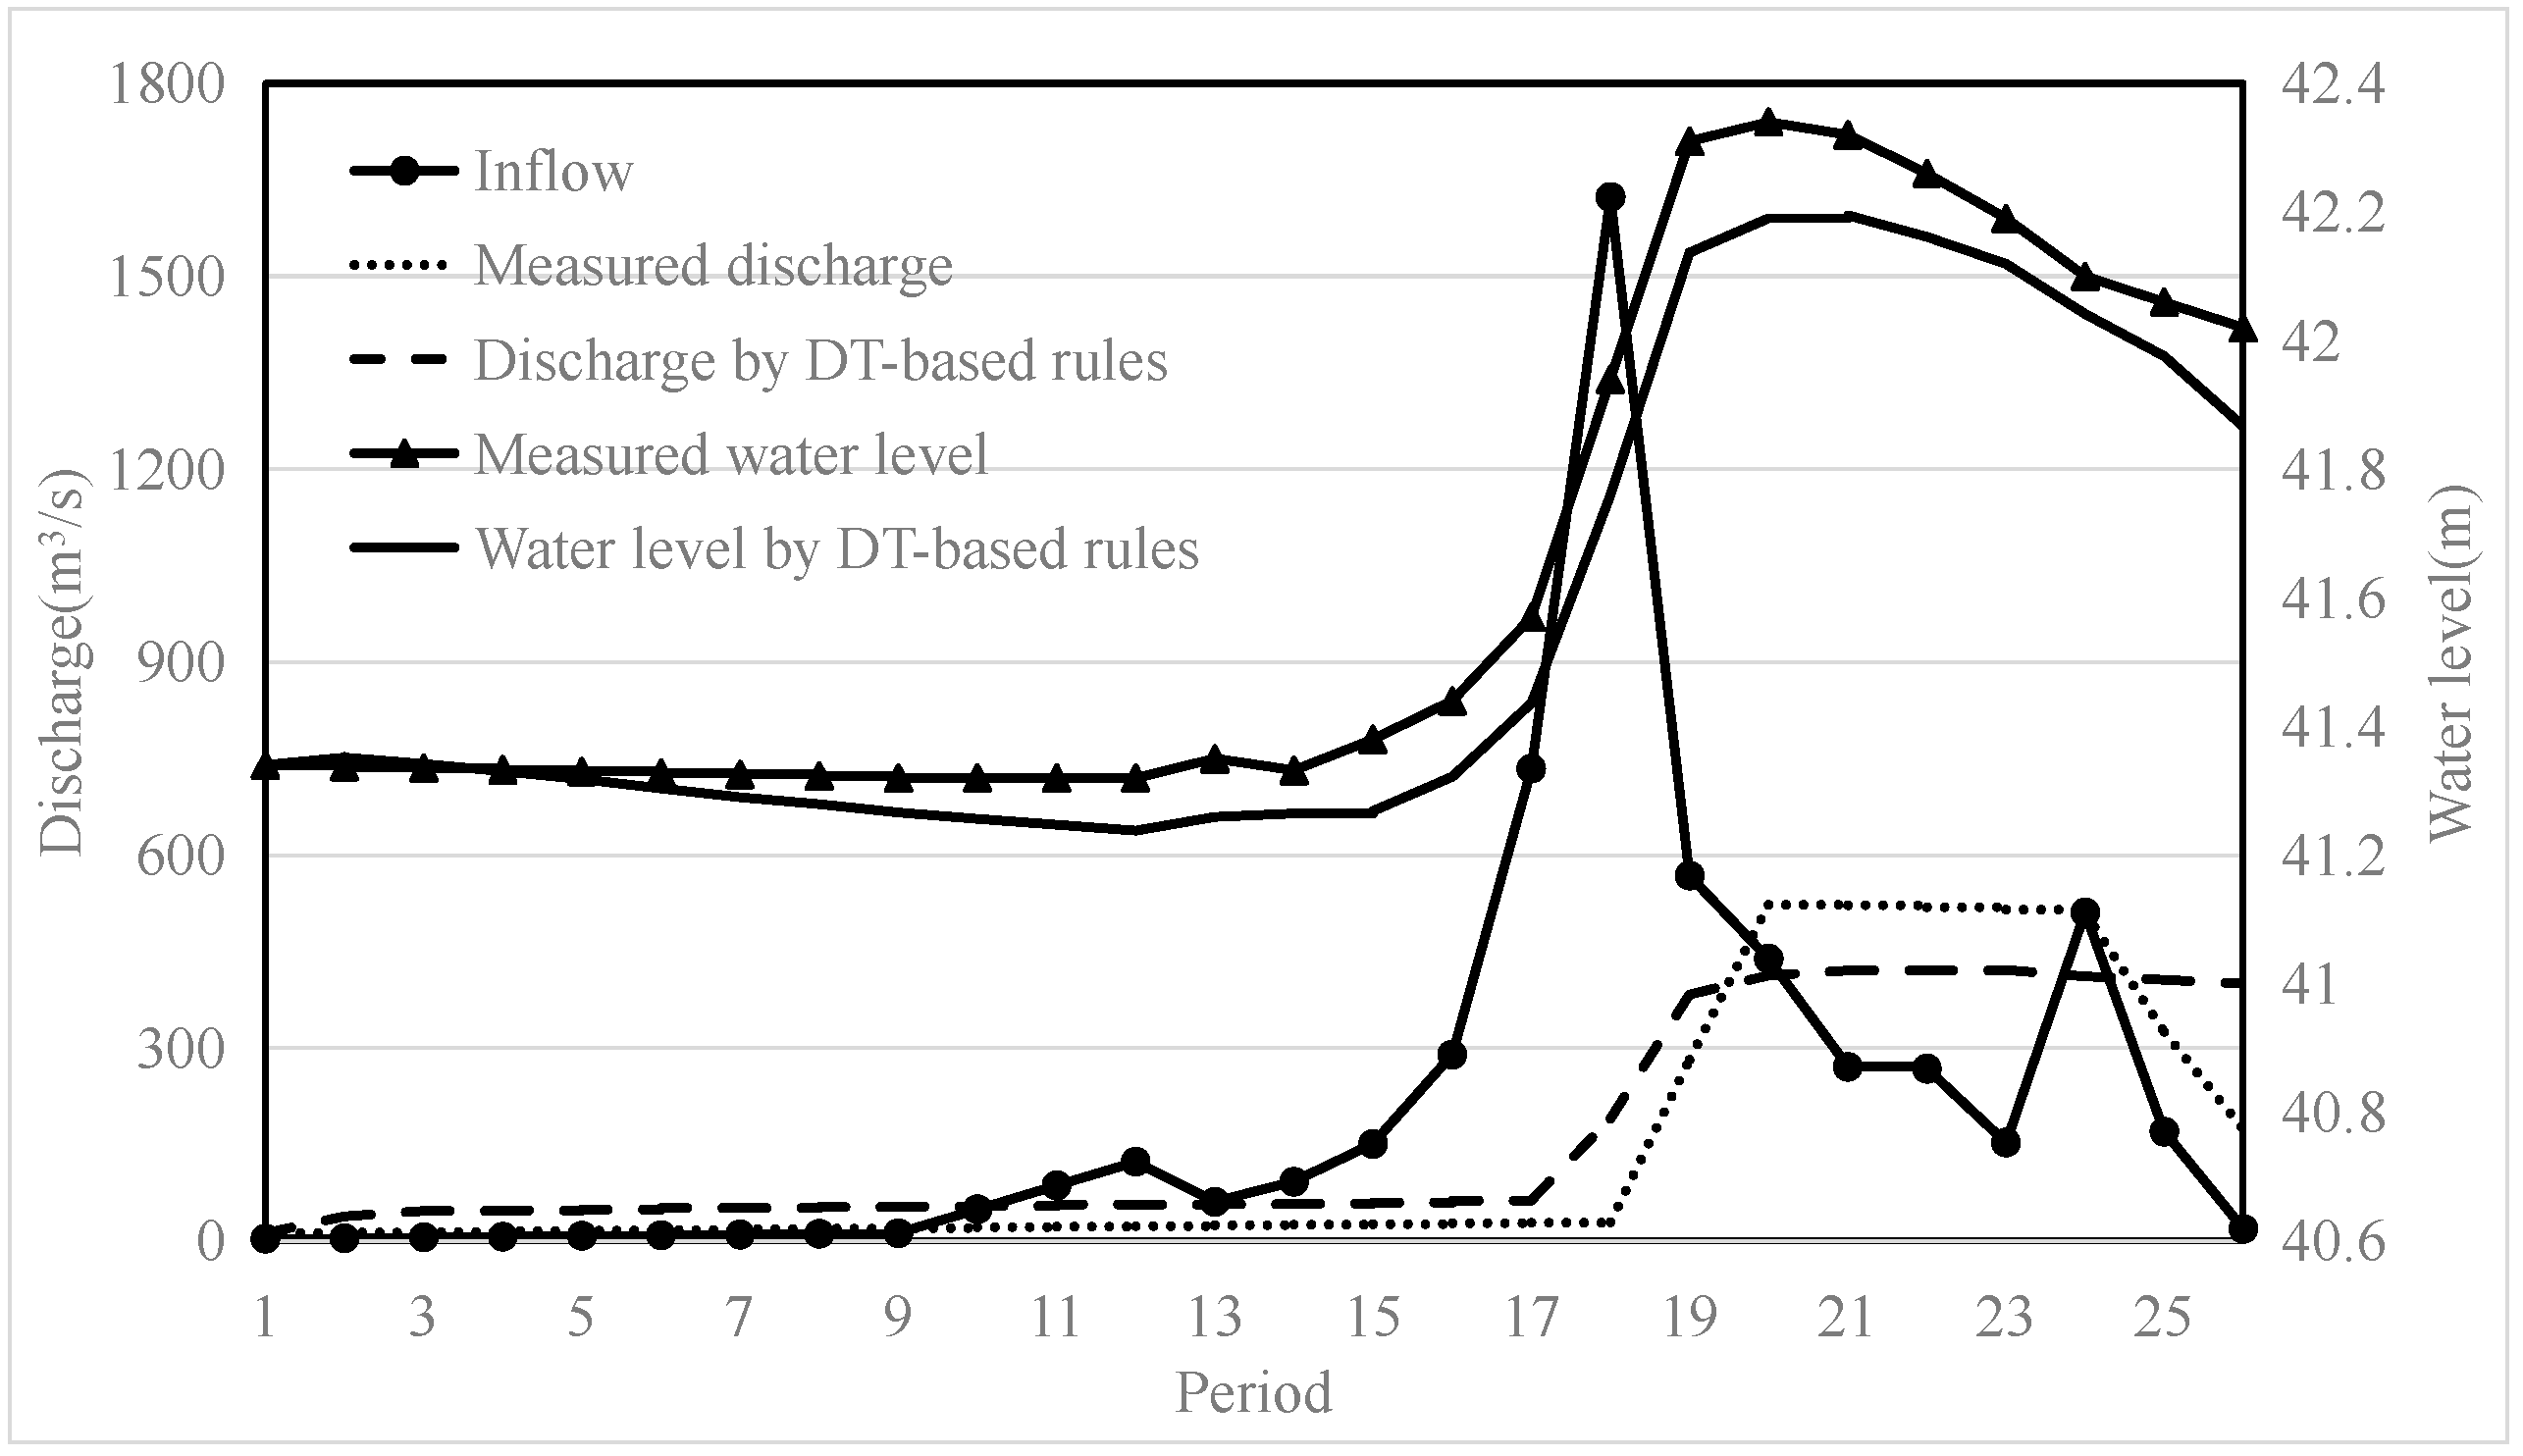
- For the 12 Aug 2019 flood, the maximum discharge of the operating scheme formulated using the conventional operation rules was the largest, followed by that of the operating scheme formulated using the DT-based rules, while the measured maximum discharge was the smallest; the relative error between ① and ② was small (5.0%), whereas the relative error between ① and ③ was large, reaching 58.33%. The measured maximum water level was the largest, followed by the maximum water level of the operating scheme formulated using the DT-based rules, while that of the operating scheme formulated using the conventional operation rules was the smallest; the relative errors between ① and ② and between ① and ③ were both small (0.3% and 0.48%, respectively). It can be observed that the operating scheme formulated using the conventional operation rules was the best in terms of reservoir safety because its maximum water level was the smallest. However, this condition was the most unsafe downstream because the corresponding maximum discharge was the largest. The measured operating scheme was the best in terms of downstream safety because its maximum discharge was the smallest. However, this condition exhibited the highest maximum water level, indicating that it was the worst operating scheme in terms of reservoir safety. The maximum discharge and maximum water level provided by the operating scheme formulated using the DT-based rules were between those of the measured values and the operating scheme formulated using the conventional operation rules. At the same time, the maximum discharge of 1200 m3/s provided by the operating scheme formulated using the DT-based rules remained below the controlled discharge of 1900 m3/s, indicating that it realized a suitable compromise and is therefore feasible.
- (2)
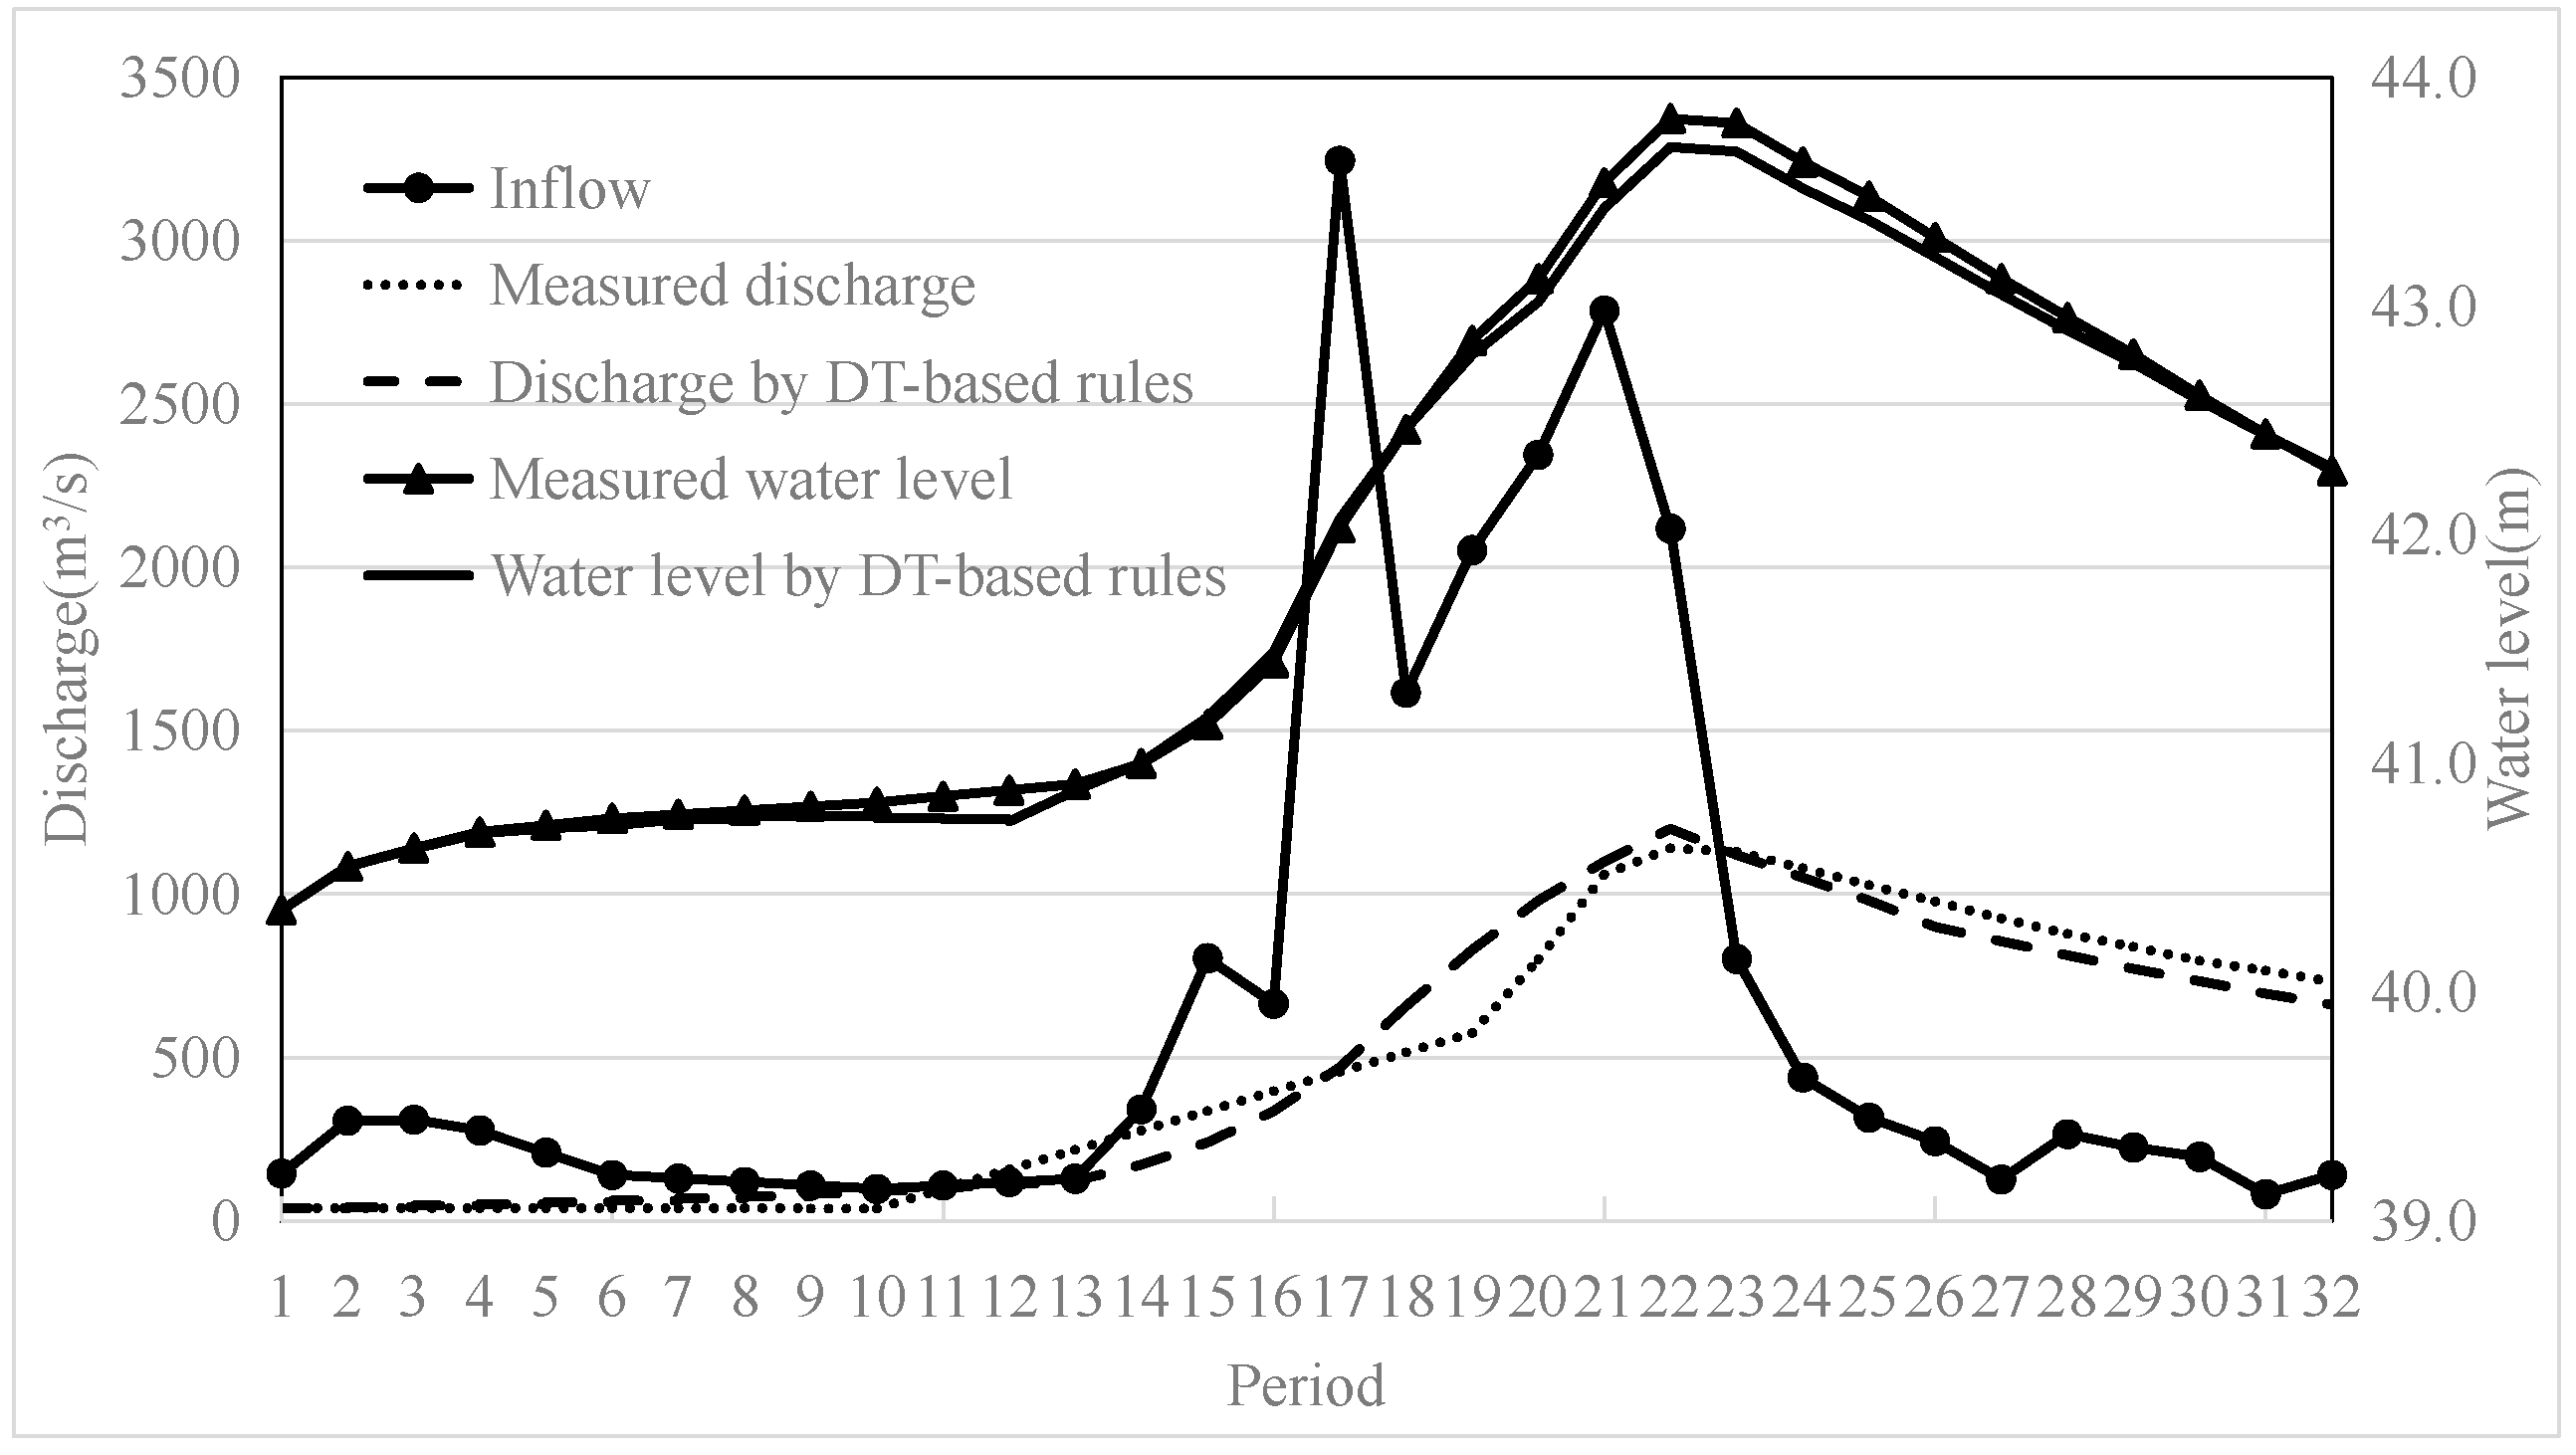
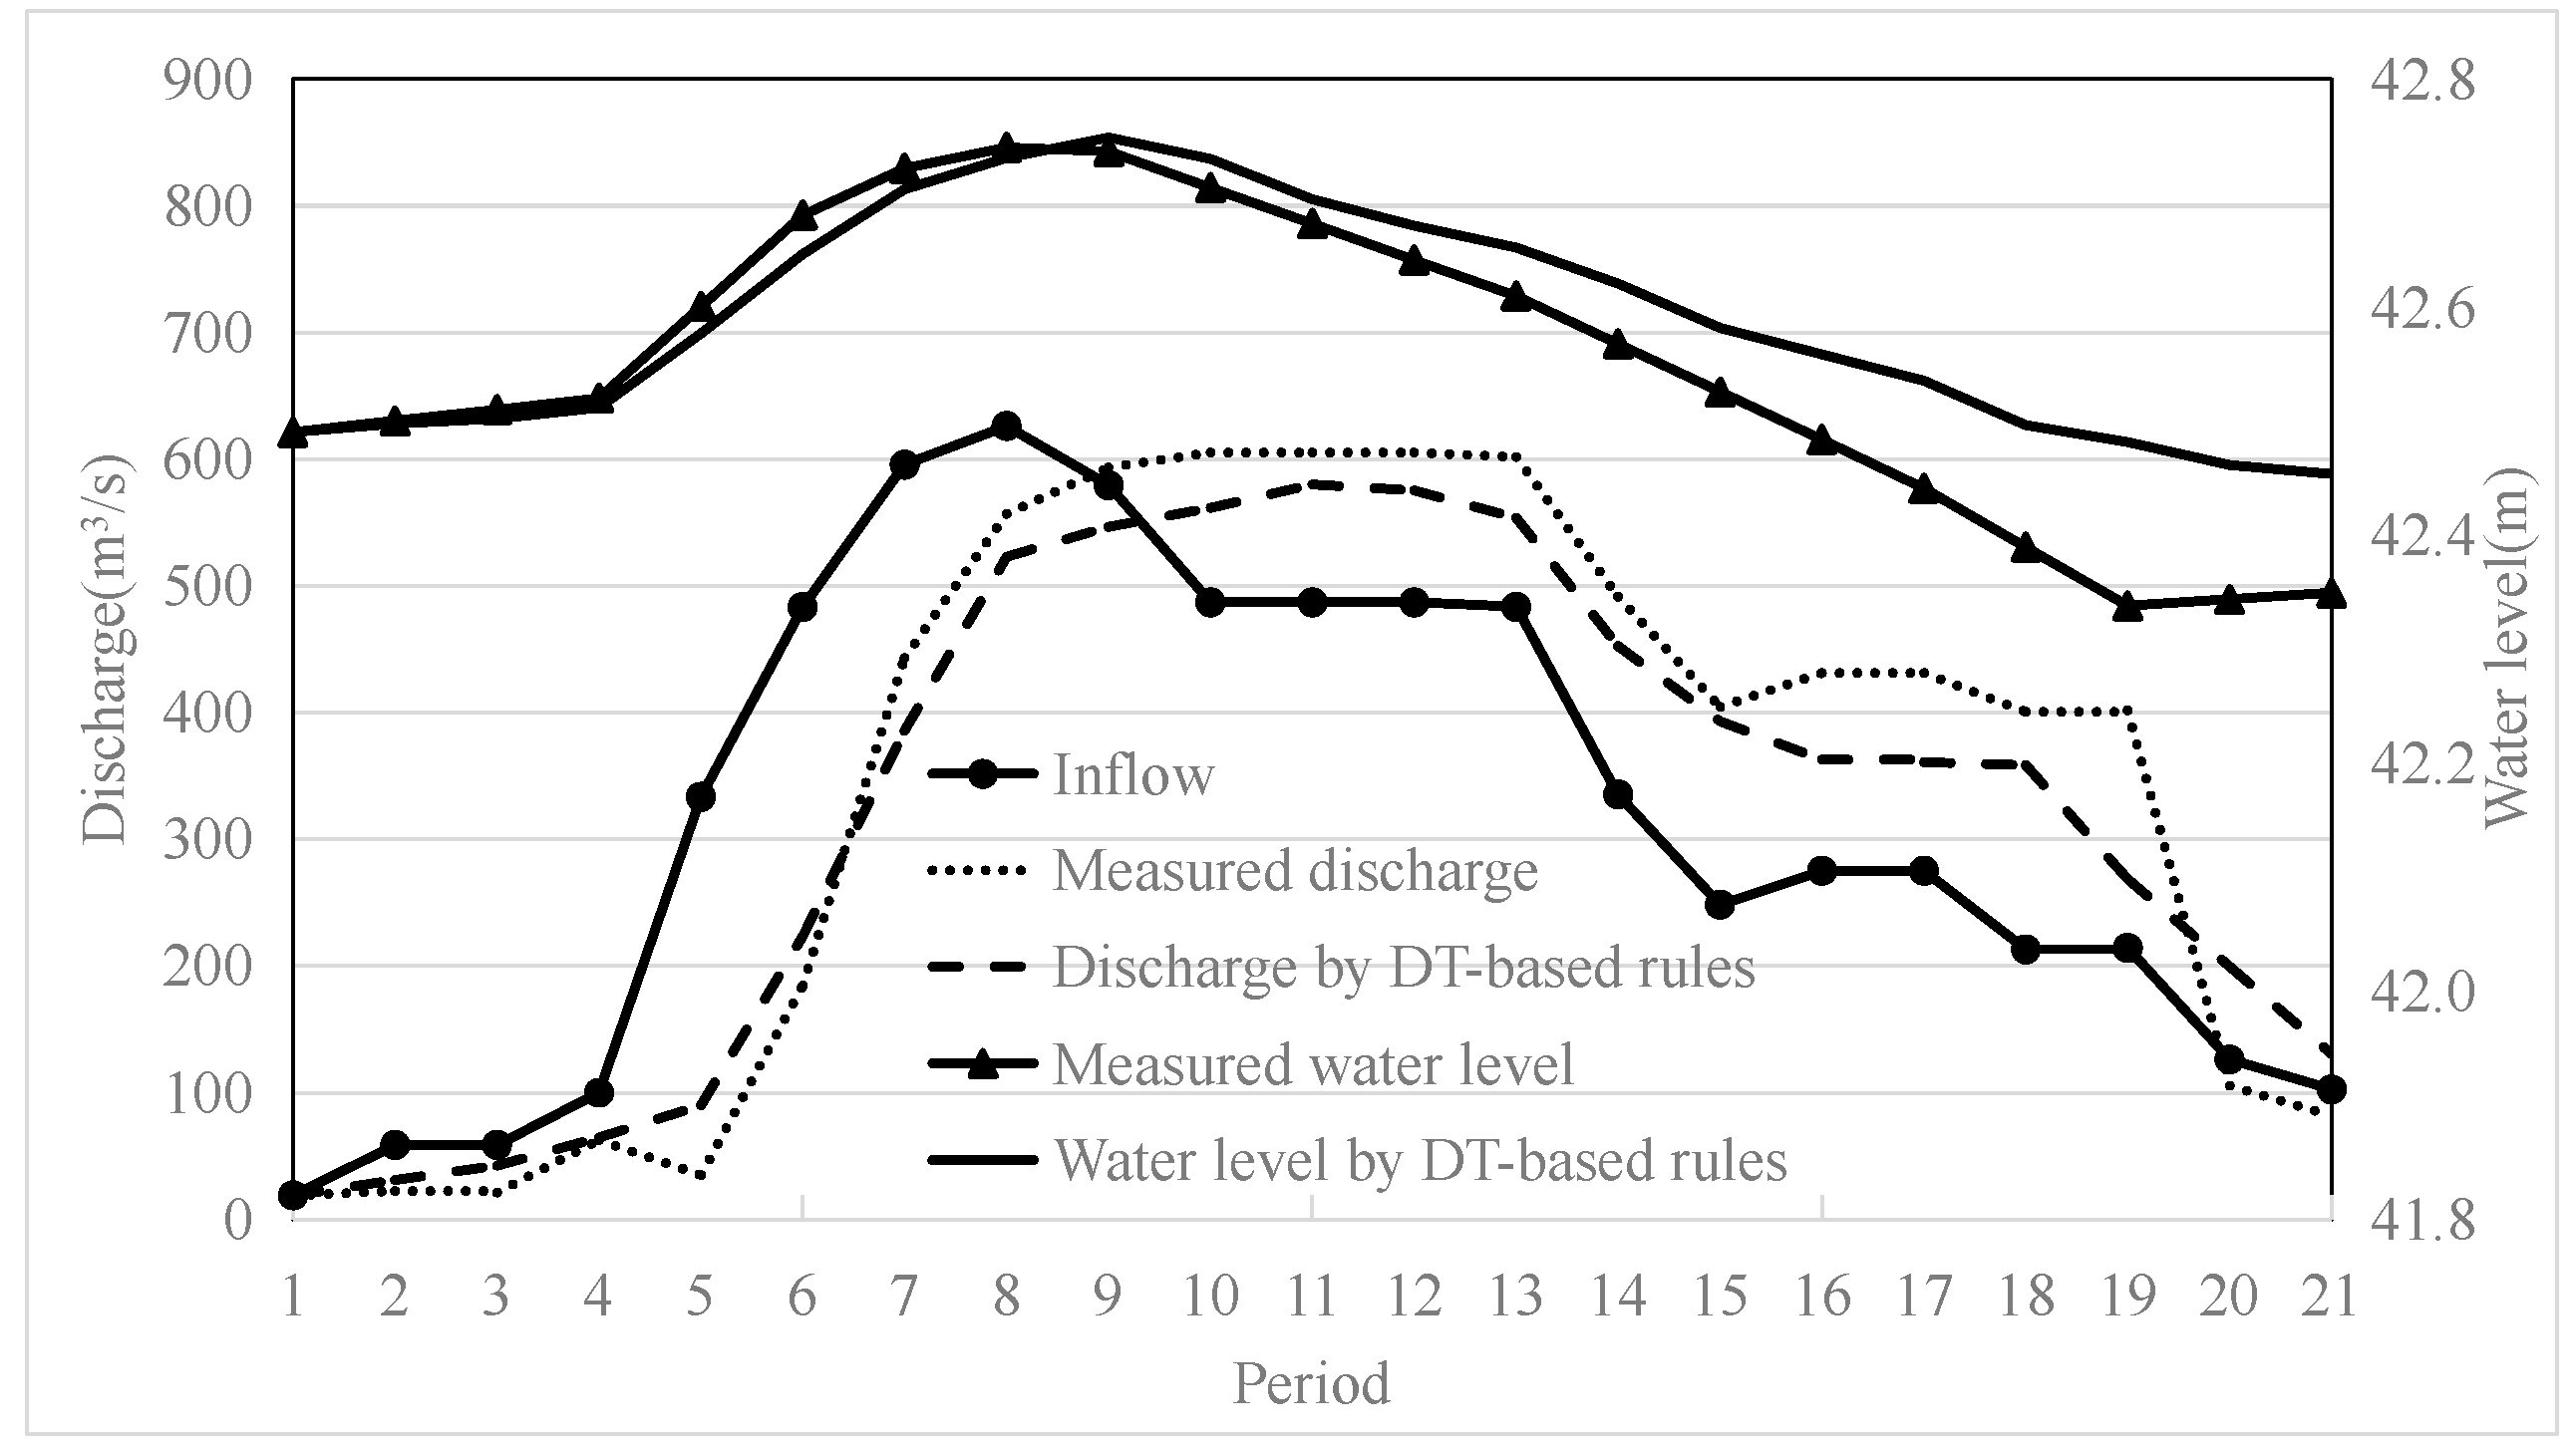
- For the 22 July 2020 flood, the maximum discharge of the operating scheme formulated using the conventional operation rules was the largest, followed by the measured maximum discharge, while the maximum discharge of the operating scheme formulated using the DT-based rules was the smallest; the relative error between ① and ② was small (24.23%) whereas the relative error between ① and ③ was large, reaching 137.53%. The measured maximum water level was the largest, followed by the maximum water level of the operating scheme formulated using the conventional operation rules, while that of the operating scheme formulated using DT-based rules was the smallest; the relative errors between ① and ② and between ① and ③ were both small (0.36% and 0.07%, respectively). It can be observed that the operating scheme formulated using the DT-based rules was the best in terms of both reservoir safety and downstream safety because its water level and discharge were simultaneously the smallest. At the same time, the discharge of 421 m3/s dictated by the operating scheme formulated using the DT-based rules was less than the control discharge of 1000 m3/s, confirming that this operating scheme was indeed the best among the three evaluated for this flood.
- (3)
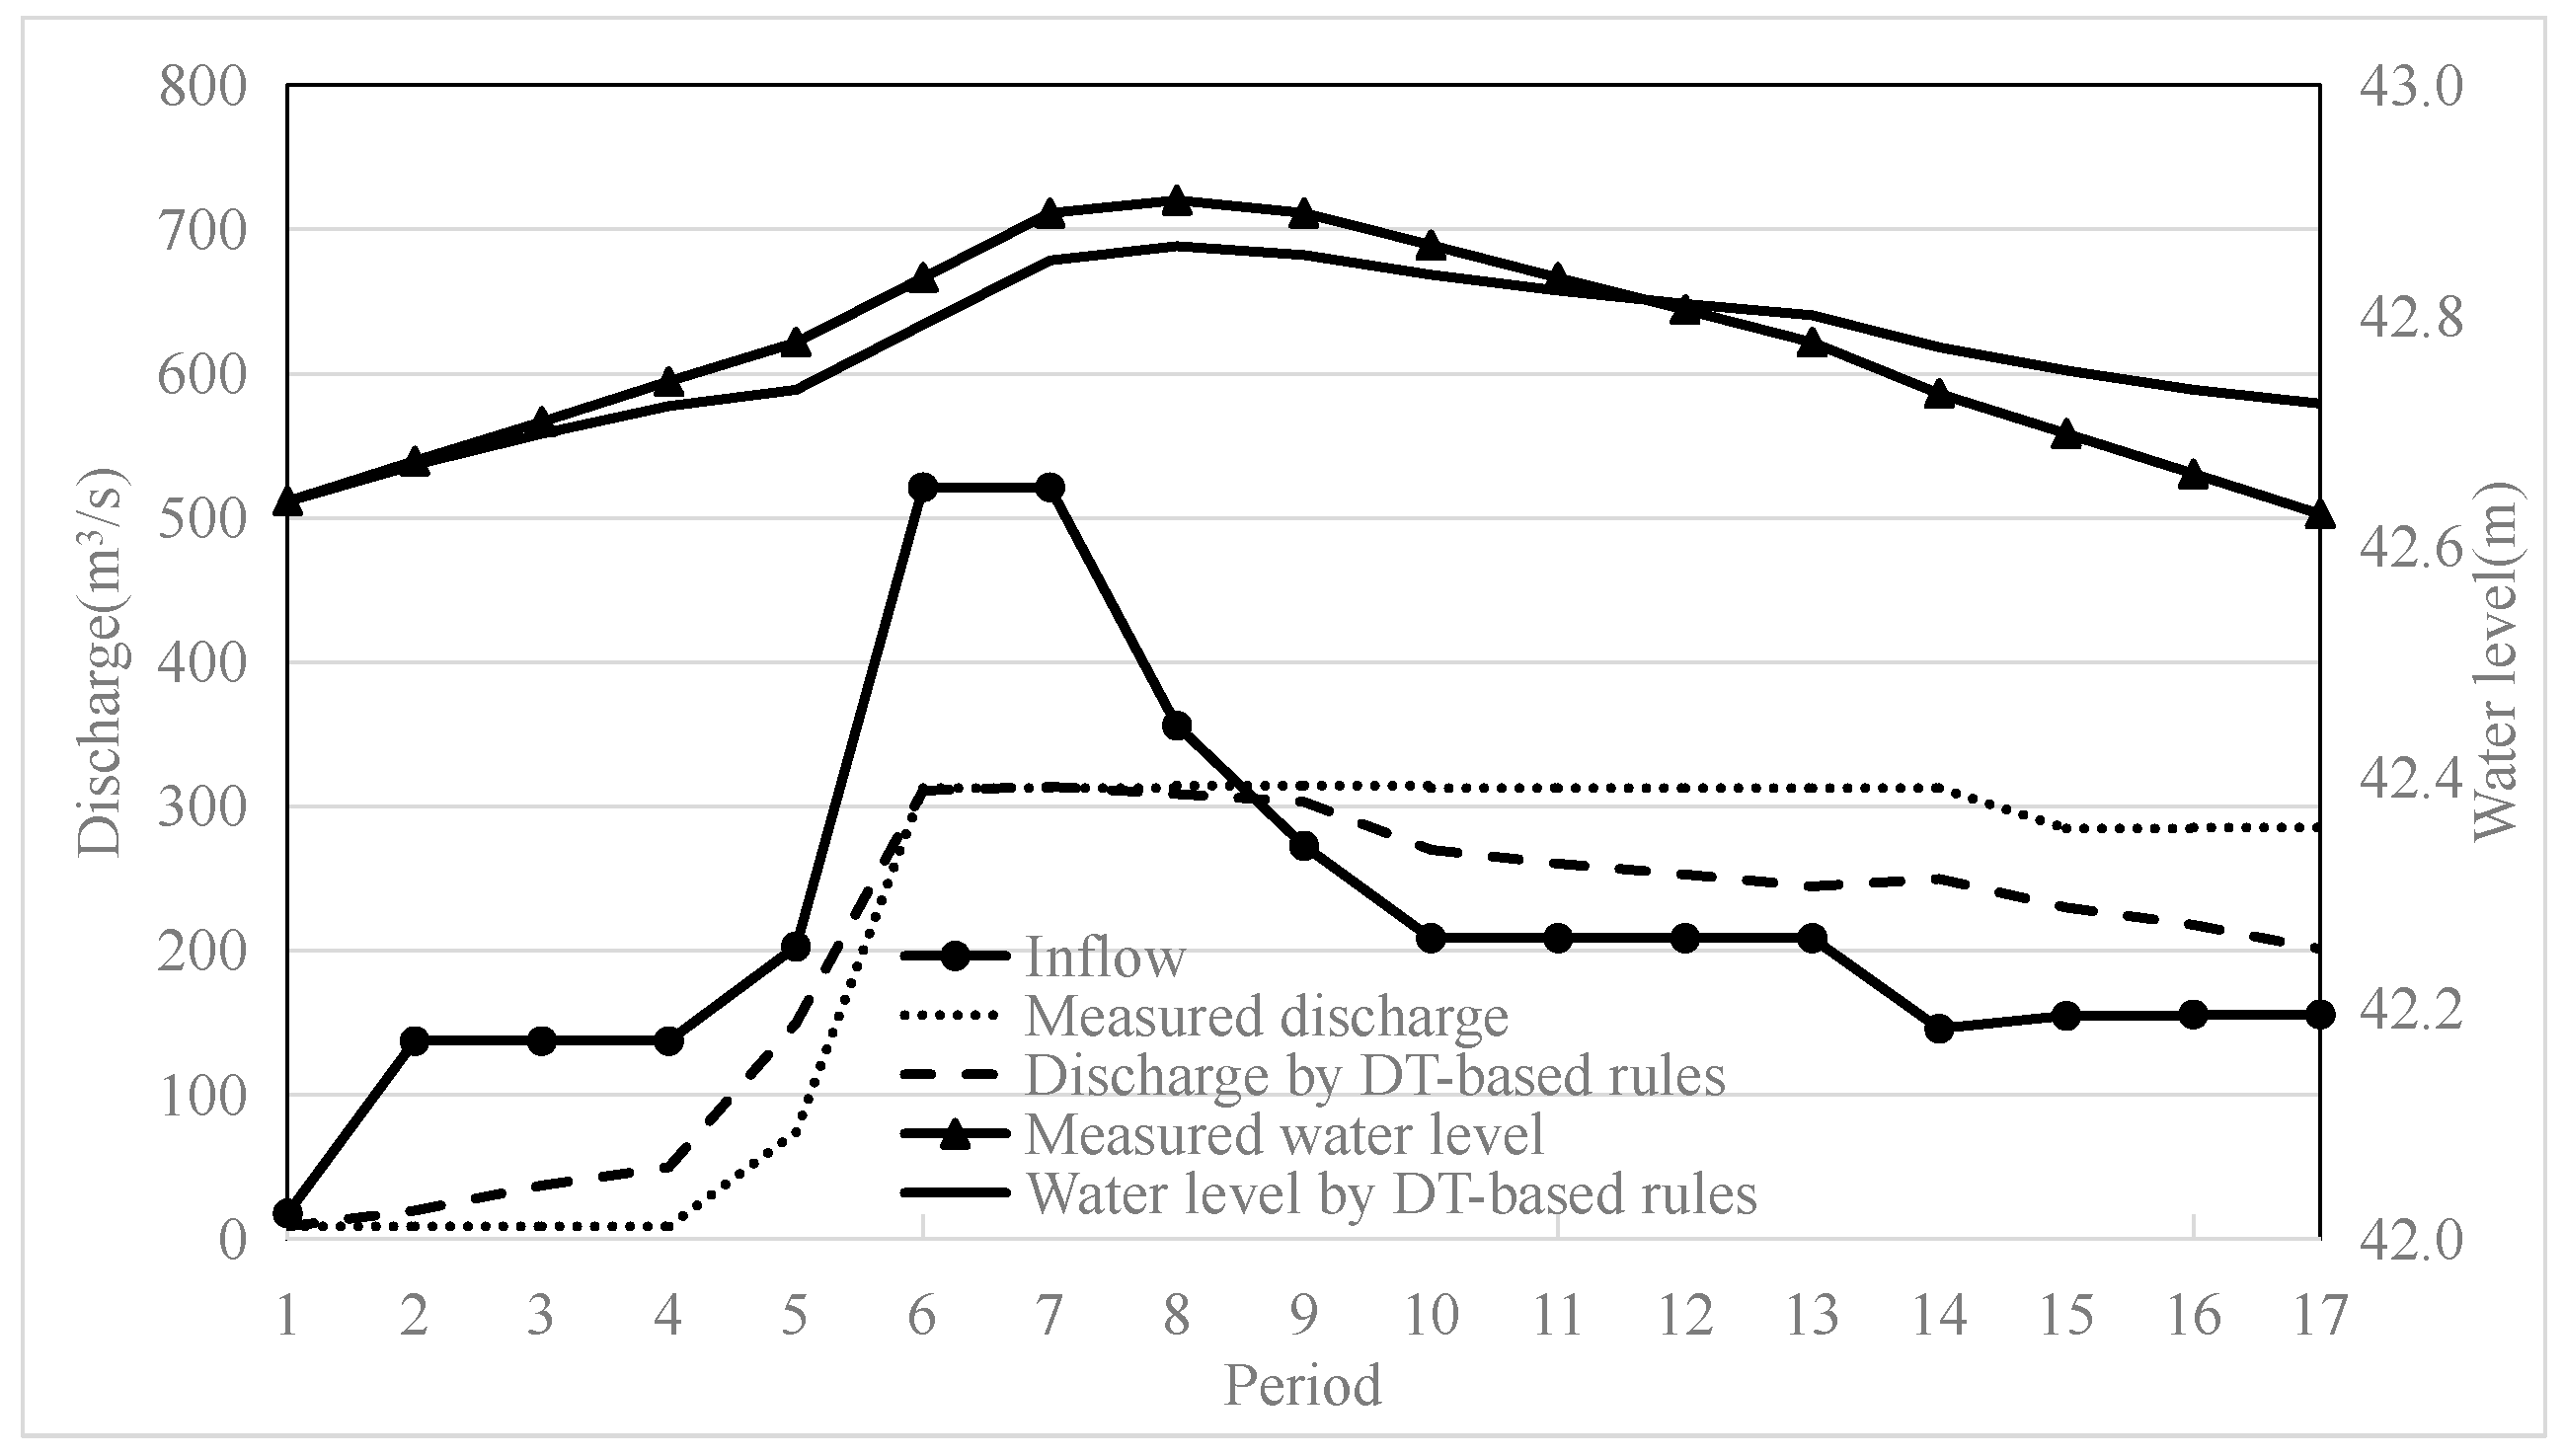
- For the 13 Aug 2021 flood, the maximum discharge of the operating scheme formulated using the conventional operation rules was the largest, followed by the measured maximum discharge, while the maximum discharge of the operating scheme formulated using the DT-based rules was the smallest; the relative error between ① and ② was small (4.34%), whereas the relative error between ① and ③ was large, reaching 72.41%. The maximum water level of the operating scheme formulated using the DT-based rules was the largest, followed by the measured maximum water level, while that of the operating scheme formulated using the conventional operation rules was the smallest; the relative errors between ① and ② and between ① and ③ were both small (0.02% and 0.56%, respectively). It can be observed that the operating scheme formulated using the conventional operation rules was the best in terms of reservoir safety because its maximum water level was the smallest. However, this condition was the most unsafe downstream because the corresponding maximum discharge was the largest. The operating scheme formulated using the DT-based rules was the best in terms of downstream safety because its maximum discharge was the smallest. However, this condition exhibited the highest maximum water level, indicating that it was the worst operating scheme in terms of reservoir safety. The difference between the maximum water level provided by the operating scheme formulated using the DT-based rules and the measured maximum water level is very small, that is 0.01 m, and the maximum discharge of 580 m3/s is below the controlled discharge of 1000 m3/s, indicating that it is a feasible scheme.
- (4)
- For the 26 Aug 2021 flood, the maximum discharge of the operating scheme formulated using the conventional operation rules was the largest, followed by the measured maximum discharge, while the maximum discharge of the operating scheme formulated using the DT-based rules was the smallest; the relative error between ① and ② was small (0.32%), whereas the relative error between ① and ③ was large, reaching 218.46%. The measured maximum water level was the largest, followed by the maximum water level of the operating scheme formulated using the DT-based rules, while that of the operating scheme formulated using the conventional operation rules was the smallest; the relative errors between ① and ② and between ① and ③ were both small (0.09% and 0.14%, respectively). It can be observed that the operating scheme formulated using the conventional operation rules was the best in terms of reservoir safety because its maximum water level was the smallest. However, this condition was the most unsafe downstream because the corresponding maximum discharge was the largest. The operating scheme formulated using the DT-based rules was the best in terms of downstream safety because its maximum discharge was the smallest. The maximum water level provided by the operating scheme formulated using the DT-based rules were between those of the measured values and the operating scheme formulated using the conventional operation rules. At the same time, the maximum discharge of 314 m3/s provided by the operating scheme formulated using the DT-based rules remained below the controlled discharge of 1000 m3/s, indicating that it is a feasible scheme.
4. Conclusions
- (1)
- The C4.5 algorithm was used to construct DT-based flood control operation rules for a reservoir. This algorithm has the advantages of easy implementation and strong operability and fully considers the influence of the climate and underlying surface conditions of the watershed as well as the operating experience of management in the process of constructing an operating scheme.
- (2)
- As can be seen from the results of the four verification samples, the maximum discharges of the operating schemes formulated using the DT-based rules with the flood number 22 July 2020, 13 Aug 2021, and 26 Aug 2021 are the smallest; the maximum discharge with the flood number 12 Aug 2019 is smaller than that of the operating scheme formulated using the conventional operation rules and only 5% larger than the measured maximum discharge. The maximum water levels of the operating schemes formulated using the DT-based rules with the flood numbers 12 Aug 2019 and 26 Aug 2021 are between those of the measured values and the operating scheme formulated using the conventional operation rules; the maximum water level with the flood number 22 July 2020 is the smallest; the maximum water level with the flood number 13 Aug 2021 is only 0.02% larger than the measured maximum value. To sum up, the operating scheme formulated using the DT-based rules was feasible and, in some cases, superior to the actual operating scheme and an operating scheme based on conventional operation rules. Among optimization algorithms, DT-based rules have the advantages of strong and convenient adaptability, allowing decision makers to guide real-time reservoir operation. Therefore, the DT-based method for constructing reservoir flood control operation rules proposed in this paper can provide practical guidance for the real-time operation of reservoirs.
- (3)
- In this paper, only one reservoir is taken as an example, and future research should be popularized and applied in more reservoirs and reservoir group systems to verify the feasibility and effectiveness of this method.
Author Contributions
Funding
Institutional Review Board Statement
Informed Consent Statement
Data Availability Statement
Acknowledgments
Conflicts of Interest
References
- Typical Cases Dataset of Global Major Flood Disasters in 1989–2018. Available online: https://blog.csdn.net/Galaxyhx/article/details/115579737 (accessed on 15 November 2021).
- Jiang, Z.; Jiang, W.; Wu, J.; Zhou, H. Typical Case Dataset of Major Global Flood Disasters (2018.01–2018.12); National Tibetan Plateau Data Center: Beijing, China, 2018; Available online: https://doi.org/10.11888/Disas.tpdc.270209 (accessed on 15 November 2021).
- Commission Internationale des Grands Barrages. Number of Dams by Country Members; CIGB: Paris, France, 2021; Available online: https://www.icold-cigb.org/article/GB/world_register/general_synthesis/number-of-dams-by-country-members (accessed on 14 December 2021).
- World Commission on Large Dams. Dams and Development; World Commission on Large Dams: London, UK, November 2000. [Google Scholar]
- Iosvany, R.V.; Jose, B.M.R.; Jose, L.M.; Jose-Luis, M.; Julio, C.P.T. Multiobjective optimization modeling approach for multipurpose single reservoir operation. Water 2018, 10, 427. [Google Scholar]
- Jiang, W.Q. Graphic method for flood control operation of small and medium reservoirs. Water Conserv. Manag. Technol. 1996, 1, 53–55. [Google Scholar]
- Wang, Y.; Guo, S.L.; Yang, G.; Hong, X.J.; Ting, H.U. Optimal early refill rules for Danjiangkou Reservoir. Water Sci. Eng. 2014, 7, 403–419. [Google Scholar]
- Ma, L.J.; Wang, H.; Lu, B.H.; Qi, C.J. Application of strongly constrained space particle swarm optimization to optimal operation of a reservoir system. Sustainability 2018, 10, 4445. [Google Scholar] [CrossRef] [Green Version]
- Windsor, J.S. Optimization model for the operation of flood control systems. Water Resour. Res. 1973, 9, 1219–1226. [Google Scholar] [CrossRef]
- Wang, J.M. Brief introduction of optimal food control operation model of Danjiangkou reservoir. Water Resour. Hydropower Eng. 1985, 8, 17–23. [Google Scholar]
- Needham, J.T.; Watkins, D.W.; Lund, J.R.; Nanda, S.K. Linear programming for flood control in the Iowa and Des Moines Rivers. J. Water Resour. Plan. Manag. 2000, 126, 118–127. [Google Scholar] [CrossRef] [Green Version]
- Young, J.K. Finding reservoir operating rules. J. Hydraul. Div. Am. Soc. Civ. Eng. 1993, 6, 297–321. [Google Scholar] [CrossRef]
- Becker, L.; Yeh, W.W.G. Optimization of real time operation of a multiple-reservoir system. Water Resour. Res. 1974, 10, 1107–1112. [Google Scholar] [CrossRef]
- Sckultz, G.A.; Plate, E.J. Developing operating rules for flood protection reservoirs. J. Hydrol. 1976, 28, 245–264. [Google Scholar] [CrossRef]
- Howson, H.R.; Sancho, N.G.F. A new algorithm for the solution of multi-state dynamic programming problems. Math. Program. 1975, 8, 114–116. [Google Scholar] [CrossRef]
- Fu, X.; Ji, C.M. Optimal operation model of flood control system and its application. J. Hydraul. Eng. 1998, 5, 49–53. [Google Scholar]
- Hu, Z.P.; Feng, S.Y. Dynamic programming model and forward rolling decision-making method for real-time operation of flood control system in the middle and lower reaches of Hanjiang River. Water Resour. Hydropower Eng. 1988, 1, 2–10. [Google Scholar]
- Ji, C.; Li, C.; Wang, B.; Liu, M.; Wang, L. Multi-stage dynamic programming method for short-term cascade reservoirs optimal operation with flow attenuation. Water Resour. Manag. 2017, 31, 4571–4586. [Google Scholar] [CrossRef]
- Larson, R.E. State Incremental Dynamic Programming; Elsevier: New York, NY, USA, 1968. [Google Scholar]
- Yeh, W.W.G.; Becker, L.; Chu, W.S. Real-time hourly reservoir operation. J. Water Resour. Plan. Manag. Div. Am. Soc. Civ. Eng. 1979, 105, 187–203. [Google Scholar] [CrossRef]
- Cervellera, C.; Chen, V.C.P.; Wen, A. Optimization of a large-scale water reservoir network by stochastic dynamic programming with efficient state space discretization. Eur. J. Oper. Res. 2006, 171, 1139–1151. [Google Scholar] [CrossRef]
- Li, X.; Wei, J.; Li, T.; Wang, G.; William, W.G. A parallel dynamic programming algorithm for multi-reservoir system optimization. Adv. Water Resour. 2014, 67, 1–15. [Google Scholar] [CrossRef]
- Zhu, D.; Mei, Y.; Xu, X.; Chen, J.; Ben, Y. Optimal operation of complex flood control system composed of cascade reservoirs, navigation-power junctions, and flood storage areas. Water 2020, 12, 1883. [Google Scholar] [CrossRef]
- Momtahen, S.; Dariane, A.B. Direct search approaches using genetic algorithms for optimization of water reservoir operating policies. J. Water Resour. Plan. Manag. 2007, 133, 202–209. [Google Scholar] [CrossRef]
- Albo-Salih, H.; Mays, L. Testing of an optimization-simulation model for real-time flood operation of river-reservoir systems. Water 2021, 13, 1207. [Google Scholar] [CrossRef]
- Ahmadi, M.; Bozorg, H.O.; Marino, M.A. Extraction of flexible multi-objective real-time reservoir operation rules. Water Resour. Manag. 2014, 28, 131–147. [Google Scholar] [CrossRef]
- Lin, N.M.; Tian, X.; Rutten, M.; Abraham, E. Multi-objective model predictive control for real-time operation of a multi-reservoir system. Water 2020, 12, 1898. [Google Scholar] [CrossRef]
- Liu, D.; Huang, Q.; Yang, Y.; Liu, D.; Wei, X. Bi-Objective algorithm based on NSGA-II framework to optimize reservoirs operation. J. Hydrol. 2020, 585, 124830. [Google Scholar] [CrossRef]
- Reddy, M.J.; Nagesh Kumar, D. Multi-objective particle swarm optimization for generating optimal trade-offs in reservoir operation. Hydrol. Process. 2010, 21, 2897–2909. [Google Scholar] [CrossRef]
- Xie, W.; Ji, C.; Wu, Y.; Li, X. Particle swarm optimization based on cultural algorithm for flood optimal scheduling of hydropower reservoir. J. Hydraul. Eng. 2010, 41, 452–457. [Google Scholar]
- Kumar, D.N.; Reddy, M.J. Ant colony optimization for multi-purpose reservoir operation. Water Resour. Manag. 2020, 6, 879–898. [Google Scholar] [CrossRef]
- Afshar, A.; Sharifi, F.; Jalali, M.R. Applying the non-dominated archiving multi-colony ant algorithm for multi-objective optimization: Application to multi-purpose reservoir operation. Engng. Optim. 2009, 41, 313–325. [Google Scholar] [CrossRef]
- Chaves, P.; Chang, F.J. Intelligent reservoir operation system based on evolving artificial neural networks. Adv. Water Resour. 2008, 31, 926–936. [Google Scholar] [CrossRef]
- Deka, P.C.; Chandramouli, V. Fuzzy Neural Network Modeling of Reservoir Operation. J. Water Resour. Plan. Manag. 2009, 135, 5–12. [Google Scholar] [CrossRef]
- Khalil, A.; McKee, M.; Kemblowski, M.; Asefa, T. Sparse Bayesian learning machine for real-time management of reservoir releases. Water Resour. Res. 2005, 41, 4844–4847. [Google Scholar] [CrossRef]
- Teegavarapu, R.S.V.; Simonovic, S.P. Optimal operation of reservoir systems using simulated annealing. Water Resour. Manag. 2002, 16, 401–428. [Google Scholar] [CrossRef]
- Luo, J.; Chen, C.; Xie, J. Multi-objective immune algorithm with preference-based selection for reservoir flood control operation. Water Resour. Manag. 2014, 29, 1447–1466. [Google Scholar] [CrossRef]
- Qi, Y.; Bao, L.; Ma, X.; Miao, Q.; Li, X. Self-adaptive multi-objective evolutionary algorithm based on decomposition for large-scale problems: A case study on reservoir flood control operation. Inf. Sci. 2016, 367–368, 529–549. [Google Scholar] [CrossRef]
- Zhang, X.; Luo, J.; Sun, X.; Xie, J. Optimal reservoir flood operation using a decomposition-based multi-objective evolutionary algorithm. Eng. Optim. 2019, 51, 42–62. [Google Scholar] [CrossRef]
- Qin, H.; Zhou, J.; Lu, Y.; Li, Y.; Zhang, Y. Multi-objective cultured differential evolution for generating optimal trade-offs in reservoir flood control operation. Water Resour. Manag. 2010, 24, 2611–2632. [Google Scholar] [CrossRef]
- Liu, Y.; Qin, H.; Mo, L.; Wang, Y.; Chen, D.; Pang, S.; Yin, X. Hierarchical flood operation rules optimization using multi-objective cultured evolutionary algorithm based on decomposition. Water Resour. Manag. 2019, 33, 337–354. [Google Scholar] [CrossRef]
- Afshar, A.; Bozorg-Haddad, O.; Mario, M.A.; Adams, B. Honey-bee mating optimization (HBMO) algorithm for optimal reservoir operation—ScienceDirect. J. Frankl. Inst. 2007, 344, 452–462. [Google Scholar] [CrossRef]
- Wen, X.H.; Zhou, J.Z.; He, Z.Z.; Wang, C. Long-term scheduling of large-scale cascade hydropower stations using improved differential evolution algorithm. Water 2018, 10, 383. [Google Scholar] [CrossRef] [Green Version]
- Hormwichian, R.; Kangrang, A.; Lamom, A. A conditional genetic algorithm model for searching optimal reservoir rule curves. J. Appl. Sci. 2009, 9, 3575–3580. [Google Scholar] [CrossRef] [Green Version]
- Sreerama, K.M. Automatic construction of decision trees from data: A multidisciplinary survey. Data Min. Knowl. Discov. 1998, 2, 245–389. [Google Scholar]
- Noymanee, J.; Theeramunkong, T. Flood forecasting with machine learning technique on hydrological modeling. Procedia Comput. Sci. 2019, 156, 377–386. [Google Scholar] [CrossRef]
- Pham, B.T.; Jaafari, A.; Phong, T.V.; Yen, H.P.H.; Tuyen, T.T.; Luong, V.V.; Nguyen, H.D.; Le, H.V.; Foong, L.K. Improved flood susceptibility mapping using a best first decision tree integrated with ensemble learning techniques. Geosci. Front. 2020, 12, 101105. [Google Scholar] [CrossRef]
- Merz, B.; Kreibich, H.; Lall, U. Multi-variate flood damage assessment: A tree-based data-mining approach. Nat. Hazards Earth Syst. Sci. 2013, 13, 53–64. [Google Scholar] [CrossRef]
- Nafari, R.H.; Ngo, T.; Mendis, P. An assessment of the effectiveness of tree-based models for multi-variate flood damage assessment in Australia. Water 2016, 8, 282. [Google Scholar] [CrossRef] [Green Version]
- Kind, J.M.; Baayen, J.H.; Botzen, W.W.J. Benefits and limitations of real options analysis for the practice of river flood risk management. Water Resour. Res. 2018, 54, 3018–3036. [Google Scholar] [CrossRef]
- Collet, L.; Beevers, L.; Stewart, M.D. Decision-making and flood risk uncertainty: Statistical data set analysis for flood risk assessment. Water Resour. Res. 2018, 54, 7291–7308. [Google Scholar] [CrossRef] [Green Version]
- Chen, J.L.; Huang, G.R.; Chen, W.J. Towards better flood risk management: Assessing flood risk and investigating the potential mechanism based on machine learning models. J. Environ. Manag. 2021, 293, 112810. [Google Scholar] [CrossRef]
- Gao, Y.Y.; Zhang, X.M.; Zhang, X.Y.; Li, D.; Yang, M.; Tian, J. Application of NSGA-II and improved risk decision method for integrated water resources management of Malian River Basin. Water 2019, 11, 1650. [Google Scholar] [CrossRef] [Green Version]
- Sikorska, A.E.; Viviroli, D.; Seibert, J. Flood-type classification in mountainous catchments using crisp and fuzzy decision trees. Water Resour. Res. 2015, 51, 7959–7976. [Google Scholar] [CrossRef]
- Mehr, A.D. Drought classification using gradient boosting decision tree. Acta Geophys. 2021, 69, 909–918. [Google Scholar] [CrossRef]
- Lee, S.; Ji, H.W. Proactive management of water quality in aquifer storage transfer and recovery. Proc. Eng. Technol. Innov. 2016, 4, 25–27. [Google Scholar]
- Oz, N.; Topal, B.; Uzun, H.I. Prediction of water quality in Riva River Watershed. Ecol. Chem. Eng. 2019, 26, 727–742. [Google Scholar] [CrossRef] [Green Version]
- Xi, S.F.; Wang, B.D.; Liang, G.H.; Li, X.S.; Lou, L.L. Inter-basin water transfer-supply model and risk analysis with consideration of rainfall forecast information. Sci. China Technol. Sci. 2010, 12, 3316–3323. [Google Scholar] [CrossRef]
- Zhang, Z.B.; Zhang, S.H.; Geng, S.M.; Jiang, Y.Z.; Li, H.; Zhang, D.W. Application of decision trees to the determination of the year-end level of a carryover storage reservoir based on the iterative dichotomizer. Int. J. Elec. Power 2015, 64, 375–383. [Google Scholar] [CrossRef]
- Vaheddoost, B.; Aksoy, H.; Abghari, H. Prediction of water level using monthly lagged data in Lake Urmia, Iran. Water Resour. Manag. 2016, 30, 4951–4967. [Google Scholar] [CrossRef]
- Parvez, I.; Shen, J.S.; Hassan, I. Generation of hydro energy by using data mining algorithm for cascaded hydropower plant. Energies 2021, 14, 298. [Google Scholar] [CrossRef]
- Quinlan, J.R. Induction of decision trees. Mach. Learn. 1989, 1, 81–106. [Google Scholar] [CrossRef] [Green Version]
- Quinlan, J.R. C4.5: Programs for Machine Learning; Morgan Kaufmann Publishers: San Mateo, CA, USA, 1993. [Google Scholar]
- Chang, H.; Hu, X.L.; Zhang, Y.Y. Strategy of selecting original configuration for satellite constellation using CART algorithm. J. Huazhong Univ. Sci. Technol. 2011, 39, 1–5. [Google Scholar]
- Benkercha, R.; Moulahoum, S. Fault detection and diagnosis based on C4.5 decision tree algorithm for grid connected PV system. Sol. Energy 2018, 173, 610–634. [Google Scholar] [CrossRef]


| Items | Unit | Reservoir |
|---|---|---|
| Catchment area | km2 | 548 |
| Total storage | 108 m3 | 3.1805 |
| Active storage | 108 m3 | 1.8232 |
| Design standard | % | 1 |
| Check standard | % | 0.02 |
| Checked flood level | m | 46.51 |
| Designed flood level | m | 44.02 |
| Normal water level | m | 42.5 |
| Flood limited water level | m | 42 |
| Flood Occurrence Time | Classification/mm | |||
|---|---|---|---|---|
| Grade 1 | Grade 2 | Grade 3 | Grade 4 | |
| June and September | [0,170) | [170,275) | [275,340) | ≥340 |
| July to August | [0,153) | [153,248) | [248,306) | ≥306 |
| October to May of the next year | [0,191) | [191,310) | [310,382) | ≥382 |
| Grade | Flood Occurrence Time | Initial Water Level/m | Cumulative Net Rainfall/mm | Discharge/m3/s |
|---|---|---|---|---|
| Grade 1 | June and September | ≤Zlimit | As show in Table 2 | ≤100 |
| Grade 2 | July to August | (Zlimit,42.91] | (100,1000] | |
| Grade 3 | October to May of the next year | >42.91 | (1000,2000] | |
| Grade 4 | (2000,2500] | |||
| Grade 5 | >2500 |
| Items | Flood Number | ① DT-Based Rules | ② Measured Data | ③ Conventional Operation Rules | Relative Error between ① and ② (%) | Relative Error between ① and ③ (%) |
|---|---|---|---|---|---|---|
| Maximum discharge (m3/s) | 12 Aug 2019 | 1200 | 1140 | 1900 | 5.0 | 58.33 |
| 22 July 2020 | 421 | 523 | 1000 | 24.23 | 137.53 | |
| 13 Aug 2021 | 580 | 605 | 1000 | 4.34 | 72.41 | |
| 26 Aug 2021 | 314 | 315 | 1000 | 0.32 | 218.46 | |
| Maximum water level (m) | 12 Aug 2019 | 43.69 | 43.82 | 43.48 | 0.3 | 0.48 |
| 22 July 2020 | 42.19 | 42.34 | 42.22 | 0.36 | 0.07 | |
| 13 Aug 2021 | 42.75 | 42.74 | 42.51 | 0.02 | 0.56 | |
| 26 Aug 2021 | 42.86 | 42.90 | 42.8 | 0.09 | 0.14 |
Publisher’s Note: MDPI stays neutral with regard to jurisdictional claims in published maps and institutional affiliations. |
© 2021 by the authors. Licensee MDPI, Basel, Switzerland. This article is an open access article distributed under the terms and conditions of the Creative Commons Attribution (CC BY) license (https://creativecommons.org/licenses/by/4.0/).
Share and Cite
Diao, Y.; Wang, C.; Wang, H.; Liu, Y. Construction and Application of Reservoir Flood Control Operation Rules Using the Decision Tree Algorithm. Water 2021, 13, 3654. https://doi.org/10.3390/w13243654
Diao Y, Wang C, Wang H, Liu Y. Construction and Application of Reservoir Flood Control Operation Rules Using the Decision Tree Algorithm. Water. 2021; 13(24):3654. https://doi.org/10.3390/w13243654
Chicago/Turabian StyleDiao, Yanfang, Chengmin Wang, Hao Wang, and Yanli Liu. 2021. "Construction and Application of Reservoir Flood Control Operation Rules Using the Decision Tree Algorithm" Water 13, no. 24: 3654. https://doi.org/10.3390/w13243654
APA StyleDiao, Y., Wang, C., Wang, H., & Liu, Y. (2021). Construction and Application of Reservoir Flood Control Operation Rules Using the Decision Tree Algorithm. Water, 13(24), 3654. https://doi.org/10.3390/w13243654