
Simulation of Daily Snow Depth Data in China Based on the NEX-GDDP


Abstract
1. Introduction
2. Materials and Methods
2.1. Data
2.2. Model Building and Validation Methods
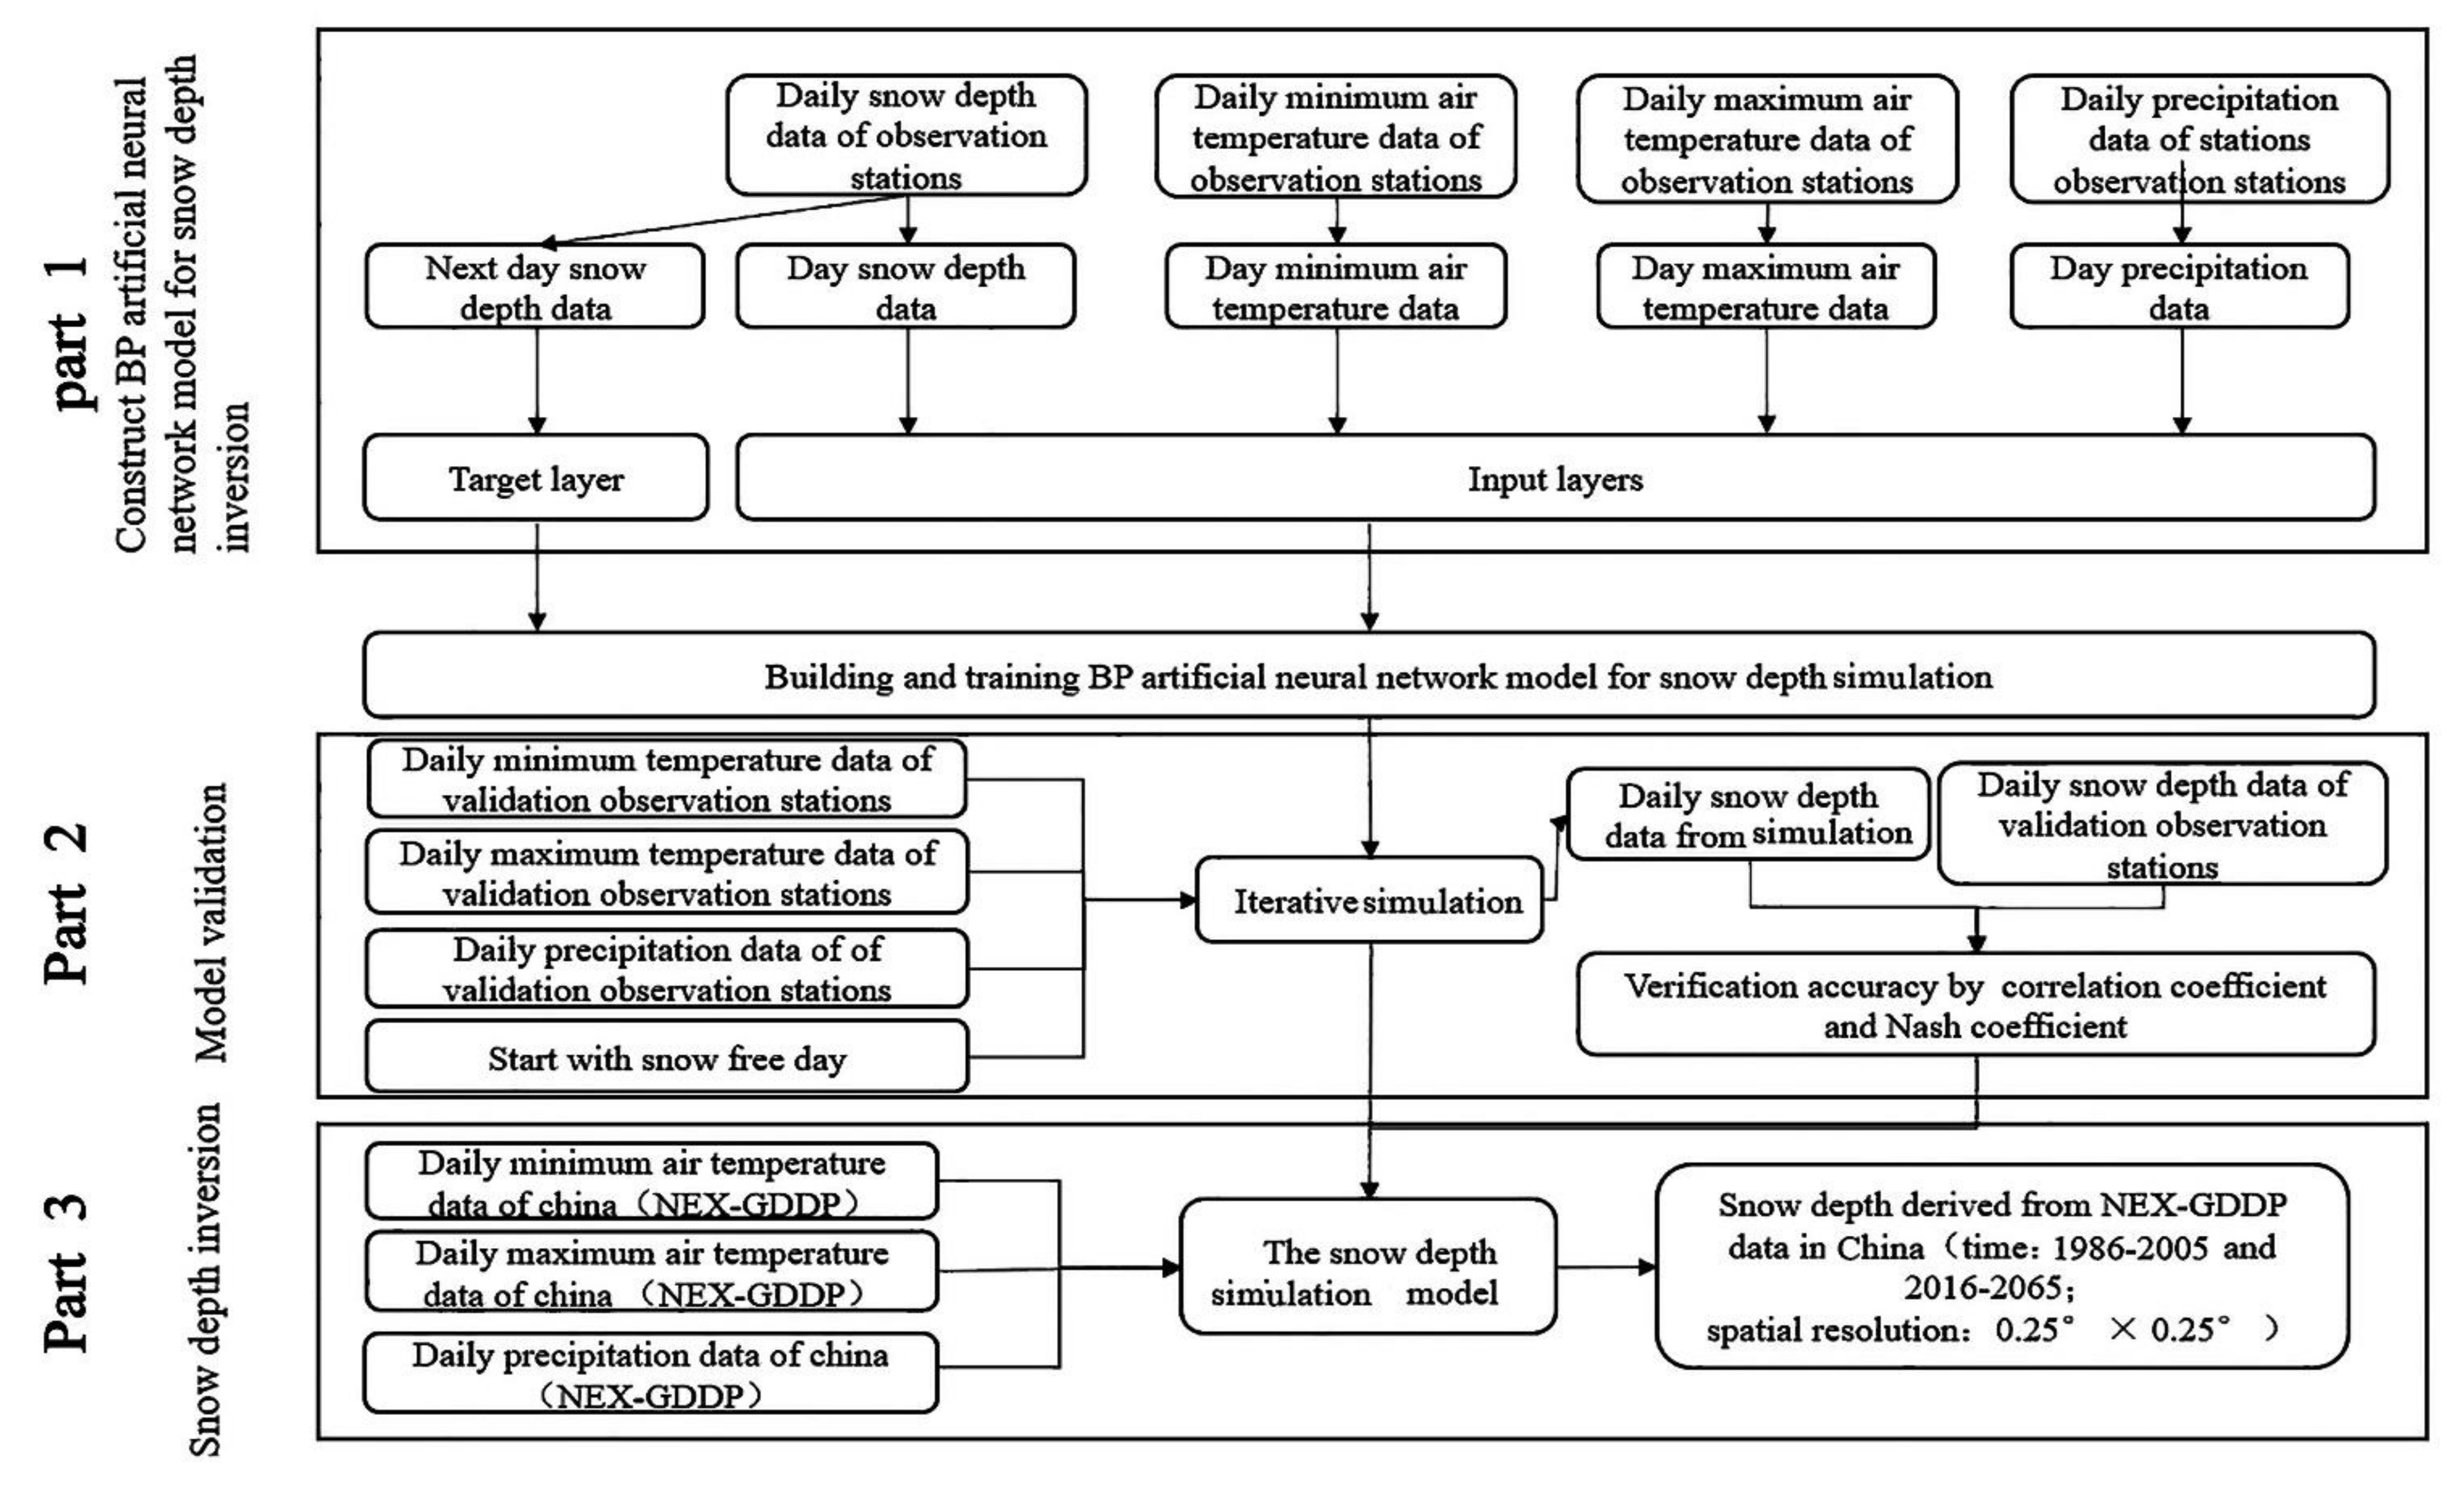
2.2.1. Construction of Snow Depth Simulation Model
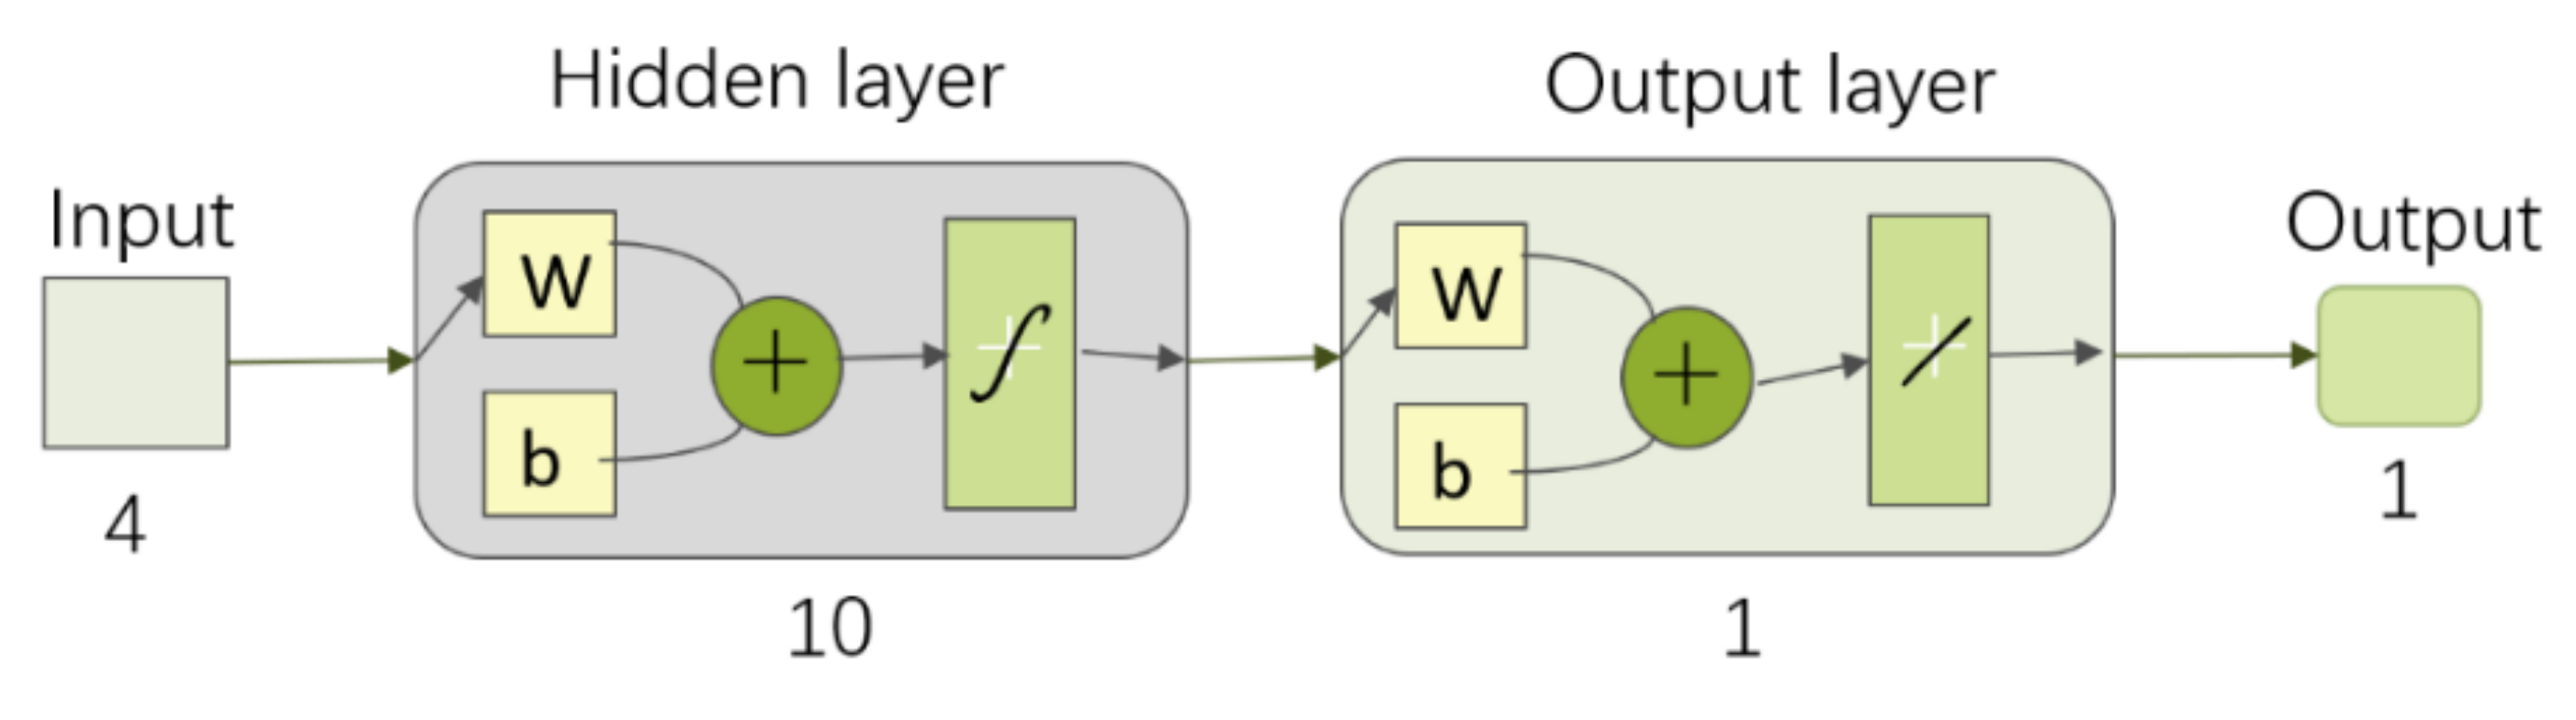
- Selection of input and output layer variables. The input layer included data of daily maximum and minimum temperatures, daily precipitation, and daily snow depth from the National Climate Reference Stations to predict the next day snow depth data at the National Climate Reference Station (Figure 3, Part 1).
- Determining the number of hidden layer nodes for network training (Equation (1)):where p is the number of hidden nodes, n is the number of input layer nodes (n = 4 here), m is the number of output layer nodes (m = 1 here), and a is a constant in the range from 1 to 10. Through trial and error, it was revealed that the training effect was the best when the p = 10.
- Setting the network training parameter is critical to model accuracy. To this end, trained sample data and test samples were compared numerous times, for determining the number of parameters in the BPNNSIM (Table 2).
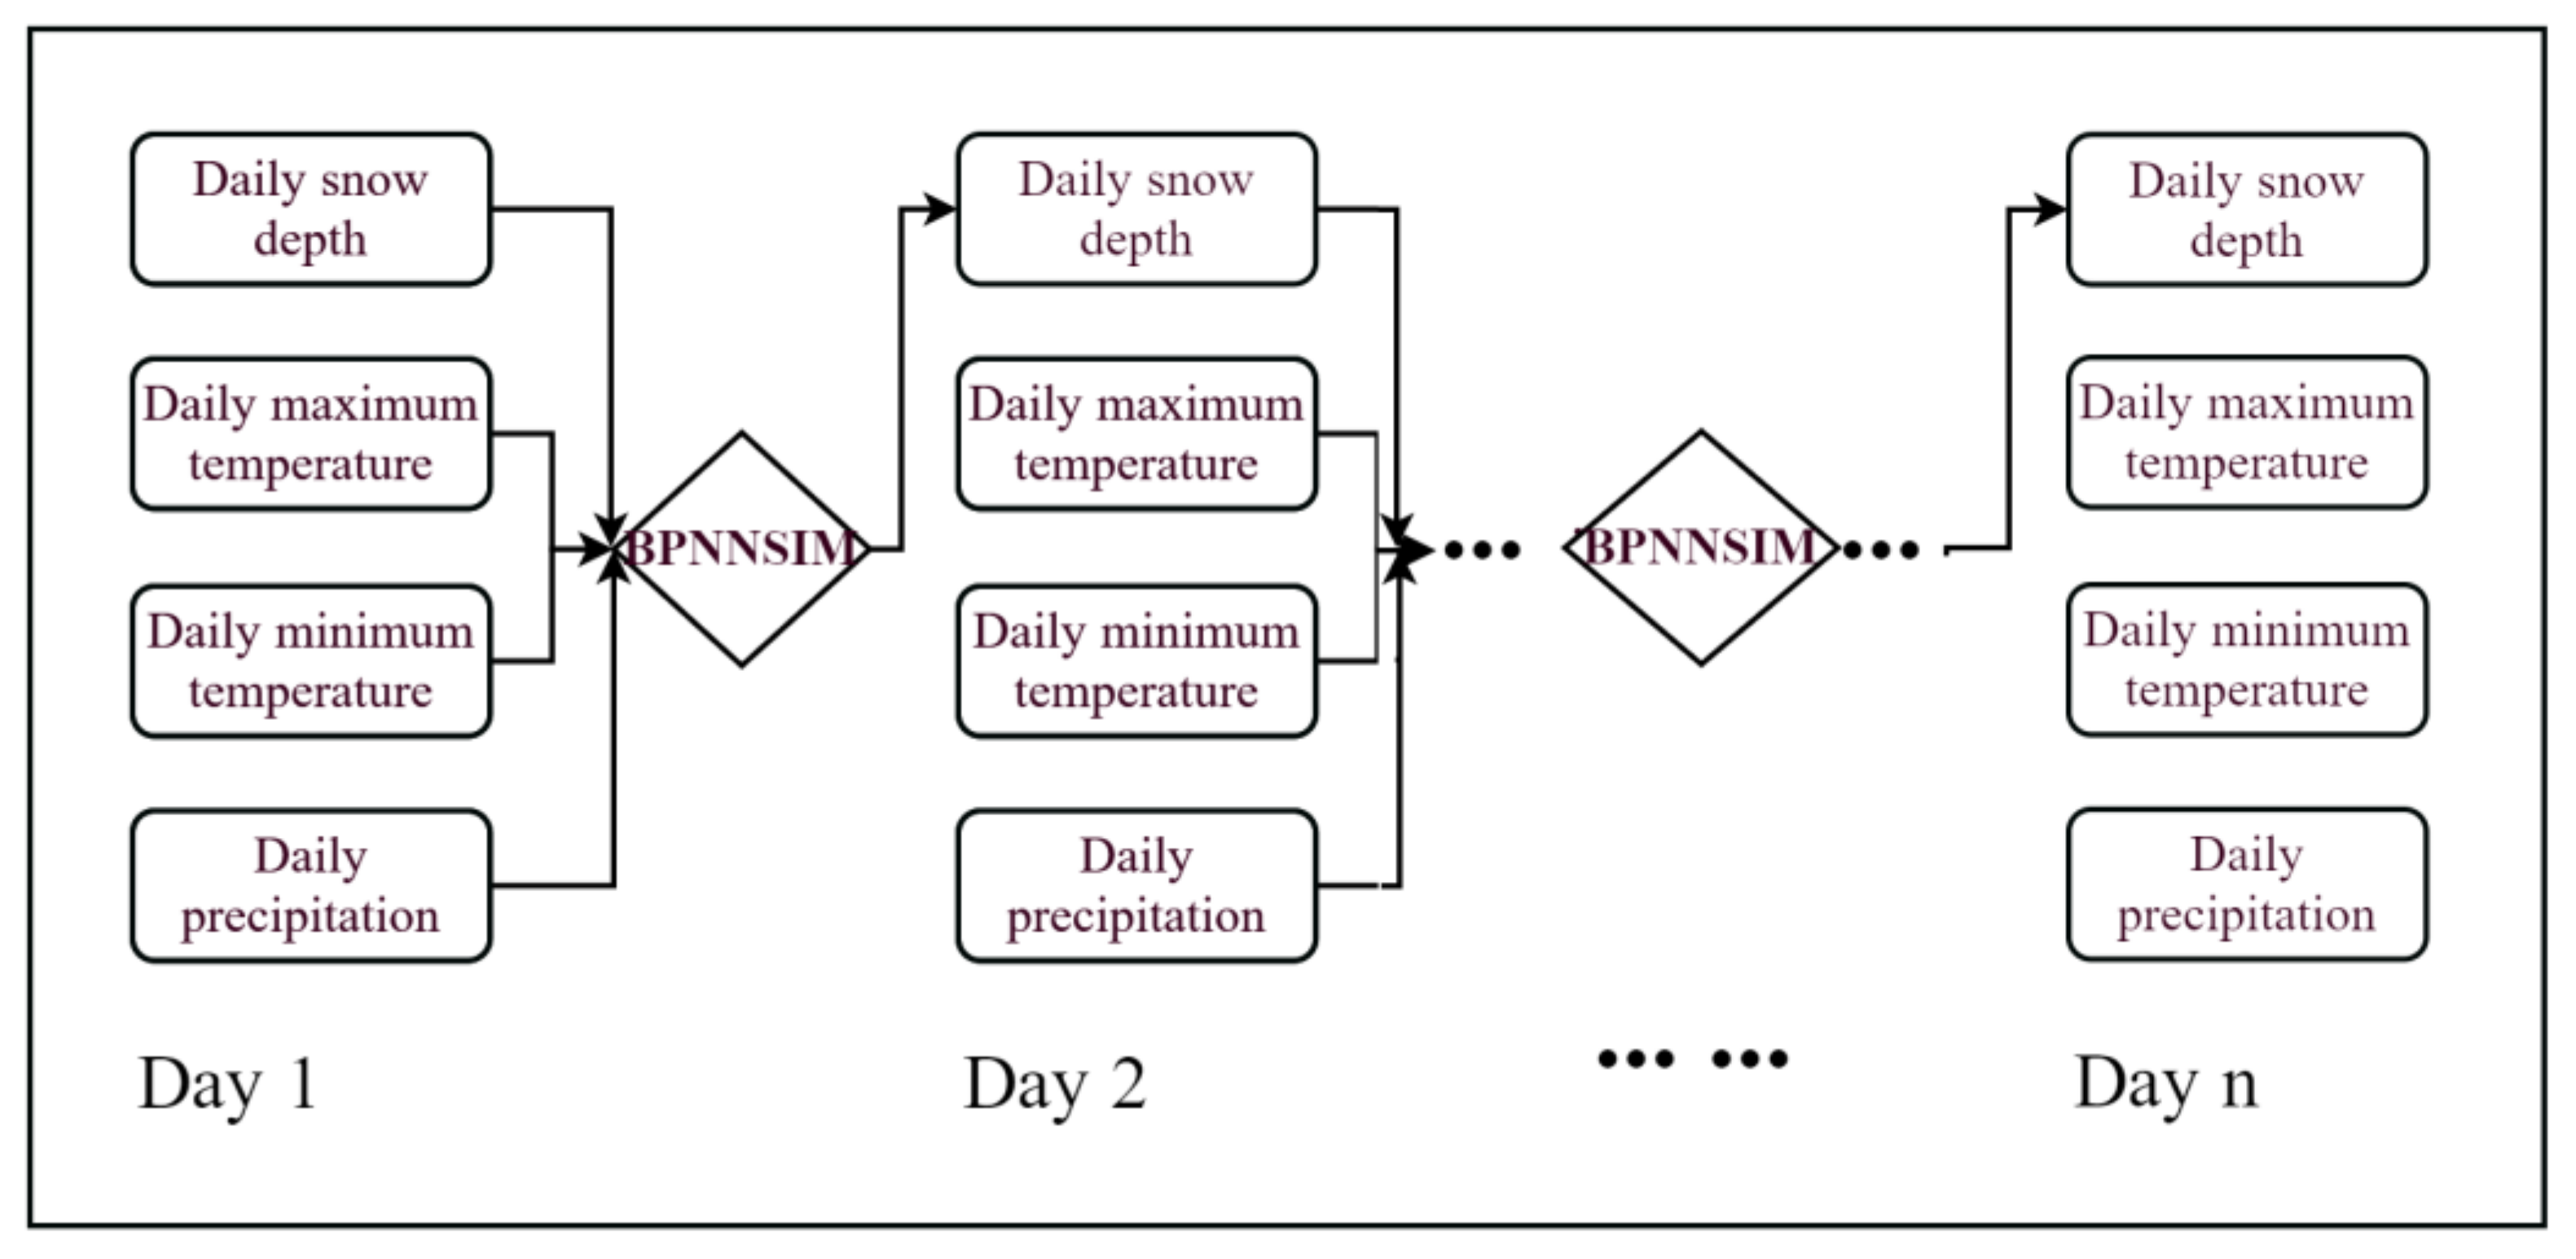
2.2.2. Verification of Model Iteration Simulation Accuracy
2.2.3. A Comparative Method for Remote Sensing and NEX-GDDP Snow Depth
3. Results
3.1. Model Building
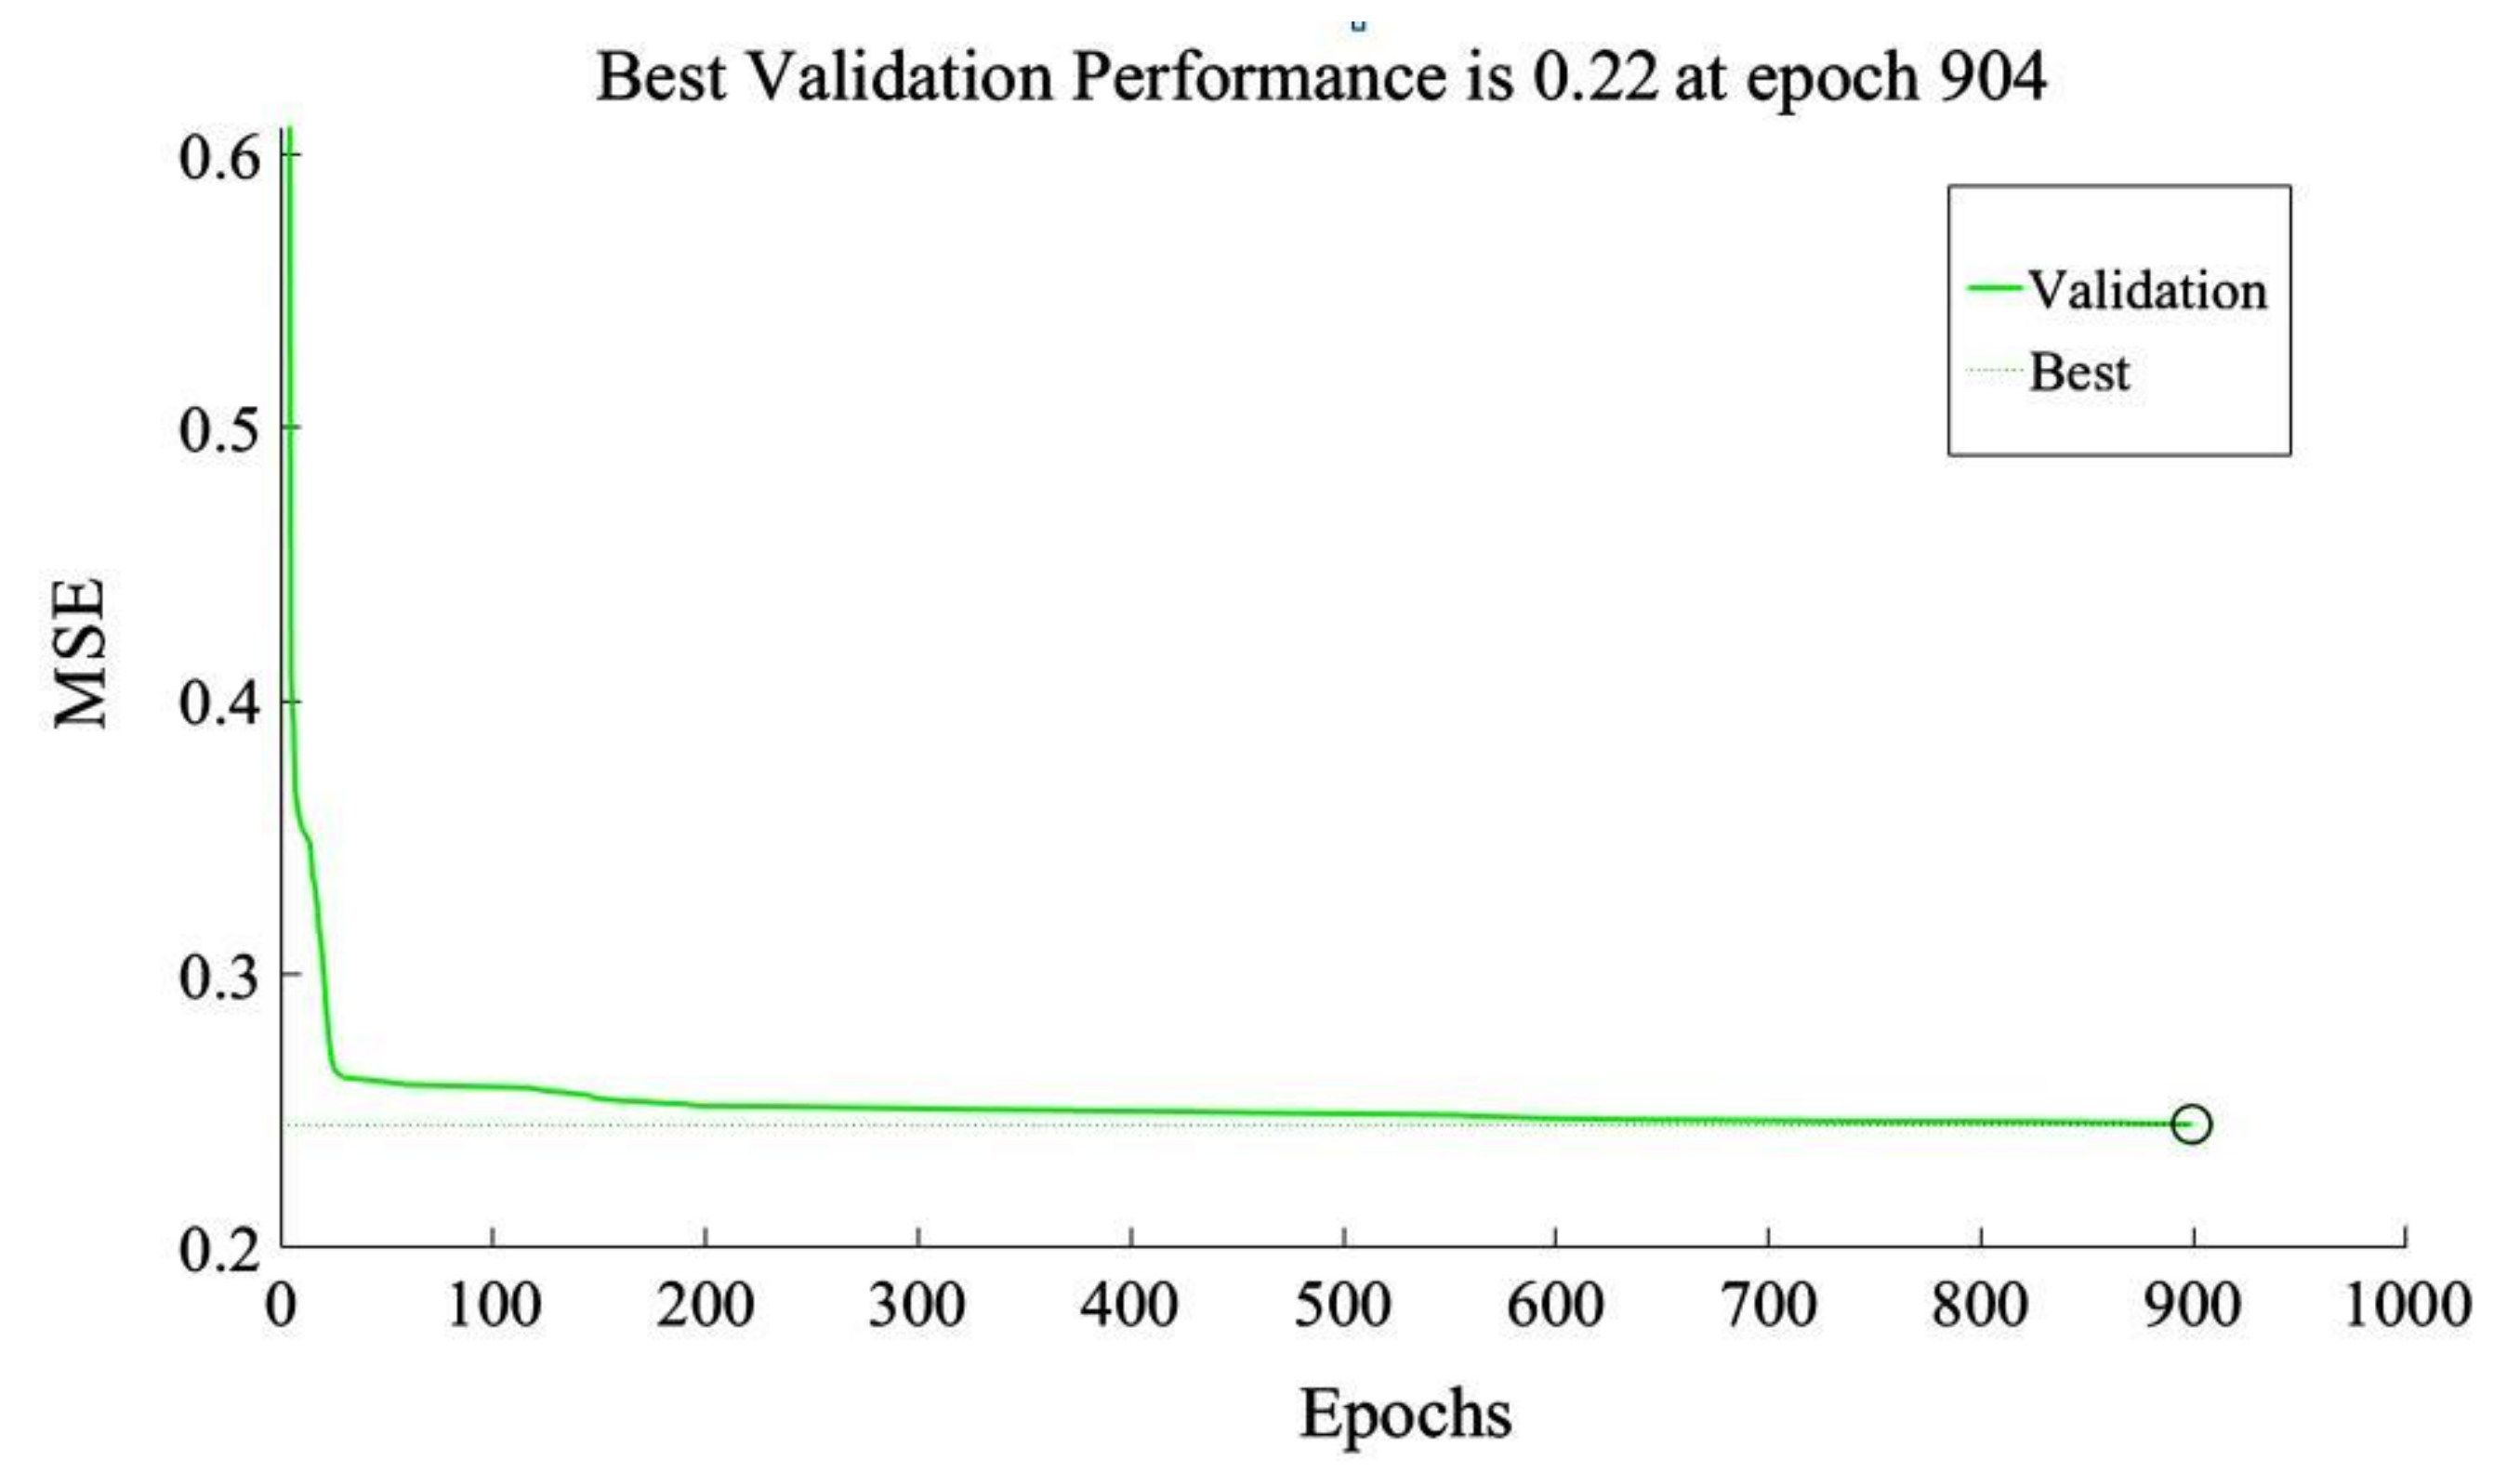
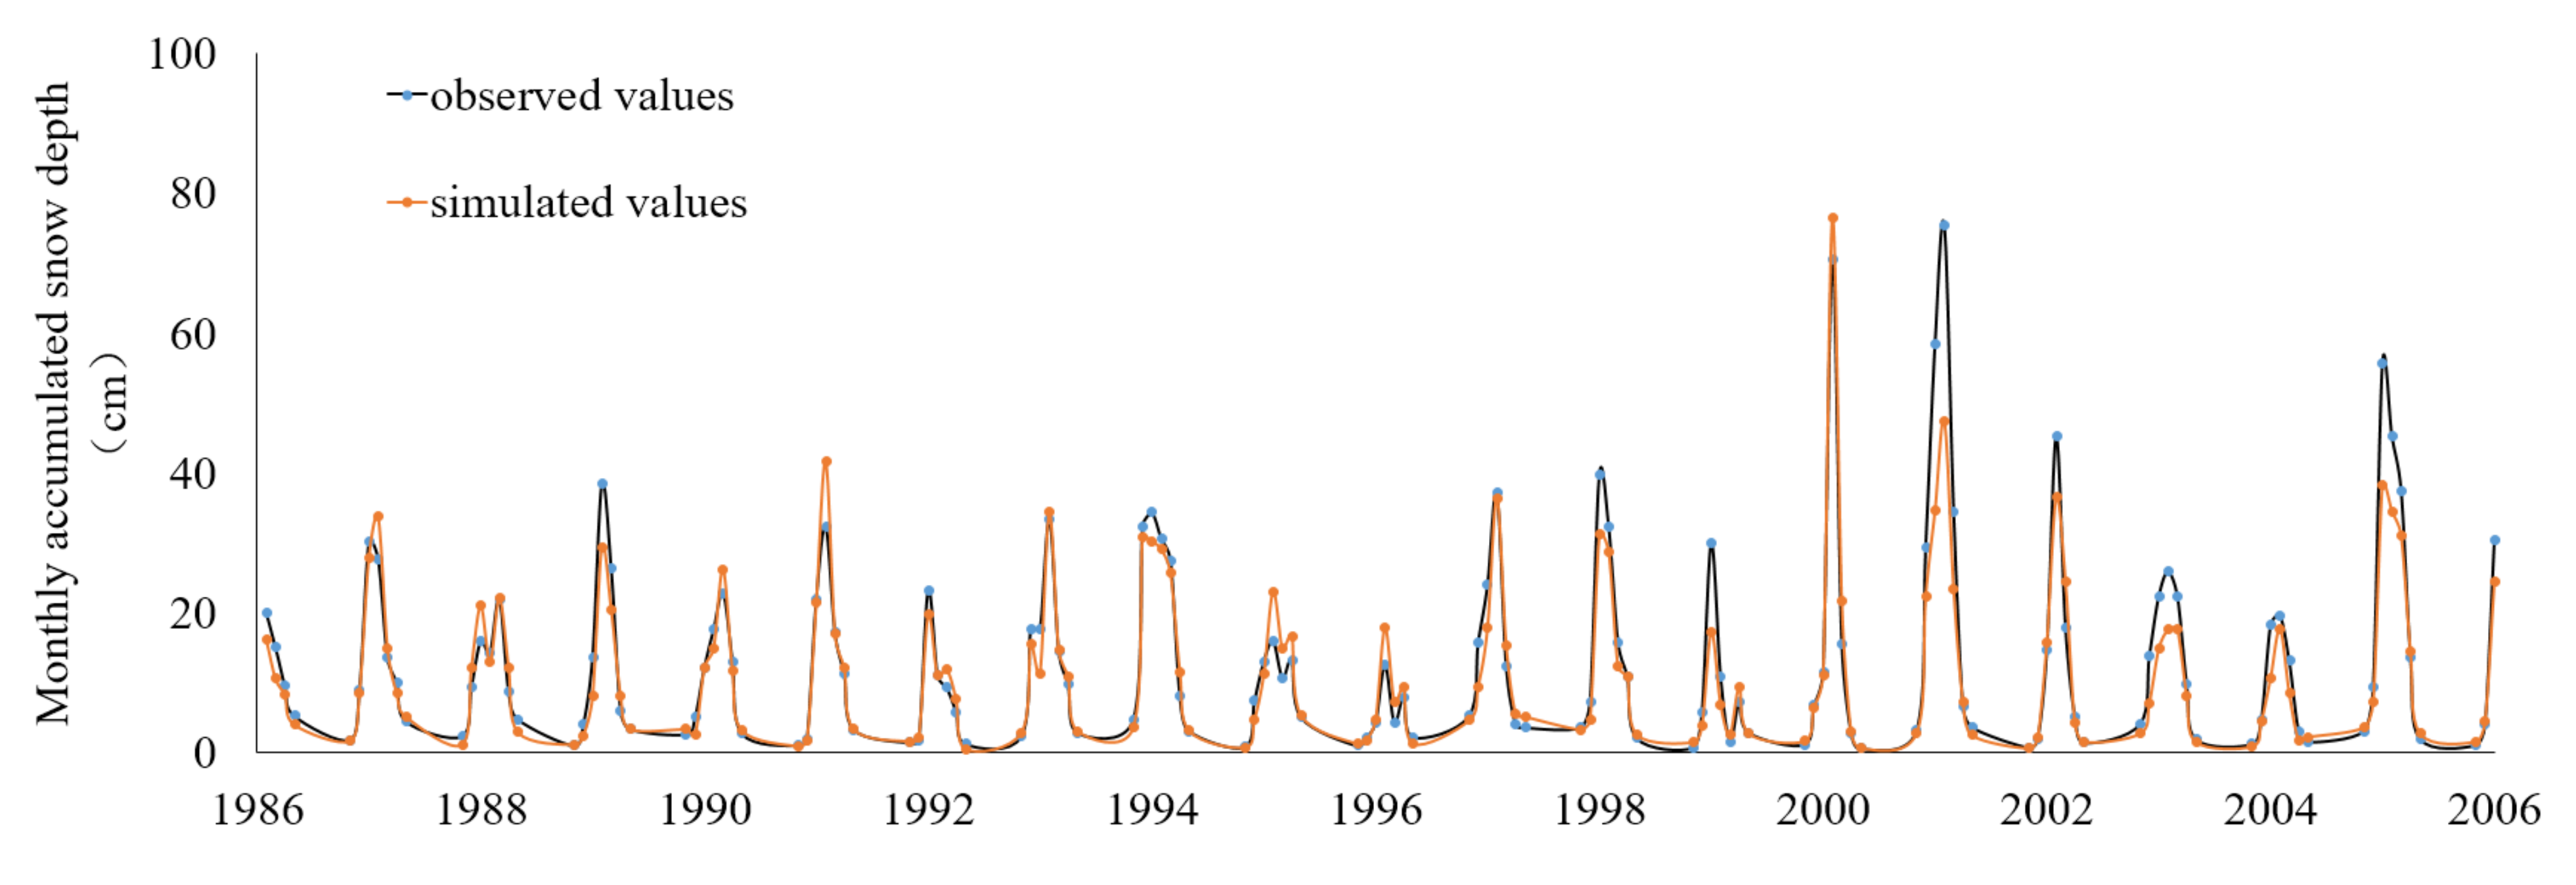
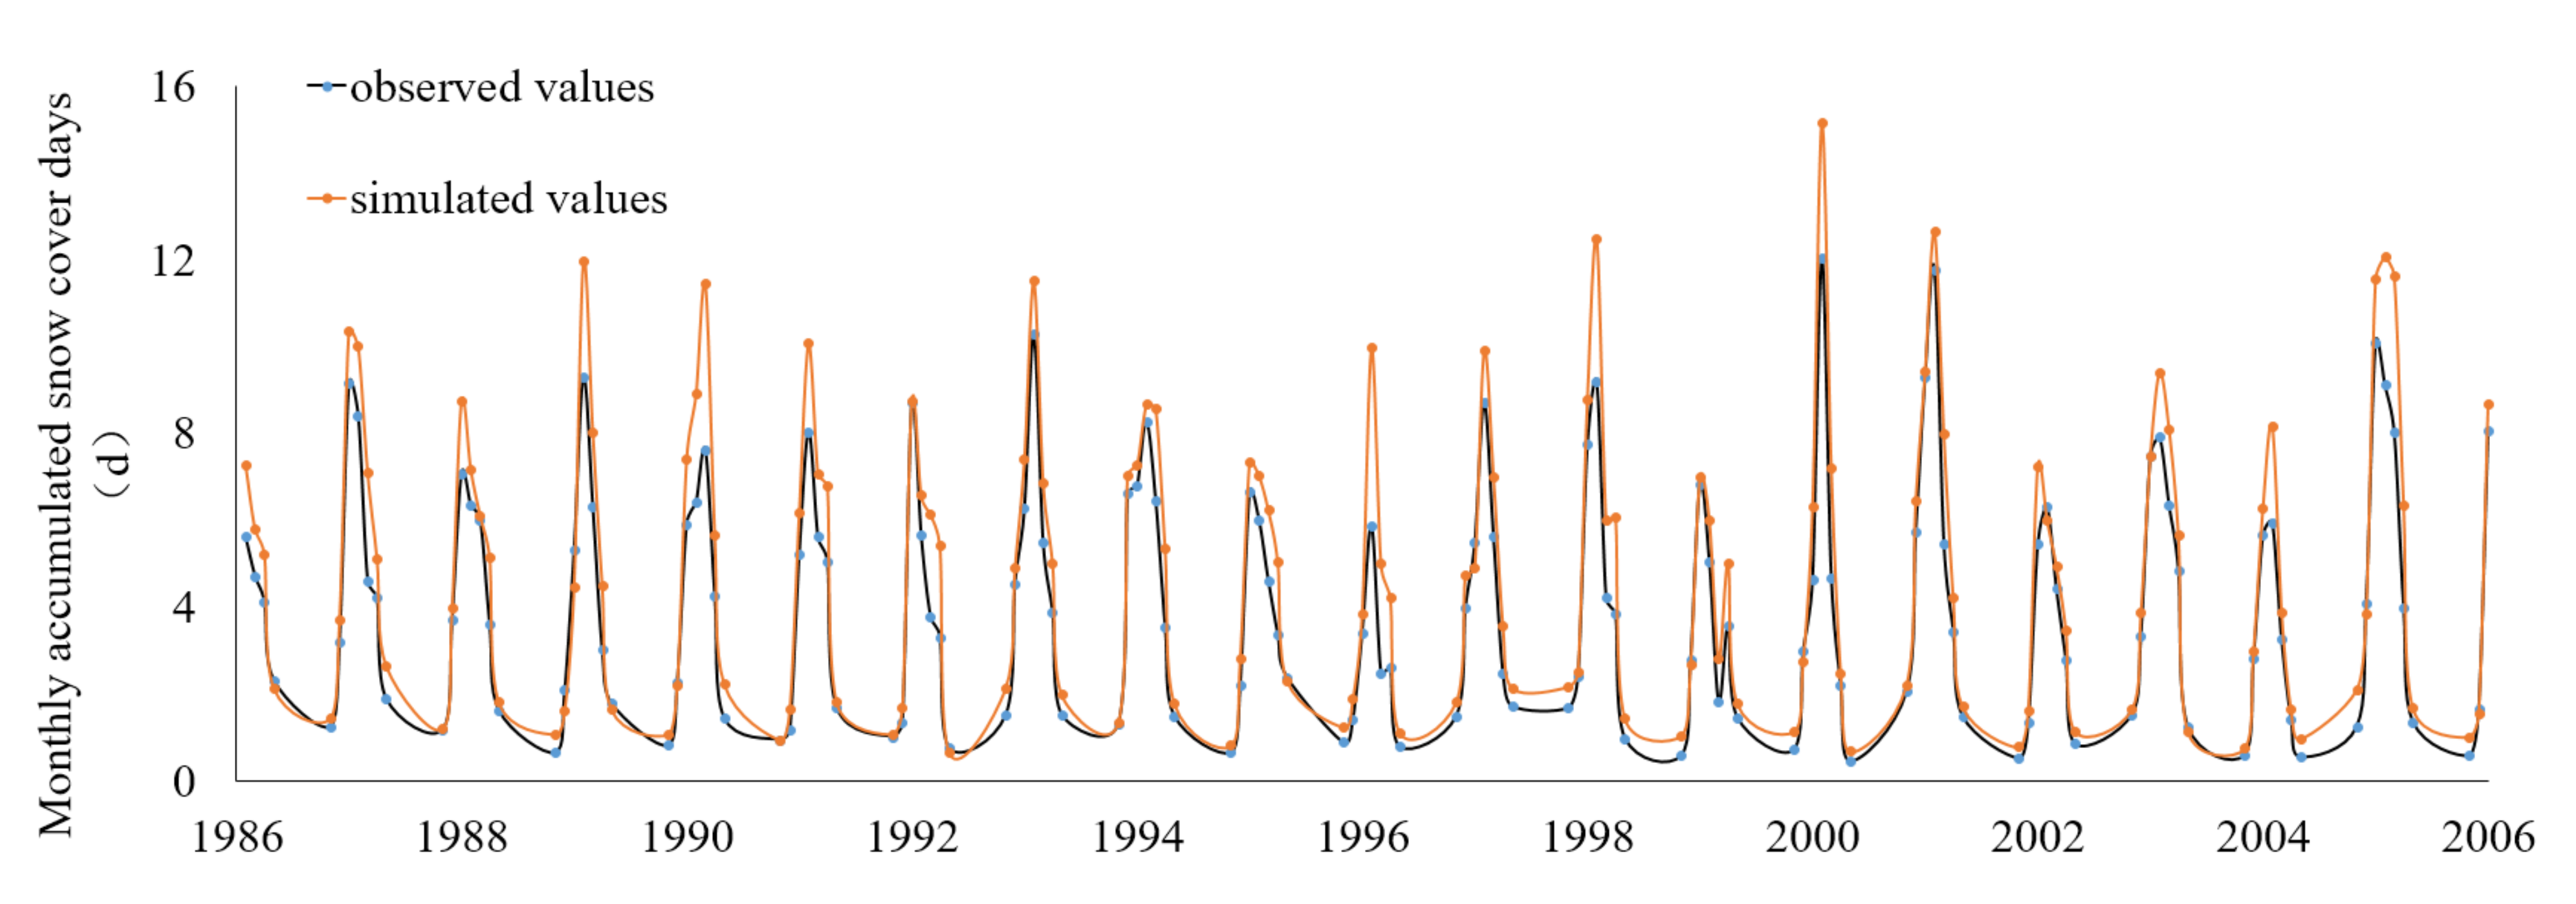
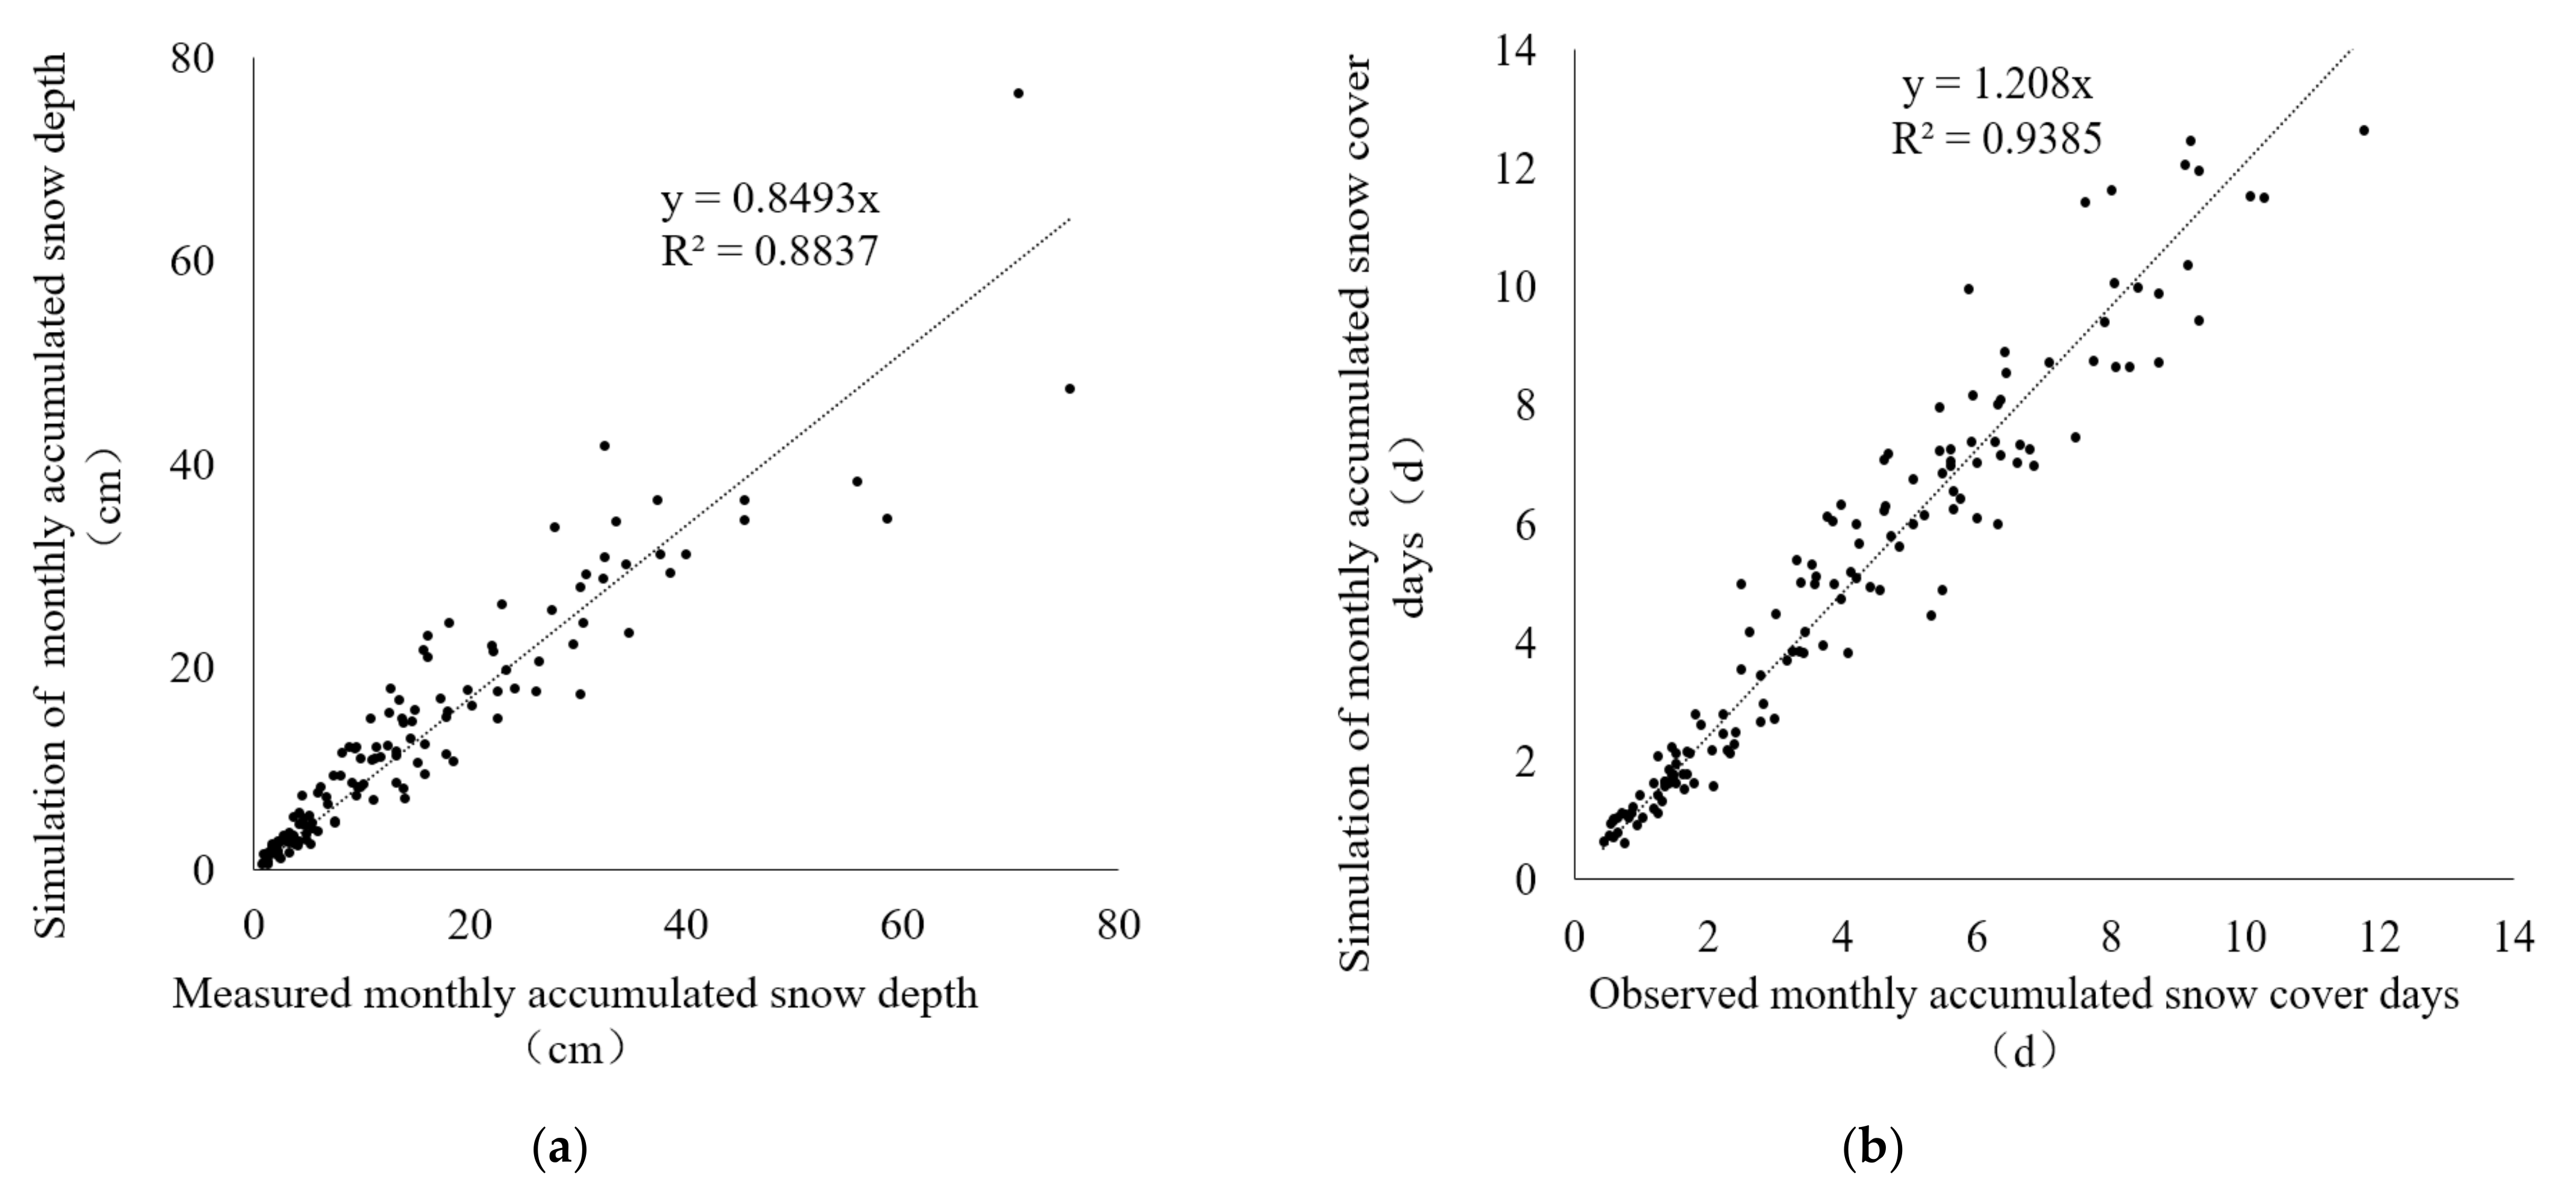
3.2. Validation Results of Model Iterative Simulation Capabilities
3.3. Daily Snow Depth Simulation Based on NEX-GDDP
4. Discussion
4.1. Comparison of Remote Sensing and NEX-GDDP Snow Depth
4.2. Simulated Snow Depth Error Sources in GFDL-ESM2G Model
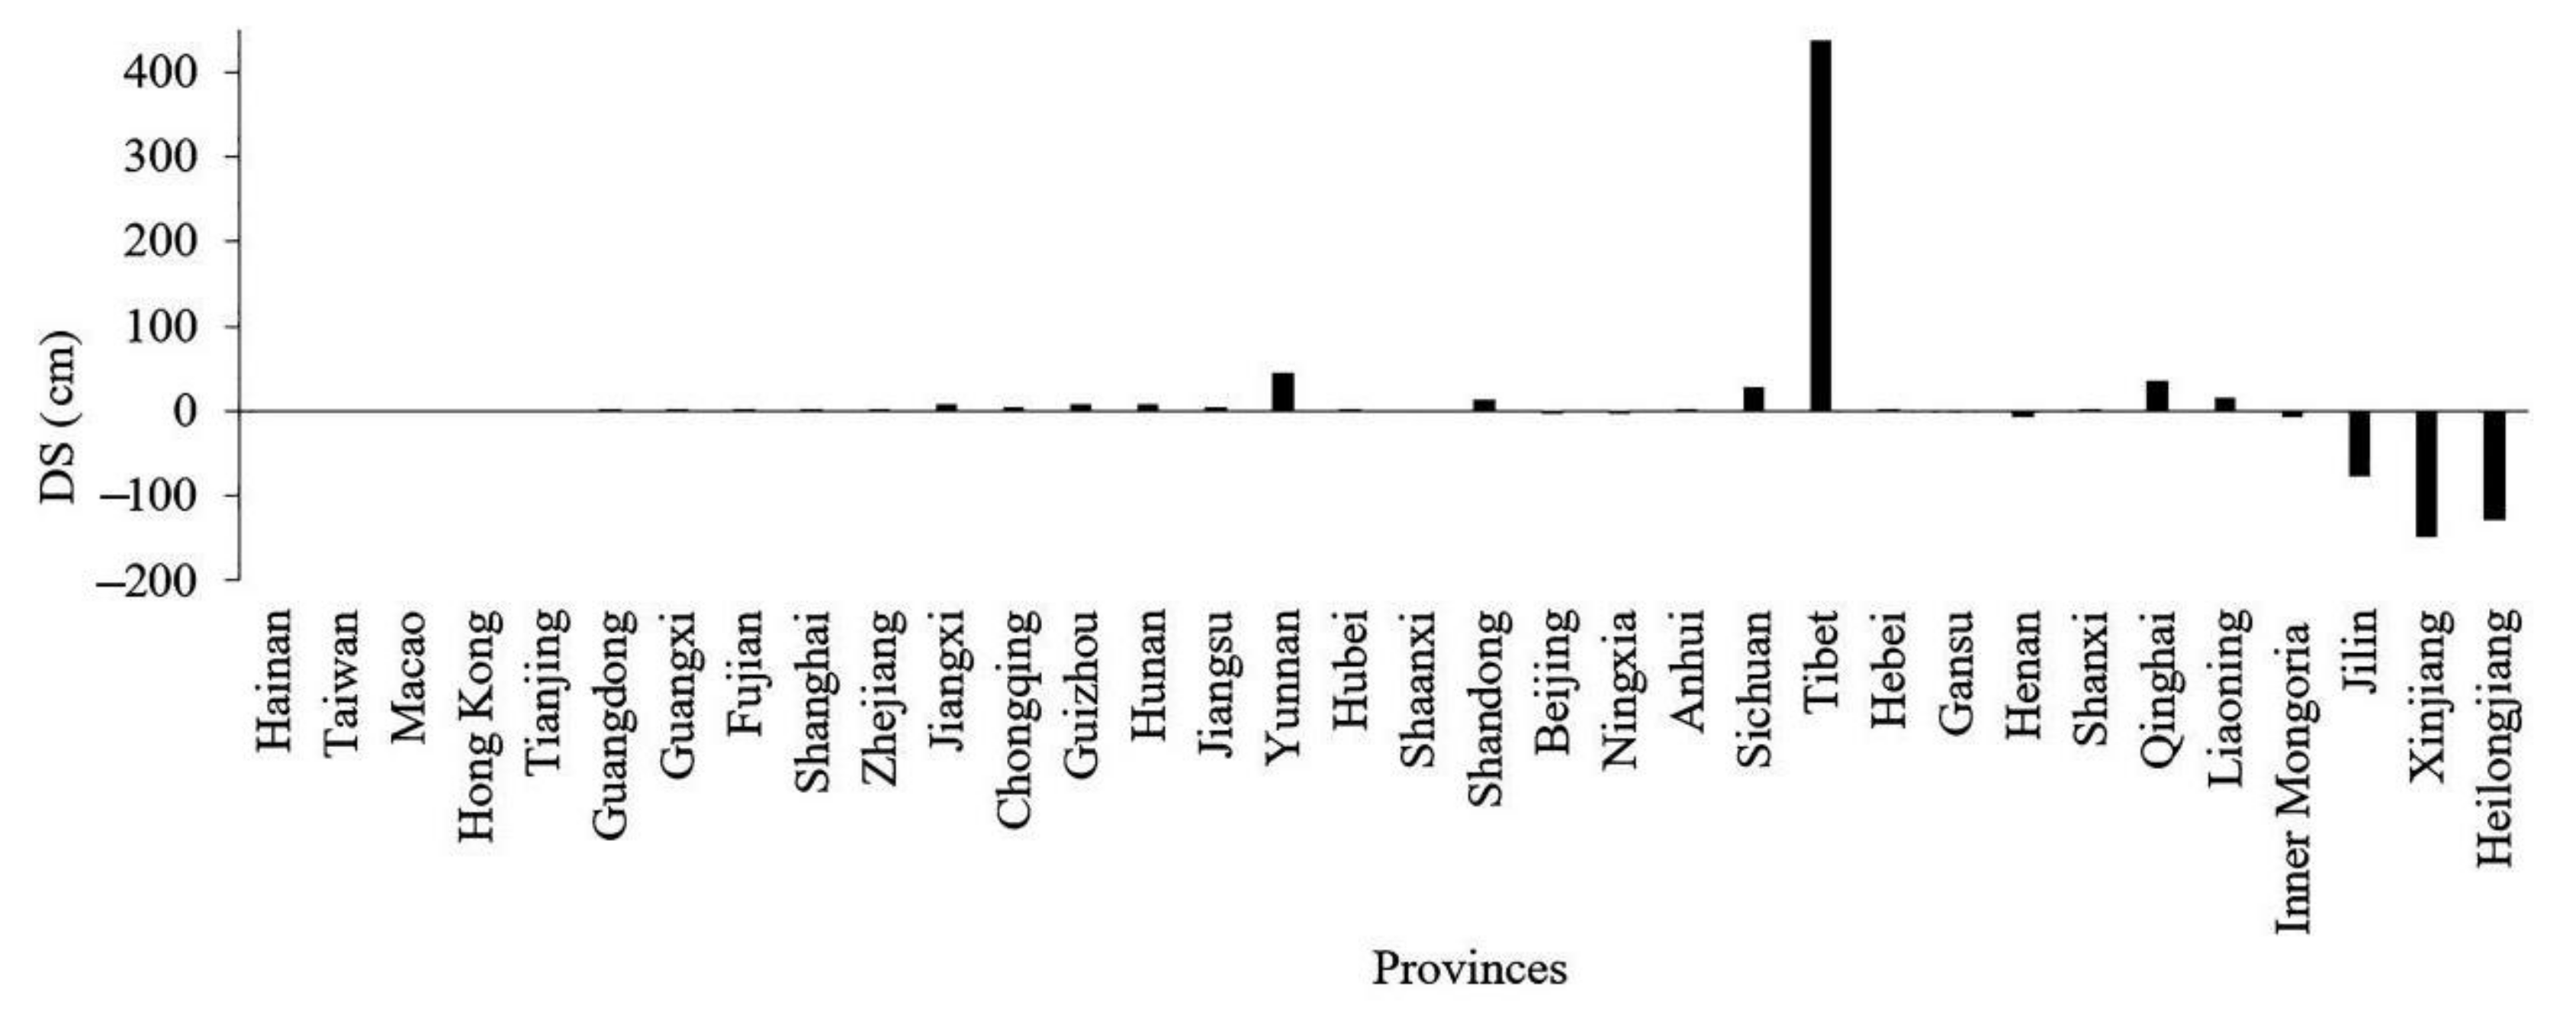
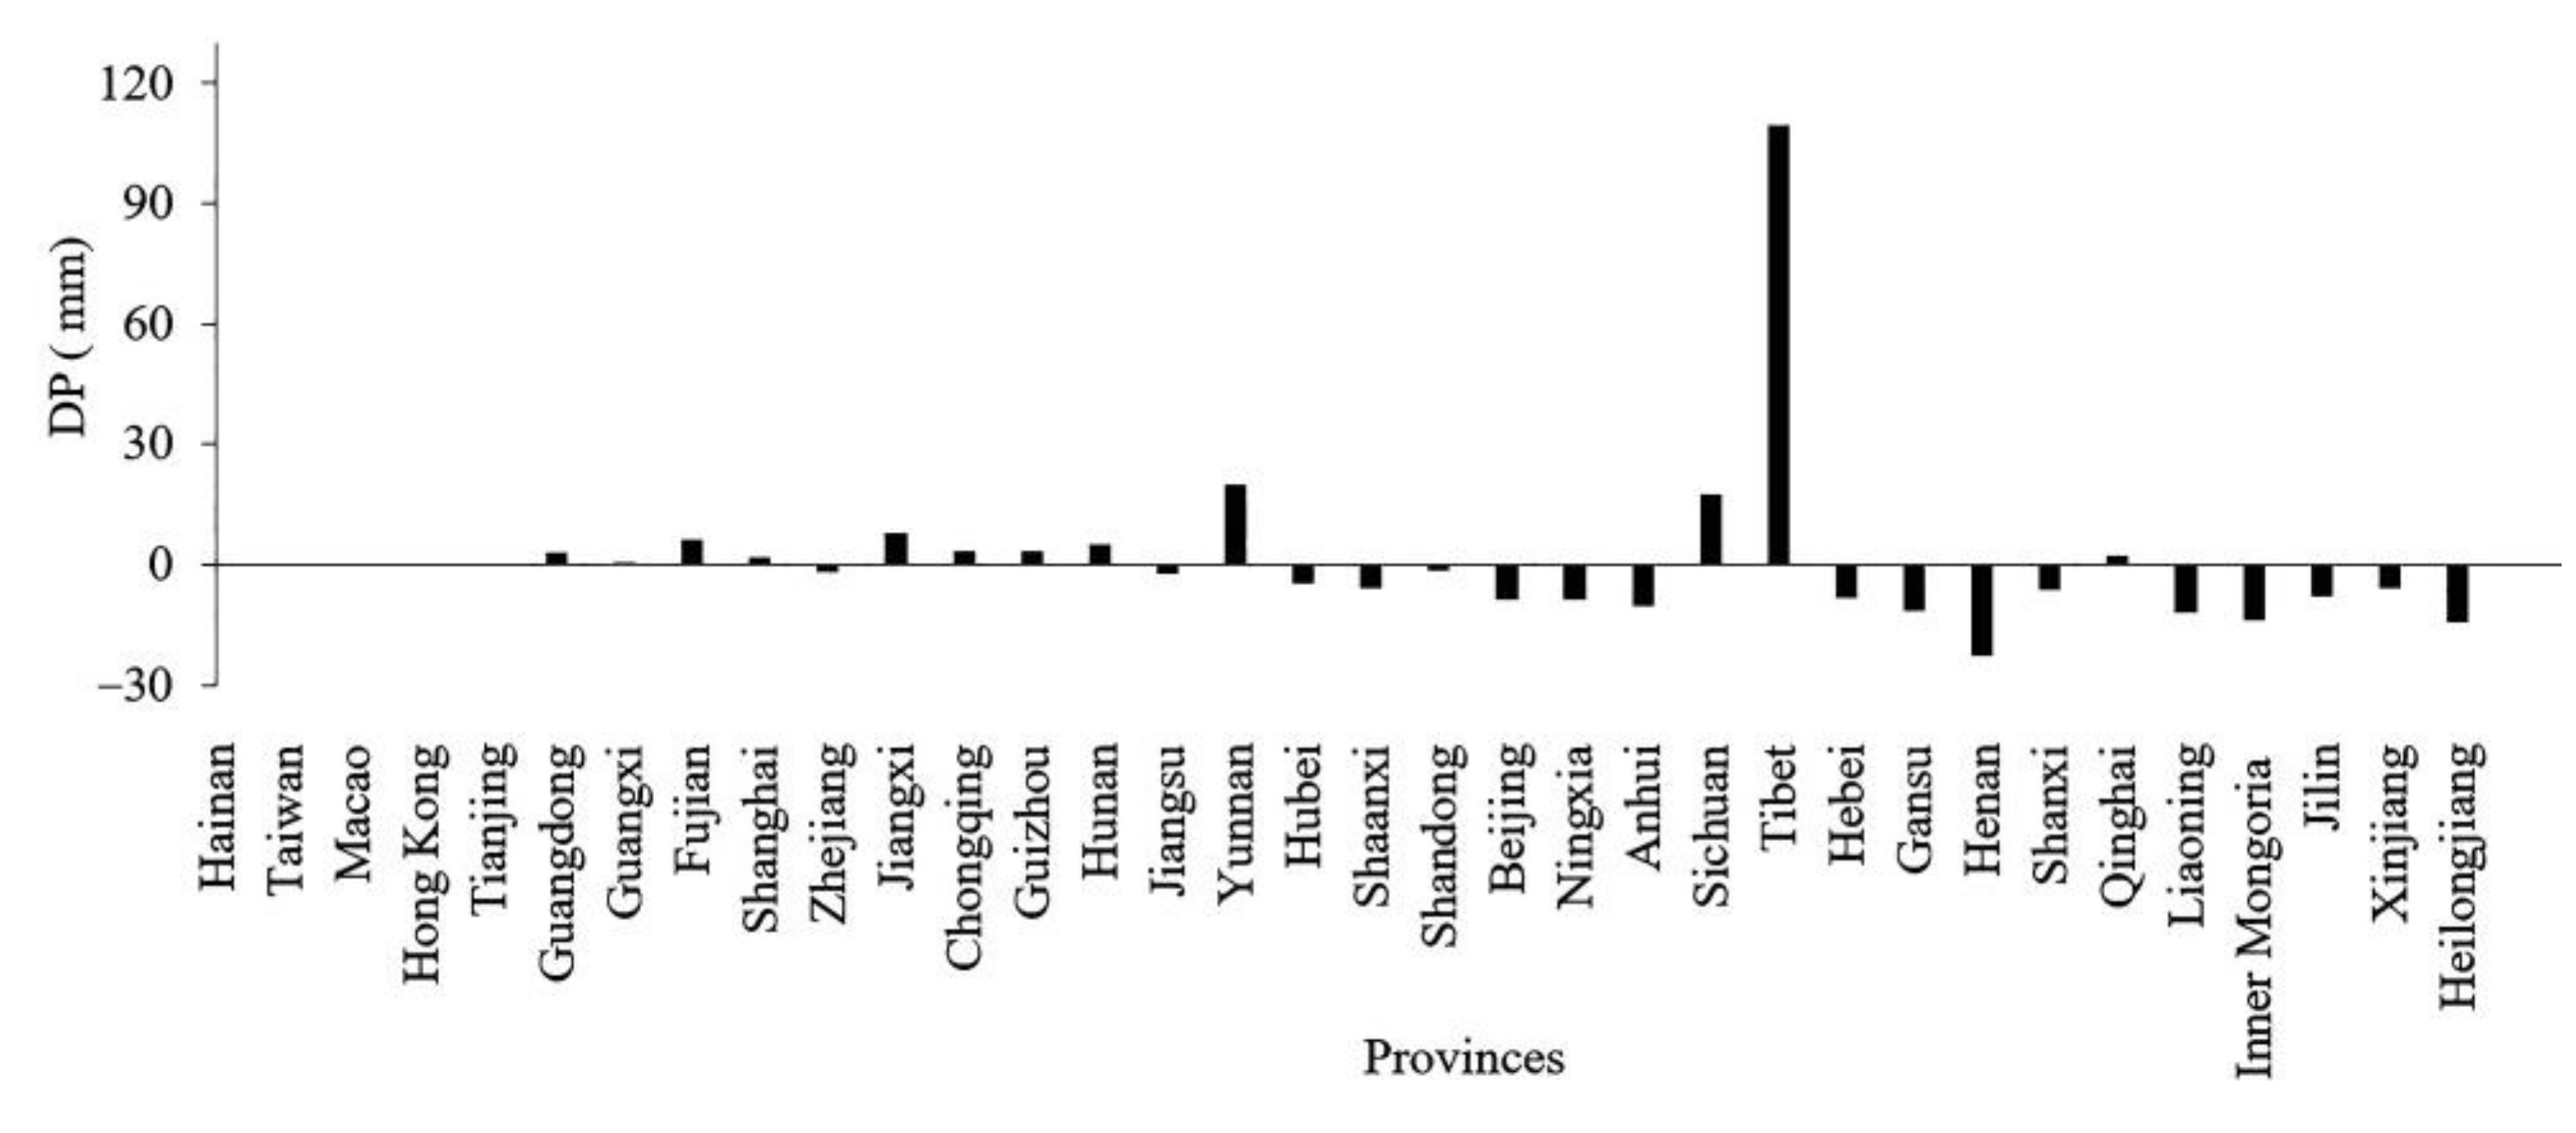
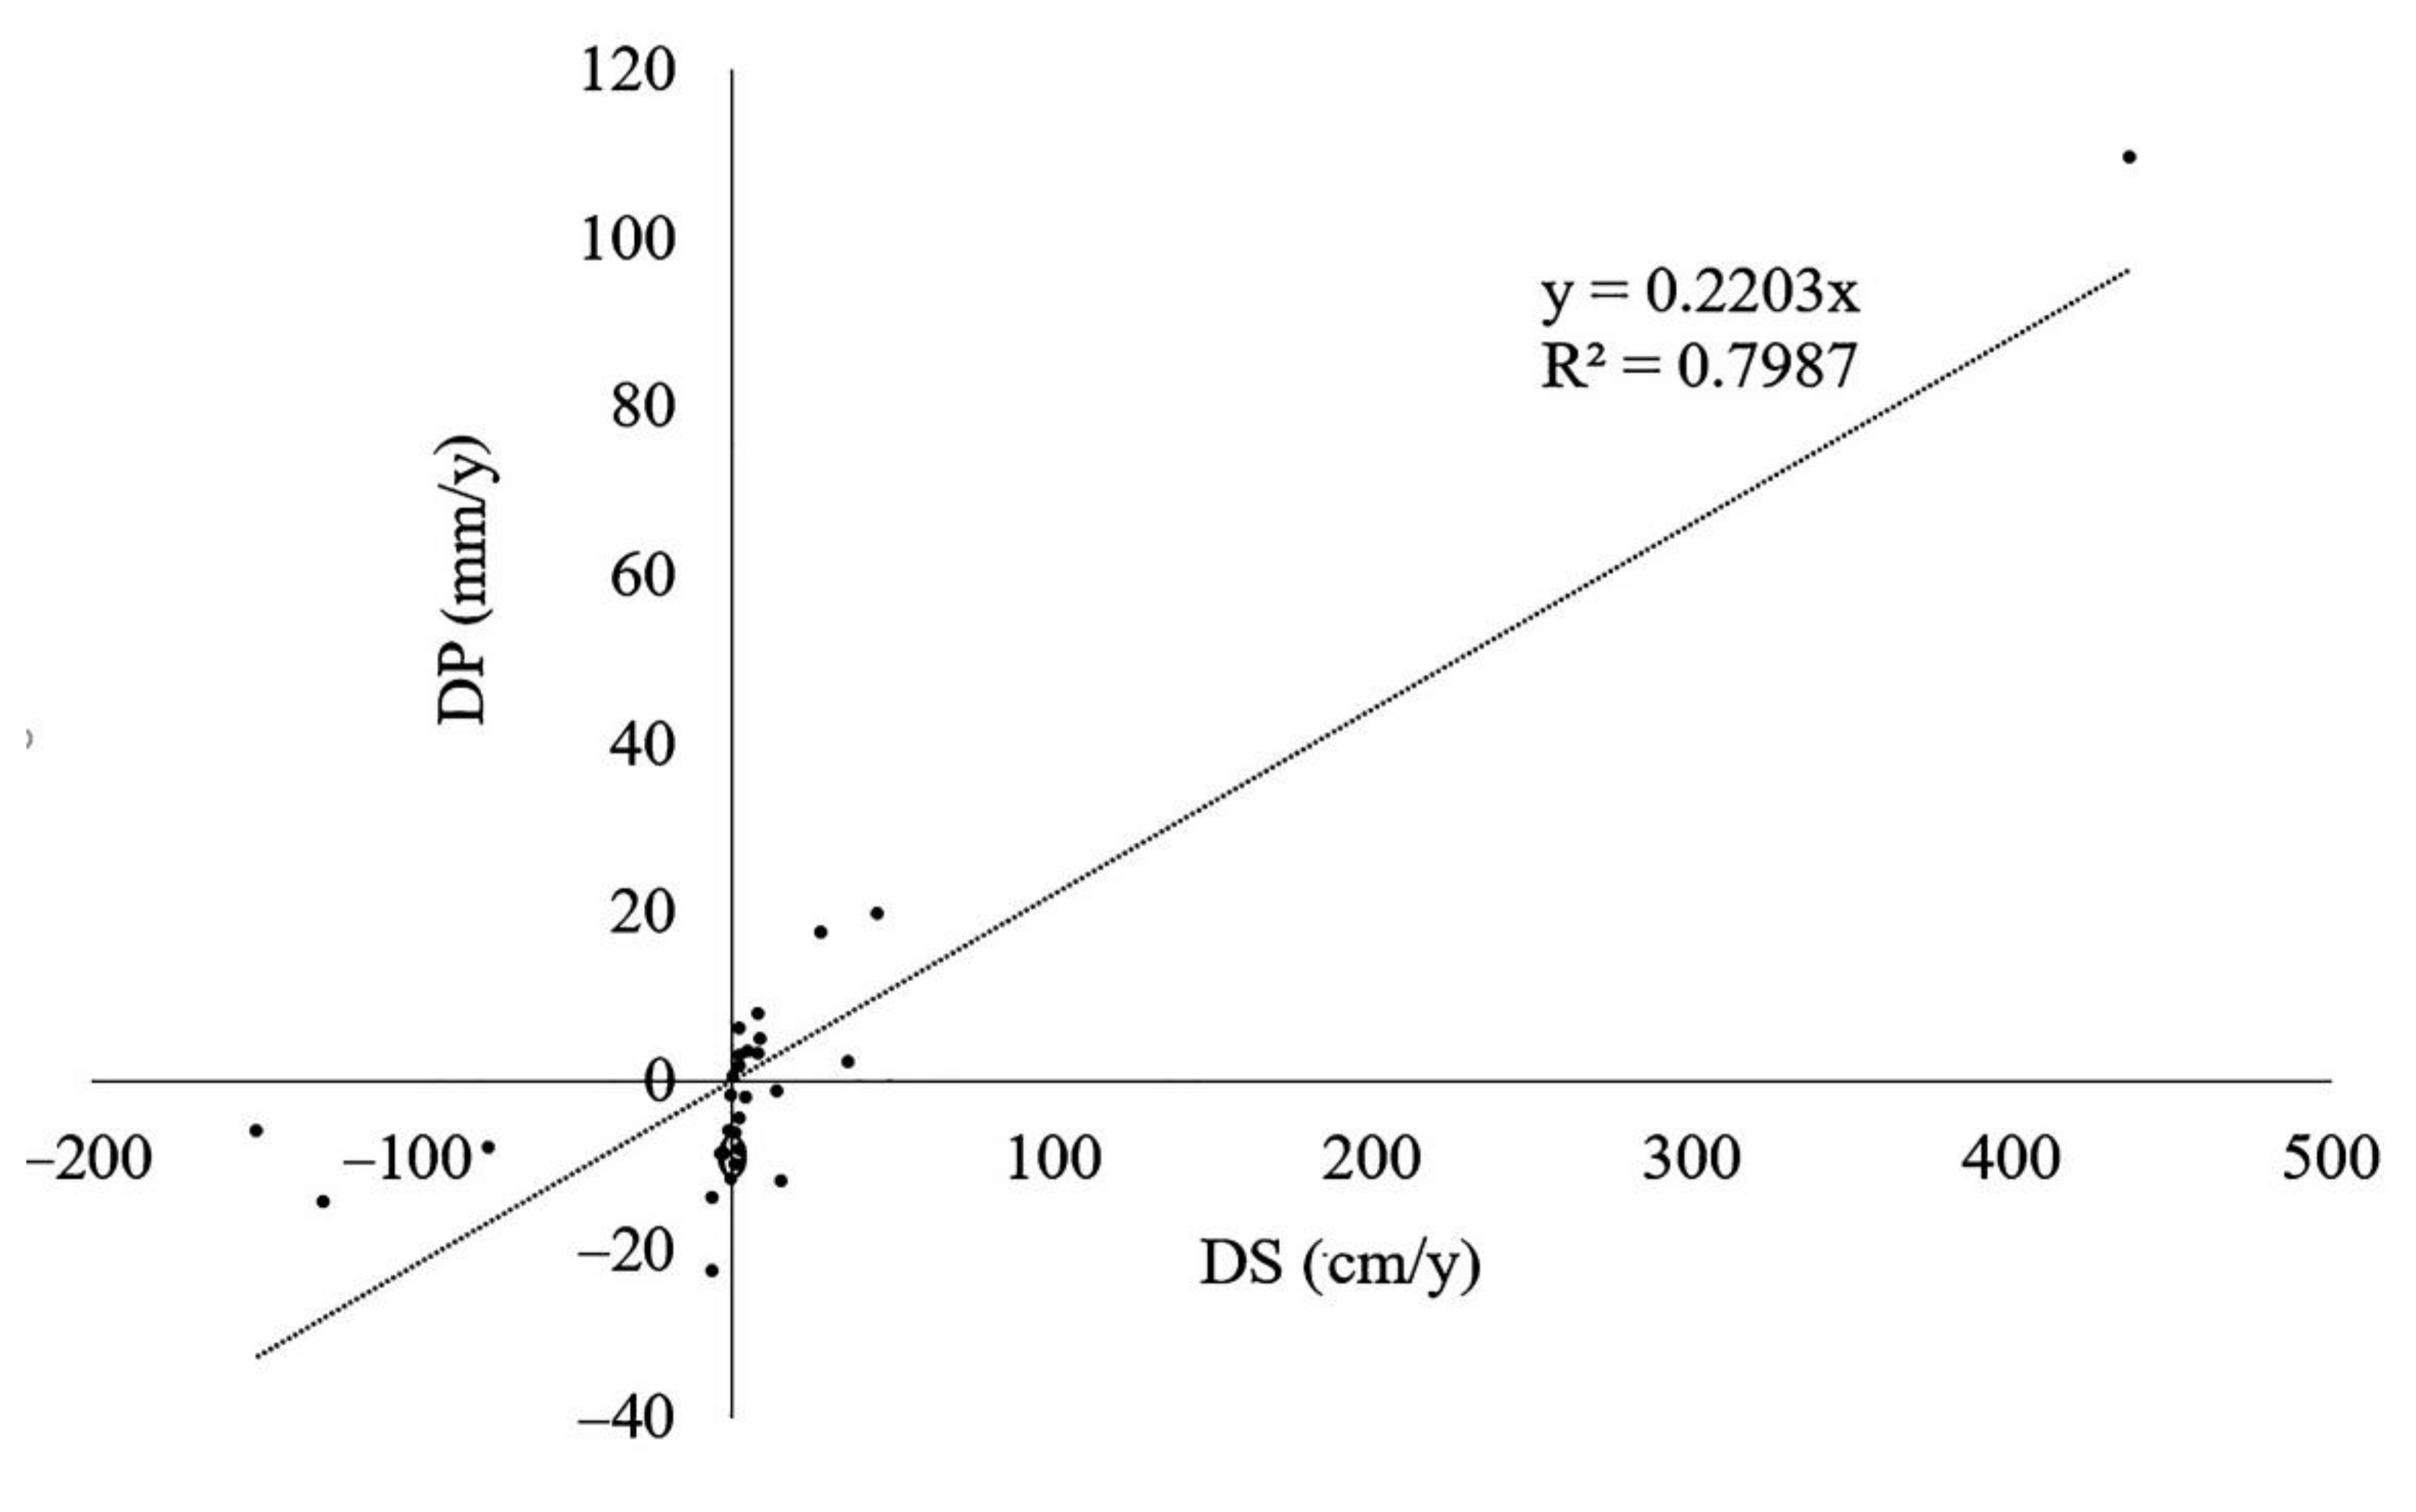
4.2.1. Relationship between DS and DP
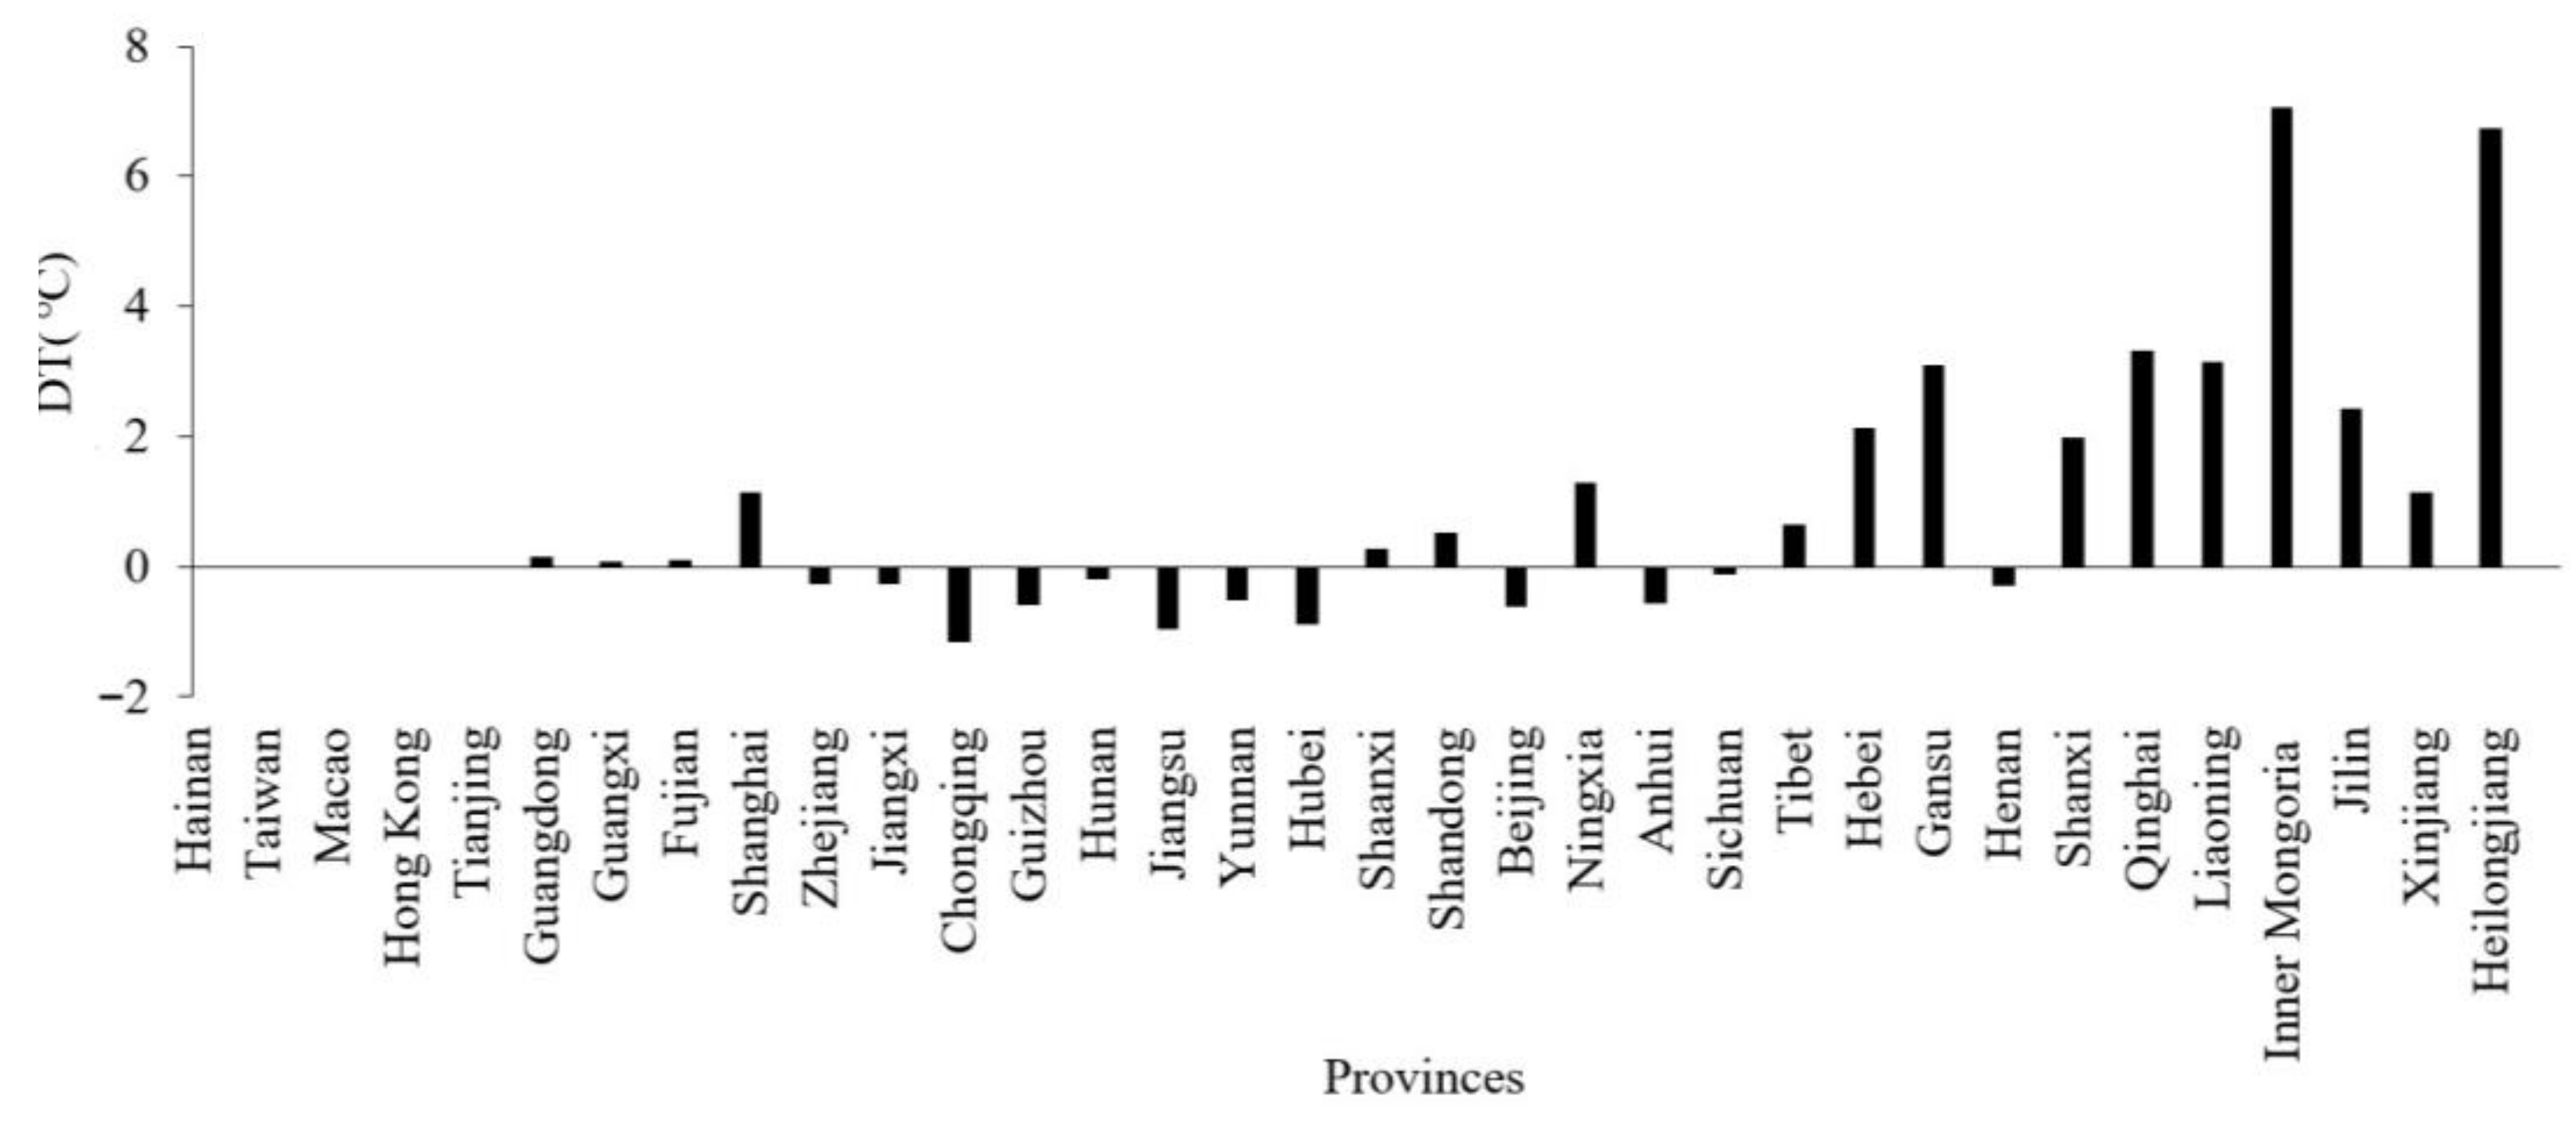
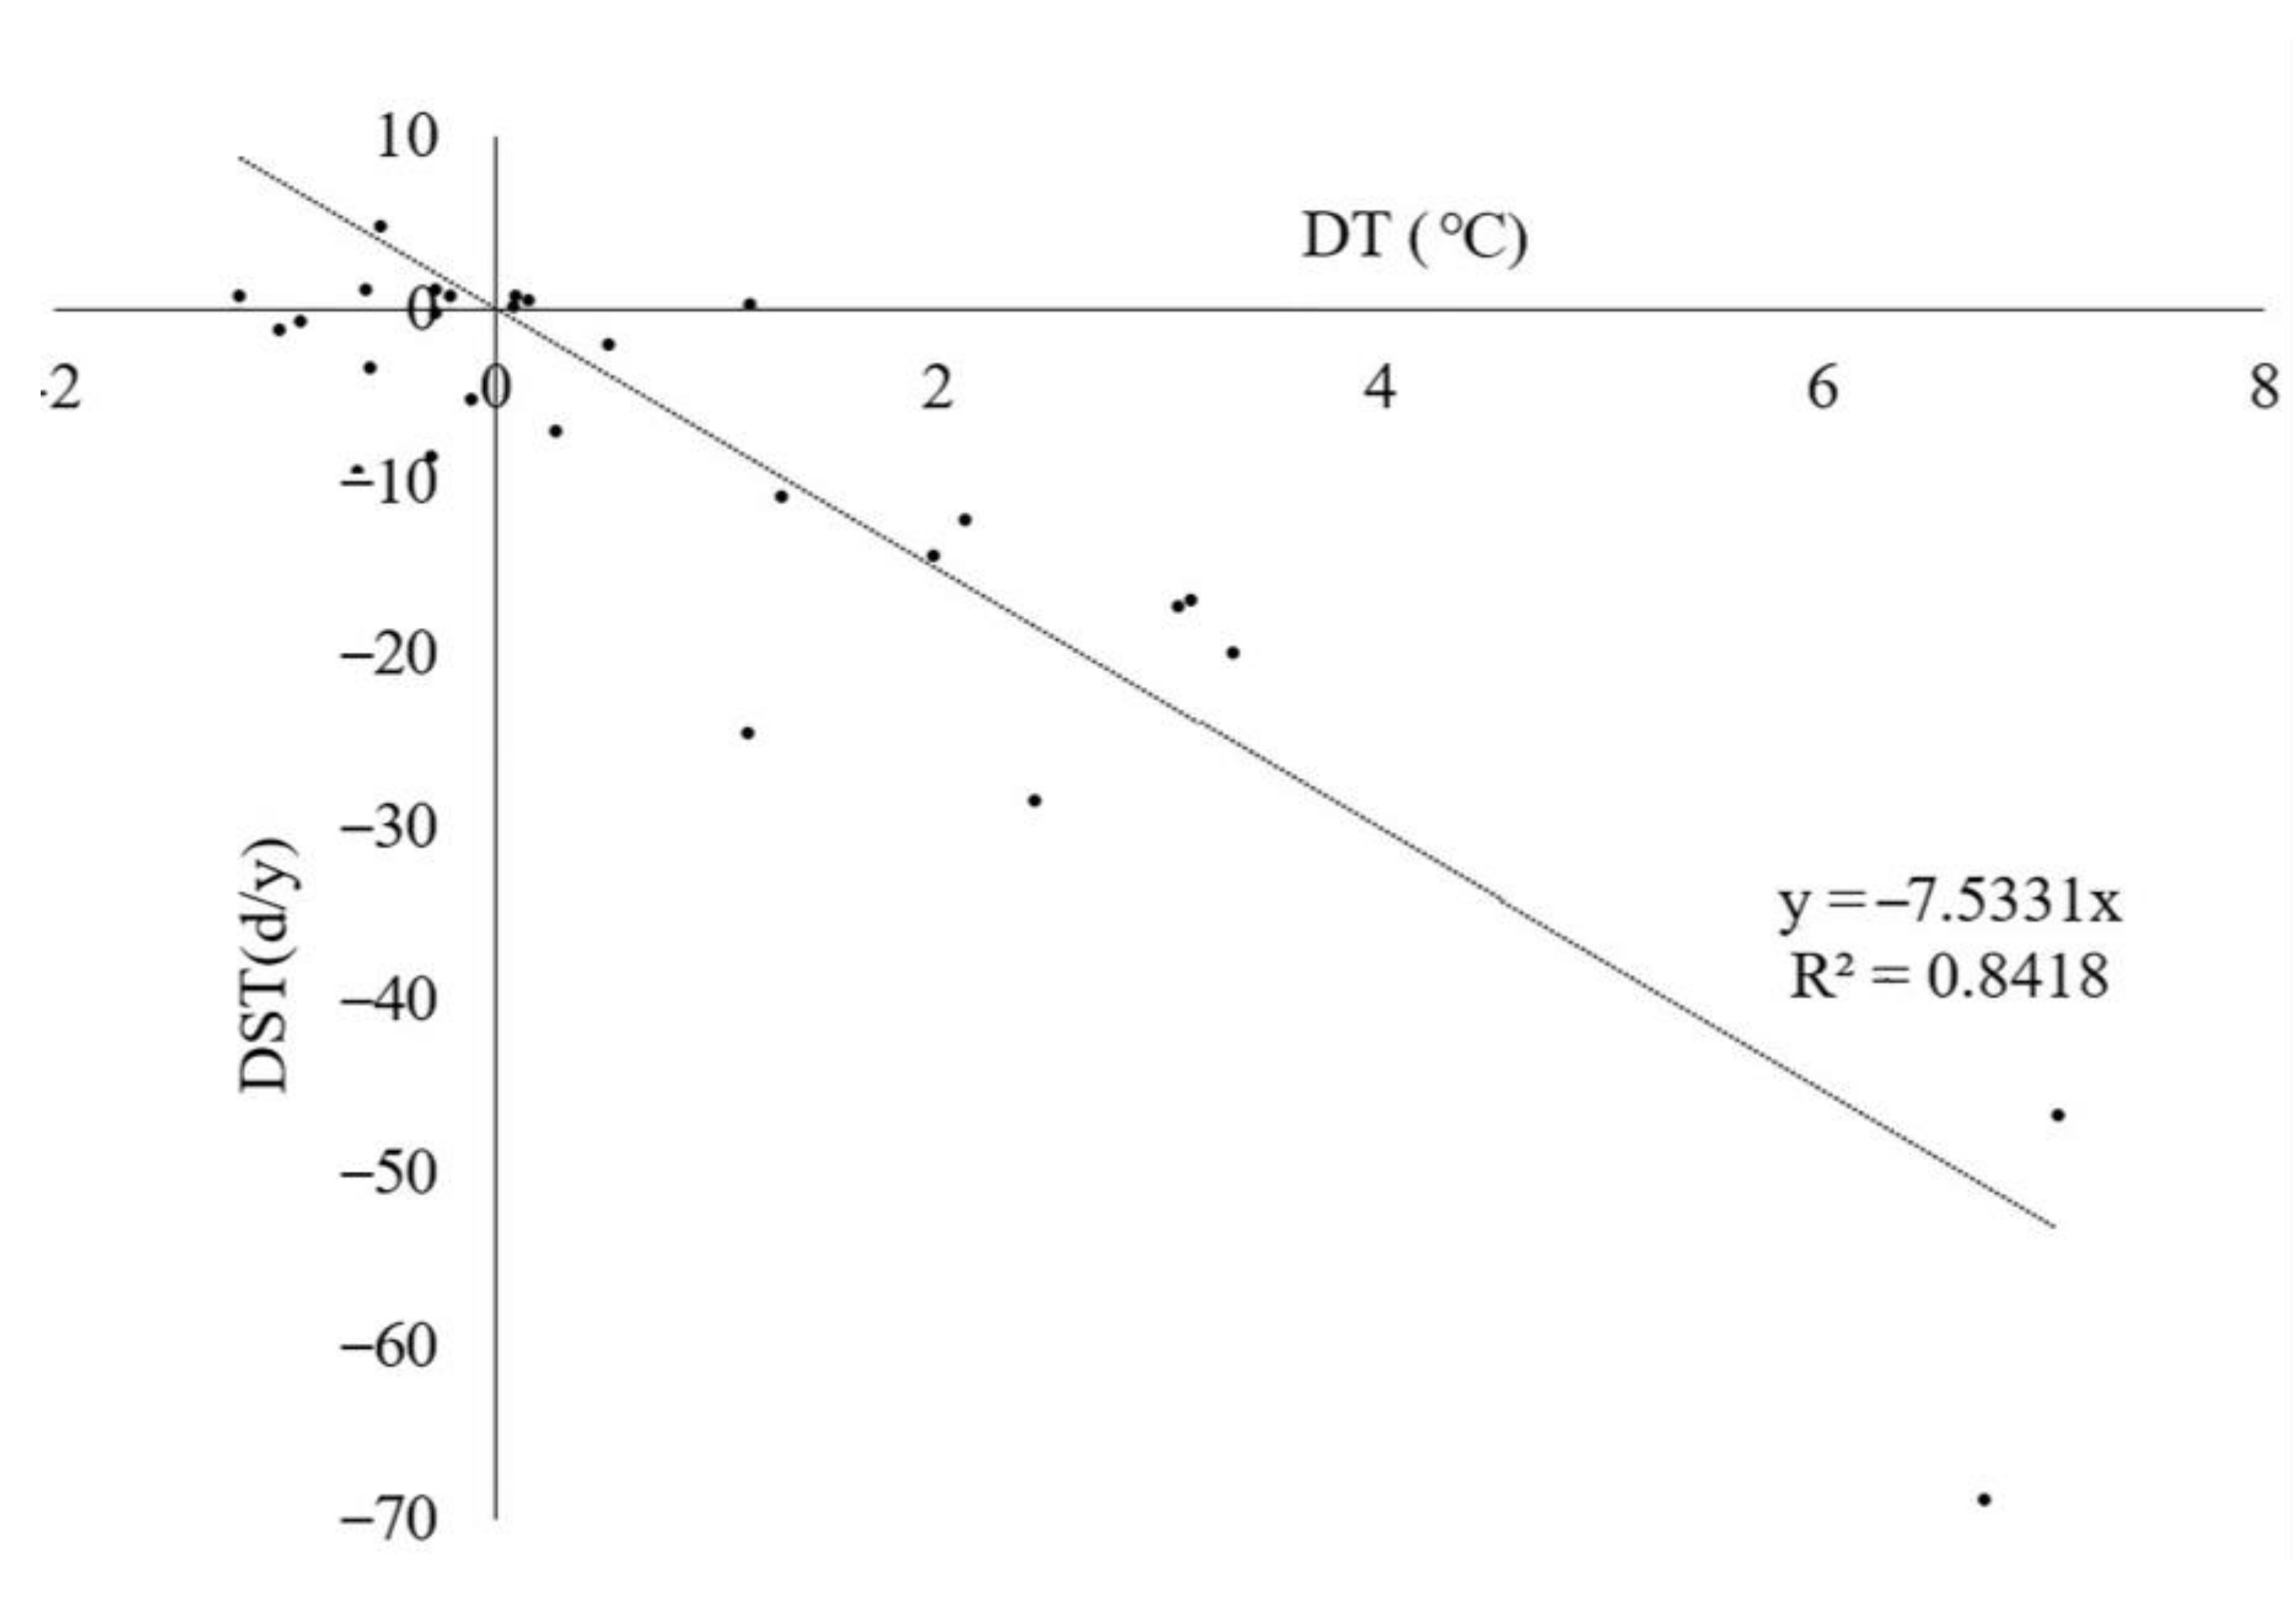
4.2.2. Relationship between DST, DT, and DP
4.3. Extending the Snow Depth Simulation Model
4.3.1. Accuracy of the Gridded Meteorological Data
4.3.2. Simulated Snow Accumulation and Melting
5. Conclusions
Author Contributions
Funding
Institutional Review Board Statement
Informed Consent Statement
Data Availability Statement
Acknowledgments
Conflicts of Interest
References
- Brown, R.D.; Goodison, B.E. Interannual variability in reconstructed Canadian snow cover, 1915–1992. J. Clim. 1996, 9, 1299–1318. [Google Scholar] [CrossRef][Green Version]
- Goodrich, L.E. The influence of snow cover on the ground thermal regime. Can. Geotech. J. 1982, 19, 421–432. [Google Scholar] [CrossRef]
- Sturm, M.; McFadden, J.P.; Liston, G.E.; Stuart Chapin, F.; Racine, C.H.; Holmgren, J. Snow-shrub interactions in Arctic Tundra: A hypothesis with climatic implications. J. Clim. 2001, 14, 336–344. [Google Scholar] [CrossRef]
- Zhang, T. Influence of the seasonal snow cover on the ground thermal regime: An overview. Rev. Geophys. 2005, 43, 421–432. [Google Scholar] [CrossRef]
- Bulygina, O.N.; Razuvaev, V.N.; Korshunova, N.N. Changes in snow cover over Northern Eurasia in the last few decades. Environ. Res. Lett. 2009, 4, 45026. [Google Scholar] [CrossRef]
- Lv, C.; Gong, H.L. Snow disaster risk assessment in china based on environment & disaster monitoring and predicting small satellite. Adv. Mater. Res. 2013, 765–767, 2996–2999. [Google Scholar] [CrossRef]
- Newark, M.J.; Welsh, L.E.; Morris, R.J.; Dnes, W.V. Revised ground snow loads for the 1990 National Building Code of Canada. Can. J. Civ. Eng. 1989, 16, 267–278. [Google Scholar] [CrossRef]
- Strasser, U. Snow loads in a changing climate: New risks? Nat. Hazards Earth Syst. Sci. 2008, 8, 1–8. [Google Scholar] [CrossRef]
- Yin, Z.; Xu, S.; Yin, J.; Wang, J. Small-scale based scenario modeling and disaster risk assessment of urban rainstorm water-logging. Dili Xuebao/Acta Geogr. Sin. 2010, 65, 553–562. [Google Scholar]
- Cayan, D.R. Interannual climate variability and snowpack in the western United States. J. Clim. 1996, 9, 928–948. [Google Scholar] [CrossRef]
- Vikhamar, D.; Solberg, R. Snow-cover mapping in forests by constrained linear spectral unmixing of MODIS data. Remote Sens. Environ. 2003, 88, 309–323. [Google Scholar] [CrossRef]
- Armstrong, R.L.; Brodzik, M.J. Hemispheric-scale comparison and evaluation of passive-microwave snow algorithms. Ann. Glaciol. 2002, 34, 38–44. [Google Scholar] [CrossRef]
- Che, T.; Li, X.; Jin, R.; Armstrong, R.; Zhang, T. Snow depth derived from passive microwave remote-sensing data in China. Ann. Glaciol. 2008, 49, 145–154. [Google Scholar] [CrossRef]
- Pan, C.G.; Kirchner, P.B.; Kimball, J.S.; Du, J. A long-term passive microwave snowoff record for the alaska region 1988–2016. Remote Sens. 2020, 12, 153. [Google Scholar] [CrossRef]
- Liang, D.; Xu, X.; Tsang, L.; Andreadis, K.M.; Josberger, E.G. Modeling multi-layer effects in passive microwave remote sensing of dry snow using Dense Media Radiative Transfer Theory (DMRT) based on quasicrystalline approximation. Int. Geosci. Remote Sens. Symp. 2007, 46, 1215–1218. [Google Scholar] [CrossRef]
- Ghaderpour, E.; Vujadinovic, T.; Hassan, Q.K. Application of the Least-Squares Wavelet software in hydrology: Athabasca River Basin. J. Hydrol. Reg. Stud. 2021, 36. [Google Scholar] [CrossRef]
- Ma, L.-J.; Luo, Y.; Qin, D.-H. Snow water equivalent over Eurasia in the next 50 years projected by aggregated CMIP3 models. Sci. Cold Arid Reg. 2012, 4, 93. [Google Scholar] [CrossRef]
- Xian, Z. China Evaluation and Projection of Northern Hemisphere March—April Snow Covered Area Simulated by CMIP5 Coupled Climate Models. Progress. Inquisitiones Mutat. Clim. 2013, 9, 173. [Google Scholar]
- Pomeroy, J.W.; Gray, D.M.; Shook, K.R.; Toth, B.; Essery, R.L.H.; Pietroniro, A.; Hedstrom, N. An evaluation of snow accumulation and ablation processes for land surface modelling. Hydrol. Process. 1998, 12, 2339–2367. [Google Scholar] [CrossRef]
- Leathers, D.J.; Luff, B.L. Characteristics of snow cover duration across the Northeast United States of America. Int. J. Climatol. 1997, 17, 1535–1547. [Google Scholar] [CrossRef]
- Thrasher, B.; Xiong, J.U.N.; Wang, W.; Melton, F.; Michaelis, A.; Nemani, R. Downscaled climate projections suitable for resource management. EOS 2013, 94, 321–323. [Google Scholar] [CrossRef]
- Bao, Y.; Wen, X. Projection of China’s near- and long-term climate in a new high-resolution daily downscaled dataset NEX-GDDP. J. Meteorol. Res. 2017, 31, 236–249. [Google Scholar] [CrossRef]
- Chen, H.P.; Sun, J.Q.; Li, H.X. Future changes in precipitation extremes over China using the NEX-GDDP high-resolution daily downscaled data-set. Atmos. Ocean. Sci. Lett. 2017, 10, 403–410. [Google Scholar] [CrossRef]
- Li, W.; Jiang, Z.; Xu, J.; Li, L. Extreme precipitation indices over China in CMIP5 models. Part II: Probabilistic projection. J. Clim. 2016, 29, 8989–9004. [Google Scholar] [CrossRef]
- Bao, Q.; Liu, Y.; Wu, G.; He, B.; Li, J.; Wang, L.; Wu, X.; Chen, K.; Wang, X.; Yang, J.; et al. CAS FGOALS-f3-H and CAS FGOALS-f3-L outputs for the high-resolution model intercomparison project simulation of CMIP6. Atmos. Ocean. Sci. Lett. 2020, 13, 576–581. [Google Scholar] [CrossRef]
- McKeown, D.M. The Role of Artificial Intelligence in the Integration of Remotely Sensed Data with Geographic Information Systems. IEEE Trans. Geosci. Remote Sens. 1987, GE-25, 330–348. [Google Scholar] [CrossRef]
- Zhu, X.X.; Tuia, D.; Mou, L.; Xia, G.S.; Zhang, L.; Xu, F.; Fraundorfer, F. Deep Learning in Remote Sensing: A Comprehensive Review and List of Resources. IEEE Geosci. Remote Sens. Mag. 2017, 5, 8–36. [Google Scholar] [CrossRef]
- Carrier, C.A.; Kalra, A.; Ahmad, S. Long-range precipitation forecasts using paleoclimate reconstructions in the western United States. J. Mt. Sci. 2016, 13, 614–632. [Google Scholar] [CrossRef]
- Tucker, D. Orographic precipitation. Encycl. Earth Sci. Ser. 2005, 552–555. [Google Scholar] [CrossRef]
- Zhang, L.; Shi, H. Local modeling of tree growth by geographically weighted regression. For. Sci. 2004, 50, 225–244. [Google Scholar] [CrossRef]


| No. | Model Name | Country | Organization |
|---|---|---|---|
| 1 | ACCESS1-0 | Australia | CSIRO-BOM |
| 2 | bcc-csm1-1 | China | BCC |
| 3 | BNU-ESM | China | GCESS |
| 4 | CanESM2 | Canada | CCCMA |
| 5 | CCSM4 | The United States | NCAR |
| 6 | CESM1-BGC | The United States | NSF-DOE-NCAR |
| 7 | CNRM-CM5 | France | CERFACS |
| 8 | CSIRO-Mk3-6-0 | Australia | CSIRO-QCCCE |
| 9 | GFDL-CM3 | The United States | NOAA-GFDL |
| 10 | GFDL-ESM2G | The United States | NOAA-GFDL |
| 11 | GFDL-ESM2M | The United States | NOAA-GFDL |
| 12 | inmcm4 | Russia | UNM |
| 13 | IPSL-CM5A-LR | France | IPSL |
| 14 | IPSL-CM5A-MR | France | IPSL |
| 15 | MIROC5 | Japan | MIROC |
| 16 | MIROC-ESM | Japan | MIROC |
| 17 | MIROC-ESM-CHEM | Japan | MIROC |
| 18 | MPI-ESM-LR | Germany | MPI-M |
| 19 | MPI-ESM-MR | Germany | MPI-M |
| 20 | MRI-CGCM3 | Japan | MRI |
| 21 | NorESM1-M | Norway | NCC |
| Parameter Name | Value | Definitions |
|---|---|---|
| activation function | Tansig, purelin | Transfer functions between neurons |
| net.trainParam.epochs | 1000 | Maximum times of training |
| net.trainParam.goal | 1 × 10⁻⁷ | Minimum error in training goal |
| net.trainParam.lr | 0.01 | Learning rate |
| net.trainParam.mc | 0.9 | Additional momentum factors |
| net.trainParam.show | 25 | The display frequency |
| Model Name | Remote | ACCESS1-0 | BNU-ESM | CCSM4 | CESM1-BGC |
| RMSE | 28.78 | 32.01 | 32.39 | 30.67 | 33.20 |
| r | 0.52 * | −0.31 | −0.04 | 0.03 | −0.24 |
| Model name | CNRM-CM5 | CSIRO-Mk3-6-0 | CanESM2 | GFDL-CM3 | GFDL-ESM2G |
| RMSE | 33.61 | 32.80 | 32.61 | 33.70 | 29.88 |
| r | 0.05 | −0.23 | 0.10 | −0.38 | 0.58 ** |
| Model name | GFDL-ESM2M | IPSL-CM5A-LR | IPSL-CM5A-MR | MIROC-ESM-CHEM | MIROC-ESM |
| RMSE | 32.71 | 33.67 | 32.59 | 34.94 | 34.44 |
| r | −0.24 | 0.32 | −0.03 | −0.12 | −0.15 |
| Model name | MIROC5 | MPI-ESM-LR | MPI-ESM-MR | MRI-CGCM3 | NorESM1-M |
| RMSE | 30.75 | 32.41 | 29.97 | 32.34 | 35.40 |
| r | 0.06 | −0.31 | 0.02 | −0.26 | 0.35 |
| Model name | bcc-csm1-1 | inmcm4 | |||
| RMSE | 31.52 | 33.23 | |||
| r | 0.50 * | −0.39 |
| Province | DT of Daily Maximum Temperature | DT of Daily Minimum Temperature | Avg DT | ||||||||
|---|---|---|---|---|---|---|---|---|---|---|---|
| Snow Depth (cm) | 1–3 | 3–5 | 5–10 | 10–15 | >15 | 1–3 | 3–5 | 5–10 | 10–15 | >15 | |
| Hainan | 0.00 | 0.00 | 0.00 | 0.00 | 0.00 | 0.00 | 0.00 | 0.00 | 0.00 | 0.00 | 0.00 |
| Taiwan | 0.00 | 0.00 | 0.00 | 0.00 | 0.00 | 0.00 | 0.00 | 0.00 | 0.00 | 0.00 | 0.00 |
| Macao | 0.00 | 0.00 | 0.00 | 0.00 | 0.00 | 0.00 | 0.00 | 0.00 | 0.00 | 0.00 | 0.00 |
| Hong Kong | 0.00 | 0.00 | 0.00 | 0.00 | 0.00 | 0.00 | 0.00 | 0.00 | 0.00 | 0.00 | 0.00 |
| Tianjin | 0.00 | 0.00 | 0.00 | 0.00 | 0.00 | 0.00 | 0.00 | 0.00 | 0.00 | 0.00 | 0.00 |
| Guangdong | 0.83 | 0.48 | 0.47 | 0.24 | 0.00 | 0.07 | −0.11 | −0.19 | −0.24 | 0.00 | 0.15 |
| Guangxi | 1.54 | −0.72 | 0.38 | 0.00 | 0.00 | 0.20 | −0.23 | −0.37 | 0.00 | 0.00 | 0.08 |
| Fujian | 0.09 | 1.39 | 0.44 | −0.29 | 0.00 | 0.45 | −0.84 | −0.09 | −0.21 | 0.00 | 0.09 |
| Shanghai | 4.11 | 1.61 | 0.00 | 0.00 | 0.00 | 0.87 | 4.94 | 0.00 | 0.00 | 0.00 | 1.15 |
| Zhejiang | 1.10 | −2.96 | −0.44 | −2.31 | 0.00 | 1.34 | −0.27 | 0.63 | 0.20 | 0.00 | −0.27 |
| Jiangxi | 1.07 | 0.57 | 0.10 | −1.65 | −1.83 | 0.81 | 0.13 | −0.01 | −1.71 | −0.19 | −0.27 |
| Chongqing | 1.85 | −3.62 | −0.60 | −1.97 | 0.00 | −0.03 | −2.71 | −2.01 | −2.45 | 0.00 | −1.15 |
| Guizhou | 0.38 | −1.68 | −3.14 | −1.25 | 0.00 | −0.22 | −1.22 | −0.83 | 2.07 | 0.00 | −0.59 |
| Hunan | 1.00 | −0.26 | −0.04 | 0.26 | −2.53 | 1.01 | 0.00 | −0.24 | −0.79 | −0.45 | −0.20 |
| Jiangsu | 1.28 | 0.85 | −1.73 | −1.43 | −2.70 | −0.19 | −1.01 | −1.24 | −3.49 | −0.05 | −0.97 |
| Yunnan | 1.30 | −0.92 | 0.65 | −0.84 | −1.80 | −1.03 | −0.67 | −1.13 | −0.44 | −0.30 | −0.52 |
| Hubei | 0.66 | −0.68 | −2.05 | −2.70 | 0.00 | −0.58 | −1.38 | −1.40 | −0.63 | 0.00 | −0.88 |
| Shaanxi | 0.67 | −0.30 | −0.83 | −1.14 | 0.00 | 0.37 | −0.61 | 1.37 | 3.18 | 0.00 | 0.27 |
| Shandong | 1.29 | 1.36 | −0.15 | −0.77 | 0.63 | −0.82 | −1.01 | −1.31 | 2.98 | 2.95 | 0.52 |
| Beijing | 2.62 | 0.97 | −2.94 | −4.80 | 0.00 | −1.34 | −0.84 | −1.43 | 1.50 | 0.00 | −0.63 |
| Ningxia | 6.53 | 3.48 | 0.00 | 0.00 | 0.00 | 4.07 | −1.12 | 0.00 | 0.00 | 0.00 | 1.30 |
| Anhui | 0.38 | −0.12 | −0.05 | −0.96 | −1.31 | −0.12 | 0.12 | 0.07 | −2.96 | −0.73 | −0.57 |
| Sichuan | 0.45 | −0.13 | −0.49 | −0.26 | −0.53 | 0.13 | −0.66 | −0.08 | −0.38 | 0.89 | −0.11 |
| Tibet | 2.82 | 3.04 | 2.95 | 2.13 | 1.78 | 1.54 | 0.64 | 0.25 | −4.62 | −3.95 | 0.66 |
| Hebei | 4.72 | 3.20 | 2.53 | 0.45 | 0.00 | 2.97 | 1.06 | 2.55 | 3.82 | 0.00 | 2.13 |
| Gansu | 3.62 | 2.46 | 1.49 | 1.62 | 0.93 | 5.23 | 7.01 | 4.71 | 3.36 | 0.53 | 3.09 |
| Henan | 0.57 | −0.44 | −0.87 | −1.48 | 0.00 | −0.56 | −1.52 | −1.31 | 2.76 | 0.00 | −0.29 |
| Shanxi | 3.03 | 3.50 | 4.62 | 0.59 | 0.00 | 1.47 | 2.79 | 4.35 | −0.54 | 0.00 | 1.98 |
| Qinghai | 5.86 | 3.90 | 2.79 | 0.33 | 0.98 | 6.38 | 4.75 | 4.86 | 1.39 | 2.11 | 3.33 |
| Liaoning | 2.87 | 2.62 | 2.96 | 3.48 | 3.73 | 1.00 | 0.38 | 2.77 | 4.18 | 7.53 | 3.15 |
| Inner Mongolia | 10.07 | 8.32 | 7.51 | 4.92 | 0.00 | 7.83 | 7.88 | 11.65 | 12.48 | 0.00 | 7.07 |
| Jilin | 0.83 | 1.73 | 3.67 | 4.59 | 3.81 | −0.58 | −0.31 | 3.32 | 4.56 | 2.78 | 2.44 |
| Xinjiang | −0.63 | −0.78 | 0.33 | 2.22 | 2.75 | −1.64 | −0.85 | 1.11 | 4.39 | 4.54 | 1.14 |
| Heilongjiang | 1.69 | 6.00 | 9.33 | 7.71 | 6.12 | 0.71 | 4.68 | 9.42 | 7.56 | 14.13 | 6.74 |
Publisher’s Note: MDPI stays neutral with regard to jurisdictional claims in published maps and institutional affiliations. |
© 2021 by the authors. Licensee MDPI, Basel, Switzerland. This article is an open access article distributed under the terms and conditions of the Creative Commons Attribution (CC BY) license (https://creativecommons.org/licenses/by/4.0/).
Share and Cite
Chen, H.; Yang, J.; Ding, Y.; He, Q.; Ji, Q. Simulation of Daily Snow Depth Data in China Based on the NEX-GDDP. Water 2021, 13, 3599. https://doi.org/10.3390/w13243599
Chen H, Yang J, Ding Y, He Q, Ji Q. Simulation of Daily Snow Depth Data in China Based on the NEX-GDDP. Water. 2021; 13(24):3599. https://doi.org/10.3390/w13243599
Chicago/Turabian StyleChen, Hongju, Jianping Yang, Yongjian Ding, Qingshan He, and Qin Ji. 2021. "Simulation of Daily Snow Depth Data in China Based on the NEX-GDDP" Water 13, no. 24: 3599. https://doi.org/10.3390/w13243599
APA StyleChen, H., Yang, J., Ding, Y., He, Q., & Ji, Q. (2021). Simulation of Daily Snow Depth Data in China Based on the NEX-GDDP. Water, 13(24), 3599. https://doi.org/10.3390/w13243599