Article

Upstream Solutions to Downstream Problems: Investing in Rural Natural Infrastructure for Water Quality Improvement and Flood Risk Mitigation

by
Kelly M. Suttles
1,*,
Alison J. Eagle
1 and
Eileen L. McLellan
2
1
Environmental Defense Fund, Raleigh, NC 27607, USA
2
Environmental Defense Fund, Washington, DC 20009, USA
*
Author to whom correspondence should be addressed.
Water 2021, 13(24), 3579; https://doi.org/10.3390/w13243579
Submission received: 29 October 2021 / Revised: 3 December 2021 / Accepted: 6 December 2021 / Published: 14 December 2021
(This article belongs to the Section Water, Agriculture and Aquaculture)

Abstract

:
Communities across the globe are experiencing degraded water quality as well as inland flooding, and these problems are anticipated to worsen with climate change. We review the evidence that implementing natural infrastructure in upstream agricultural landscapes could improve water quality and reduce flood risk for downstream communities. Based on our analysis, we identify a suite of natural infrastructure measures that provide the greatest benefits, and which could be prioritized for investment by downstream communities and regional leadership, with an emphasis on systems that minimize loss of productive agricultural land. Our results suggest that the restoration of wetlands and floodplains are likely to provide the greatest benefits for both water quality improvement and flood risk reduction.

1. Introduction

Water quality impairment and inland flooding are multi-billion-dollar problems that are expected to worsen in response to climate change. The World Resources Institute estimated that the number of people worldwide impacted per year by riverine flooding events will more than double from 2010 (65 million) to 2030 (132 million [1]). Likewise, the annual costs of flooding in riverine urban areas are expected to more than triple, from USD 157 billion in 2020 to USD 535 billion by 2050 [1]. A separate study estimated that using natural infrastructure to protect against climate change threats, such as flooding, could save USD 248 billion at a cost of only half that of equivalent grey infrastructure [2]. Meanwhile, agriculture globally is the largest contributor to water pollution, causing damage to ecosystems and human health and costing billions of dollars annually [3]. In the U.S.A. alone, nitrogen losses from agriculture to surface and groundwater are in excess of USD 150 billion per year [4].
In this paper, we review the opportunity for the use of natural infrastructure in rural landscapes to provide water quality and flood mitigation benefits for downstream communities. We define “natural infrastructure” as:
Durable structural and/or native perennial vegetative measures embedded in a landscape or riverscape that are inspired and supported by nature, restore ecological processes, and deliver multiple environmental benefits to downstream communities.
We use the term “natural infrastructure” rather than “nature-based solutions” or “natural flood management” because our primary focus is on ecosystem services—water quality and flow regulation—that have traditionally been delivered through heavily engineered “grey infrastructure,” which attempts to control, rather than work with nature. We expand the definition of natural infrastructure beyond structural measures in order to capture the multiple environmental benefits to downstream communities of converting annual cropland to native perennial vegetation. Our emphasis on perennial vegetation, with its implications of longevity, excludes annual measures such as cover crops that are part of a farmer’s crop rotation.
While some of the natural infrastructure measures that we describe share similarities in terms of ecological processes with plot- and local-scale “green infrastructure” measures used in urban landscapes [5], our context—the rural landscape and the ditches, streams and rivers that flow through it—is quite different. In addition, where much urban “green infrastructure” has necessarily been developed at the site scale in response to parcel-by-parcel urban development, we emphasize using natural infrastructure as part of a strategic and systemic approach to planning at the watershed scale. Watershed-scale design is critical to respond to the interests of multiple stakeholders and to account for both synergies and trade-offs across multiple ecosystem services [6]. Likewise, while there is a growing body of literature describing the potential role of natural infrastructure in mitigating storm surge and sea level rise in coastal areas (e.g., [7,8]), there has been much less discussion of its role in mitigating pluvial and overbank flooding in inland areas, which is our focus.
Our emphasis is on natural infrastructure (NI) measures within rural landscapes that promote both the storage and slow release of water and the physical, chemical and biological processes that remove or transform waterborne pollutants. From a flood mitigation perspective, NI includes a range of interventions that: (i) reduce runoff generation, (ii) increase water storage, and/or (iii) attenuate flow from hillslopes to small streams and within the larger hydrologic network (e.g., by disconnecting runoff channels or by increasing channel roughness). These same physical modifications to hydrologic flows are likely to be effective in mitigating particulate pollutants such as phosphorus and sediment which largely follow surface flow paths. For removing dissolved pollutants such as nitrate, however, additional biochemical processes such as denitrification are required. Where dissolved pollutants are challenging, NI measures may only be effective for water quality improvement if they create the appropriate biogeochemical environment—for nitrate, this typically means multi-day residence times under reducing conditions in the presence of a carbon-rich substrate. Thus, NI measures suitable for flood mitigation may or may not provide water quality benefits. Likewise, NI measures that create an appropriate biogeochemical environment for pollution treatment may or may not provide flood mitigation benefit, depending on whether they also store water and delay its release downstream. For our review of water quality impacts, we chose to focus on nitrogen because of its impacts on both ecosystem and human health, for example, the degradation of drinking water. Furthermore, N is more important for ocean estuary degradation, while P is more important for freshwater body degradation [9].
While some types of NI, such as wetlands, have been identified as potential solutions to water quality problems in agricultural landscapes (e.g., [10]), there has been less discussion of the potential role of such measures in flood mitigation. While there has been growing interest in “natural flood management” in the U.K. and Europe, little of this work has addressed the associated water quality benefits (see [11,12] for examples wherein both concerns are addressed). As a result, downstream communities—which often experience both water quality and flooding problems—lack information on how NI can be used to address both issues. Our paper is intended to help fill this information gap.
Our review was guided by our experience in the Mississippi River Basin (MRB) of the central U.S.A., where downstream communities are impacted by both water quality degradation and more frequent and severe flooding. Agricultural intensification (including changes in land use, artificial drainage and nutrient additions) as well as climate change [13,14,15] have contributed to increased flooding [16] and increased harmful algal blooms [17]. Agriculture is extremely important in the MRB, with over two thirds of the region’s land identified as farmland [18], and the region’s economy contributes to 18% of the U.S. gross domestic product [16]. While these water quality and flooding problems are not unique to the MRB, the region’s role as a major global exporter of corn, soybeans and wheat creates the potential for tension over land use, with agricultural producers concerned about any loss of productive cropland. An as-yet unanswered question is how much cropland would need to be converted to natural infrastructure to achieve regional goals related to water quality improvement and flood risk reduction. With this in mind, our review places particular emphasis on identifying those NI measures that could deliver the greatest environmental benefit with little or no cropland conversion.
We reviewed scientific literature describing the use of NI in agricultural landscapes in North America, Europe and the U.K., compiling data on (i) the effectiveness of these measures in improving water quality and/or mitigating floods and (ii) the strength of the evidence for such benefits. Based on our review, we identify a suite of NI measures that, if implemented in a strategic and systemic approach, can deliver both water quality and flood mitigation benefits while minimizing the loss of productive agricultural land.

2. Materials and Methods

We conducted a search of peer-reviewed papers in Google Scholar dating from 2000 to 2020 using the following search terms, individually and in combination: [agricultural land use conversion, agricultural landscapes, alluvial forest restoration, backwater reconnection, bottomland hardwoods, constructed wetlands, depressional wetlands, detention ponds, engineered wetlands, farm ponds, flood attenuation, flood mitigation, floodplain, floodplain forest restoration, floodplain restoration, flood risk reduction, flooding, leaky barriers, levee removal, levee setback, natural flood management, natural flood management measures, natural infrastructure, nitrogen removal, nutrient retention, offline ponds, overland flow interception, oxbow reconnection/restoration, perennial vegetation, prairie pot-hole wetlands, re-meandering the river, retention ponds, riparian buffers, riparian wetlands, riparian forested wetlands, river restoration, runoff attenuation features, saturated buffers, two-stage ditches/channels, vegetated ditches, water quality, wetland restoration]. Occasionally, we found fewer than 2 papers for a specific NI measure in the specified time frame. In those cases (riparian forest buffers and farm ponds), we expanded the search to include any time period. In addition, we used a snowball technique of manually tracing references and citations from recent papers. Our search retrieved a total of 145 papers for further review.
Subsequently, we screened these papers to identify those reporting on NI measures in temperate climates (North America, Europe and the U.K.), as this is where most of the work on NI measures has been carried out, and to ensure that results could be more easily compared across studies. For some NI measures, there is little-to-no research in North America, and the European/U.K. literature was more robust, or vice versa. For water quality, we selected only those studies reporting actual field measurements, and further narrowed our selection to those papers reporting results on nitrogen (N) because N impacts downstream communities in a variety of ways (e.g., contaminated drinking water and toxic algal blooms). In contrast, since the flood mitigation literature is dominated by studies reporting model simulations, we included model-based studies as well as those reporting results.
Scientists have used a wide variety of metrics to report the benefits of NI measures (see Table 1). Given our interest in minimizing the area footprint of new NI, we looked for studies reporting NI performance using area-based units. For water quality, we therefore selected studies reporting the reduction of nitrogen load per area (kg N ha−1) for a given time period. This metric was used in 38 studies covering 15 different NI measures. Unfortunately, there is no comparable area-based metric that is commonly used to report on flood risk reduction. We chose the percentage reduction in flood peak because it appeared to be the most commonly used metric in the literature and would therefore enable us to compare a wide variety of NI measures. Recognizing that flood mitigation performance data were drawn from studies covering a wide range of storm and watershed sizes, both of which might be expected to influence performance, we also compiled data on these factors where available.
The selection process resulted in a total of 46 papers suitable for in-depth review and data extraction. To compare the performance of various NI measures, we developed a scoring rubric as follows (see also Table 2 and Figure 1): We characterized the strength of the evidence for water quality improvement or flood risk reduction based on the number of peer-reviewed articles we could find where a given NI measure showed positive impacts: One, Few, or Many. “Few” was defined as two articles and “Many” was defined as three or more. To account for the effectiveness of a given NI measure in improving water quality or reducing flood risk, we categorized impacts as Low, Medium and High. For water quality, we characterized those NI measures that delivered nitrogen reductions of less than 500 kg N ha−1 yr−1 as “Low” impact, while measures delivering 500–1000 kg N ha−1 yr−1 were designated as “Medium” impact, and measures that delivered greater than 1000 kg N ha−1 yr−1 were characterized as “High” impact. For flood reductions, impacts were scored as “Low” for peak flow reductions less than 15%, “Medium” for reductions of 15–25%, and “High” for reductions above 25%. As we are not aware of any absolute levels of flood mitigation or nitrogen reduction that would be considered “good” or “beneficial,” we chose to compare the measures relative to each other rather than an external standard. We chose these thresholds based on the range of values in the data for a roughly even distribution of measures in each category. Figure 1 shows that we considered NI measures categorized as “Many” for evidence and “High” for impact as “High” priorities for implementation, whereas we would consider those categorized as “Few; High” and “Many; Medium” as “Medium” priorities for implementation.

3. Results

3.1. Types of NI Measures in Agricultural Landscapes

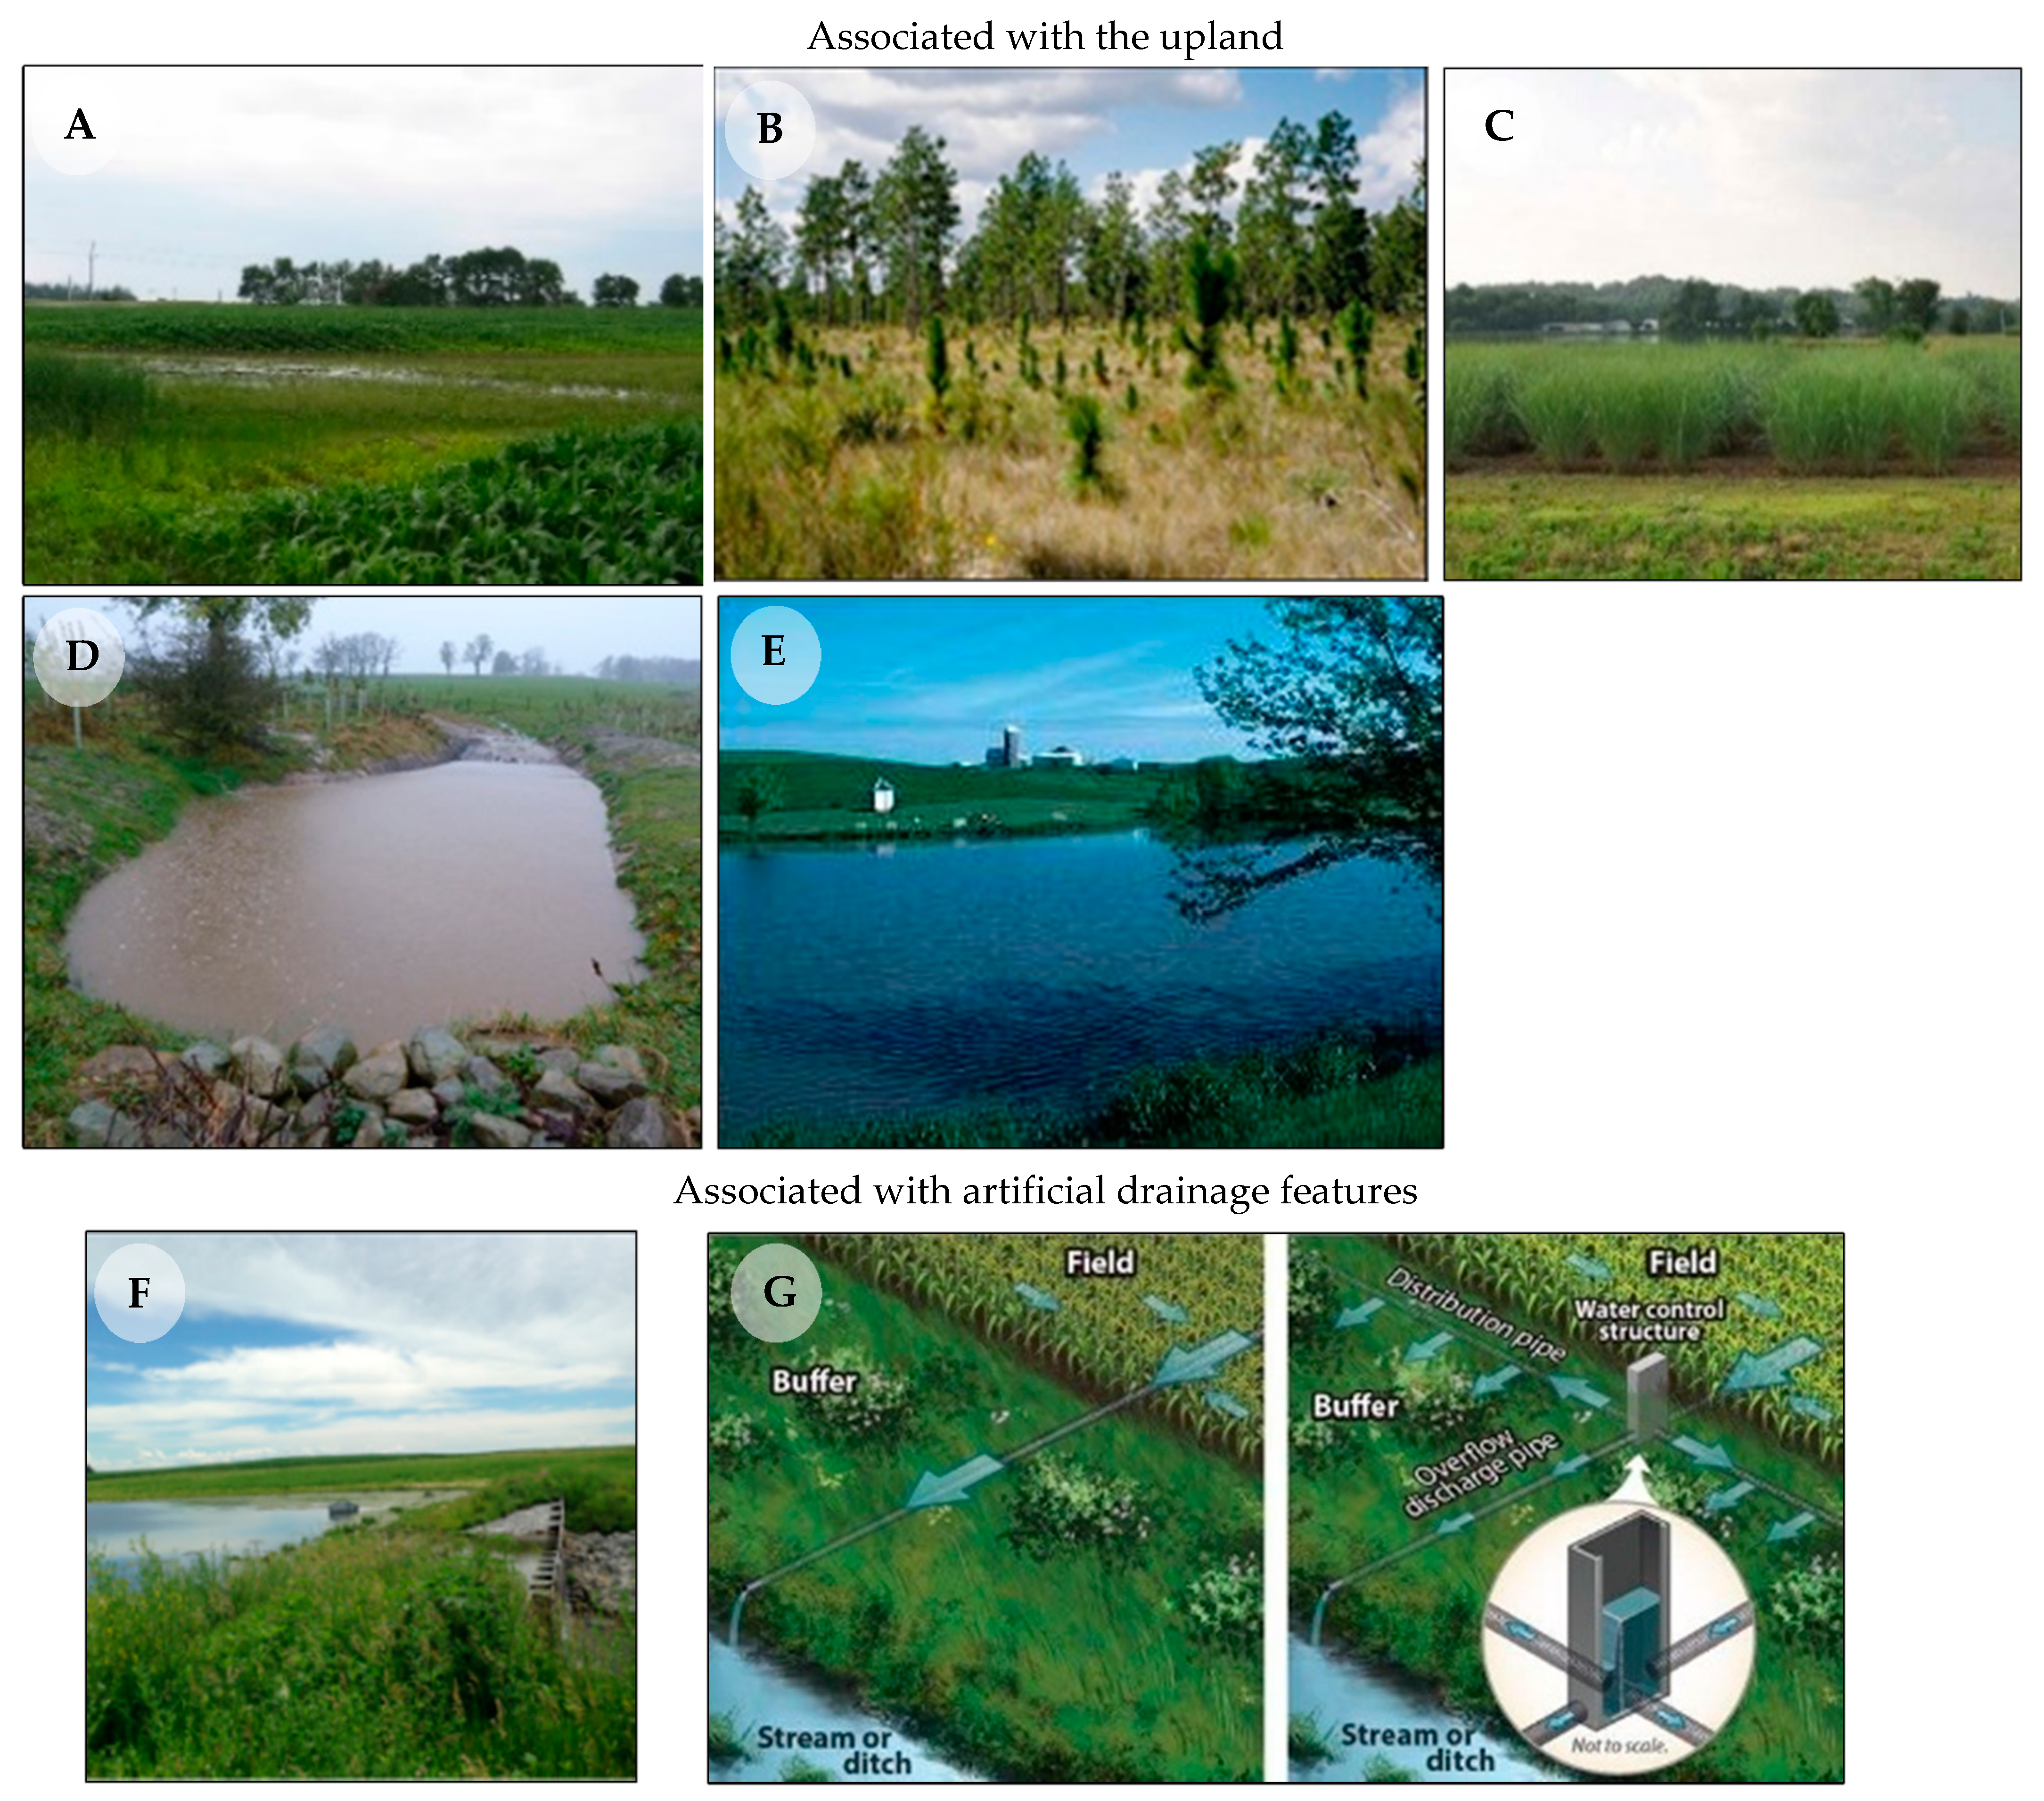
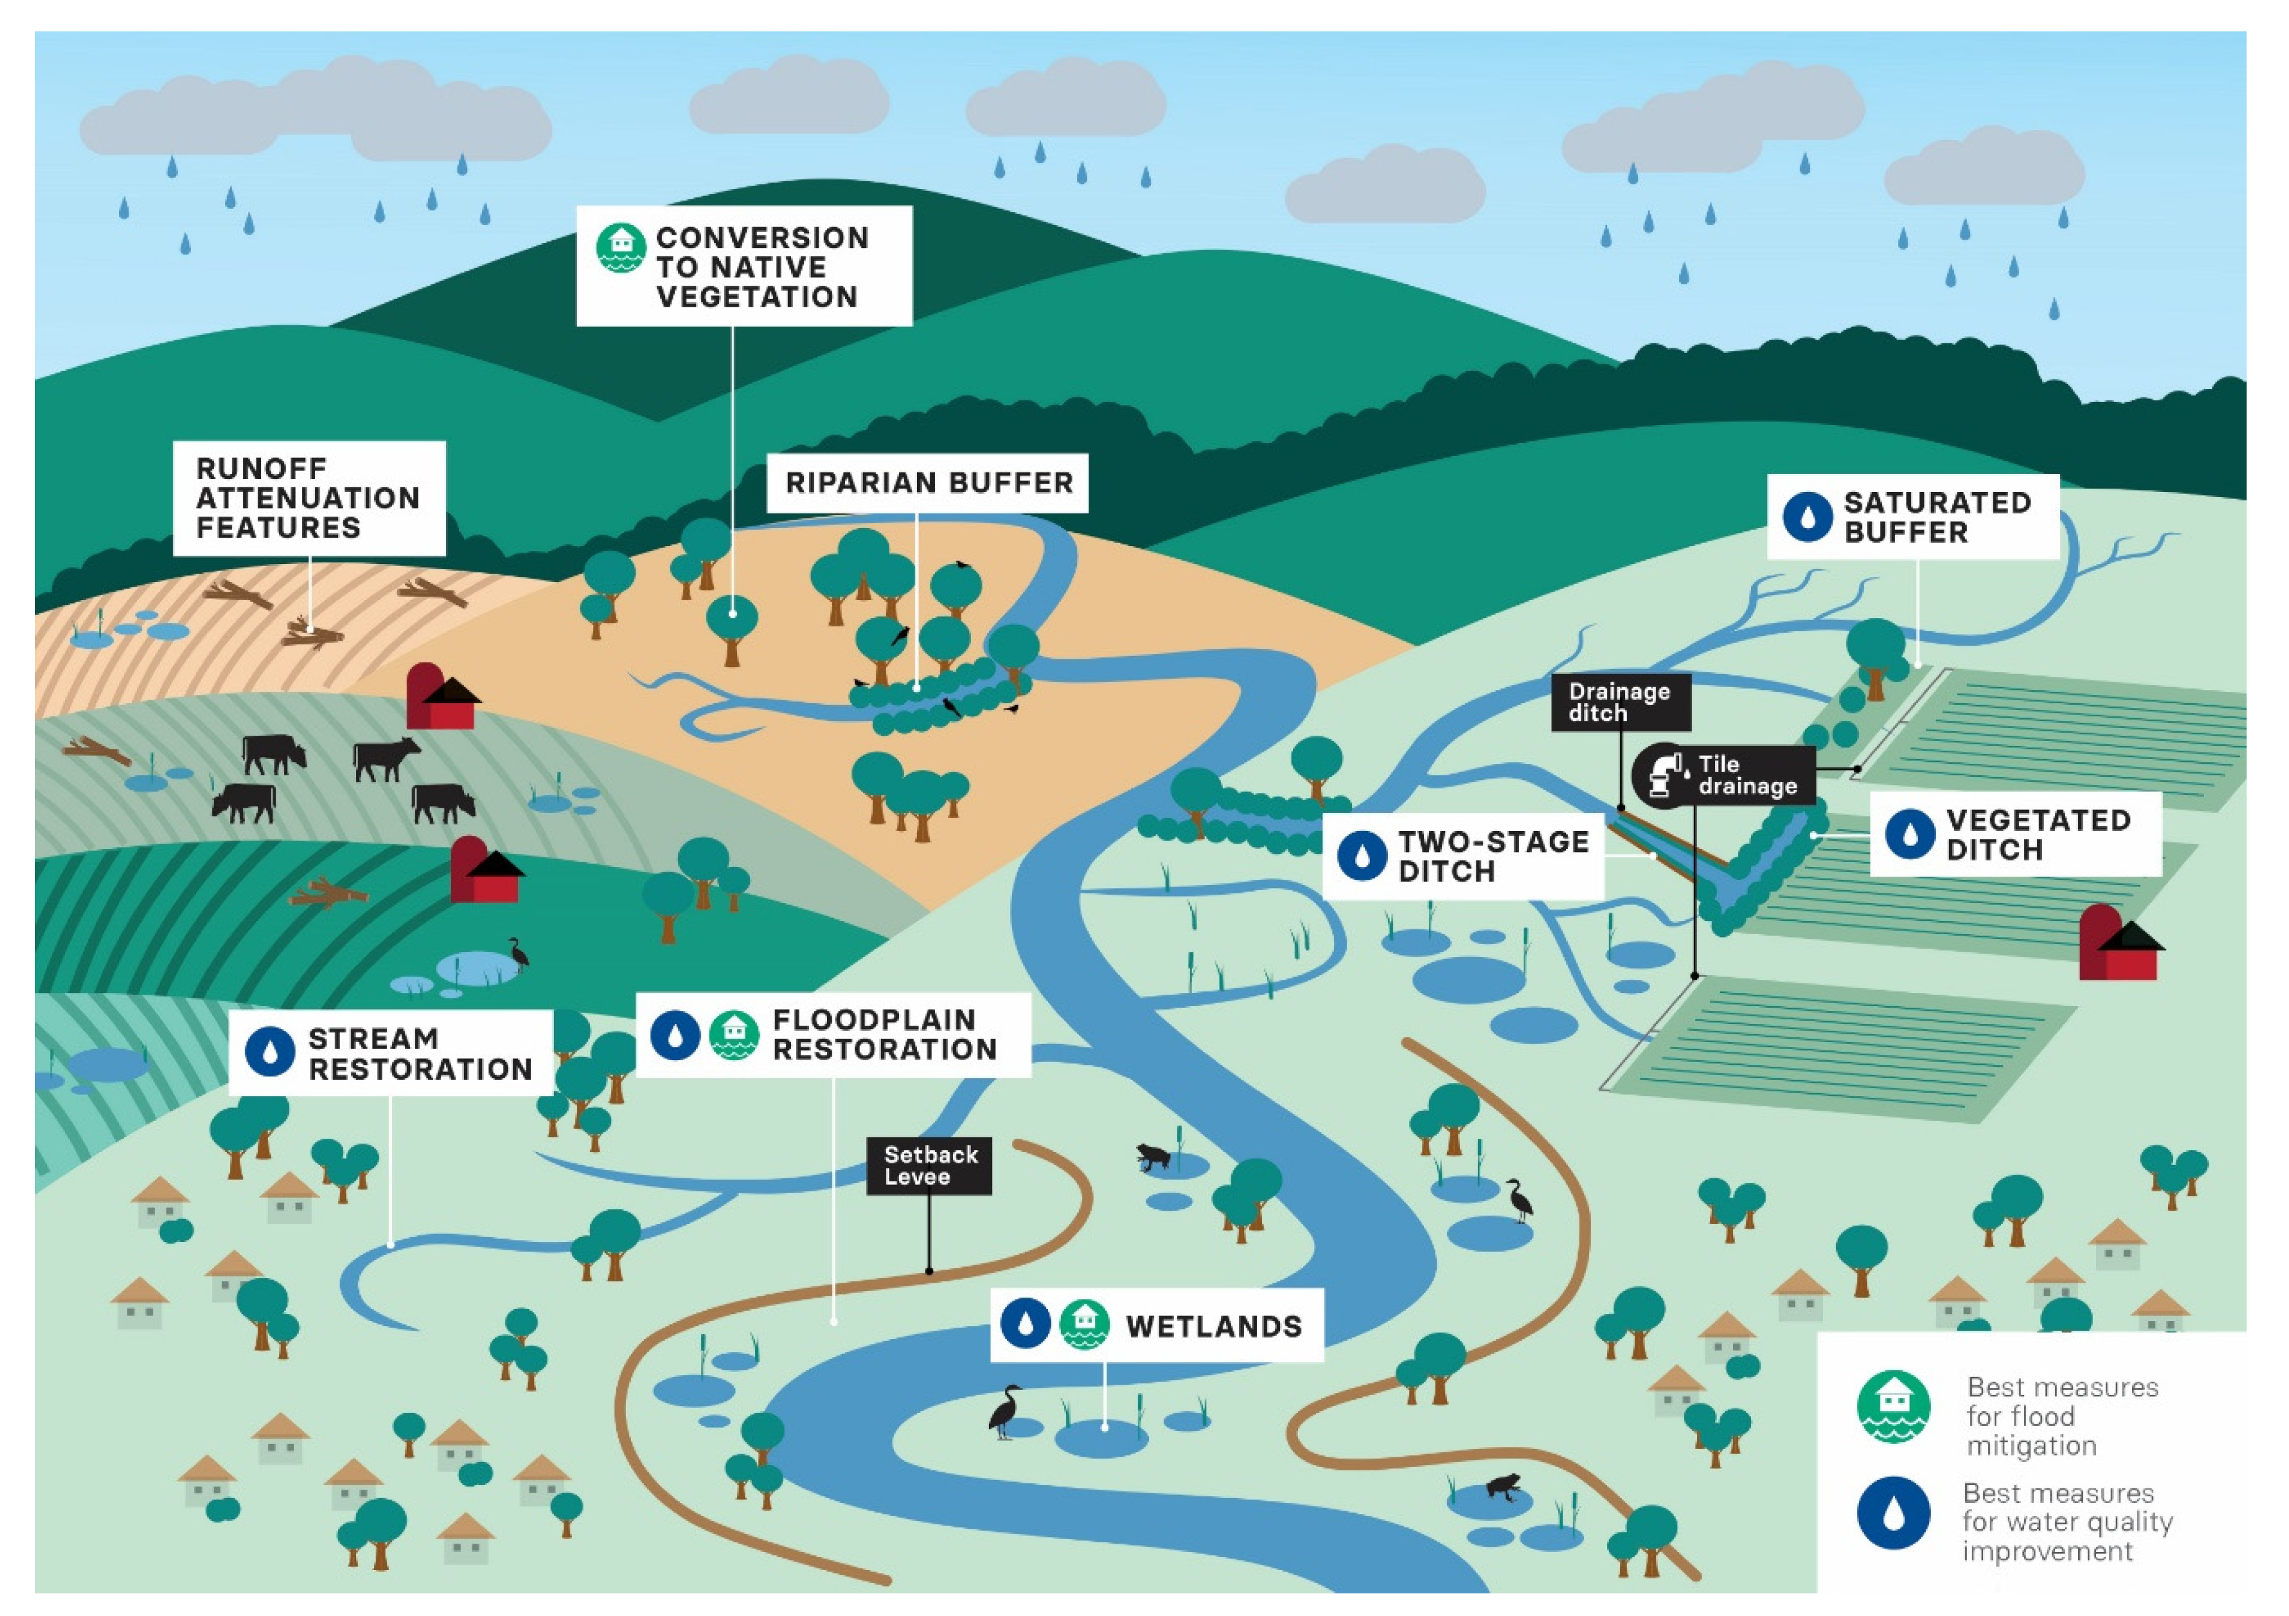
Categorization of NI by Landscape Position

We categorized NI measures according to their position on a landscape continuum from the topographically highest to the lowest point in a hypothetical small (~10,000 ha) watershed. We chose this scale because it allowed us to consider an array of NI measures from those topographically above zero- and first-order drainageways to those associated with medium and large rivers. We categorized NI measures by their landscape positions as follows:
  • Associated with the upland (topographically above a zero- or first-order stream, not in the vicinity of a stream or drainage ditch)
  • Associated with artificial drainage structures (topographically above a zero- or first-order stream, hydrologically connected to such a stream by artificial drainage structures)
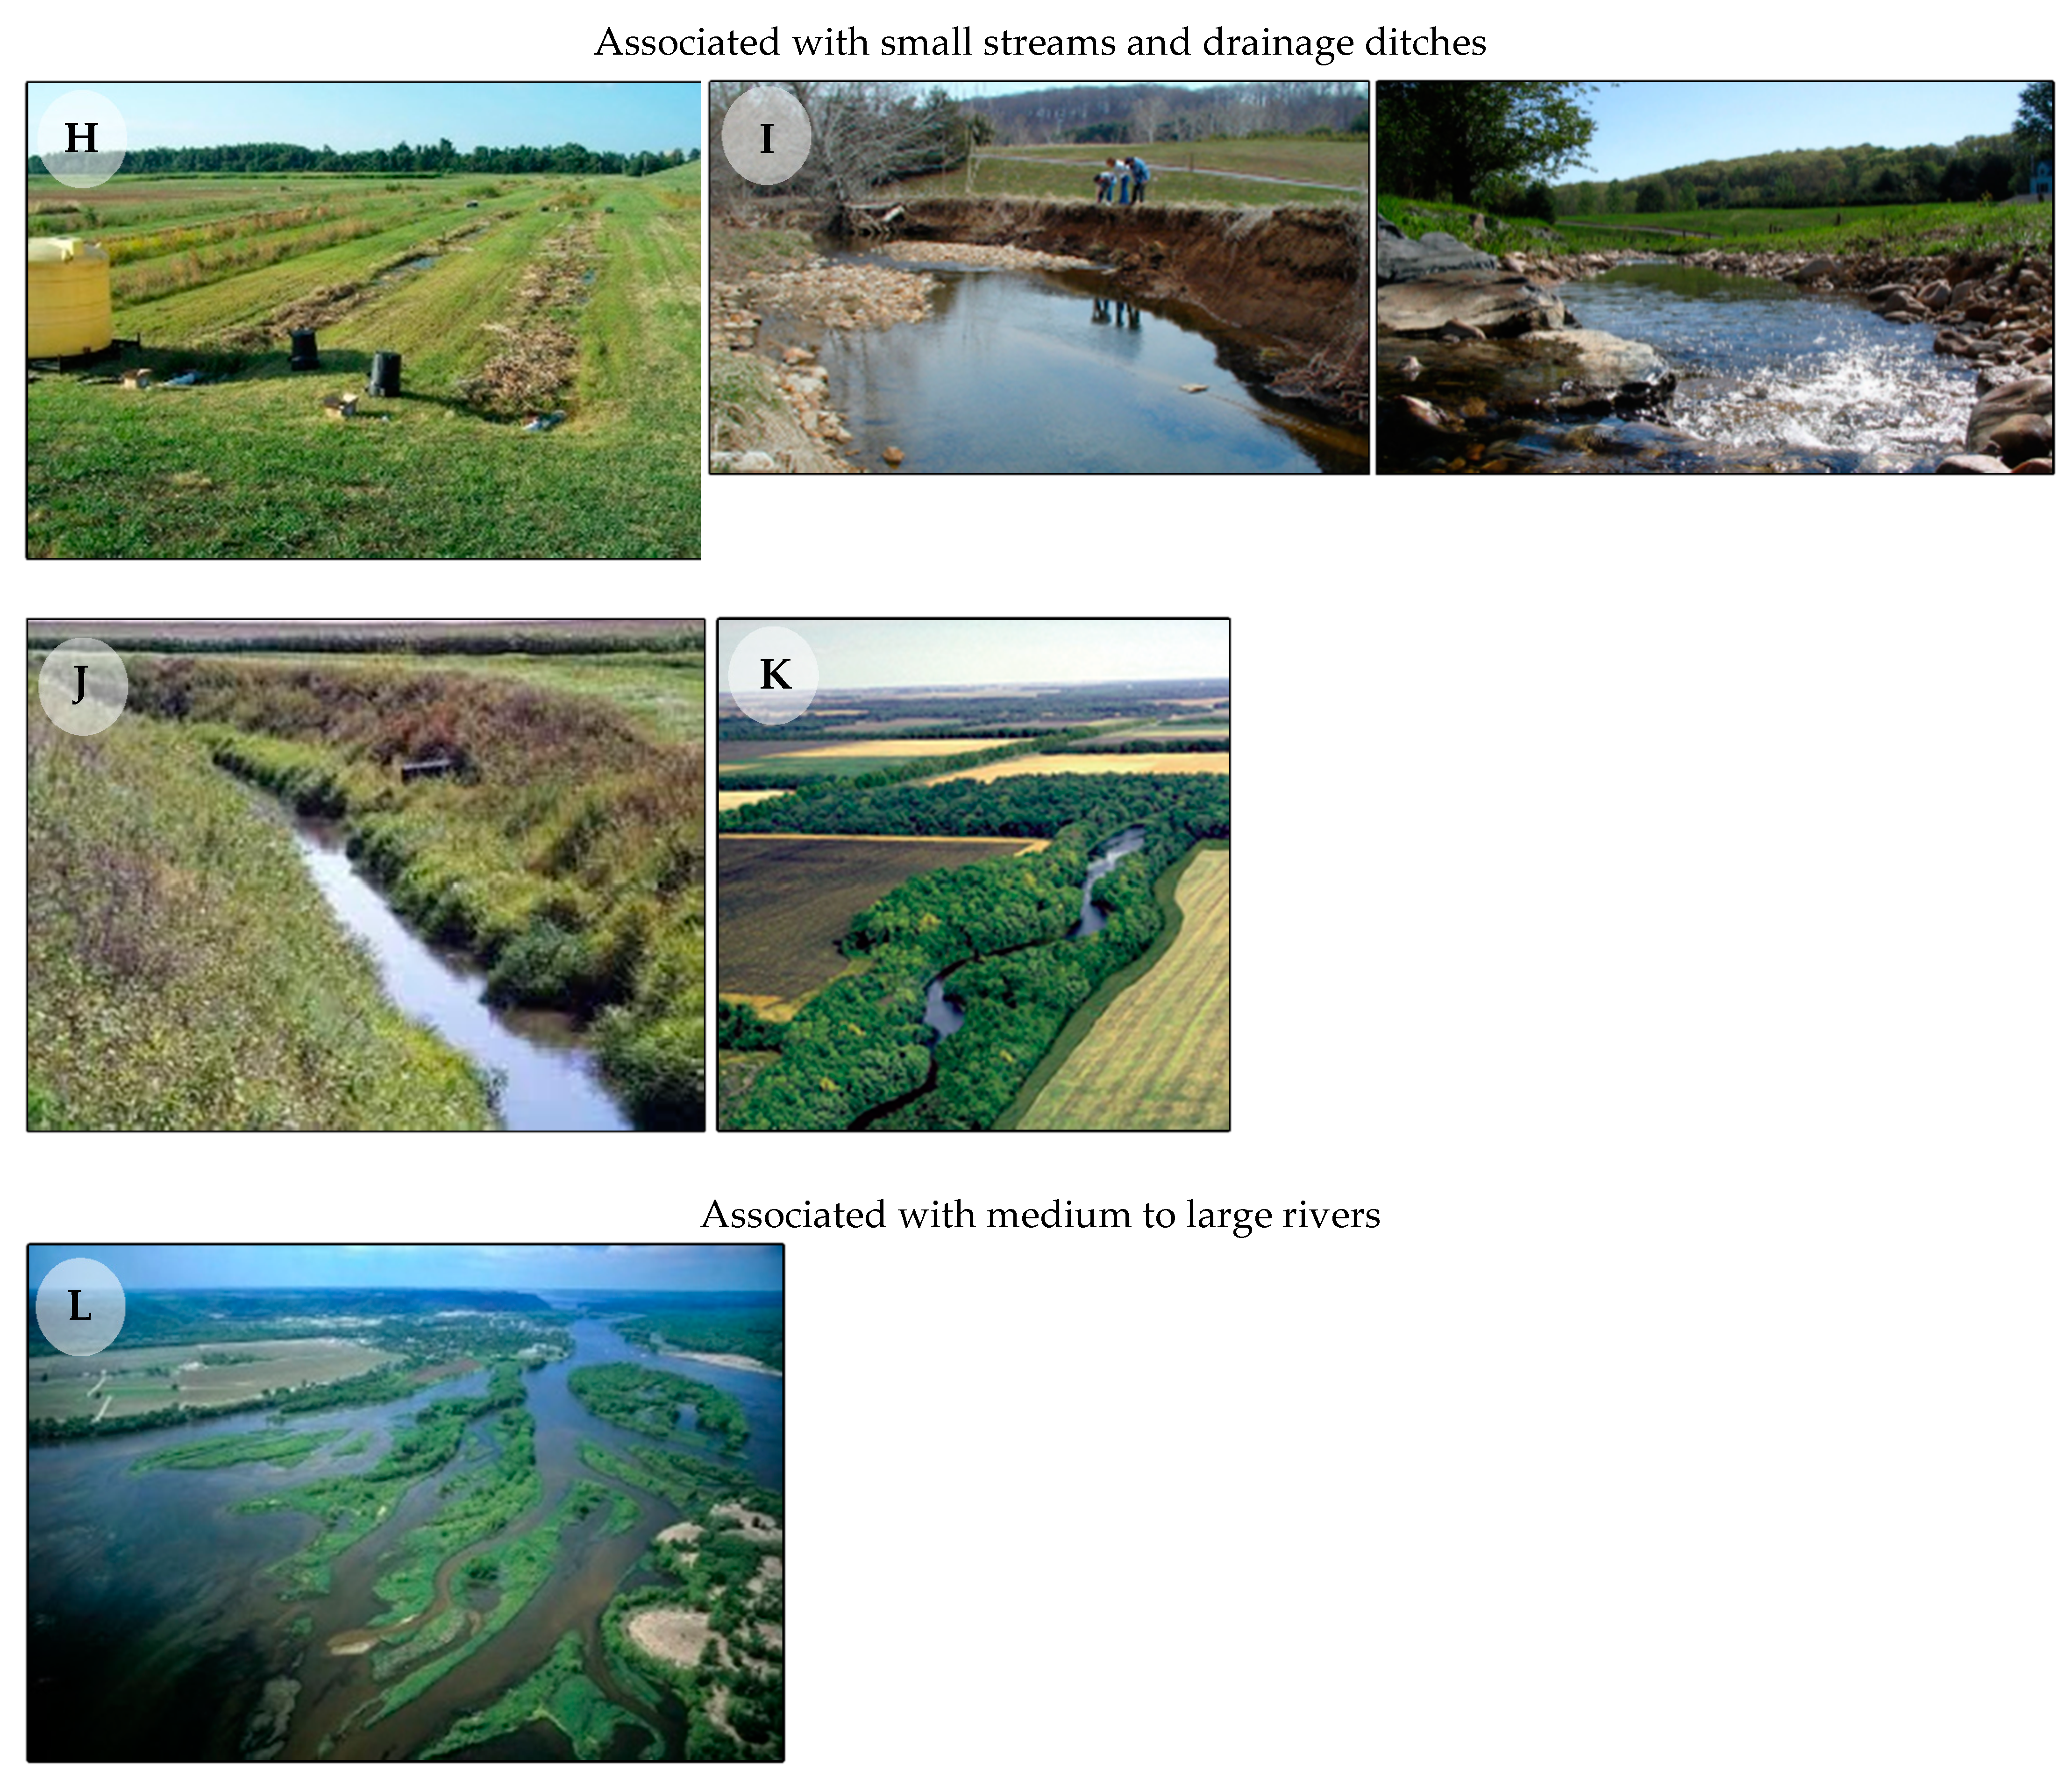
  • Associated with small (first—third order) streams, also with drainage ditches resulting from modification of such streams
  • Associated with medium and large (fourth—seventh order) rivers
Recognizing that artificial drainage structures (e.g., tile drains in agricultural landscapes, grips in high-altitude peatlands in the UK) have modified hydrology to a significant extent in many rural landscapes, we thought it was useful to include a specific category for NI measures that are used to treat such drainage structures.
We identified 11 distinct categories of NI measures (Table 3) based on their landscape position and design features. Examples of each category are shown in Figure 2.

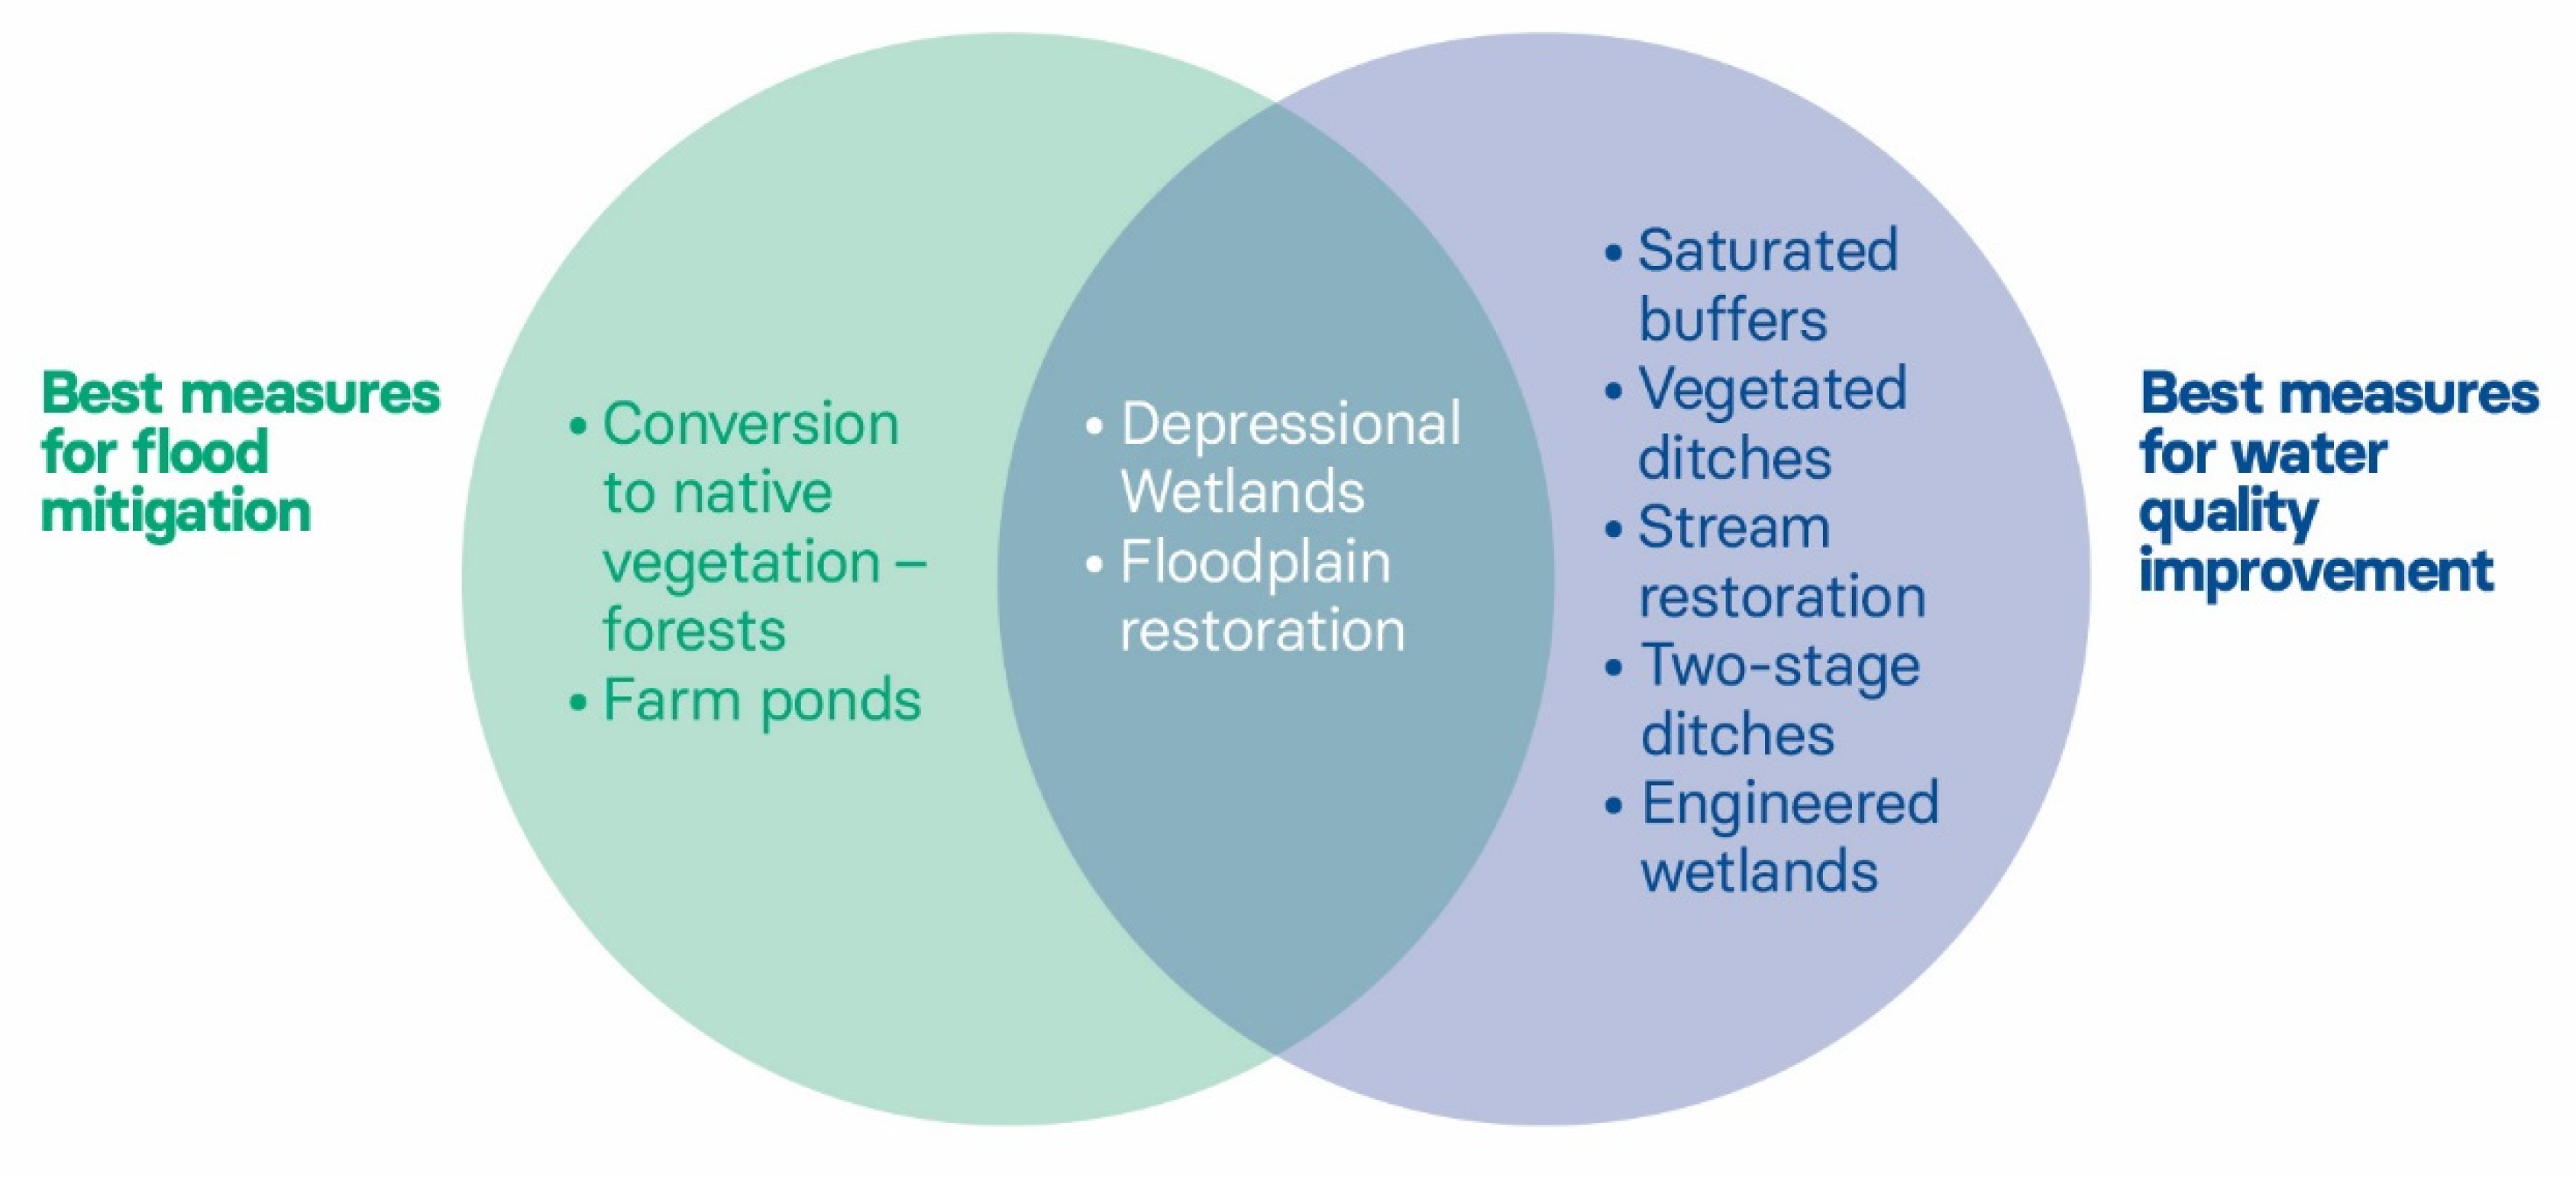
3.2. Water Quality Benefits of NI Measures

For each type of NI measure, we categorized the water quality benefit (reported as areal uptake of nitrogen load) and the strength of the evidence for that benefit as described in the Materials and Methods section. Table 4 shows the average and range of water quality improvement results. The average of all reported results was used to rank all measures for water quality effectiveness except for farm ponds. The range noted for farm ponds is extremely variable and there were not any other published articles for comparison, so we chose not to use the average and ranked it as “Medium.”
There has been extensive research into the role of NI in improving water quality, so most of the NI measures scored highly for strength of evidence. In terms of effectiveness (nitrogen removal), measures associated with restoring the hydrologic and biogeochemical functioning of ditches (two-stage ditches, vegetated ditches), wetlands (depressional and engineered), riparian areas (saturated buffers) and streams or rivers (stream restoration, floodplain restoration) scored Medium or High. Somewhat surprisingly, riparian forest buffers and conversion of cropland to native vegetation (forest or grasses) received only Low scores for measure effectiveness.

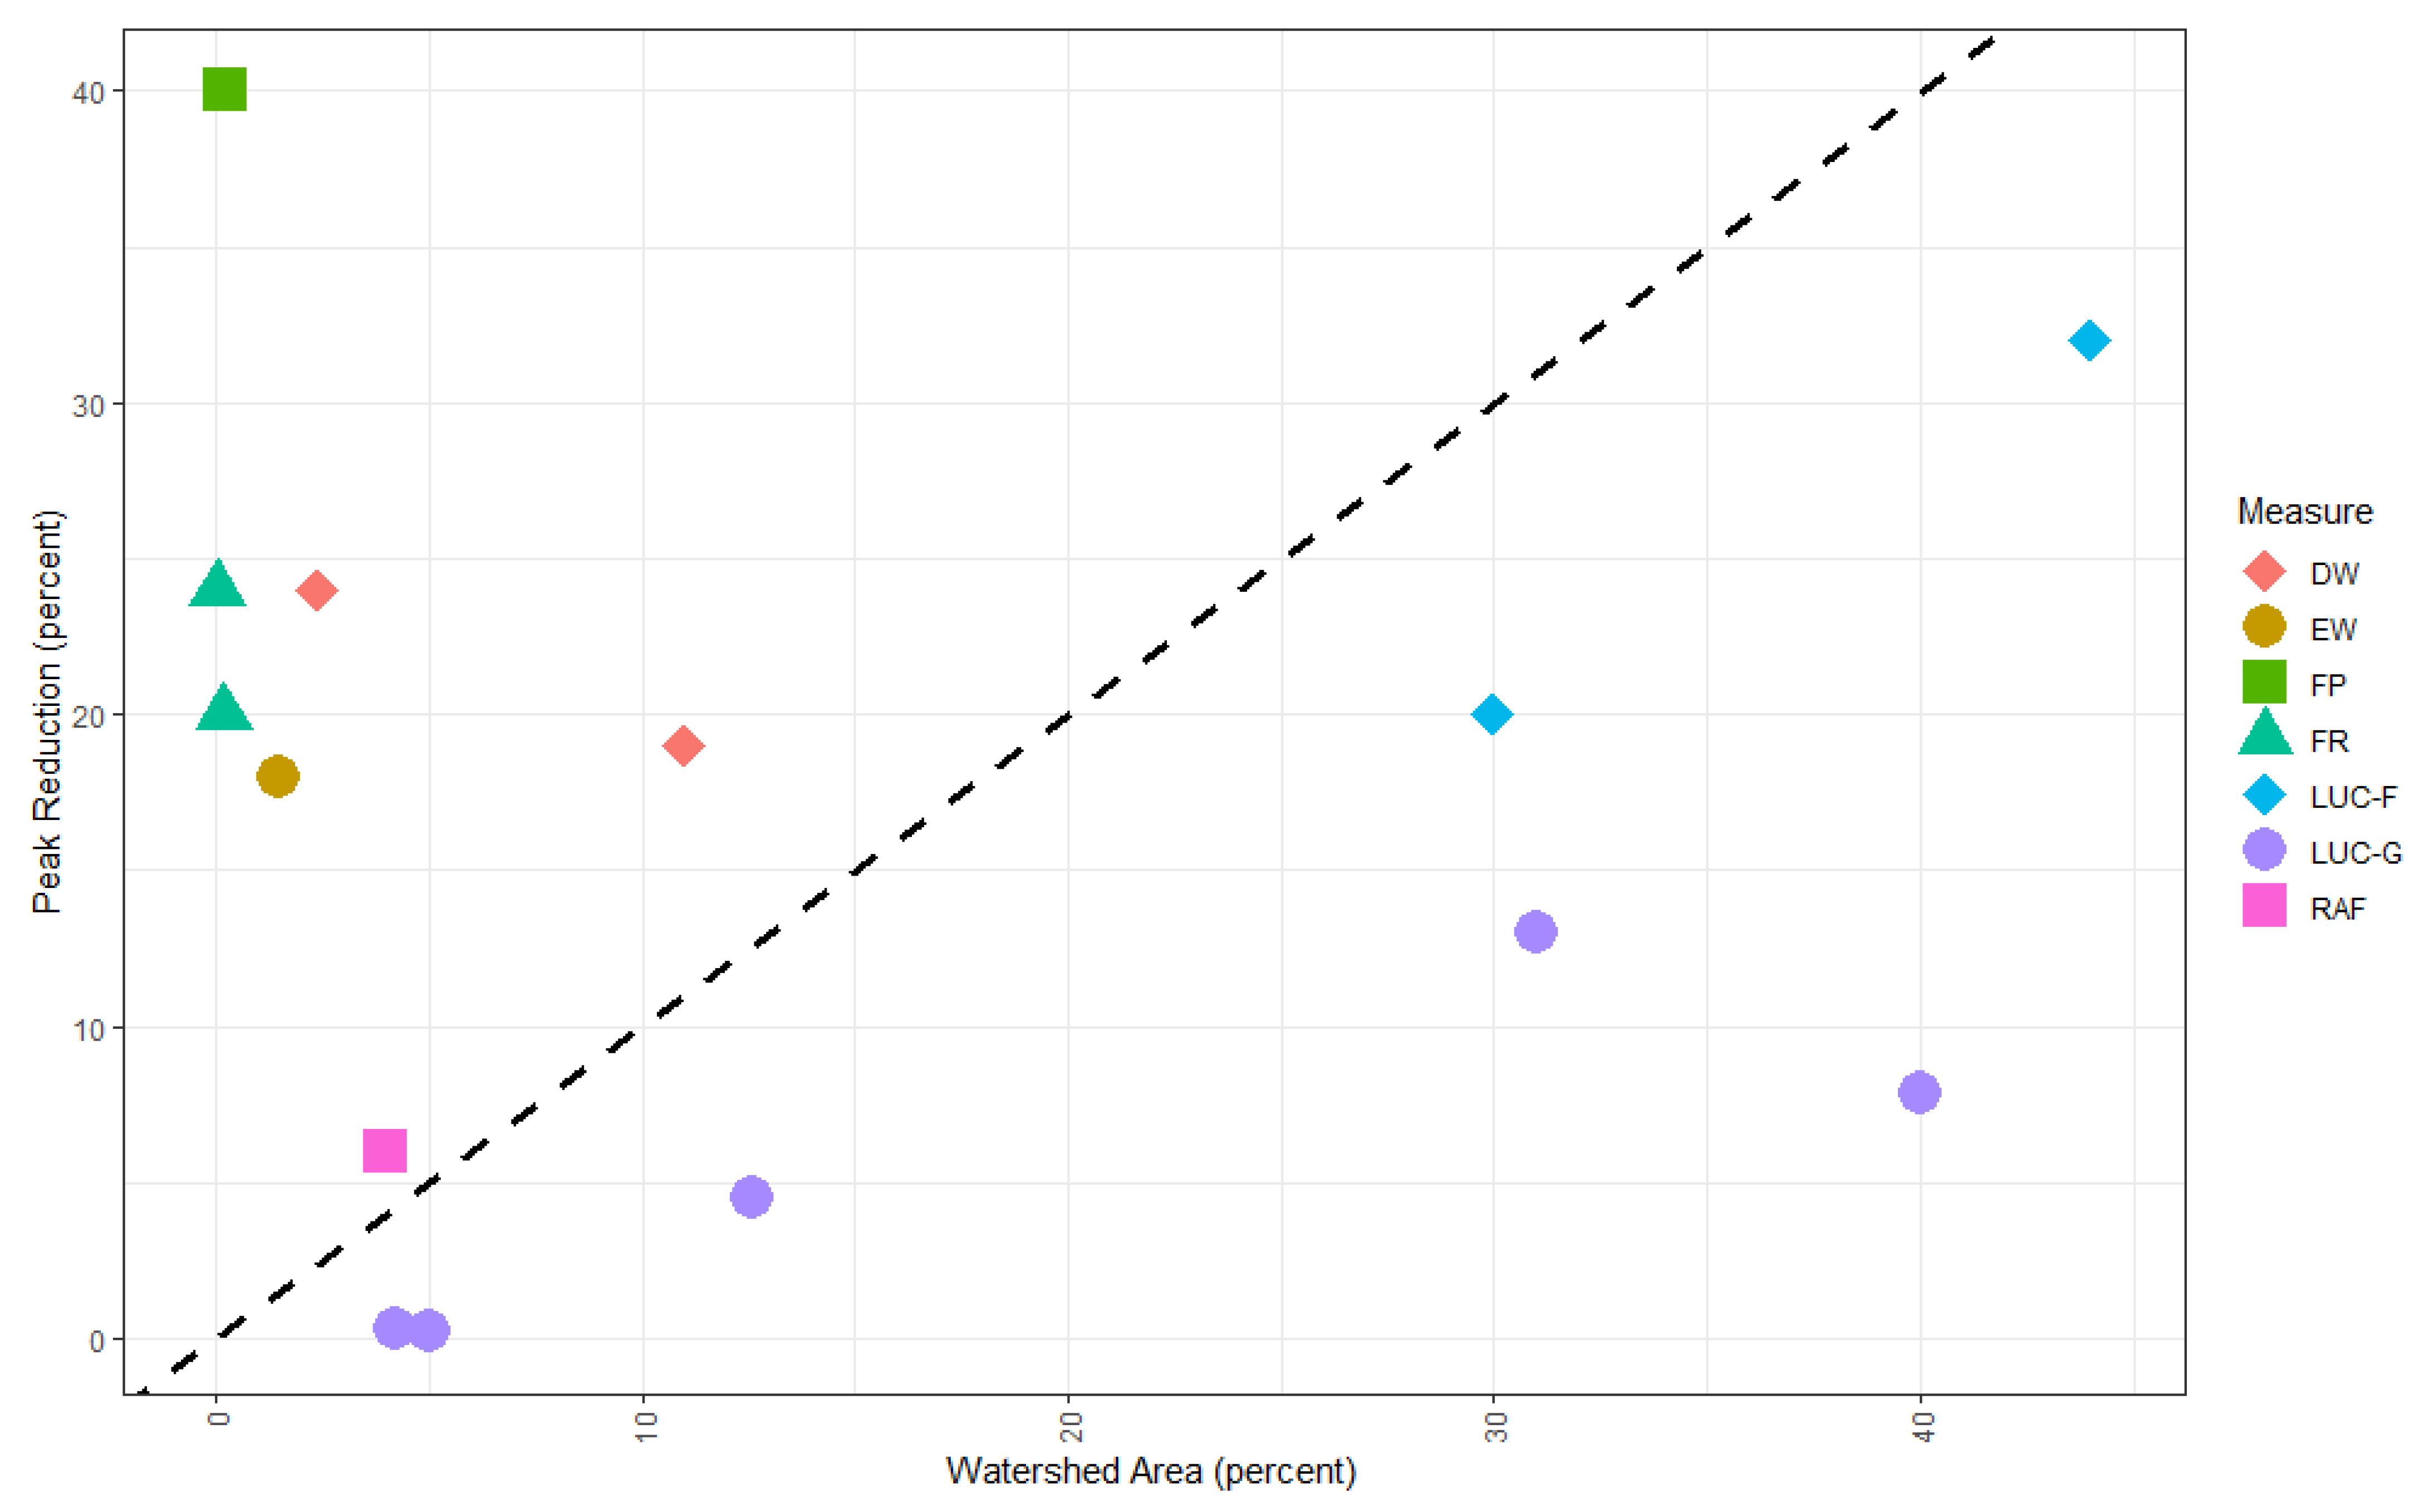
3.3. Flood Mitigation Benefits of Natural Infrastructure Measures

For each NI measure, we categorized the flood reduction benefit and the strength of the evidence for that benefit as described in Materials and Methods. Table 4 shows for each measure the average and range of flood mitigation improvement. The average reported here for runoff attenuation features may appear artificially low because one study only reported maximum and median peak flow reduction values and did not report minimum values. We only included the median values in our average for runoff attenuation features, while for other measures, we were able to include both minimum and maximum reported values in the averages.
Table 4 also includes data on the associated watershed sizes and storm sizes if either were reported. Many studies use average recurrence intervals (e.g., 100-year storm) for storm size, but we converted everything to annual exceedance probability (AEP), which is the probability that peak flow will be exceeded in one year. The 10-year and 5-year storm were approximated to 10% AEP and 20% AEP, respectively, and 1% and 2% AEP are equivalent to the 100-year and 50-year storm, respectively. We prefer to use AEP because average recurrence intervals are confusing to non-hydrologists. Recurrence intervals are often misinterpreted to mean that the size of storm indicated can only happen once in that time interval (e.g., once every 100 years). Instead, using an AEP makes it clear that the storm size is reported as an annual probability.
Only four NI measures have both a strong evidence base and deliver Medium-to-High impacts for flood mitigation: depressional wetland restoration, conversion of cropland to native vegetation—forest, farm ponds, and floodplain restoration. Some NI measures such as two-stage ditches have design features that potentially provide water storage and flow attenuation yet did not score highly in our review. In the case of two-stage ditches, research has focused on their water quality benefits rather than their flood mitigation potential.
Just as with water quality, we were interested in understanding the areal extent of NI measures needed to achieve flood mitigation benefits. To assess this, and lacking an area-based performance metric, we used an alternative approach: scaling the reported effectiveness of the measure to the areal extent of the measure in the watershed. For those studies (18 out of 32; all modeled) that reported both the areal extent of the measure and the area of the watershed, we calculated the percentage of the watershed area used for measure implementation and plotted it against the percentage reduction in peak flows (Figure 3). From this limited dataset, we can see that conversion of cropland to native vegetation (either grasses or forests) falls below the 1:1 line (shown by a dashed black line). In contrast, floodplain restoration, wetlands, farm ponds, and runoff attenuation features all plot above the 1:1 line in Figure 3, suggesting that they provide flood risk reduction benefits that are disproportionately larger than their areal extent. These measures appear to be capable of reducing peak flows by 10%–40% while requiring the conversion of limited amounts of agricultural land (i.e., 4% or less of agricultural land in a watershed).

4. Discussion

4.1. NI Performance and Comparison with Other Studies

Overall, it is clear that the water quality benefits of NI have been studied much more extensively than the flood reduction benefits. In part because of this asymmetry in the published literature, we found it much easier to identify NI measures beneficial for water quality improvement than to identify those best suited to flood mitigation. In addition, most NI measures have been studied for only one benefit (water quality improvement or flood mitigation) even when they are designed in a way that suggests they could provide both benefits (e.g., two-stage ditches). This makes it difficult to identify NI measures that deliver joint benefits for water quality and flood mitigation.
Table 4 suggests that, when NI performance for water quality improvement (N removal) is assessed using an area-based metric (kg N ha−1 yr−1), a variety of measures associated with wetlands, ditches, streams and rivers can perform well. This aligns with other studies reporting that wetlands (both depressional and engineered) and floodplains can play a valuable role in improving water quality (e.g., [65,66,67]). Our analysis suggests that innovative NI measures such as vegetated ditches, two-stage ditches and stream restoration are also valuable for improving water quality; however, there is far less published data on these practices and further research into their benefits will be important. Surprisingly, riparian forest buffers—which have been reported to be very effective in improving water quality (e.g., [68,69])—do not rank highly when assessed using our area-based metric. We therefore recommend additional studies of riparian buffers with an emphasis on reporting results in terms of N removed (kg N ha−1 yr−1). Although it is common practice to report the water quality performance of NI measures in terms of percentage reductions in concentrations or loads [69], such metrics may be less useful to policymakers who are usually concerned with absolute (rather than relative) improvement in water quality, and need to consider broader aspects of NI implementation, such as implications for land use.
Flood reduction benefits are reported with a wide variety of metrics, which makes it difficult to compare performance across measures. In part, the variety of metrics may reflect the reliance on model simulation, rather than field data collection, to evaluate the impacts of NI on flooding. Measures such as wetlands and riparian buffers are most commonly represented within watershed (hydrologic) models, whereas measures such as ditches and floodplains are more commonly simulated in hydraulic models, both of which report flood-relevant outcomes in very different ways (e.g., percent reduction in peak flows for hydrologic models vs. reduction in flood depth at a particular location for hydraulic models). In addition, as shown in Table 4, flood mitigation performance is reported across a wide range of storm sizes, further complicating attempts at comparison across measures and studies.
Table 4 suggests that two NI measures—depressional wetlands and cropland conversion to native forest—are likely to be very beneficial for flood risk reduction, as gauged by percentage reduction in peak flow. Farm ponds and floodplain restoration also perform well, ranking as “Medium” (“Few; High” and “Many; Medium”) on Figure 1. Other studies (e.g., [70,71,72]) have likewise identified these measures as having flood risk reduction benefits. Table 4 highlights the paucity of studies on NI measures such as two-stage ditches, which provide water storage and so could be anticipated to provide flood reduction benefits. We call for research into the potential flood mitigation benefits of these practices.
We used the data in Table 4 to identify those NI measures for which there is good evidence of Medium or High impacts on water quality and/or flooding, where “Medium” and “High” correspond to N removal rates in excess of 500 kg N ha−1 yr−1 and to peak flow reductions in excess of 15%. Depressional wetlands, floodplain restoration, conversion of cropland to native vegetation–forest, and farm ponds are all likely to have Medium to High impact on flood risk, as gauged by percentage reduction in peak flows. Depressional wetlands and floodplain restoration are also likely to have Medium to High impacts on water quality improvement, as are stream restoration, vegetated ditches, two-stage ditches, engineered wetlands and saturated buffers. The evidence available does point to two measures that appear promising for both improving water quality and reducing flood risk—restoration of depressional wetlands and of floodplains. These results are summarized in Figure 4 and suggest that downstream communities seeking to address both flooding and water quality concerns may wish to consider prioritizing these measures.

4.2. Variability in NI Performance

Although our focus has so far been on the average performance of various NI measures, what is equally compelling in Table 4 is the high variability in reported performance for individual measures within and across studies. This can be most easily understood for flood risk mitigation, where data are reported from watersheds of different sizes, for storms with different AEPs, and for varying levels of measure implementation. However, it is also clear that the water quality improvement performance of specific practices varies widely, with the most extreme example being that of stream restoration, where annual nitrogen removal rates vary by several orders of magnitude. To some extent, this may be an artifact of our “lumping” of discrete measures into the general categories shown in Table 3 and Figure 2. For example, our category of floodplain restoration includes such diverse measures as reconfiguration of stream channels, reconnection of abandoned oxbows, levee setback and reforestation of reconnected floodplain. Clearly, the specifics of how a given NI measure is designed and implemented can make a considerable difference to performance.
At the same time, it is important to realize that the performance of any given NI measure may vary across geography and time. For example, the performance of wetlands constructed for water quality improvement can vary considerably depending on a number of factors. While the placement of the wetland in the landscape (and the resulting flows and nutrient loads it is able to intercept [73]) is perhaps most important, design features such as the addition of sediment traps (to reduce wetland filling) and islands (to create longer flow paths and hence greater hydraulic retention time) can also make a considerable difference to performance. Likewise, the ability of a given NI measure to store floodwater can vary considerably depending on antecedent weather conditions, which might fill the available storage capacity [74].
For these and other reasons, we discourage decision-makers from seeking a single “silver bullet” NI measure for large-scale implementation in the belief that it alone will suffice to address water quality and/or flooding problems. Success would be more likely with a system of NI measures, each targeted to particular landscape locations where they will provide the greatest benefit [75] and arranged in series along hydrologic flow paths to form “treatment trains” [76,77]. Recognizing that climate change is anticipated to increase the severity of storms and that high-flow conditions potentially reduce the treatment effectiveness of wetlands and other NI measures [78], we encourage watershed planners to include high levels of upland water storage, even in systems designed solely for water quality improvement, to ensure that the NI measures further downstream are able to perform as intended.

4.3. Land Use and NI

From the perspective of land managers charged with optimizing ecosystem service provision in agricultural landscapes, it is vital to consider potential tradeoffs in land use between agricultural production and the provision of clean water and flood mitigation. To facilitate such analysis, it will be important that managers understand the area of NI needed to achieve water quality and flood mitigation goals. Consequently, we call for a new emphasis on reporting NI performance using area-based metrics.
For water quality, we were able to use the metric of kg N removed ha−1 yr−1 to compare the performance of various NI measures. As shown in Table 4, when this metric is used, the conversion of cropland to native vegetation performs far less well than structural measures such as wetlands and stream restoration in terms of impact. We suggest that one reason for the higher performance of structural NI measures is that they are typically sited strategically in the landscape to intercept and treat nutrient-rich flows [73]. In contrast, the choice of locations for cropland conversion is often driven more by interest in reducing erosion and/or providing wildlife habitat, with little or no consideration given to the potential for flow interception. A second difference between structural and vegetative NI measures is that the former provides some level of water storage; given the importance of hydrologic retention time for nitrogen processing [73], it may be that the provision of water storage increases water quality performance.
Turning to flood mitigation, Figure 3 is an attempt to analyze the land use implications of various NI measures in the absence of area-based performance metrics. In Figure 3, it clear that those NI measures which increase available storage for water in the landscape—such as farm ponds, floodplain restoration, runoff attenuation features and wetlands—provide disproportionately greater flood reduction benefits than does conversion of cropland to native vegetation. Peak flow reductions in excess of 10% can be achieved using 10% or less of watershed area for structural NI measures but achieving the same peak flow reduction requires conversion of 30% or more of cropland in the watershed to native vegetation. Iacob et al. [28] likewise noted that achieving a large reduction in peak flows required a large expansion of forested land in an agricultural watershed. While cropland conversion can impact flood flows via increased infiltration and roughness, it does not create additional storage volume, and this may account for its reduced performance. We suggest, therefore, that in situations where it is desirable to minimize cropland conversion, managers interested in the use of NI for flood risk reduction consider prioritizing those (structural) NI measures that create additional storage capacity.

4.4. NI Measures in the Watershed Context

Our review has shown that a variety of NI measures, occupying different landscape positions from uplands to floodplains on large rivers, can provide water quality improvement and flood mitigation benefits. This is important because it provides flexibility to accommodate the differing needs and desires of various stakeholders in different locations in the watershed. If landowners in the more upland portion of a watershed are unwilling to implement NI, downstream communities can still pursue opportunities for floodplain restoration on higher-order streams and rivers. Conversely, if existing built infrastructure makes floodplain restoration prohibitively expensive, communities can invest in more distributed NI measures further upstream.
Our analysis is based on reported NI performance of individual NI measures at relatively small scales, from individual monitoring sites to small (less than 3500 ha) watersheds. We urge caution in extrapolating the data shown in Table 4 to larger scales. For flood mitigation in particular, the benefits of NI will decrease with downstream distance from the site of intervention. An additional complication for flooding is the potential for interactive effects between NI measures on different tributaries, which can be beneficial or detrimental (depending on whether flood peaks are synchronized or desynchronized) depending on channel and watershed configurations [26,71,79].
Finally, we return to the idea introduced above that NI is likely to be most effective when implemented as a system of different NI measures in different landscape positions within a watershed. Figure 5 shows what this could look like, incorporating a variety of NI measures that are rated “Medium” or “High” for water quality or flood mitigation benefits. In designing such systems of NI measures, there is a clear need to better understand how multiple NI measures interact with one another and at scale. Given the challenges of monitoring, and the importance of being able to simulate the impacts of different NI implementation scenarios, this will require sophisticated modeling that can simulate changes in rainfall–runoff relationships, flow routing, channel morphology and biogeochemical processing. Such modeling is likely to be data-intensive, time-consuming, and, therefore, expensive. Our analysis suggests that there may be value in a simplistic approach, as follows. For both water quality improvement and flood risk reduction, it appears that there may be a relationship between water storage and NI performance. If this is correct, then communities could evaluate different NI implementation scenarios by comparing the aggregated volume of new storage provided by NI measures across the watershed.

5. Conclusions

Our analysis of published data on the environmental performance of NI measures suggests that a variety of NI interventions in agricultural landscapes could benefit downstream communities experiencing water quality and flooding problems. In particular, the restoration of wetlands and of floodplains are likely to provide dual benefits. A number of interventions associated with ditches and streams (vegetated ditches, two-stage ditches, riparian forest buffers and stream restoration) hold promise for improving water quality, although more work is needed to establish evidence of any flood mitigation benefits. In more upland areas, conversion of cropland to native vegetation (especially forests) and farm ponds designed to hold runoff are likely to reduce downstream flood risks.
Our analysis also highlights the difficulty of comparing the performance of multiple types of NI given the wide variety of metrics used for reporting improvements in water quality and flood risk reduction. In part, this reflects the variety of approaches (direct monitoring, hydrologic modeling and hydraulic modeling) used to assess performance, as well as the location and scale at which performance is assessed. In order to facilitate comparison between measures, and to assist decision-makers who often need to understand the absolute (rather than relative) value of various NI measures in attaining regional water quality or flood reduction goals, we encourage researchers to report the results of their work in absolute (e.g., N removal per unit area of measure) rather than relative (e.g., percentage reduction of flow or contaminant) metrics.
Recognizing that in agricultural landscapes the implementation of NI will require modest conversion out of cropland (though this may be only temporary in some cases, such as runoff attenuation features), we sought to determine which NI measures could be integrated into the landscape with minimal cropland conversion. Again, the limited use of area-based metrics in reporting NI performance made this challenging. Our preliminary assessment suggests that structural measures that provide new water storage capacity, such as created and restored wetlands and restored floodplains, may be more effective than vegetative measures (cropland conversion). This may reflect a combination of factors: the importance of water storage in flow modification, the increase in hydraulic retention time (and increased biogeochemical processing capacity) associated with increased water storage, and the (usually) strategic placement of structural measures to intercept important flow paths.
In summary, we recommend that communities experiencing water quality and flooding problems consider the role that NI measures in upstream agricultural watersheds could play in addressing these problems. Our analysis suggests that there is the potential for NI measures implemented across the landscape from farmers’ fields to river floodplains to provide Medium to High benefits to water quality and flood risk reduction. While additional work is needed to assess the benefits of more recent and innovative measures such as runoff attenuation features and two-stage ditches, there is sufficient evidence on more established measures such as restoration of floodplains and depressional wetlands to support their inclusion in local government watershed management plans.

Supplementary Materials

The following are available online at https://www.mdpi.com/article/10.3390/w13243579/s1, Table S1: Expanded results from Table 4 for water quality improvement natural infrastructure measures, and Table S2: Expanded results from Table 4 for flood mitigation natural infrastructure measures.

Author Contributions

K.M.S. was responsible for conceptualization, methodology, formal analysis, data curation, visualization and writing the original draft. A.J.E. contributed to conceptualization, methodology, data curation and reviewing and editing the original draft. E.L.M. was responsible for conceptualization, methodology, writing the original draft, supervision and project administration. All authors have read and agreed to the published version of the manuscript.

Funding

This research was funded by the Walton Family Foundation, grant number 00090098.

Institutional Review Board Statement

Not applicable.

Informed Consent Statement

Not applicable.

Data Availability Statement

The data presented in this study are available in Supplementary Materials.

Acknowledgments

Thanks to Chandler Clay, formerly of EDF, and Julie Rossman for assistance with graphic design.

Conflicts of Interest

The authors declare no conflict of interest. The funders had no role in the design of the study; in the collection, analyses, or interpretation of data; in the writing of the manuscript; or in the decision to publish the results.

References

  1. New Data Shows Millions of People, Trillions in Property at Risk from Flooding—But Infrastructure Investments Now Can Significantly Lower Flood Risk. Available online: https://www.wri.org/news/release-new-data-shows-millions-people-trillions-property-risk-flooding-infrastructure (accessed on 27 October 2021).
  2. Bassi, A.M.; Bechauf, R.; Casier, L.; Cutler, E. How Can Investment in Nature Close the Infrastructure Gap? International Institute of Sustainable Development: Winnipeg, Canada, 2021. [Google Scholar]
  3. Mateo-Sagasta, J.; Zadeh, S.M.; Turral, H. More People, More Food, Worse Water? A Global Review of Water Pollution from Agriculture; Food and Agriculture Organization of the United Nations: Rome, Italy, 2018. [Google Scholar]
  4. Sobota, D.J.; Compton, J.E.; McCrackin, M.L.; Singh, S. Cost of reactive nitrogen release from human activities to the environment in the United States. Environ. Res. Lett. 2015, 10, 025006. [Google Scholar] [CrossRef]
  5. McFarland, A.R.; Larsen, L.; Yeshitela, K.; Engida, A.N.; Love, N.G. Guide for using green infrastructure in urban environments for stormwater management. Environ. Sci. Water Res. Technol. 2019, 5, 643–659. [Google Scholar] [CrossRef]
  6. Qiu, J.; Queiroz, C.; Bennett, E.M.; Cord, A.F.; Crouzat, E.; Lavorel, S.; Maes, J.; Meacham, M.; Norström, A.V.; Peterson, G.D. Land-use intensity mediates ecosystem service tradeoffs across regional social-ecological systems. Ecosyst. People 2021, 17, 264–278. [Google Scholar] [CrossRef]
  7. Cunniff, S.E. Scaling protection and restoration of natural infrastructure to reduce flood impacts and enhance resilience. Shore Beach 2019, 87, 4. [Google Scholar] [CrossRef]
  8. Temmerman, S.; Meire, P.; Bouma, T.J.; Herman, P.M.; Ysebaert, T.; De Vriend, H.J. Ecosystem-based coastal defence in the face of global change. Nature 2013, 504, 79–83. [Google Scholar] [CrossRef] [PubMed]
  9. Howarth, R.W.; Chan, F.; Swaney, D.; Marino, R.; Hayn, M. Role of external inputs of nutrients to aquatic ecosystems in determining prevalence of nitrogen vs. phosphorus limitation of net primary productivity. Biogeochemistry 2021, 154, 293–306. [Google Scholar] [CrossRef]
  10. Hansen, A.T.; Dolph, C.L.; Foufoula-Georgiou, E.; Finlay, J.C. Contribution of wetlands to nitrate removal at the watershed scale. Nat. Geosci. 2018, 11, 127–132. [Google Scholar] [CrossRef]
  11. Barber, N.J.; Quinn, P.F. Mitigating diffuse water pollution from agriculture using soft-engineered runoff attenuation features. Area 2012, 44, 454–462. [Google Scholar] [CrossRef]
  12. Iacob, O.; Rowan, J.S.; Brown, I.; Ellis, C. Evaluating wider benefits of natural flood management strategies: An ecosystem-based adaptation perspective. Hydrol. Res. 2014, 45, 774–787. [Google Scholar] [CrossRef] [Green Version]
  13. Kelly, S.A.; Takbiri, Z.; Belmont, P.; Foufoula-Georgiou, E. Human amplified changes in precipitation–runoff patterns in large river basins of the Midwestern United States. Hydrol. Earth Syst. Sci. 2017, 21, 5065–5088. [Google Scholar] [CrossRef] [Green Version]
  14. Schilling, K.E.; Gassman, P.W.; Arenas-Amado, A.; Jones, C.S.; Arnold, J. Quantifying the contribution of tile drainage to basin-scale water yield using analytical and numerical models. Sci. Total Environ. 2019, 657, 297–309. [Google Scholar] [CrossRef]
  15. Lu, C.; Zhang, J.; Tian, H.; Crumpton, W.G.; Helmers, M.J.; Cai, W.-J.; Hopkinson, C.S.; Lohrenz, S.E. Increased extreme precipitation challenges nitrogen load management to the Gulf of Mexico. Commun. Earth Environ. 2020, 1, 21. [Google Scholar] [CrossRef]
  16. USGCRP. Chapter 21: Midwest In: Impacts, Risks, and Adaptation in the United States: Fourth National Climate Assessment; Reidmiller, D.R., Avery, C.W., Easterling, D.R., Kunkel, K.E., Lewis, K.L.M., Maycock, T.K., Stewart, B.C., Eds.; U.S. Global Change Research Program: Washington, DC, USA, 2018; pp. 872–940. [Google Scholar]
  17. Biello, D. Deadly Algae Are Everywhere, Thanks to Agriculture. Scientific American. 2014. Available online: https://www.scientificamerican.com/article/deadly-algae-are-everywhere-thanks-to-agriculture/ (accessed on 28 October 2021).
  18. Jose, S.; Gold, M.; Zamora, D. Appendix A: Regional Summaries: Midwest. In Agroforestry: Enhancing Resiliency in US Agricultural Landscapes under Changing Conditions; Gen. Tech. Report WO-96; Schoeneberger, M.M., Bentrup, G., Patel-Weynand, T., Eds.; US Department of Agriculture, Forest Service: Washington, DC, USA, 2017; p. 177. [Google Scholar]
  19. Land, M.; Granéli, W.; Grimvall, A.; Hoffmann, C.C.; Mitsch, W.J.; Tonderski, K.S.; Verhoeven, J.T. How effective are created or restored freshwater wetlands for nitrogen and phosphorus removal? A systematic review. Environ. Evid. 2016, 5, 9. [Google Scholar] [CrossRef] [Green Version]
  20. Moreno-Mateos, D.; Comín, F.A.; Pedrocchi, C.; Causapé, J. Effect of wetlands on water quality of an agricultural catchment in a semi-arid area under land use transformation. Wetlands 2009, 29, 1104–1113. [Google Scholar] [CrossRef]
  21. Craft, C.; Vymazal, J.; Kröpfelová, L. Carbon sequestration and nutrient accumulation in floodplain and depressional wetlands. Ecol. Eng. 2018, 114, 137–145. [Google Scholar] [CrossRef]
  22. Javaheri, A.; Babbar-Sebens, M. On comparison of peak flow reductions, flood inundation maps, and velocity maps in evaluating effects of restored wetlands on channel flooding. Ecol. Eng. 2014, 73, 132–145. [Google Scholar] [CrossRef]
  23. Ameli, A.A.; Creed, I.F. Does wetland location matter when managing wetlands for watershed-scale flood and drought resilience? J. Am. Water Resour. Assoc. 2019, 55, 529–542. [Google Scholar] [CrossRef]
  24. Yang, W.; Wang, X.; Liu, Y.; Gabor, S.; Boychuk, L.; Badiou, P. Simulated environmental effects of wetland restoration scenarios in a typical Canadian prairie watershed. Wetl. Ecol. Manag. 2010, 18, 269–279. [Google Scholar] [CrossRef]
  25. Syswerda, S.; Basso, B.; Hamilton, S.; Tausig, J.; Robertson, G. Long-term nitrate loss along an agricultural intensity gradient in the Upper Midwest USA. Agric. Ecosyst. Environ. 2012, 149, 10–19. [Google Scholar] [CrossRef] [Green Version]
  26. Dixon, S.J.; Sear, D.A.; Odoni, N.A.; Sykes, T.; Lane, S.N. The effects of river restoration on catchment scale flood risk and flood hydrology. Earth Surf. Process. Landf. 2016, 41, 997–1008. [Google Scholar] [CrossRef]
  27. Salazar Galán, S.A.; Francés, F.; Komma, J.; Blume, J.; Francke, T.; Bronstert, A.; Blöschl, G. A comparative analysis of the effectiveness of flood management measures based on the concept of retaining water in the landscape in different European hydro-climatic regions. Nat. Hazards Earth Syst. Sci. 2012, 12, 3287–3306. [Google Scholar] [CrossRef] [Green Version]
  28. Iacob, O.; Brown, I.; Rowan, J. Natural flood management, land use and climate change trade-offs: The case of Tarland catchment, Scotland. Hydrol. Sci. J. 2017, 62, 1931–1948. [Google Scholar] [CrossRef] [Green Version]
  29. Váňová, V.; Langhammer, J. Modelling the impact of land cover changes on flood mitigation in the upper Lužnice basin. J. Hydrol. Hydromech. 2011, 59, 262–274. [Google Scholar] [CrossRef] [Green Version]
  30. Culman, S.W.; Snapp, S.S.; Ollenburger, M.; Basso, B.; DeHaan, L.R. Soil and water quality rapidly responds to the perennial grain Kernza wheatgrass. Agron. J. 2013, 105, 735–744. [Google Scholar] [CrossRef] [Green Version]
  31. McIsaac, G.F.; David, M.B.; Mitchell, C.A. Miscanthus and switchgrass production in central Illinois: Impacts on hydrology and inorganic nitrogen leaching. J. Environ. Qual. 2010, 39, 1790–1799. [Google Scholar] [CrossRef] [Green Version]
  32. Cibin, R.; Trybula, E.; Chaubey, I.; Brouder, S.M.; Volenec, J.J. Watershed-scale impacts of bioenergy crops on hydrology and water quality using improved SWAT model. GCB Bioenergy 2016, 8, 837–848. [Google Scholar] [CrossRef]
  33. Nicholson, A.R.; O‘Donnell, G.M.; Wilkinson, M.E.; Quinn, P.F. The potential of runoff attenuation features as a Natural Flood Management approach. J. Flood Risk Manag. 2020, 13, e12565. [Google Scholar] [CrossRef] [Green Version]
  34. Metcalfe, P.; Beven, K.; Hankin, B.; Lamb, R. A new method, with application, for analysis of the impacts on flood risk of widely distributed enhanced hillslope storage. Hydrol. Earth Syst. Sci. 2018, 22, 2589–2605. [Google Scholar] [CrossRef] [Green Version]
  35. Fleischer, S.; Gustafson, A.; Joelsson, A.; Pansar, J.; Stibe, L. Nitrogen removal in created ponds. Ambio 1994, 23, 349–357. Available online: http://www.jstor.org/stable/4314235 (accessed on 29 October 2021).
  36. Ibrahim, Y.A.; Amir-Faryar, B. Strategic insights on the role of farm ponds as nonconventional stormwater management facilities. J. Hydrol. Eng. 2018, 23, 04018023. [Google Scholar] [CrossRef]
  37. Chrétien, F.; Gagnon, P.; Thériault, G.; Guillou, M. Performance analysis of a wet-retention pond in a small agricultural catchment. J. Environ. Eng. 2016, 142, 04016005. [Google Scholar] [CrossRef]
  38. Mitsch, W.J.; Day, J.W., Jr. Restoration of wetlands in the Mississippi–Ohio–Missouri (MOM) River Basin: Experience and needed research. Ecol. Eng. 2006, 26, 55–69. [Google Scholar] [CrossRef]
  39. Groh, T.A.; Gentry, L.E.; David, M.B. Nitrogen removal and greenhouse gas emissions from constructed wetlands receiving tile drainage water. J. Environ. Qual. 2015, 44, 1001–1010. [Google Scholar] [CrossRef] [PubMed] [Green Version]
  40. Walters, K.M.; Babbar-Sebens, M. Using climate change scenarios to evaluate future effectiveness of potential wetlands in mitigating high flows in a Midwestern U.S. watershed. Ecol. Eng. 2016, 89, 80–102. [Google Scholar] [CrossRef] [Green Version]
  41. Jaynes, D.B.; Isenhart, T.M. Reconnecting tile drainage to riparian buffer hydrology for enhanced nitrate removal. J. Environ. Qual. 2014, 43, 631–638. [Google Scholar] [CrossRef] [PubMed] [Green Version]
  42. Groh, T.A.; Davis, M.P.; Isenhart, T.M.; Jaynes, D.B.; Parkin, T.B. In Situ denitrification in saturated riparian buffers. J. Environ. Qual. 2019, 48, 376–384. [Google Scholar] [CrossRef] [PubMed] [Green Version]
  43. Zak, D.; Stutter, M.; Jensen, H.S.; Egemose, S.; Carstensen, M.V.; Audet, J.; Strand, J.A.; Feuerbach, P.; Hoffmann, C.C.; Christen, B. An assessment of the multifunctionality of integrated buffer zones in Northwestern Europe. J. Environ. Qual. 2019, 48, 362–375. [Google Scholar] [CrossRef] [Green Version]
  44. Castaldelli, G.; Soana, E.; Racchetti, E.; Vincenzi, F.; Fano, E.A.; Bartoli, M. Vegetated canals mitigate nitrogen surplus in agricultural watersheds. Agric. Ecosyst. Environ. 2015, 212, 253–262. [Google Scholar] [CrossRef]
  45. Pierobon, E.; Castaldelli, G.; Mantovani, S.; Vincenzi, F.; Fano, E.A. Nitrogen removal in vegetated and unvegetated drainage ditches impacted by diffuse and point sources of pollution. CLEAN-Soil Air Water 2013, 41, 24–31. [Google Scholar] [CrossRef]
  46. Taylor, J.; Moore, M.; Speir, S.L.; Testa, S. Vegetated ditch habitats provide net nitrogen sink and phosphorus storage capacity in agricultural drainage networks despite senescent plant leaching. Water 2020, 12, 875. [Google Scholar] [CrossRef] [Green Version]
  47. Schilling, K.E.; Streeter, M.T.; Clair, M.S.; Meissen, J. Subsurface nutrient processing capacity in agricultural roadside ditches. Sci. Total Environ. 2018, 637, 470–479. [Google Scholar] [CrossRef]
  48. Klocker, C.A.; Kaushal, S.S.; Groffman, P.M.; Mayer, P.M.; Morgan, R.P. Nitrogen uptake and denitrification in restored and unrestored streams in urban Maryland, USA. Aquat. Sci. 2009, 71, 411–424. [Google Scholar] [CrossRef]
  49. Newcomer Johnson, T.A.; Kaushal, S.S.; Mayer, P.M.; Smith, R.M.; Sivirichi, G.M. Nutrient retention in restored streams and rivers: A global review and synthesis. Water 2016, 8, 116. [Google Scholar] [CrossRef] [Green Version]
  50. Newcomer Johnson, T.A.; Kaushal, S.S.; Mayer, P.M.; Grese, M.M. Effects of stormwater management and stream restoration on watershed nitrogen retention. Biogeochemistry 2014, 121, 81–106. [Google Scholar] [CrossRef]
  51. Liu, Y.; Gebremeskel, S.; de Smedt, F.; Hoffmann, L.; Pfister, L. Simulation of flood reduction by natural river rehabilitation using a distributed hydrological model. Hydrol. Earth Syst. Sci. 2004, 8, 1129–1140. [Google Scholar] [CrossRef]
  52. Hammersmark, C.T.; Rains, M.C.; Mount, J.F. Quantifying the hydrological effects of stream restoration in a montane meadow, northern California, USA. River Res. Appl. 2008, 24, 735–753. [Google Scholar] [CrossRef]
  53. Speir, S.L.; Tank, J.L.; Mahl, U.H. Quantifying denitrification following floodplain restoration via the two-stage ditch in an agricultural watershed. Ecol. Eng. 2020, 155, 105945. [Google Scholar] [CrossRef]
  54. Hanrahan, B.R.; Tank, J.L.; Dee, M.M.; Trentman, M.T.; Berg, E.M.; McMillan, S.K. Restored floodplains enhance denitrification compared to naturalized floodplains in agricultural streams. Biogeochemistry 2018, 141, 419–437. [Google Scholar] [CrossRef]
  55. Dee, M.M.; Tank, J.L. Inundation time mediates denitrification end products and carbon limitation in constructed floodplains of an agricultural stream. Biogeochemistry 2020, 149, 141–158. [Google Scholar] [CrossRef]
  56. Lowrance, R.; Altier, L.S.; Newbold, J.D.; Schnabel, R.R.; Groffman, P.M.; Denver, J.M.; Correll, D.L.; Gilliam, J.W.; Robinson, J.L.; Brinsfield, R.B. Water quality functions of riparian forest buffers in Chesapeake Bay watersheds. Environ. Manag. 1997, 21, 687–712. Available online: https://repository.si.edu/bitstream/handle/10088/17707/serc_Lowrance_etal_1997_EnvironManage_21_687_712.pdf (accessed on 29 October 2021). [CrossRef] [PubMed]
  57. Newbold, J.D.; Herbert, S.; Sweeney, B.W.; Kiry, P.; Alberts, S.J. Water Quality Functions of a 15-Year-Old Riparian Forest Buffer System 1. JAWRA J. Am. Water Resour. Assoc. 2010, 46, 299–310. [Google Scholar] [CrossRef]
  58. Peterjohn, W.T.; Correll, D.L. Nutrient dynamics in an agricultural watershed: Observations on the role of a riparian forest. Ecology 1984, 65, 1466–1475. [Google Scholar] [CrossRef]
  59. Pinay, G.; Roques, L.; Fabre, A. Spatial and temporal patterns of denitrification in a riparian forest. J. Appl. Ecol. 1993, 581–591. [Google Scholar] [CrossRef]
  60. Anderson, B.; Rutherfurd, I.; Western, A. An analysis of the influence of riparian vegetation on the propagation of flood waves. Environ. Model. Softw. 2006, 21, 1290–1296. [Google Scholar] [CrossRef]
  61. Forshay, K.J.; Stanley, E.H. Rapid nitrate loss and denitrification in a temperate river floodplain. Biogeochemistry 2005, 75, 43–64. [Google Scholar] [CrossRef]
  62. Acreman, M.; Riddington, R.; Booker, D. Hydrological impacts of floodplain restoration: A case study of the River Cherwell, UK. Hydrol. Earth Syst. Sci. 2003, 7, 75–85. [Google Scholar] [CrossRef] [Green Version]
  63. Ahilan, S.; Guan, M.; Sleigh, A.; Wright, N.; Chang, H. The influence of floodplain restoration on flow and sediment dynamics in an urban river. J. Flood Risk Manag. 2018, 11, S986–S1001. [Google Scholar] [CrossRef]
  64. Clilverd, H.; Thompson, J.; Heppell, C.; Sayer, C.; Axmacher, J. Coupled hydrological/hydraulic modelling of river restoration impacts and floodplain hydrodynamics. River Res. Appl. 2016, 32, 1927–1948. [Google Scholar] [CrossRef]
  65. Golden, H.E.; Rajib, A.; Lane, C.R.; Christensen, J.R.; Wu, Q.; Mengistu, S. Non-floodplain wetlands affect watershed nutrient dynamics: A critical review. Environ. Sci. Technol. 2019, 53, 7203–7214. [Google Scholar] [CrossRef]
  66. Wallace, J.; Waltham, N.J. On the potential for improving water quality entering the Great Barrier Reef lagoon using constructed wetlands. Mar. Pollut. Bull. 2021, 170, 112627. [Google Scholar] [CrossRef]
  67. Natho, S.; Tschikof, M.; Bondar-Kunze, E.; Hein, T. Modeling the effect of enhanced lateral connectivity on nutrient retention capacity in large river floodplains: How much connected floodplain do we need? Front. Environ. Sci. 2020, 8, 74. [Google Scholar] [CrossRef]
  68. Vidon, P.G.; Welsh, M.K.; Hassanzadeh, Y.T. Twenty years of riparian zone research (1997–2017): Where to next? J. Environ. Qual. 2019, 48, 248–260. [Google Scholar] [CrossRef] [PubMed]
  69. Hill, A.R. Groundwater nitrate removal in riparian buffer zones: A review of research progress in the past 20 years. Biogeochemistry 2019, 143, 347–369. [Google Scholar] [CrossRef]
  70. Wilkinson, M.E.; Addy, S.; Quinn, P.F.; Stutter, M. Natural flood management: Small-scale progress and larger-scale challenges. Scott. Geogr. J. 2019, 135, 23–32. [Google Scholar] [CrossRef]
  71. Dadson, S.J.; Hall, J.W.; Murgatroyd, A.; Acreman, M.; Bates, P.; Beven, K.; Heathwaite, L.; Holden, J.; Holman, I.P.; Lane, S.N.; et al. A restatement of the natural science evidence concerning catchment-based ‘natural’ flood management in the UK. Proc. R. Soc. A Math. Phys. Eng. Sci. 2017, 473, 20160706. [Google Scholar] [CrossRef] [Green Version]
  72. Nilsson, C.; Riis, T.; Sarneel, J.M.; Svavarsdóttir, K. Ecological restoration as a means of managing inland flood hazards. BioScience 2018, 68, 89–99. [Google Scholar] [CrossRef]
  73. Crumpton, W.G.; Stenback, G.A.; Fisher, S.W.; Stenback, J.Z.; Green, D.I. Water Quality Performance of Wetlands Receiving Nonpoint-Source Nitrogen Loads: Nitrate and Total Nitrogen Removal Efficiency and Controlling Factors. J. Environ. Qual. 2020, 49, 735–744. [Google Scholar] [CrossRef] [PubMed] [Green Version]
  74. Haque, A.; Ali, G.; Badiou, P. Hydrological dynamics of prairie pothole wetlands: Dominant processes and landscape controls under contrasted conditions. Hydrol. Process. 2018, 32, 2405–2422. [Google Scholar] [CrossRef]
  75. McLellan, E.L.; Schilling, K.E.; Wolter, C.F.; Tomer, M.D.; Porter, S.A.; Magner, J.A.; Smith, D.R.; Prokopy, L.S. Right practice, right place: A conservation planning toolbox for meeting water quality goals in the Corn Belt. J. Soil Water Conserv. 2018, 73, 29A–34A. [Google Scholar] [CrossRef] [Green Version]
  76. Lien, E.; Magner, J. Engineered biosystem treatment trains: A review of agricultural nutrient sequestration. Invent. J. Res. Technol. Eng. Manag. 2017, 1, 5–10. [Google Scholar]
  77. Goeller, B.C.; Febria, C.M.; McKergow, L.A.; Harding, J.S.; Matheson, F.E.; Tanner, C.C.; McIntosh, A.R. Combining tools from edge-of-field to in-stream to attenuate reactive nitrogen along small agricultural waterways. Water 2020, 12, 383. [Google Scholar] [CrossRef] [Green Version]
  78. Mendes, L.R.D. Nitrogen Removal from Agricultural Subsurface Drainage by Surface-Flow Wetlands: Variability. Processes 2021, 9, 156. [Google Scholar] [CrossRef]
  79. Hankin, B.; Metcalfe, P.; Beven, K.; Chappell, N.A. Integration of hillslope hydrology and 2D hydraulic modelling for natural flood management. Hydrol. Res. 2019, 50, 1535–1548. [Google Scholar] [CrossRef] [Green Version]
Figure 1. Matrix used to rank measures by impact and evidence. Measures for which many publications report High impact were considered “High” priorities for implementation, whereas measures for which a few studies reported High impact, or many studies reported Medium impact were considered “Medium” priority for implementation.
Water 13 03579 g001
Figure 2. Examples of natural infrastructure in agricultural landscapes. (A) Wetlands—depressional (photo credit: USGS, David Mushet), (B) Conversion of crop land to native vegetation—forest (photo credit: USFS), (C) Conversion of crop land to native vegetation—grasses (photo credit: USDOE, (D) Runoff attenuation features (photo credit: Nick Barbers, Newcastle University), (E) Farm ponds (photo credit: USDA-NRCS), (F) Wetlands—engineered (photo credit: Matthew Helmers, Iowa State University), (G) Saturated buffers – conventional on left and saturated buffer on right (photo credit: USDA), (H) Vegetated ditches (photo credit: USDA-ARS), (I). Stream restoration before and after (photo credit: EPA), (J) Two-stage ditches (photo credit: USDA-NRCS), (K) Riparian forest buffer (photo credit: USFS), (L) Floodplain restoration (photo credit: USGS).
Water 13 03579 g002aWater 13 03579 g002b
Figure 3. Areal extent of natural infrastructure measures as a proportion of the watershed in which they are placed (x-axis) in relation to the reduction in peak flows (y-axis). DW = depressional wetlands, EW = engineered wetlands, FP = farm ponds, FR = floodplain restoration, LUC-F = conversion of cropland to native vegetation—forest, LUC-G conversion of cropland to native vegetation—grasses, RAF = runoff attenuation features. The dashed black line represents a 1:1 relationship between areal extent and flood reduction.
Water 13 03579 g003
Figure 4. NI measures most promising for both flood mitigation and water quality improvement are shown in the middle. Measures most promising for flood mitigation only are on the left and measures for water quality improvement only are on the right.
Water 13 03579 g004
Figure 5. Example of different NI measures in different landscape positions throughout a watershed.
Water 13 03579 g005
Table 1. Metrics used for natural infrastructure measures in the reviewed literature.
Metric (Units)Number of Studies Using MetricNumber of NI Measures for Which Metric Is Used
Flood MitigationPeak flow reduction (%)3010
Flow velocity (m s−1)66
Surface runoff (mm h−1 or l s−1)64
Flood depth/flood height (m)42
Flood area (m2)22
Flood duration (h)22
Storage capacity (m3)43
Time to peak (h)33
Changes in baseflow (%)11
Number of flood events11
Time to base flow (h)11
Nitrogen MitigationNitrogen removal rate in kg ha−1 yr−13815
Nitrogen removal rate, variable metrics *116
Concentration reduction (%)96
Denitrification potential (ug N g−1 h−1)24
Denitrification enzyme activity (ng g−1 h−1)11
N mineralization rate (μmol N m−2 d−1)11
Note(s): * 11 studies use some combination of load, area, time, but not all together; a subset (6) of these studies (regarding three NI measures) uses a volume or length for the denominator instead of area (saturated buffers, vegetated ditches, and two-stage ditches).
Table 2. Scoring rubric.
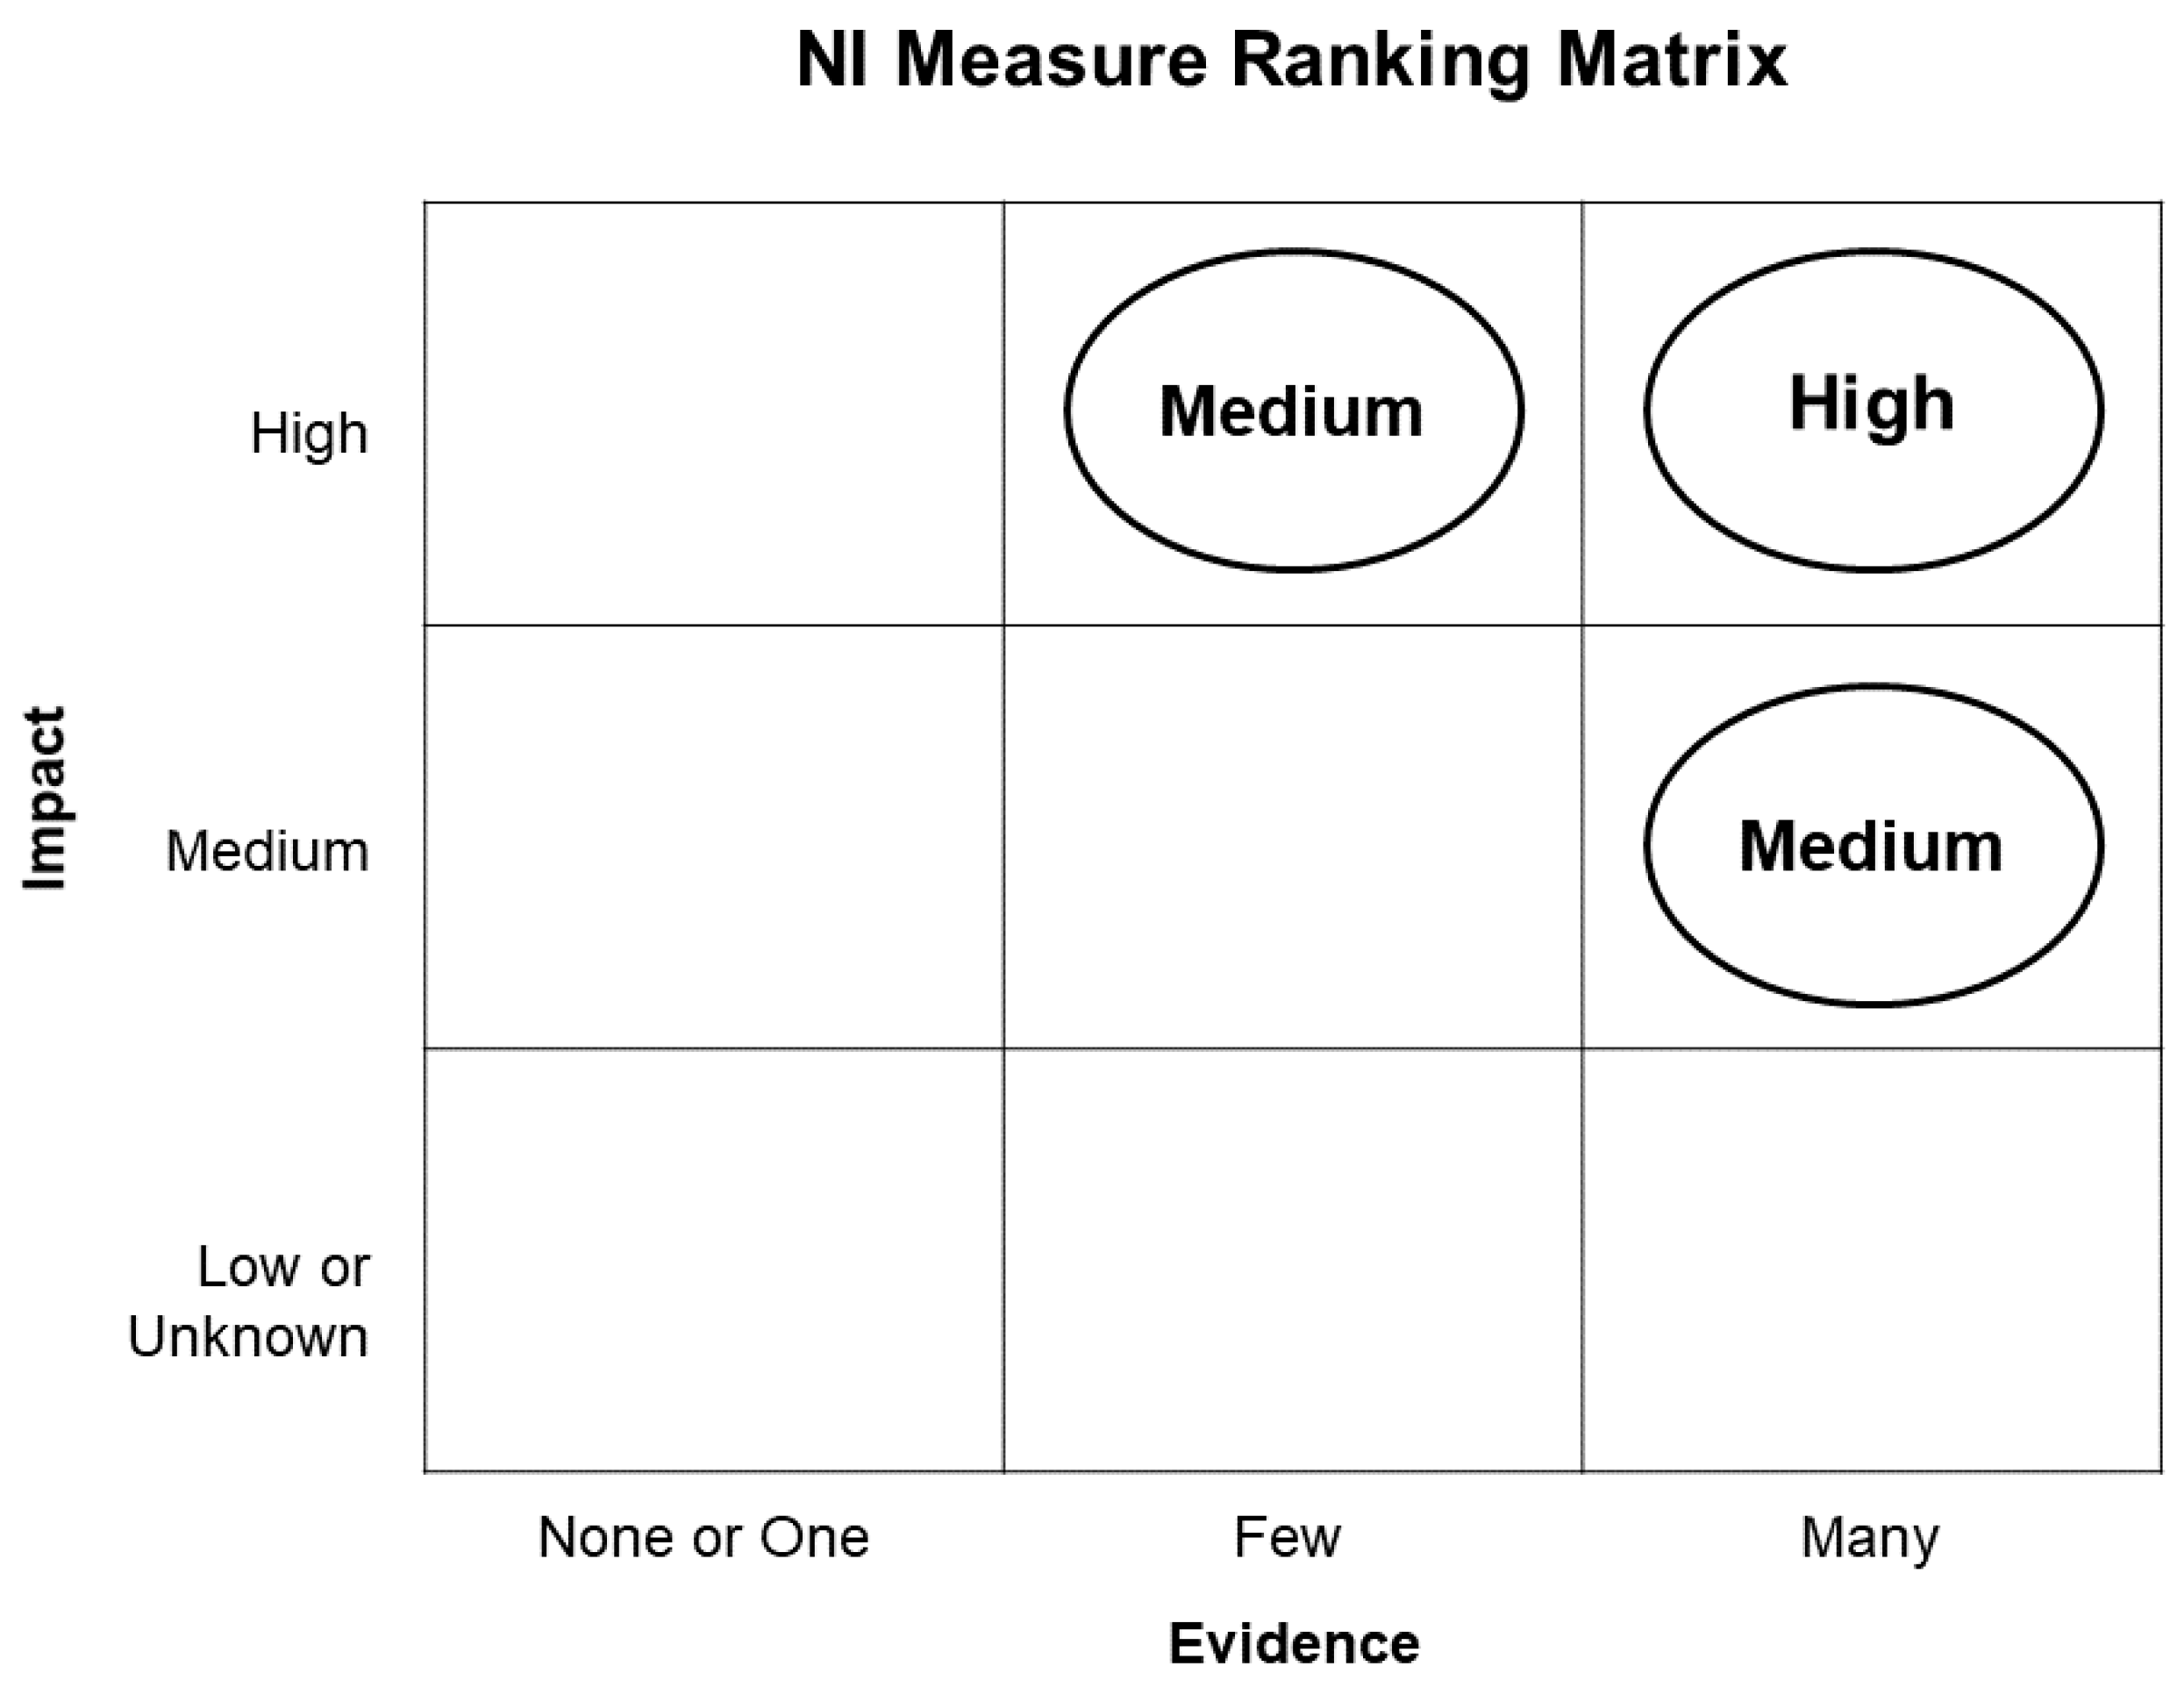
Strength of Evidence (# of Publications)Measure Effectiveness
NoneWater quality, reported as kg N ha−1 yr−1 reduction in nitrogen loadUnknown
Low = less than 500 kg N ha−1 yr−1
OneMedium = 500–1000 kg N ha−1 yr−1
High = greater than 1000 kg N ha−1 yr−1
Few (2)Flood risk reduction, reported as % reduction in peak flowUnknown
Low = less than 15%
Many (3 or more)Medium = 15–25%
High = greater than 25%
Table 3. Overview of NI measures in agricultural landscapes.
Landscape Position
Associated with
the upland
Wetlands—DepressionalSometimes described as “isolated” wetlands. Most are shallow with depths <1 m and a median size of 0.16 ha, but they can be as large as several hundred hectares. See Figure 2A.
Conversion of cropland to native vegetation—forest or grassesLand use change that converts cropland to forest vegetation or to grass vegetation (including prairie, perennial crops and pasture). See Figure 2B and Figure 2C.
Runoff attenuation features (RAF)Used primarily in the U.K. and Europe, RAFs intercept overland flow and temporarily store water behind small “leaky “dams over a period of 4–24 h. See Figure 2D.
Farm pondsImpoundments that are intended for long term storage of water for livestock and/or fishing. They can be constructed with an embankment/berm or dugout out of the earth to fill with water. See Figure 2E.
Associated with
artificial drainage structures
Wetlands—engineered Wetlands constructed where wetlands did not exist before, typically by creating an embankment to intercept the flow from the outlets of artificial drainage structures such as tile drains. They are usually much larger than depressional wetlands and intercept a much larger drainage area. See Figure 2F.
Saturated buffers Used in the U.S.A. where tile drains bypass riparian buffers. They are constructed with a perforated distribution pipe to spread drainage water laterally across the buffer subsurface to promote denitrification. See Figure 2G.
Associated with small streams and drainage ditchesVegetated ditchesDrainage ditches are planted with grasses or other vegetation to reduce sediment and nutrient pollution. See Figure 2H.
Stream restorationRestoring the geomorphic structure of the stream by raising the stream bed, installing meanders to a channelized stream, re-grading the stream channel, reconnecting oxbows, etc. See Figure 2I.
Two-stage ditchesModified drainage ditches that have two “benches” on either side of the channel that function as floodplains. Pipes or tile drains empty onto the constructed floodplain rather than directly into the ditch. See Figure 2J.
Riparian forest buffersForested areas (natural or re-established) separating streams or rivers from adjacent agricultural land. See Figure 2K.
Associated with larger streams and riversFloodplain restorationReconnecting the main channel with the floodplain to allow for periodic inundation. It may occur as part of modifications to levees (levee removal, breaching or setback) or in areas without levees. Floodplain restoration is often associated with reconnection of river flows to previously disconnected wetlands (oxbow restoration) and/or planting of native vegetation (e.g., forested floodplain restoration). See Figure 2L.
Table 4. Natural infrastructure measures: Evidence for and impact assessment of nutrient loss reduction (water quality) and flood mitigation from specific studies, noted by the references in square brackets. Evidence is characterized as None, One, Few (2), or Many (3 or more) peer-reviewed publications. Impact is characterized as Unknown, Low, Medium, or High. The values for nitrogen reduction are set at Low for <500 kg ha−1 yr−1, Medium for 500–1000 kg ha−1 yr−1, and High for more than 1000 kg ha−1 yr−1. We categorized peak flow reductions as Low for <15%, Medium for 15%–25%, and High for values over 25%. Measures that we would consider to be “High” priorities for implementation (as shown in Figure 1), with Many publications reporting High impacts, are shown in bold (Many; High); measures that we consider to be “Medium” priorities for implementation (as shown in Figure 1) are shown in italics (Many; Medium or Few; High). More detailed tables for water quality and flood mitigation natural infrastructure measures are included in the Supplementary Materials.
Water QualityFlood Mitigation
NI Measure NameEvidence; ImpactNitrogen loss reduction, average; range (kg ha−1 yr−1)Evidence; ImpactPeak flow reduction, average; range (%)Watershed size (km2)Storm size (AEP)
Upland natural infrastructure
Wetland—depressionalMany; High1113; 37–1810 kg ha−1 yr−1 [19,20,21]Many; High26; 14–41% [22,23,24]23–886 km2 [22,23,24]1, 10, 39% AEP [22,23]
Conversion of cropland to native vegetation—forestOne; Low56; 51–61 kg ha−1 yr−1 [25]Many; High27; 19–34% [26,27,28,29]25–954 km2 [26,27,28,29]1, 5, 10% AEP [28,29]
Conversion of cropland to native vegetation—grassesMany; Low55; 29–120 kg ha−1 yr−1 [25,30,31]Few; Low10; 5–14% [29,32]943–2089 km2 [29,32]1, 5, 10% AEP [29]
Runoff attenuation featuresNone; UnknownTypical designs do not attenuate nutrients [11]Many; Low9; 3–30% [27,33,34]6–954 km2 [27,33,34]39% AEP [33]
Farm pondsOne; MediumN/A; 73–7000 kg ha−1 yr−1 [35]Few; High38; 13–55% [36,37]0.231–1050 km2 [36,37]10, 39% AEP [36]
Associated with artificial drainage structures
WetlandsengineeredMany; Medium646; 97–1810 kg ha−1 yr−1 [19,38,39]One; Medium17; 15–20% [40]420 km2 [40]Unknown
Saturated buffersMany; Medium706; 60–2190 kg ha−1 yr−1 [41,42,43]None; UnknownNo peer reviewed studies.--
Associated with small streams and drainage ditches
Vegetated ditchesMany; High1189; 150–2263 kg ha−1 yr−1 [44,45,46,47]None; UnknownNo peer reviewed studies.--
Stream RestorationMany; High2818; 47–10183 kg ha−1 yr1 [48,49,50]Few; Medium17; 13–25% [51,52]480 km2 [51]20–39% AEP [52]
Two-stage ditchesMany; Medium661; 62–1664 kg ha−1 yr−1 [53,54,55]None; UnknownNo peer reviewed studies.--
Riparian forest buffersMany; Low89; 11–285 kg ha−1 yr−1 [56,57,58,59]One; Medium20% [60]Unknown1, 39% AEP [60]
Associated with larger streams and rivers
Floodplain restorationMany; Medium596; 20–1226 kg ha−1 yr−1 [38,50,61]Many; Medium17; 10–24% [62,63,64]115–901 km2 [62,63,64]1, 2, 4, 7, 10, 20, 39% AEP [62,63]
Note(s): AEP: Annual Exceedance Probability.
Publisher’s Note: MDPI stays neutral with regard to jurisdictional claims in published maps and institutional affiliations.

