Short-Term River Flood Forecasting Using Composite Models and Automated Machine Learning: The Case Study of Lena River

 ,
, 
 and
and
Abstract
1. Introduction
1.1. Modelling of the River Floods
1.2. Existing Methods and Models for Flood Forecasting
2. Materials and Methods
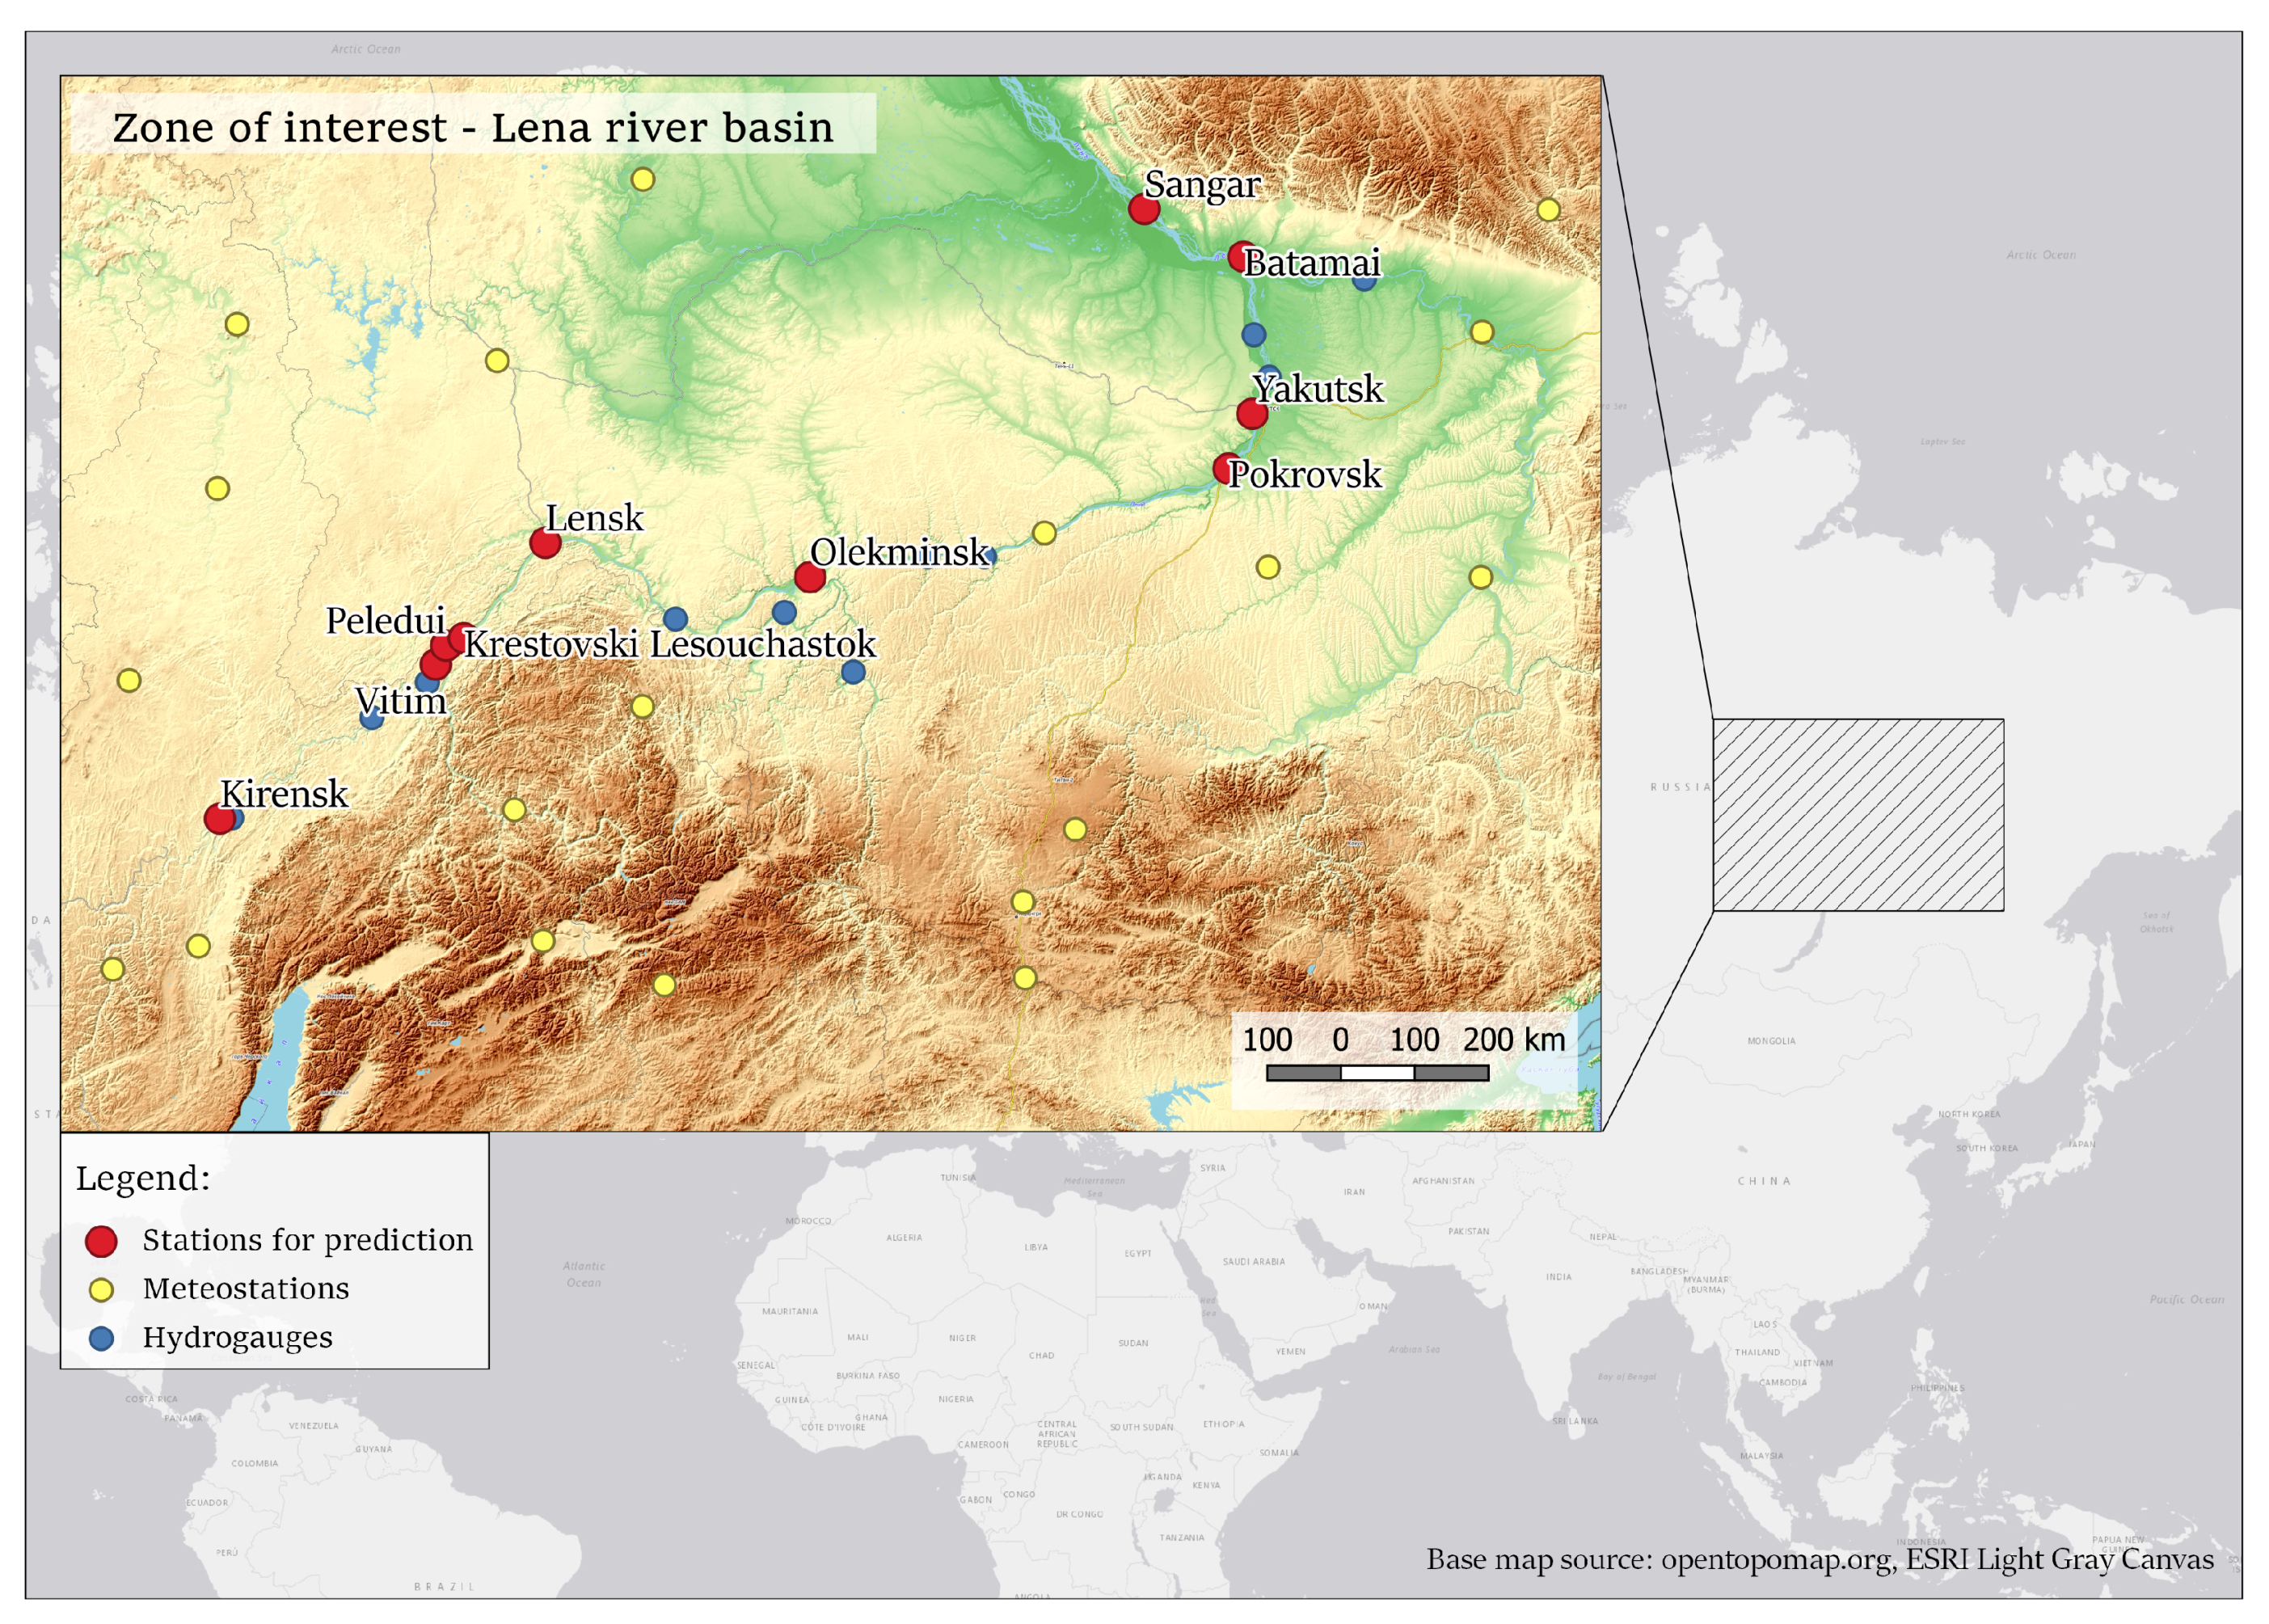
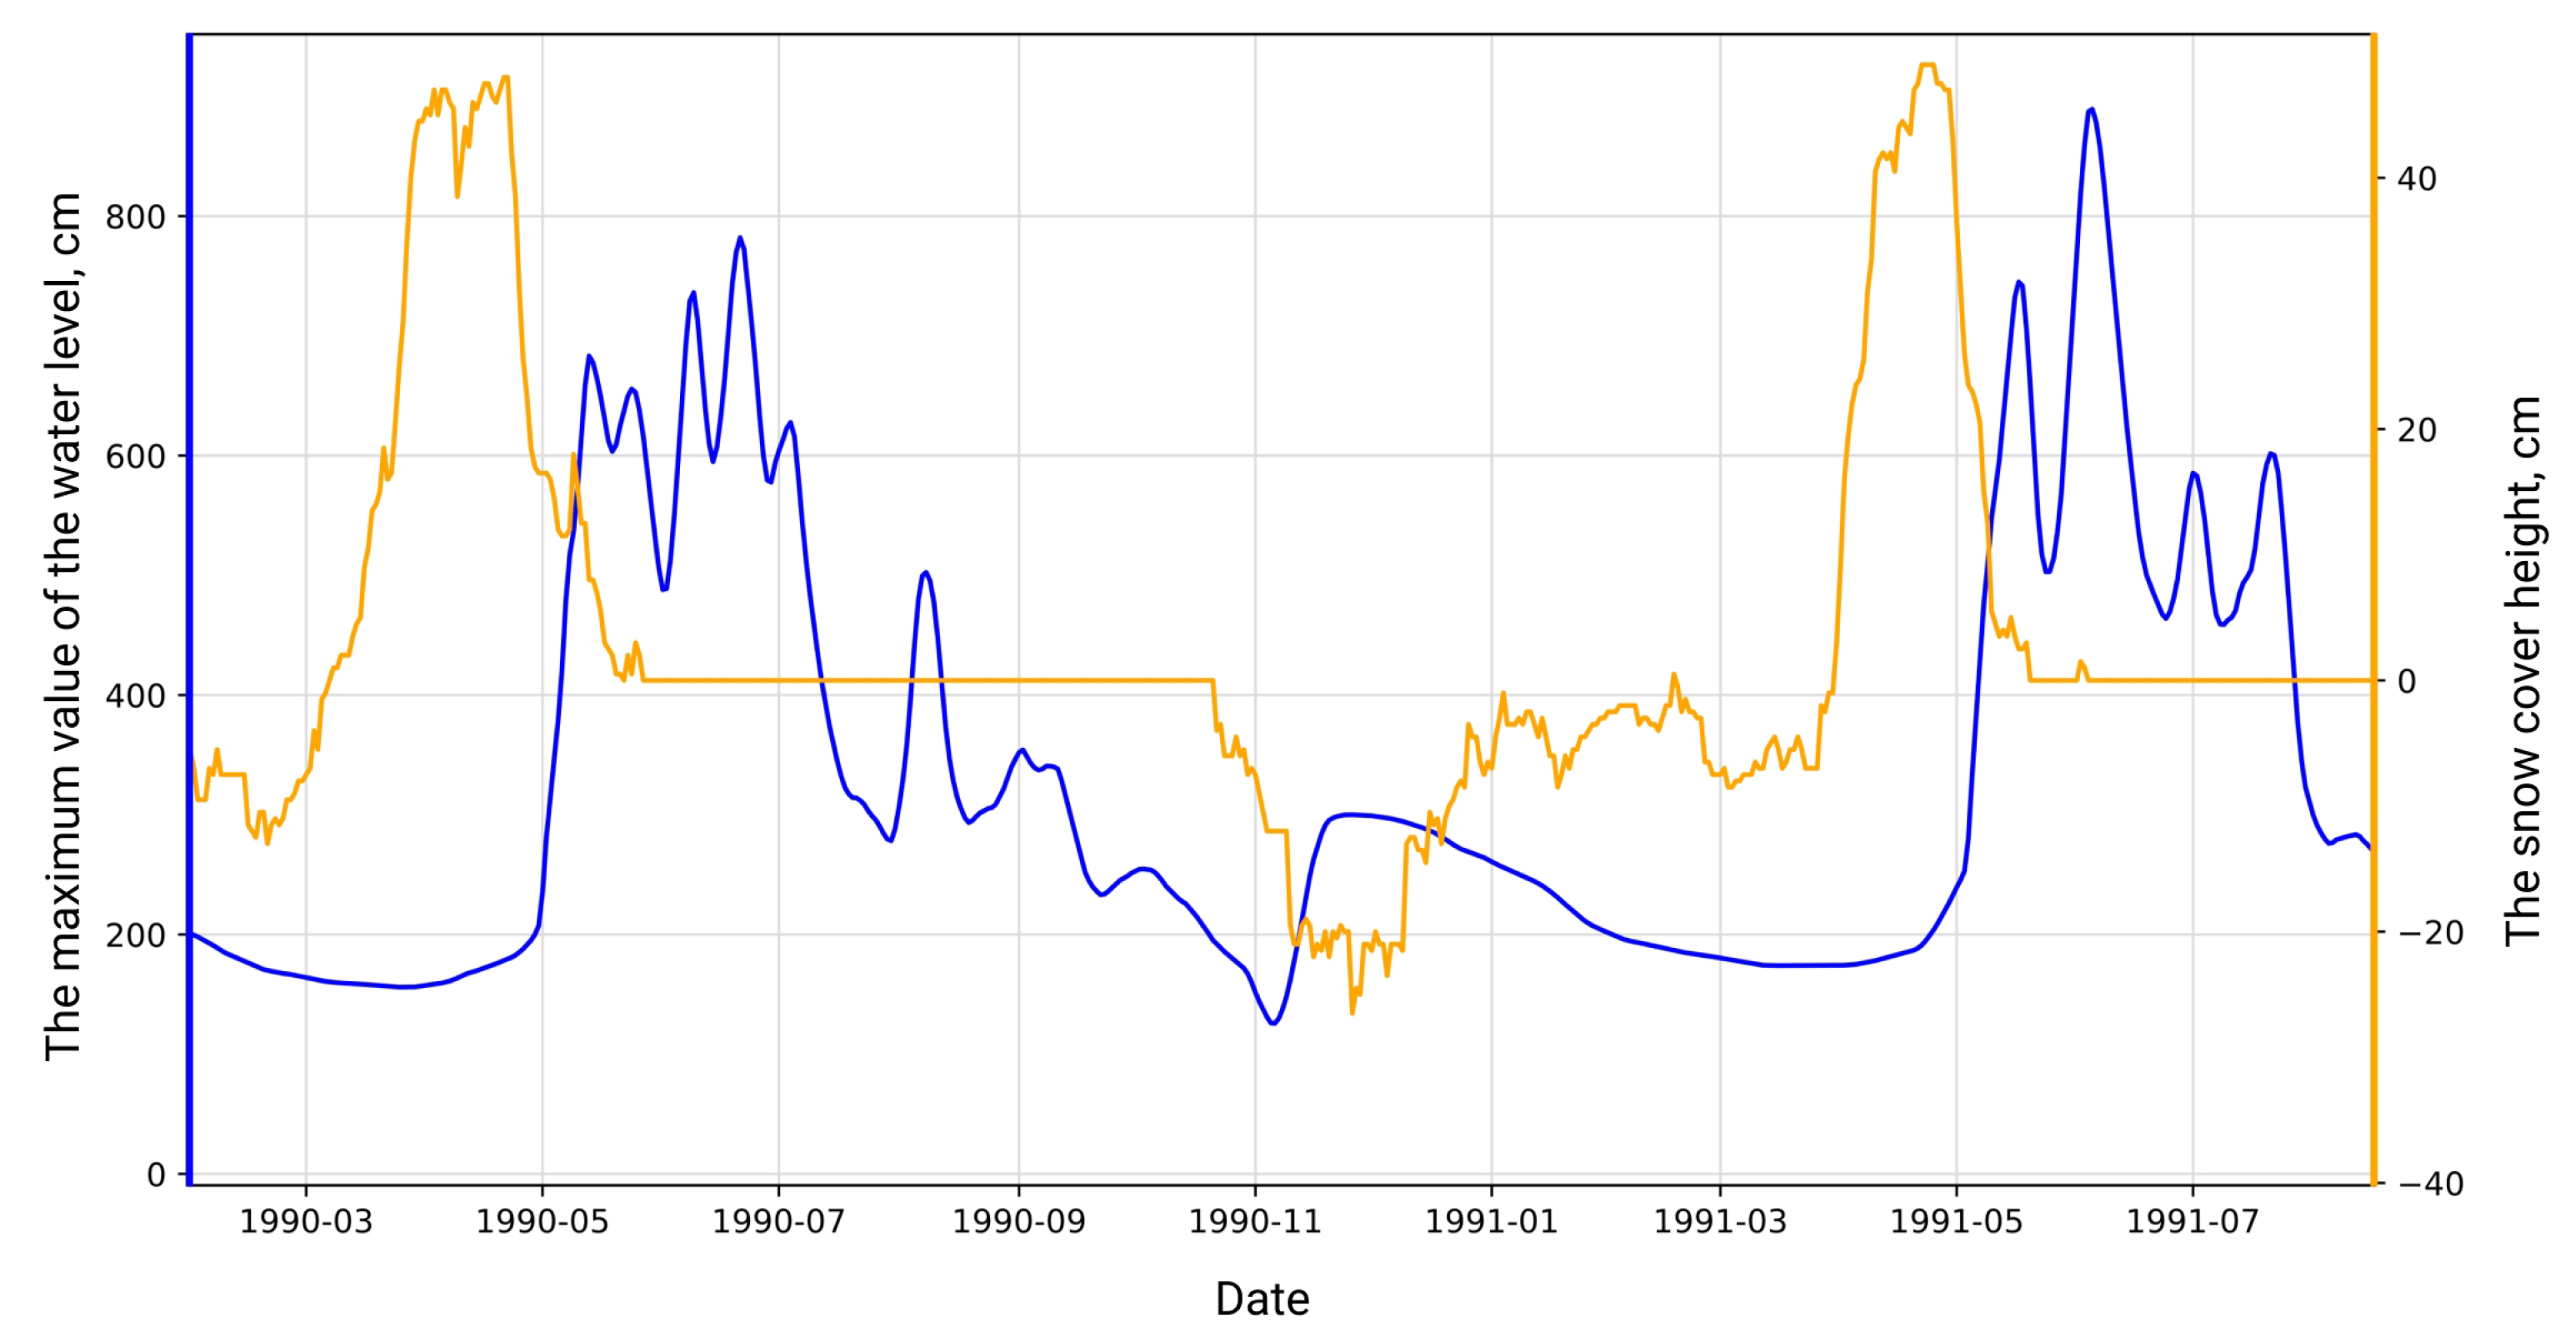
2.1. Input Data for Case Study
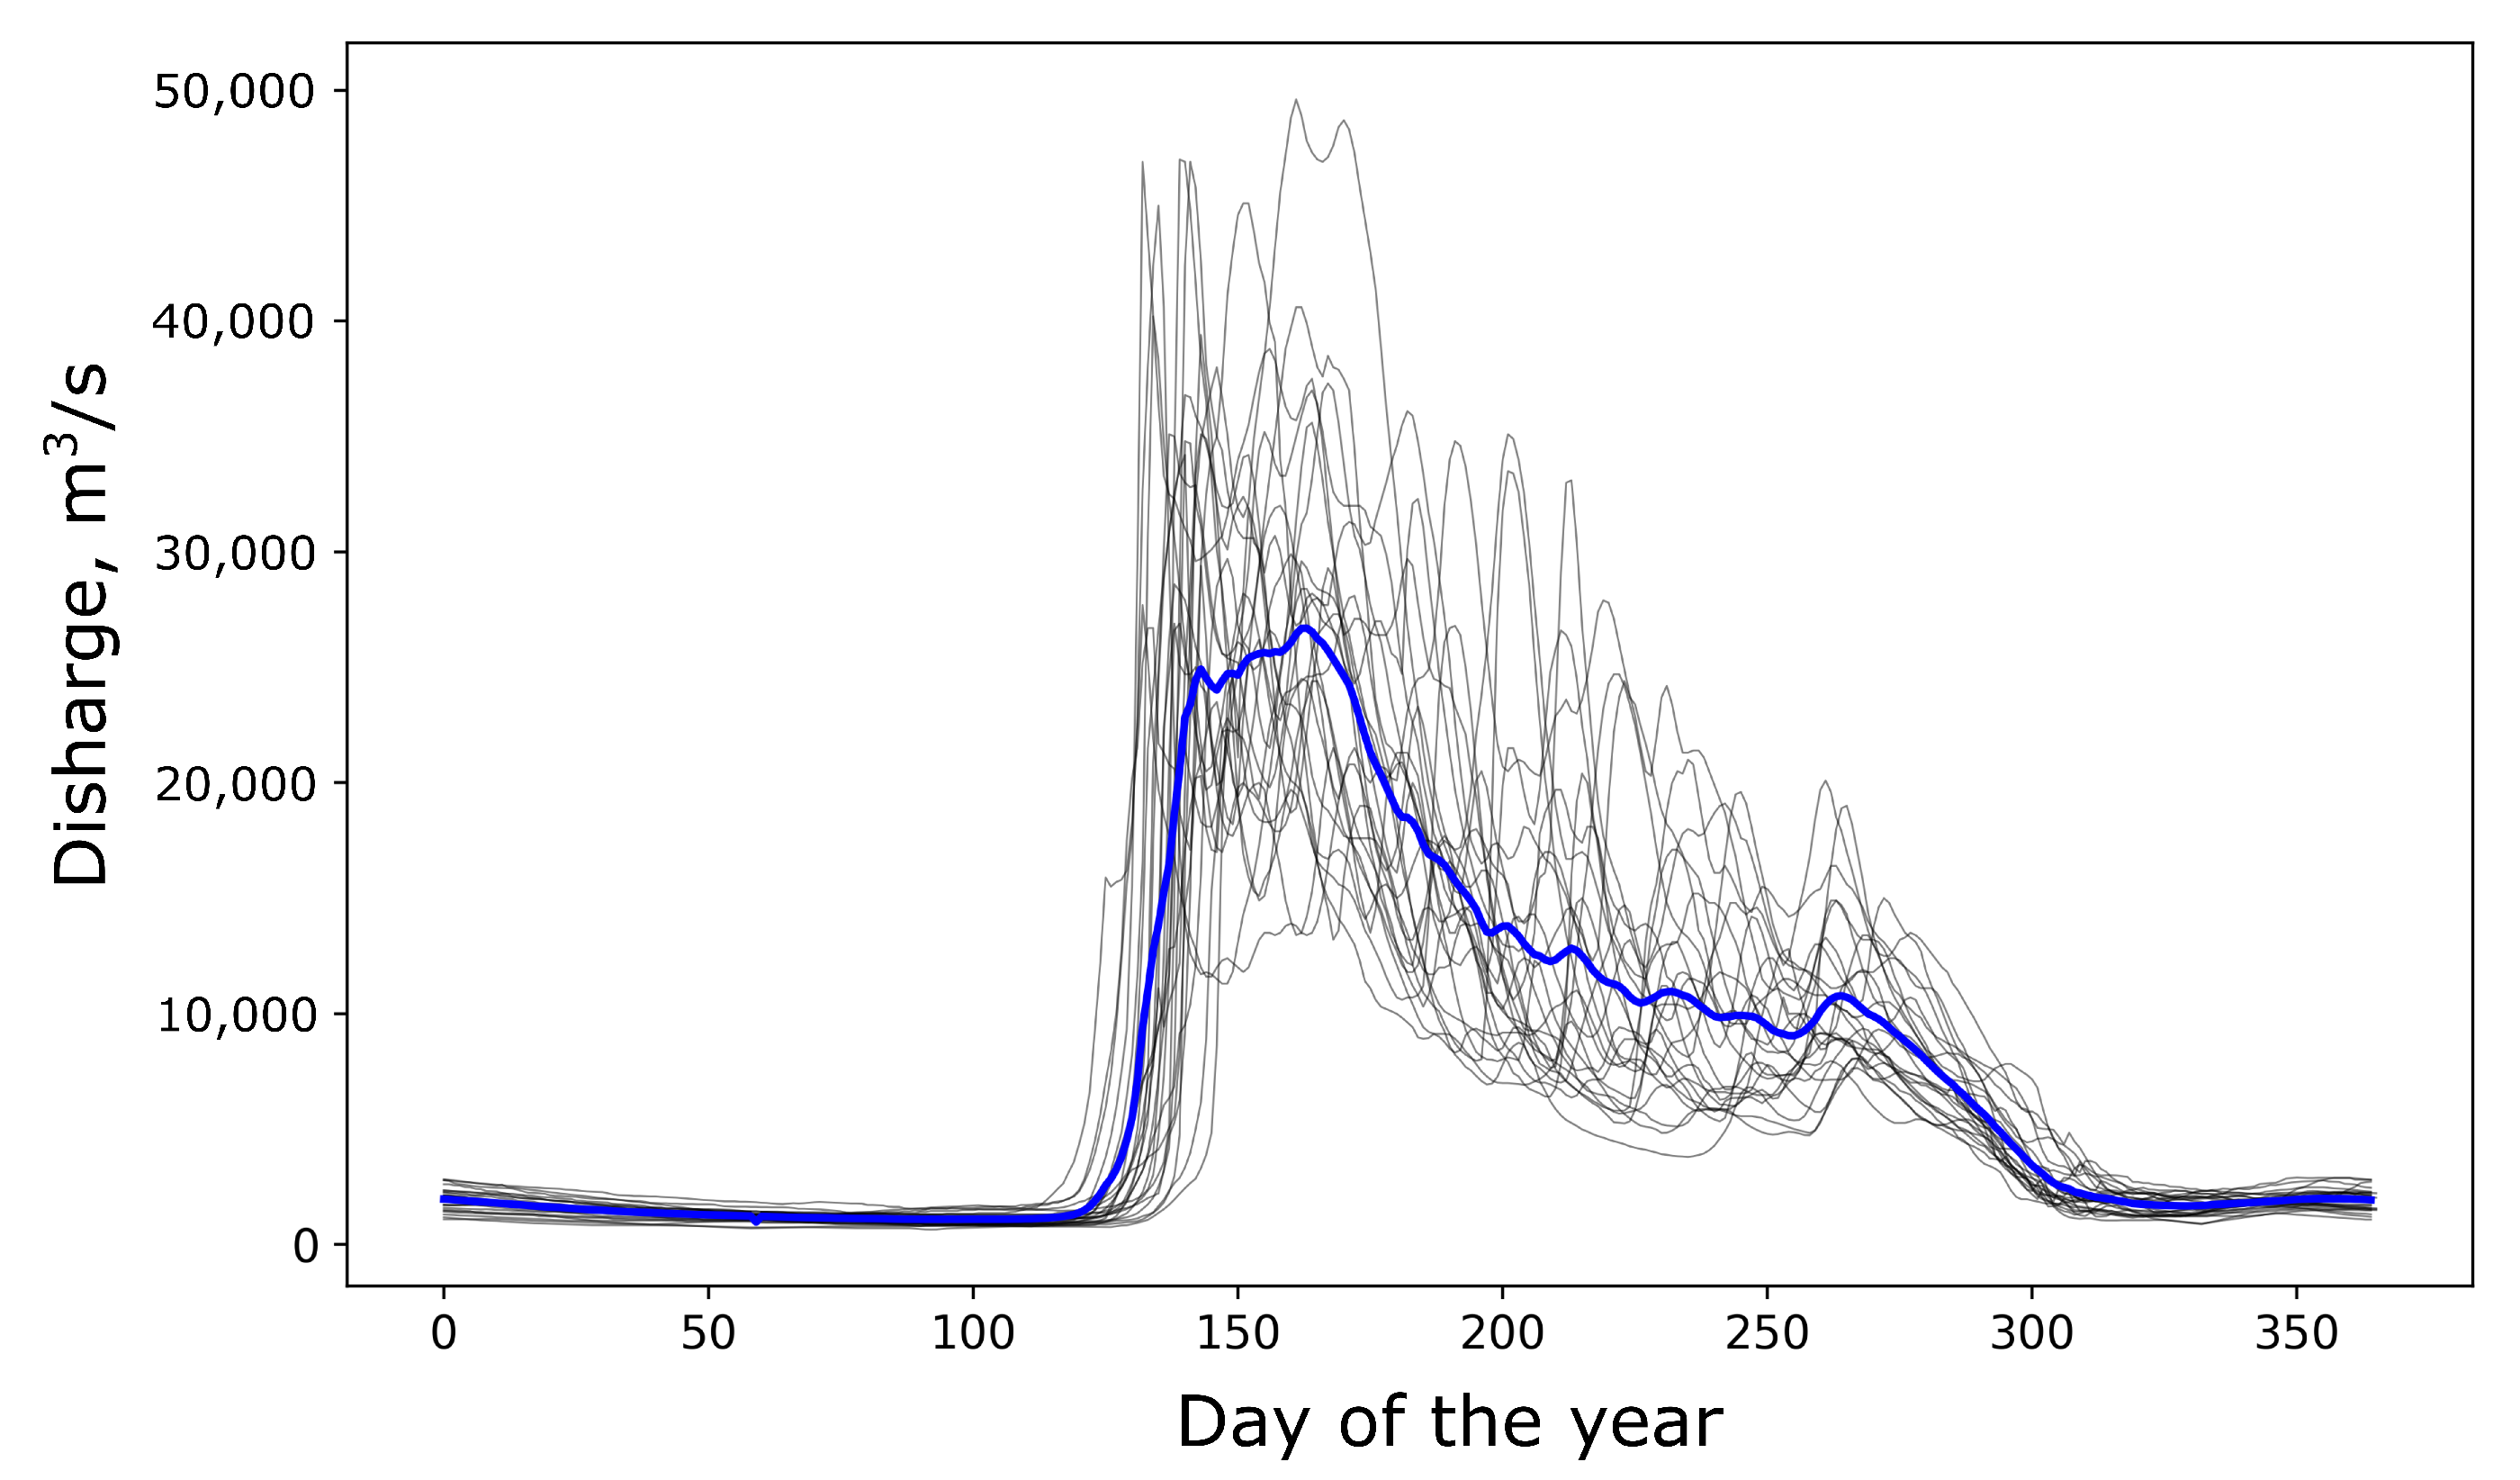
- Large amounts of precipitation during autumn;
- Low temperatures during winter with extensive accumulation of snow;
- Early prosperous spring with rapid increasing of daily temperature;
- Heavy precipitation during snowmelt.
- Water levels at gauging stations in the form of time series with daily time resolution;
- Meteorological parameters measured near the level gauging stations and additional information about the events at the river;
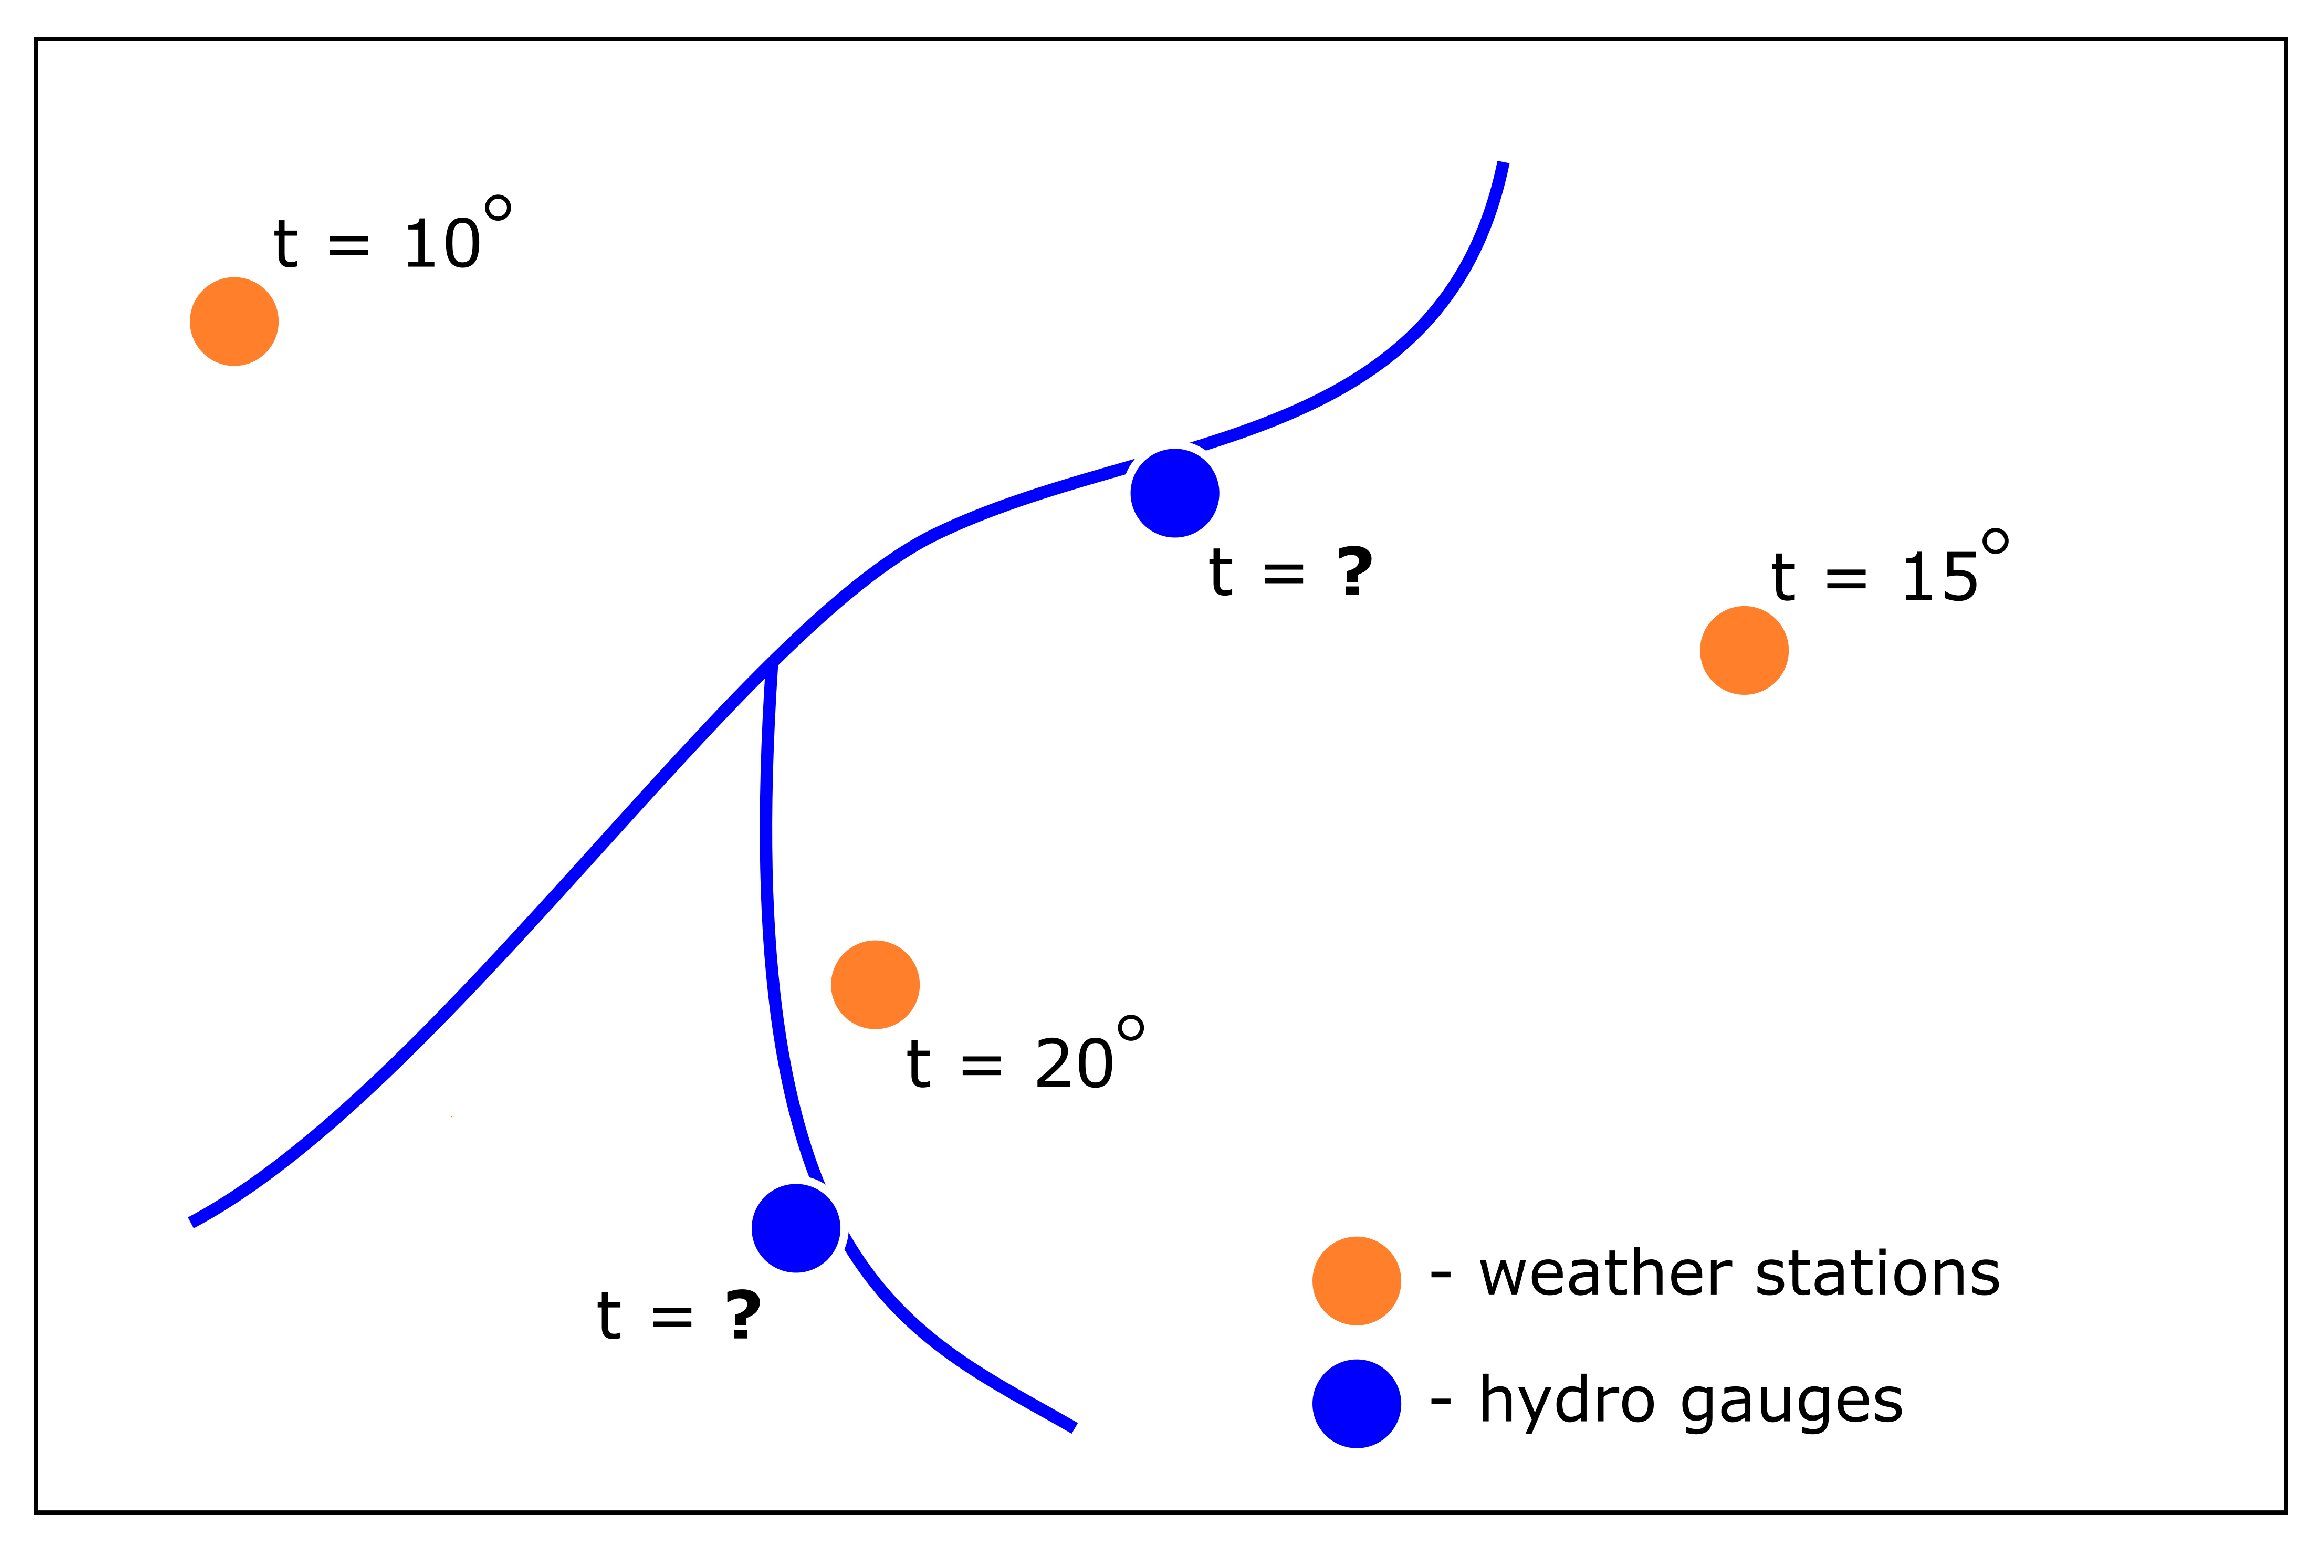
- Meteorological parameters from weather stations. Time resolution for parameters may differ from three hours to daily. This data refers to points located at some distance from level gauging stations;
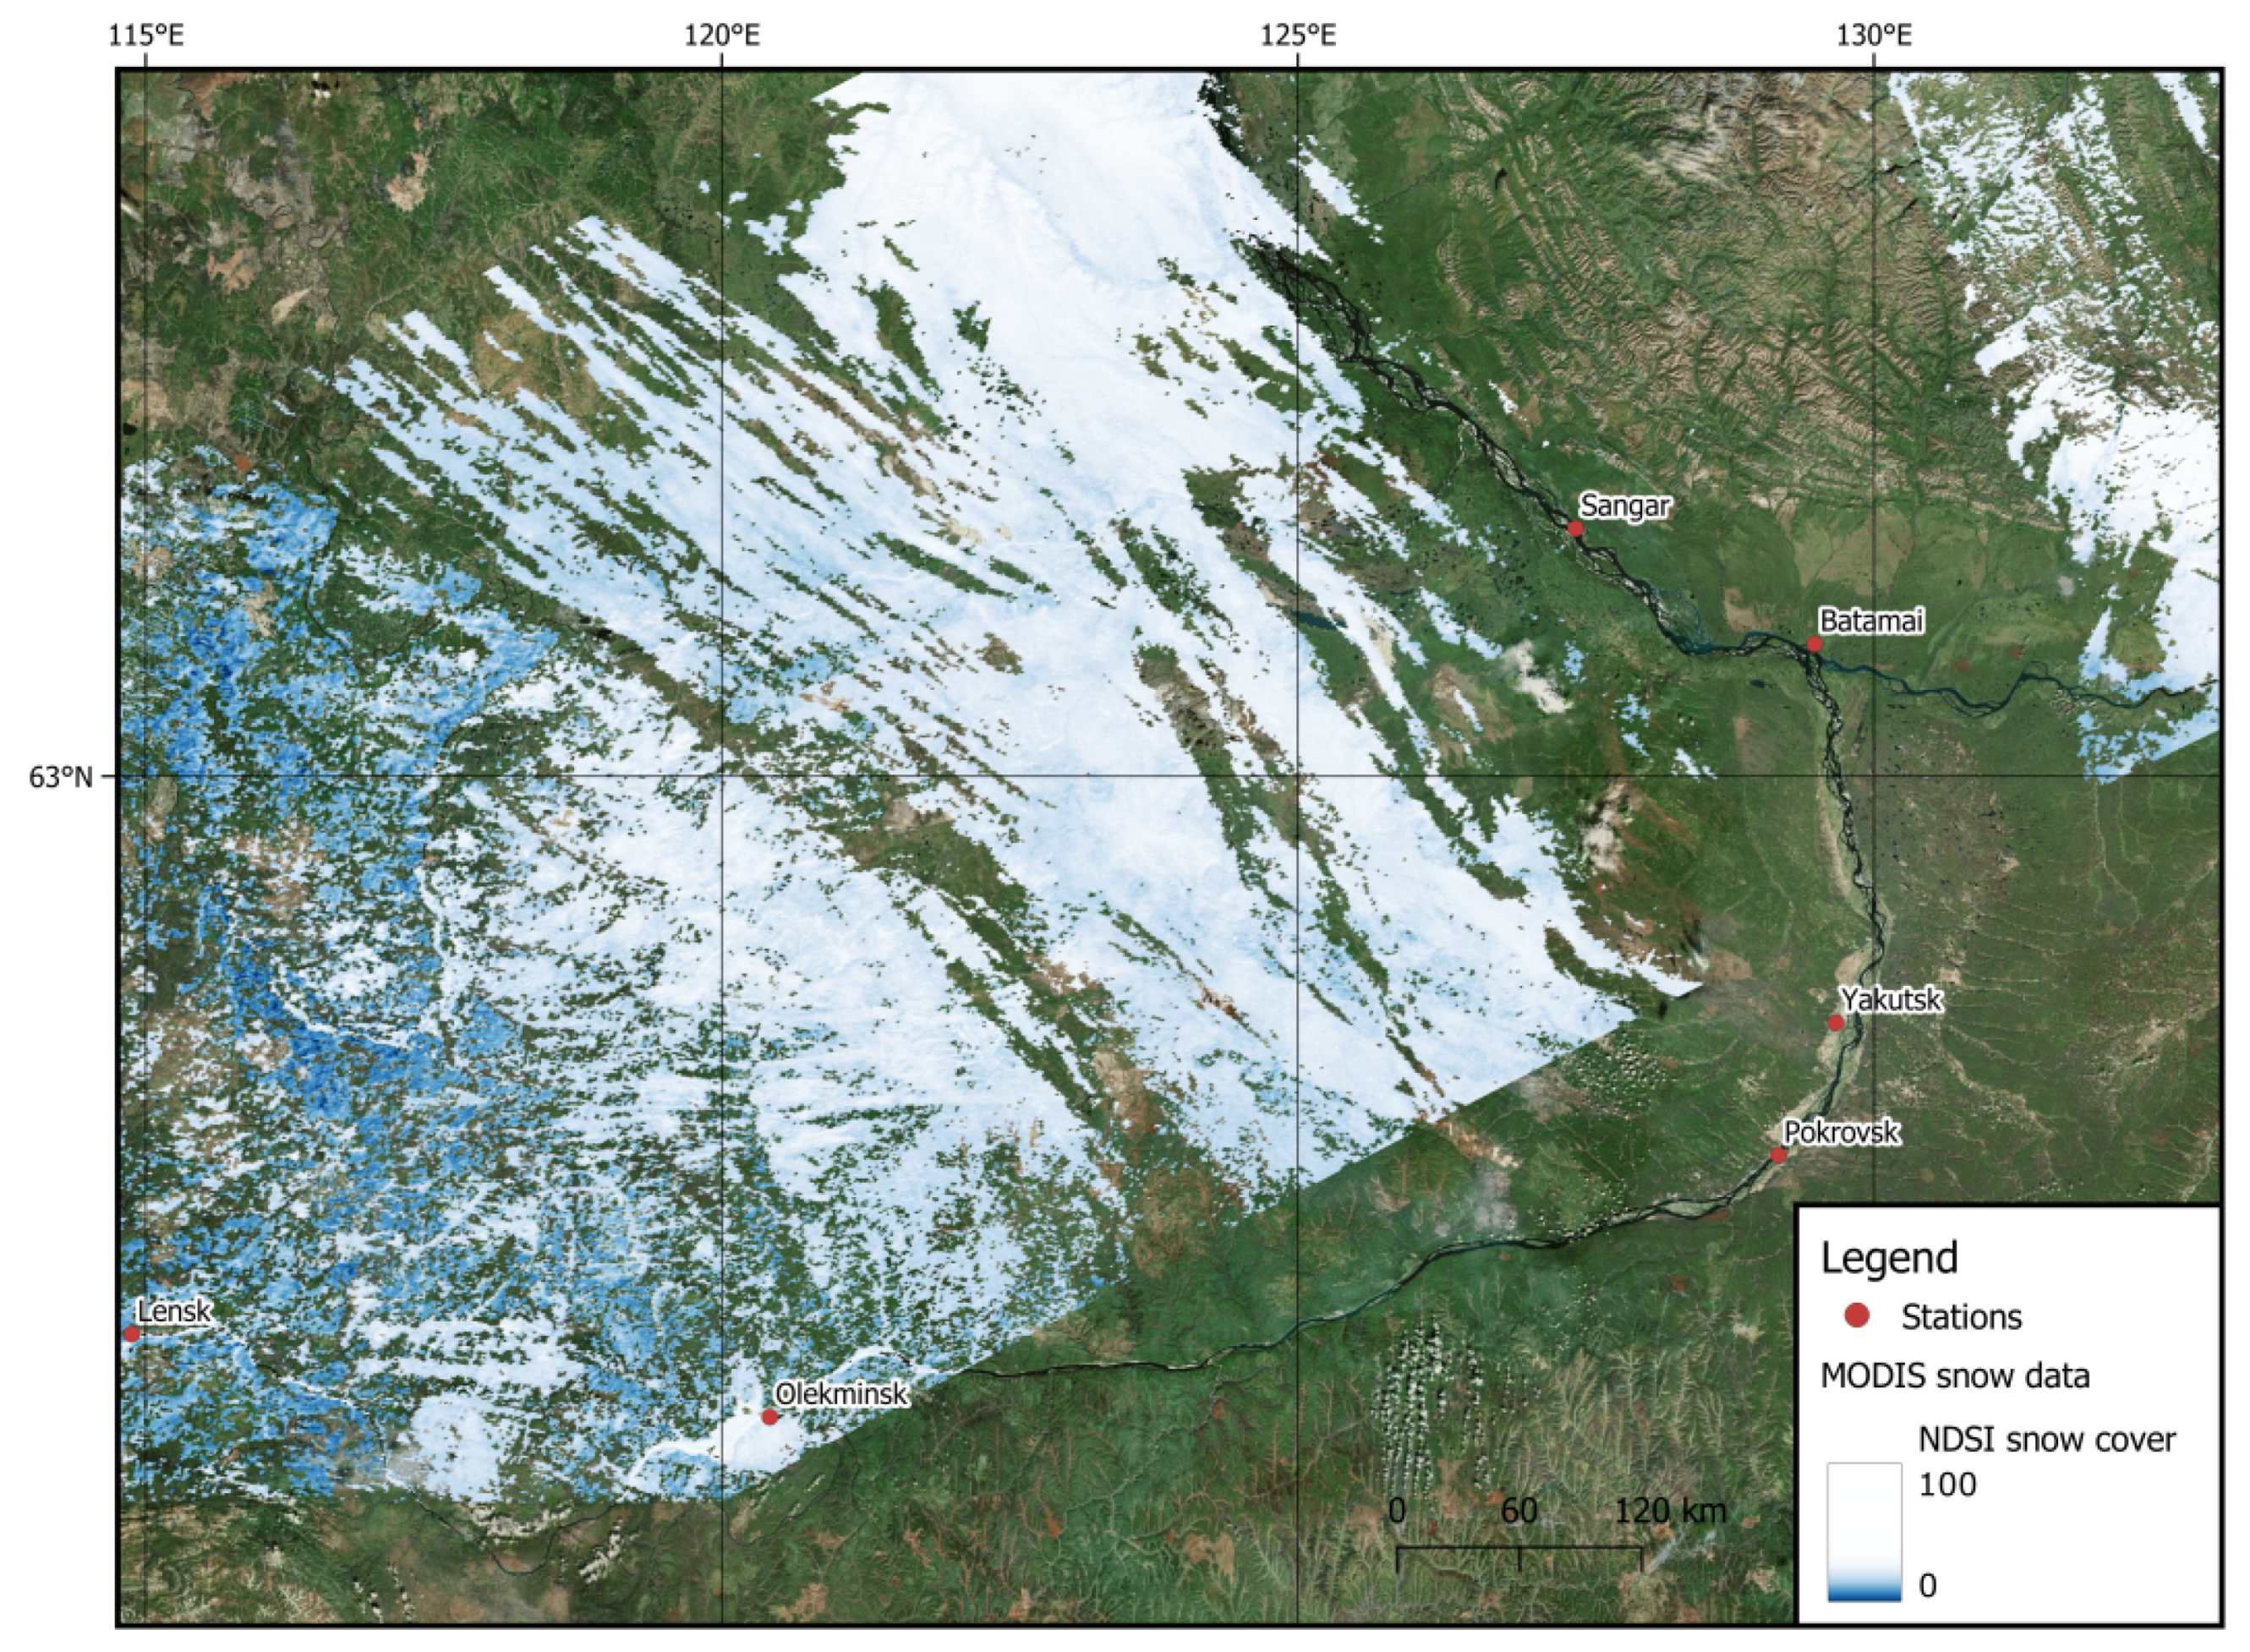
- Additional information, derived from open sources, such as remote sensing data from MODIS sensor.
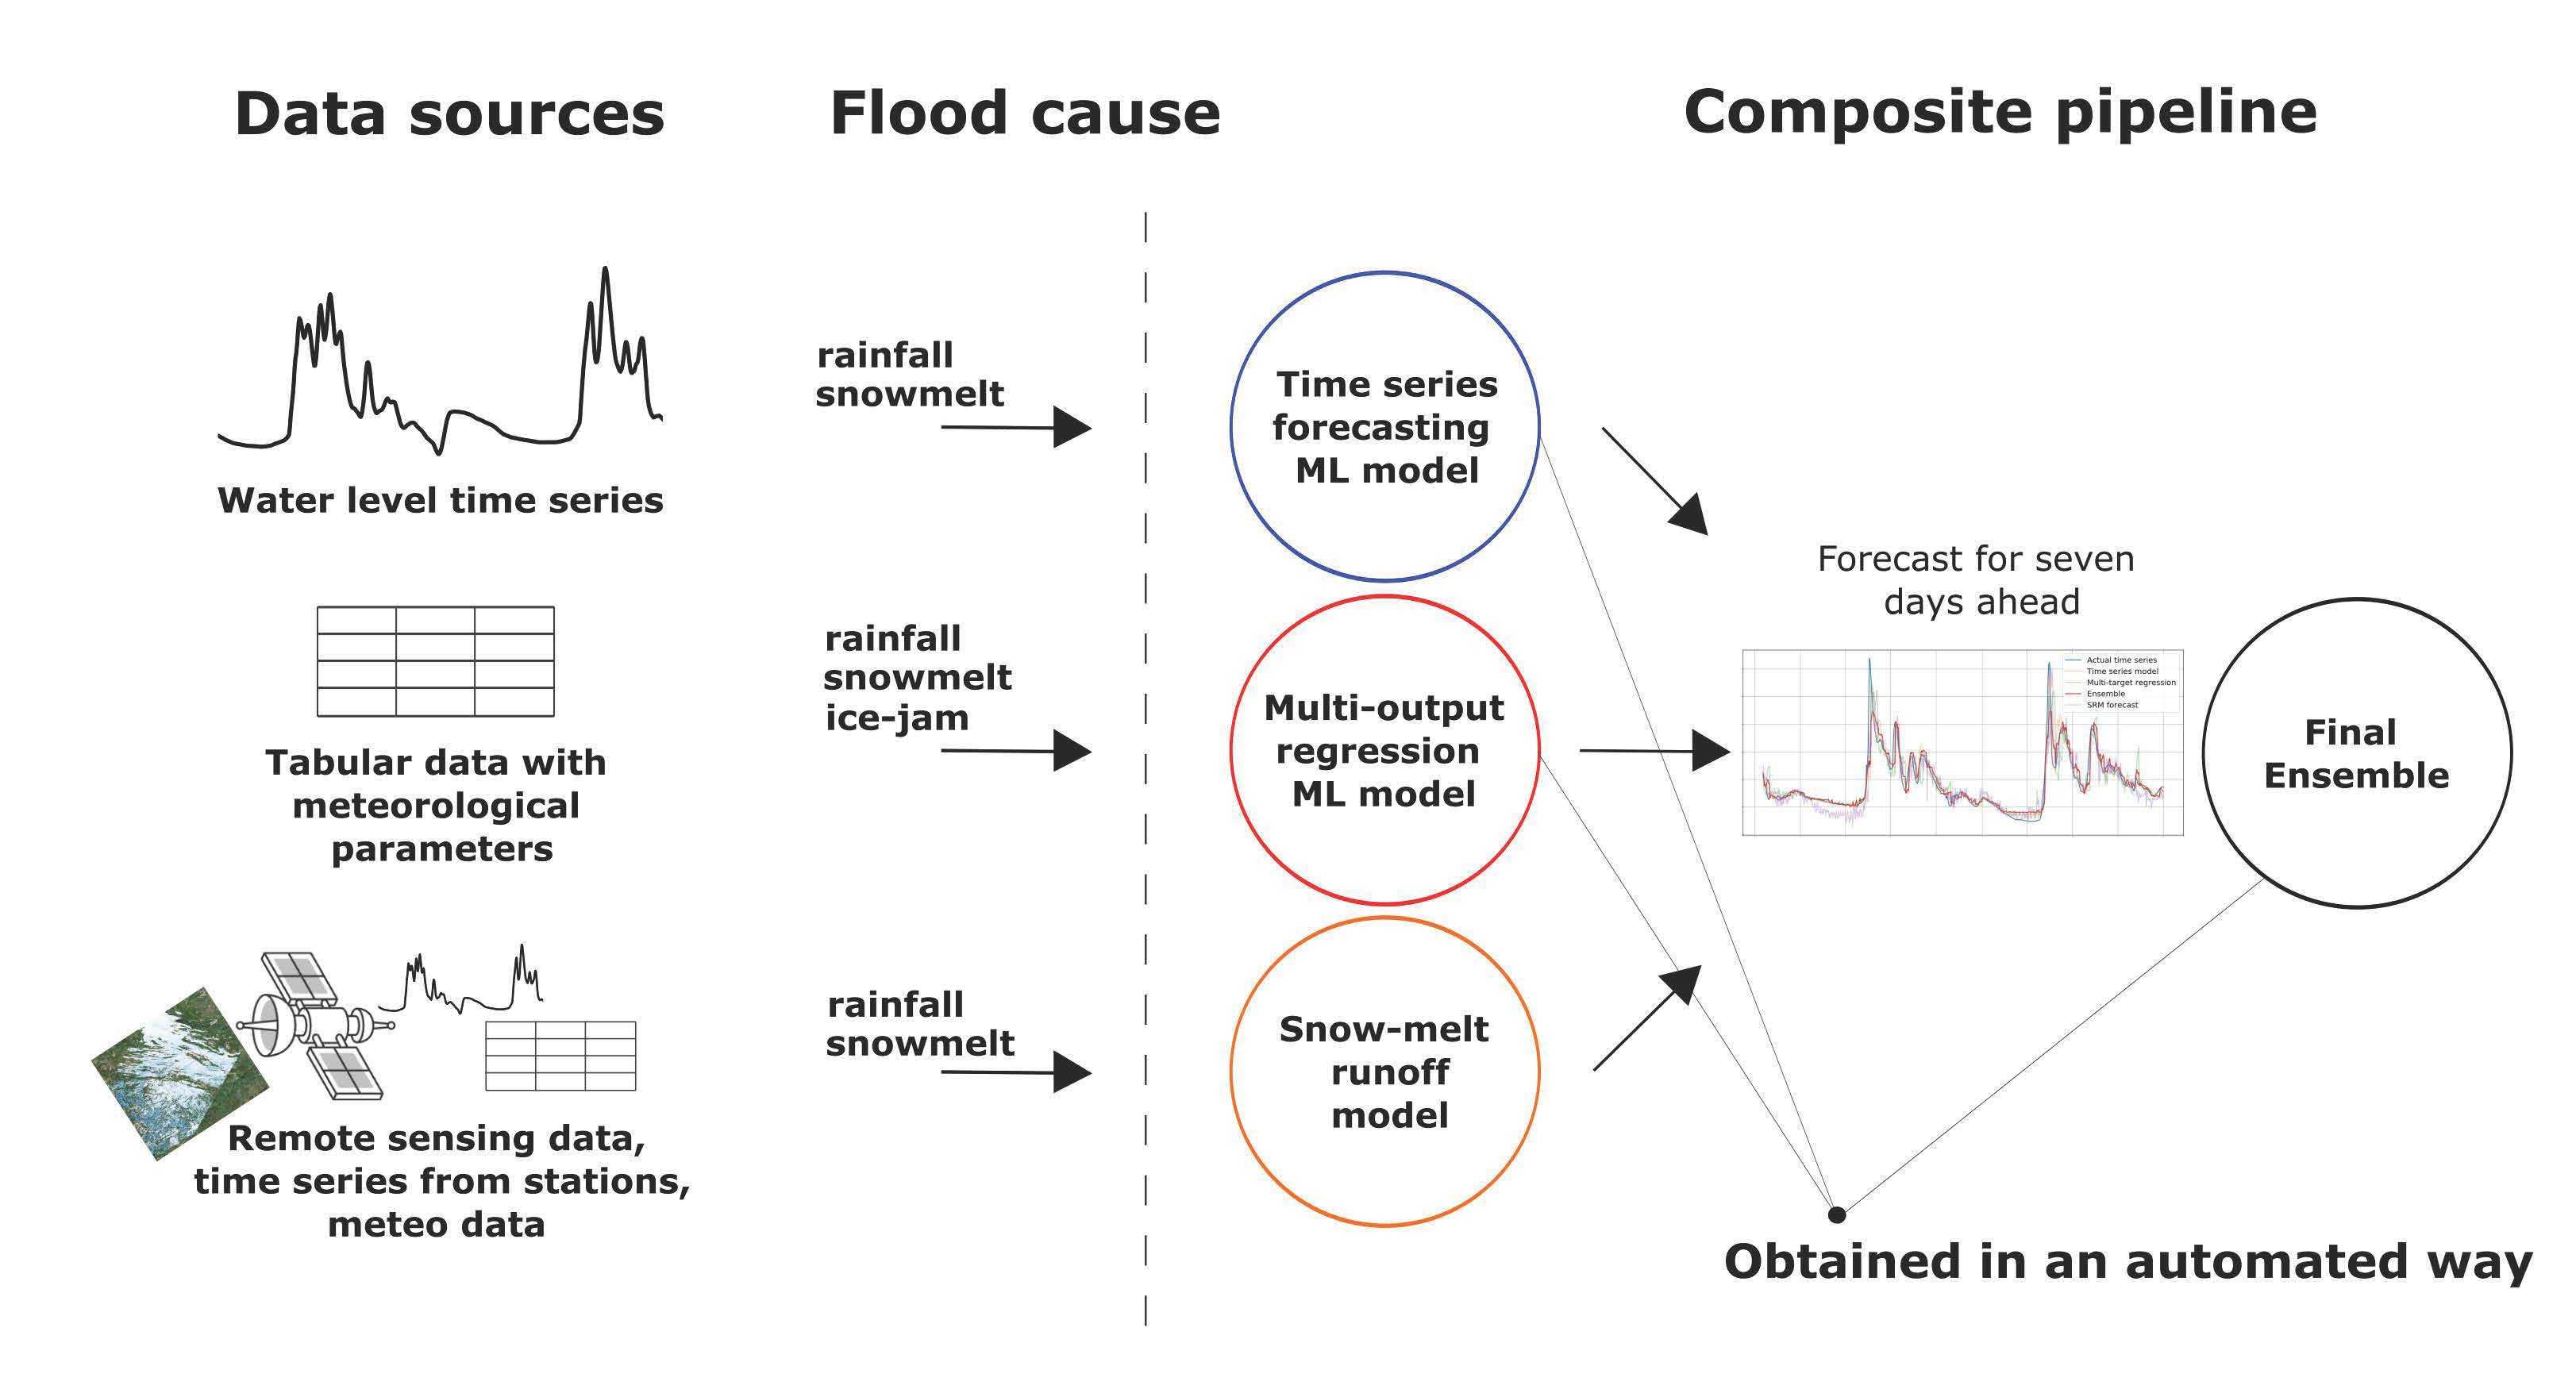
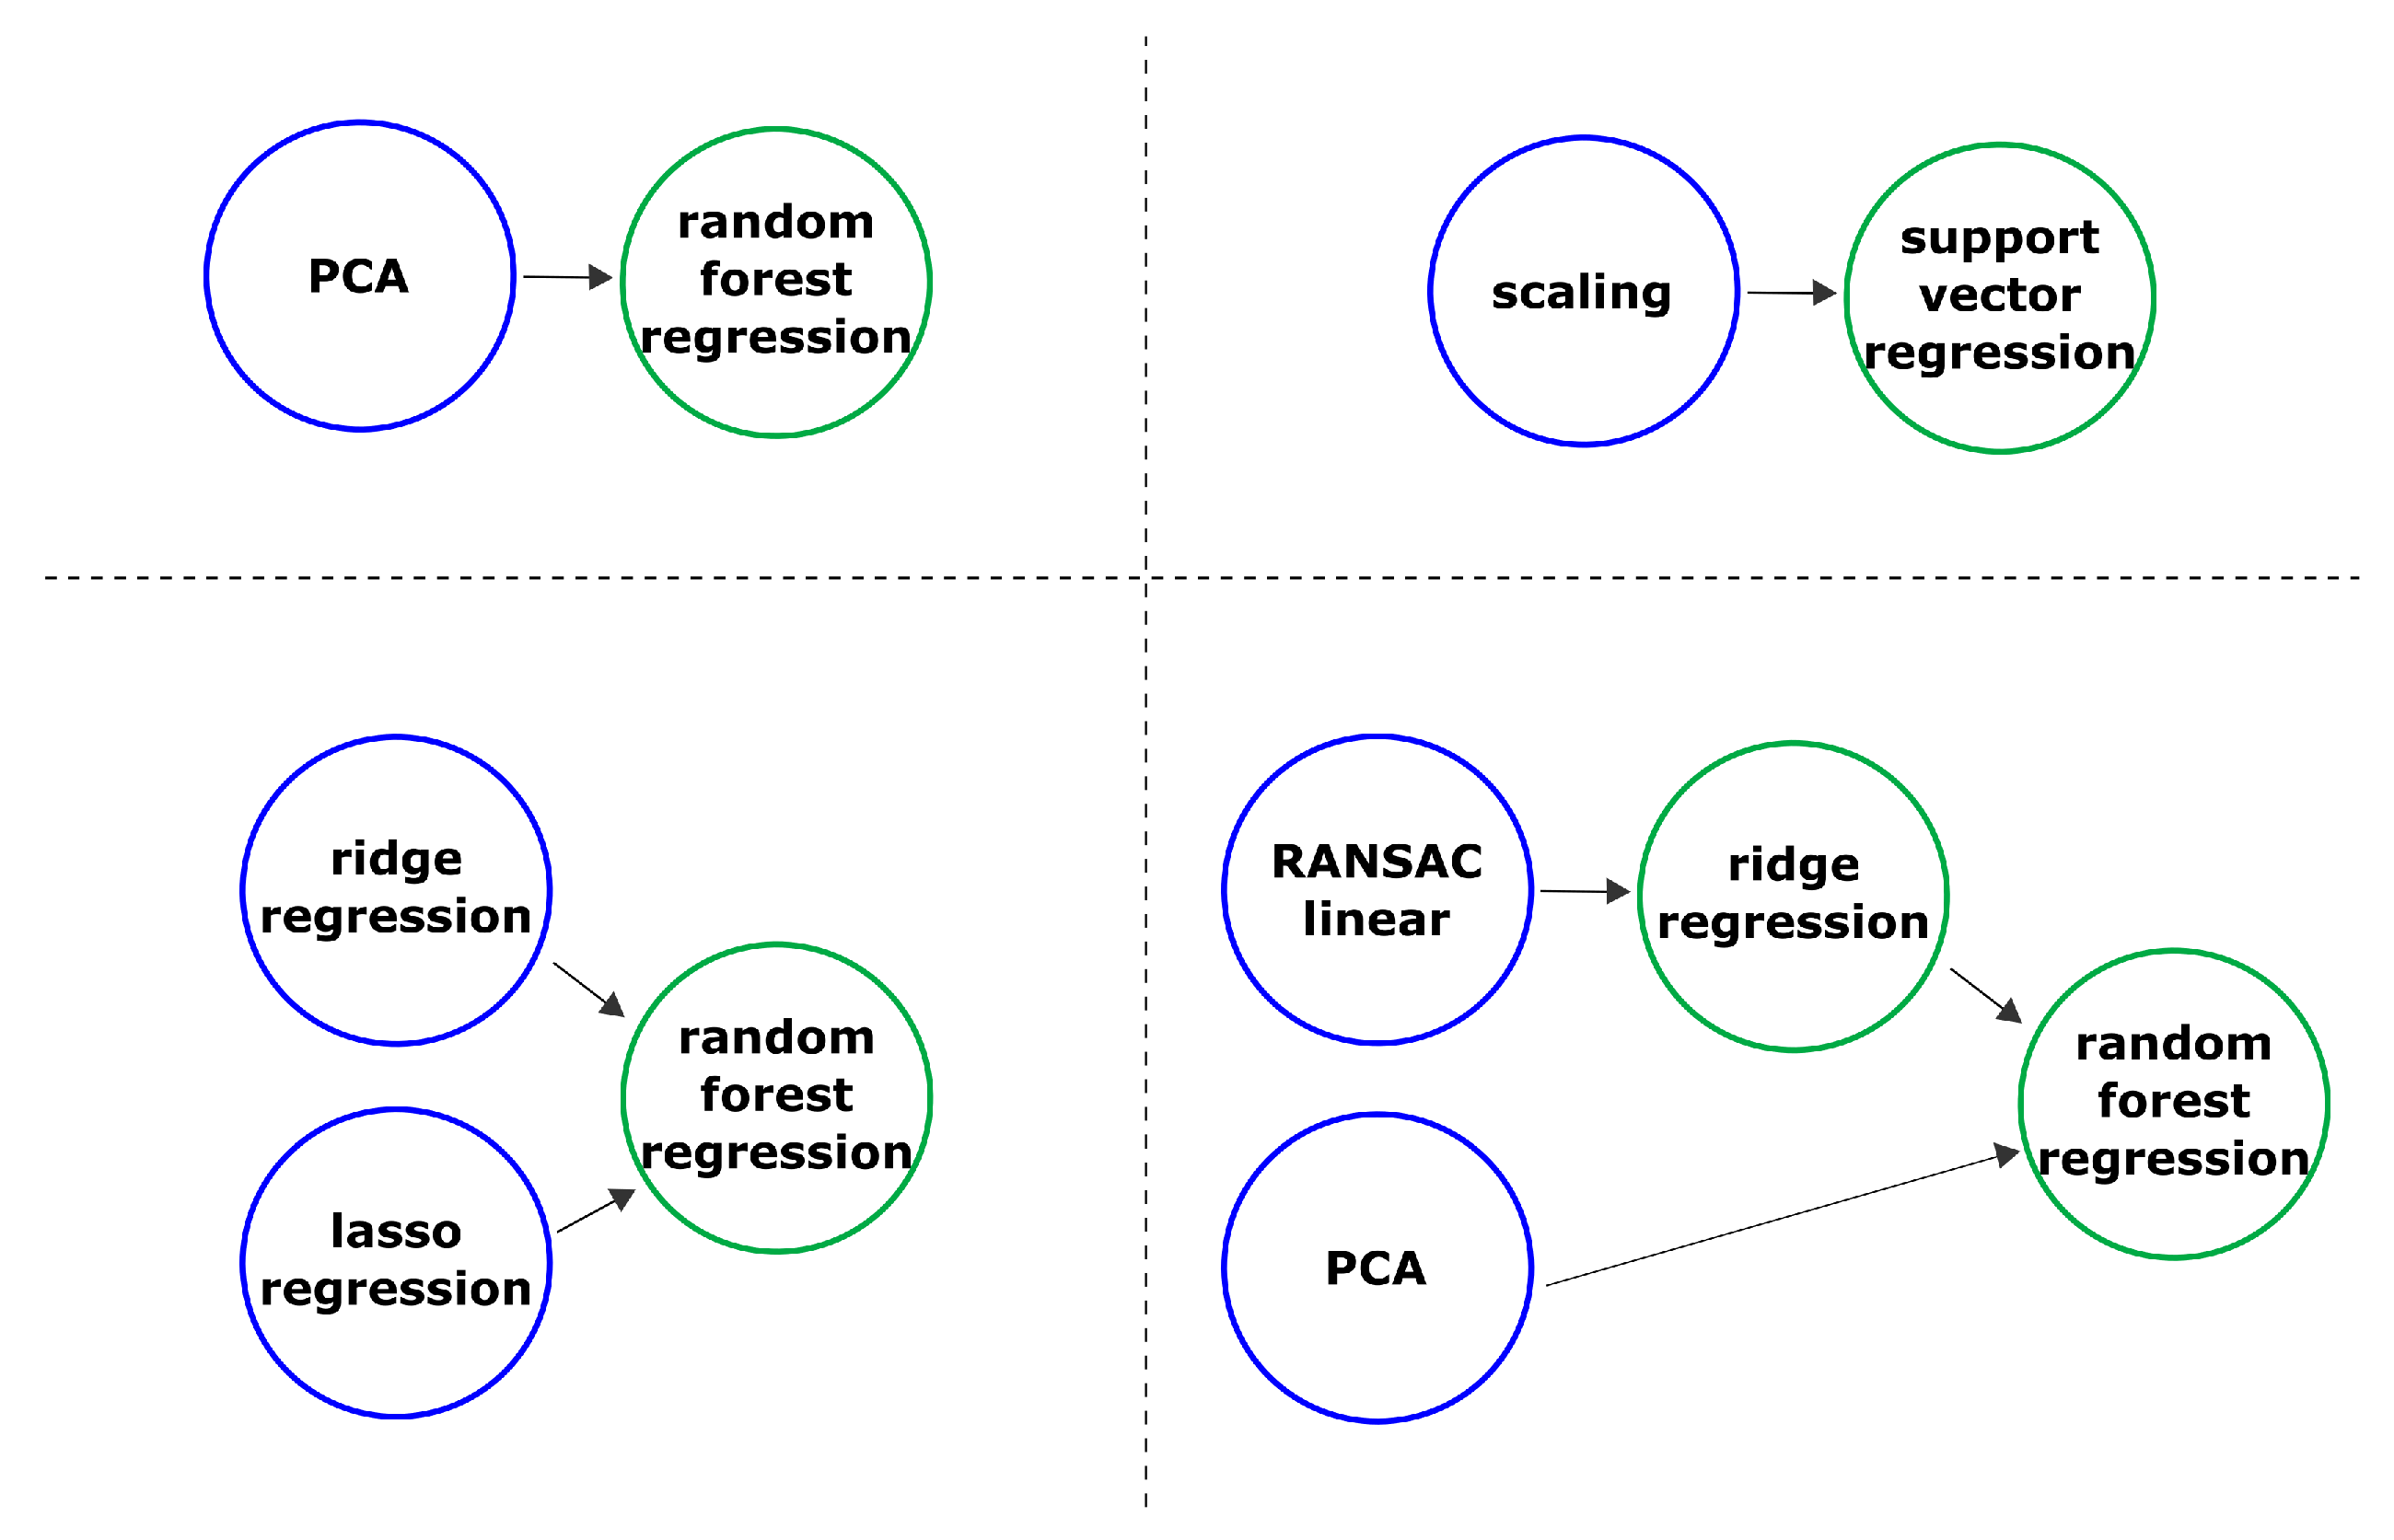
2.2. Composite Modelling Approach
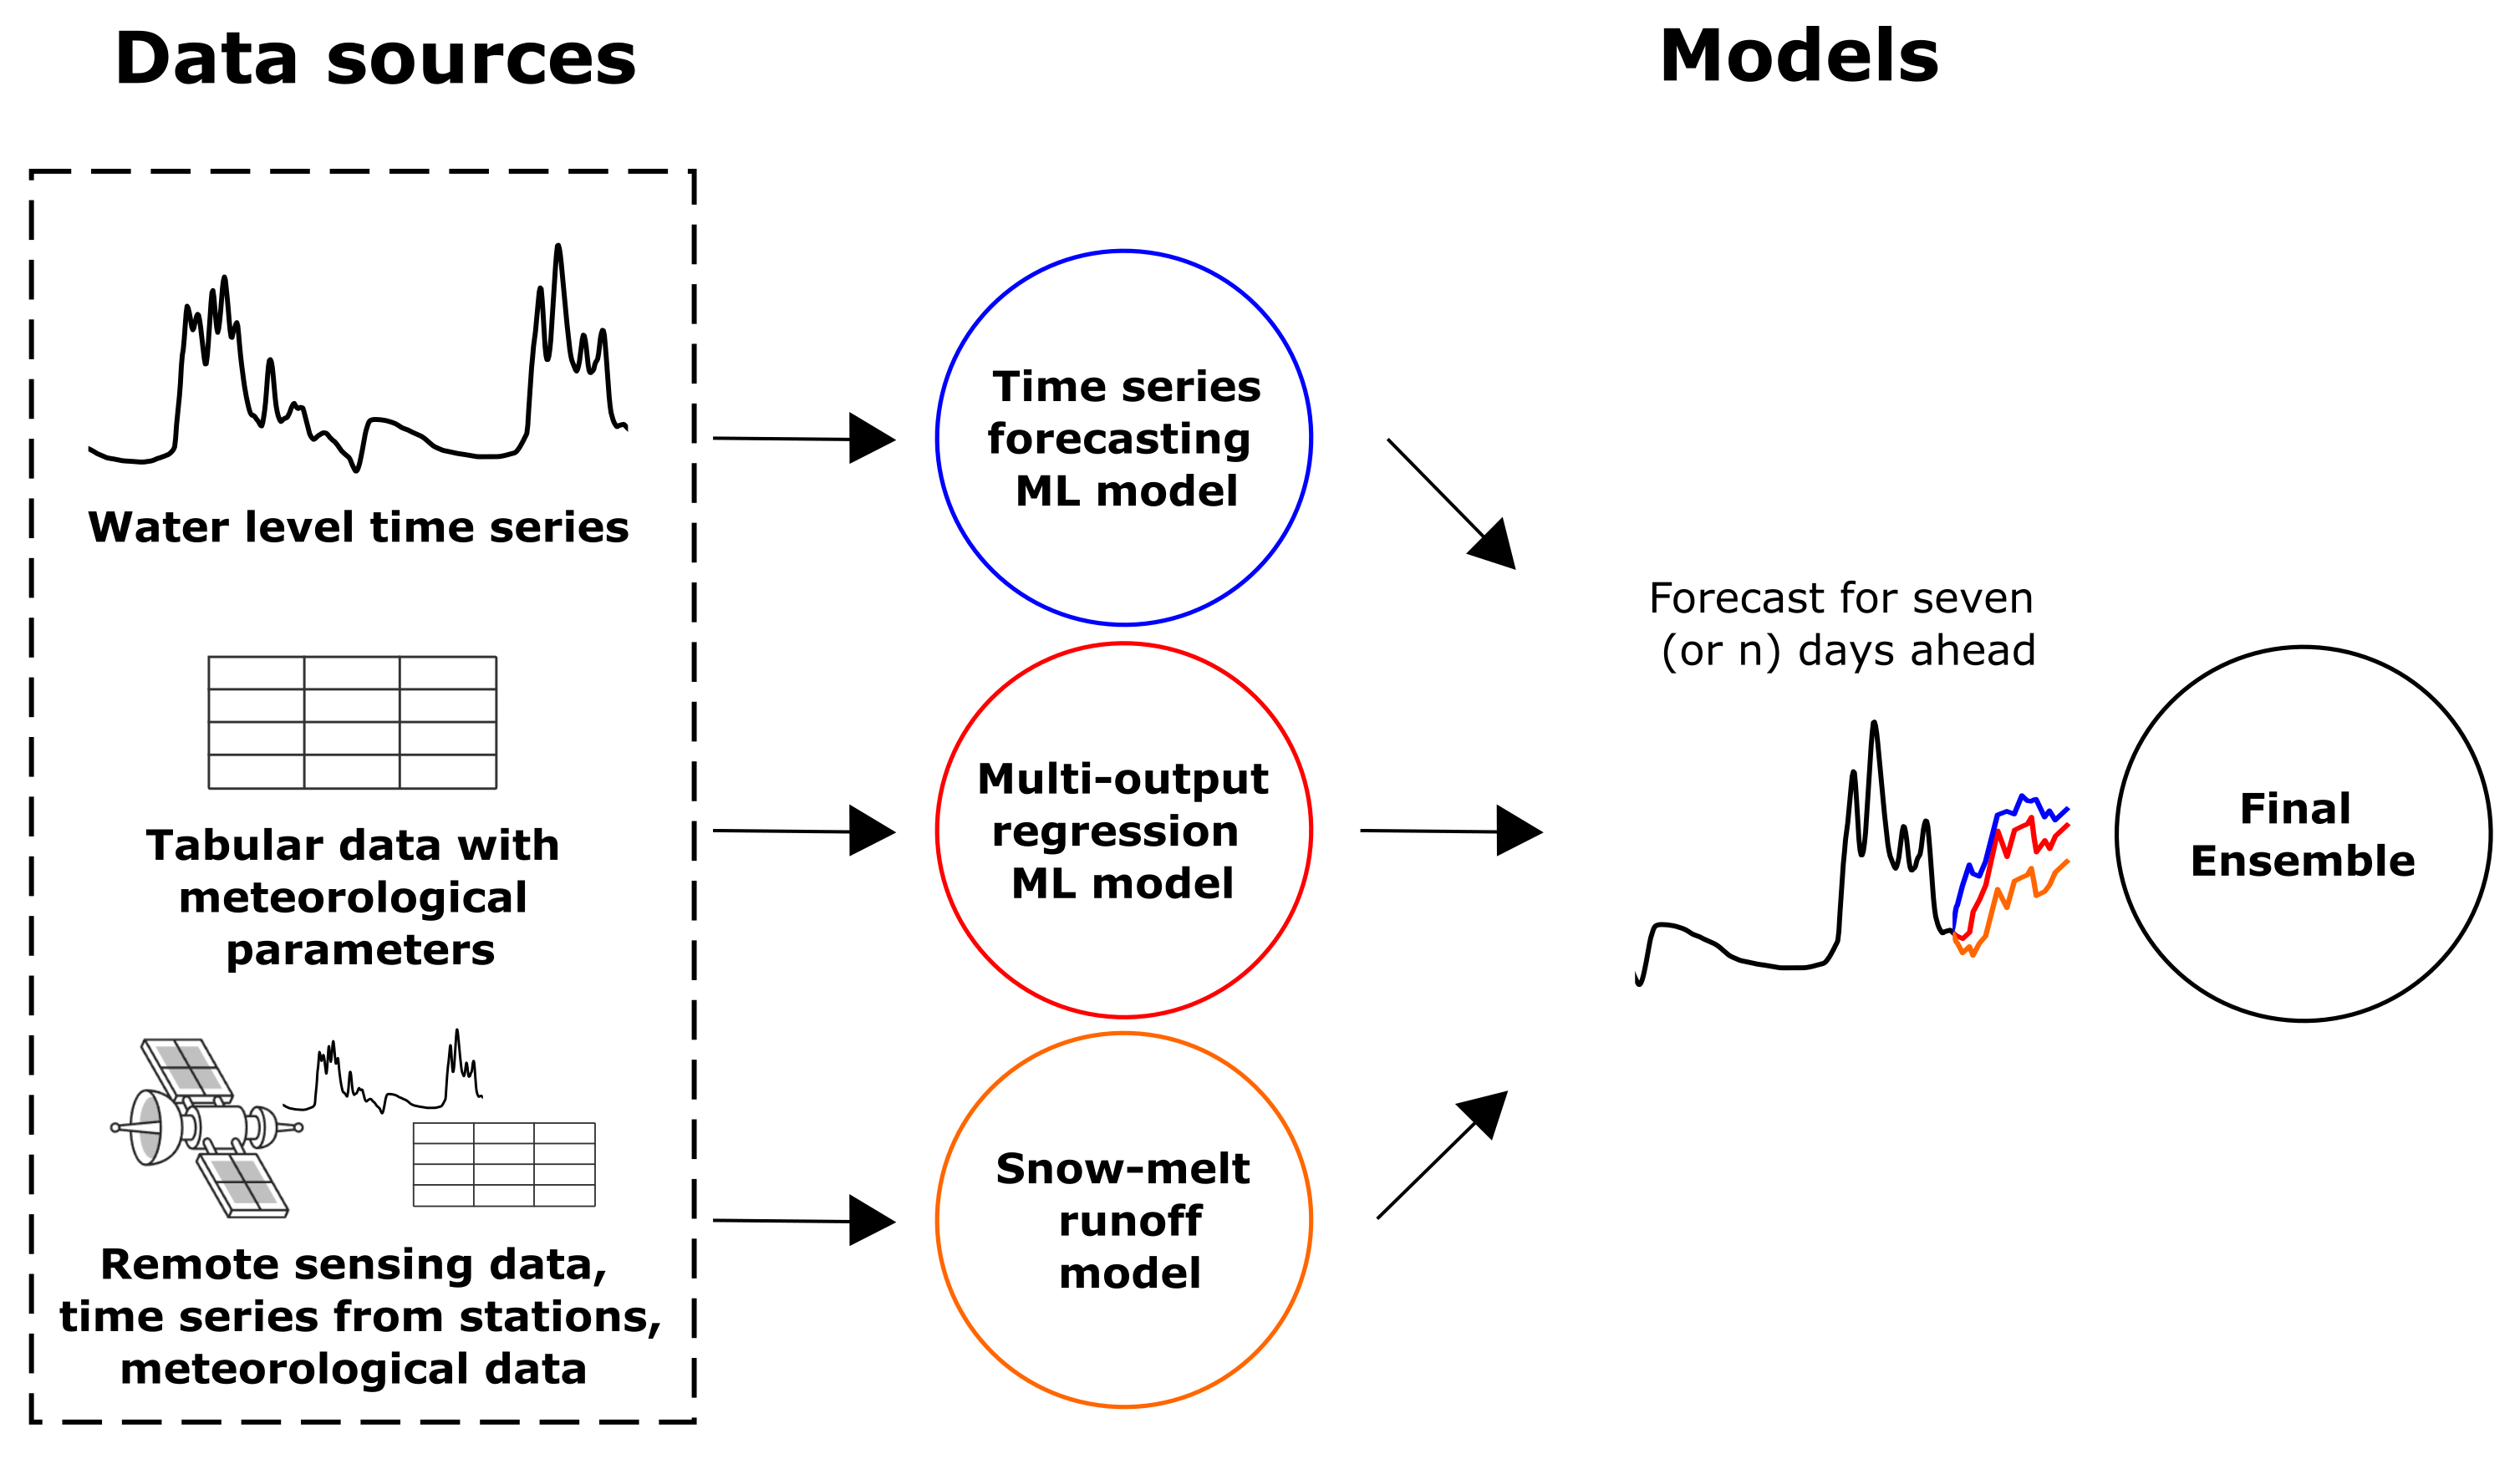
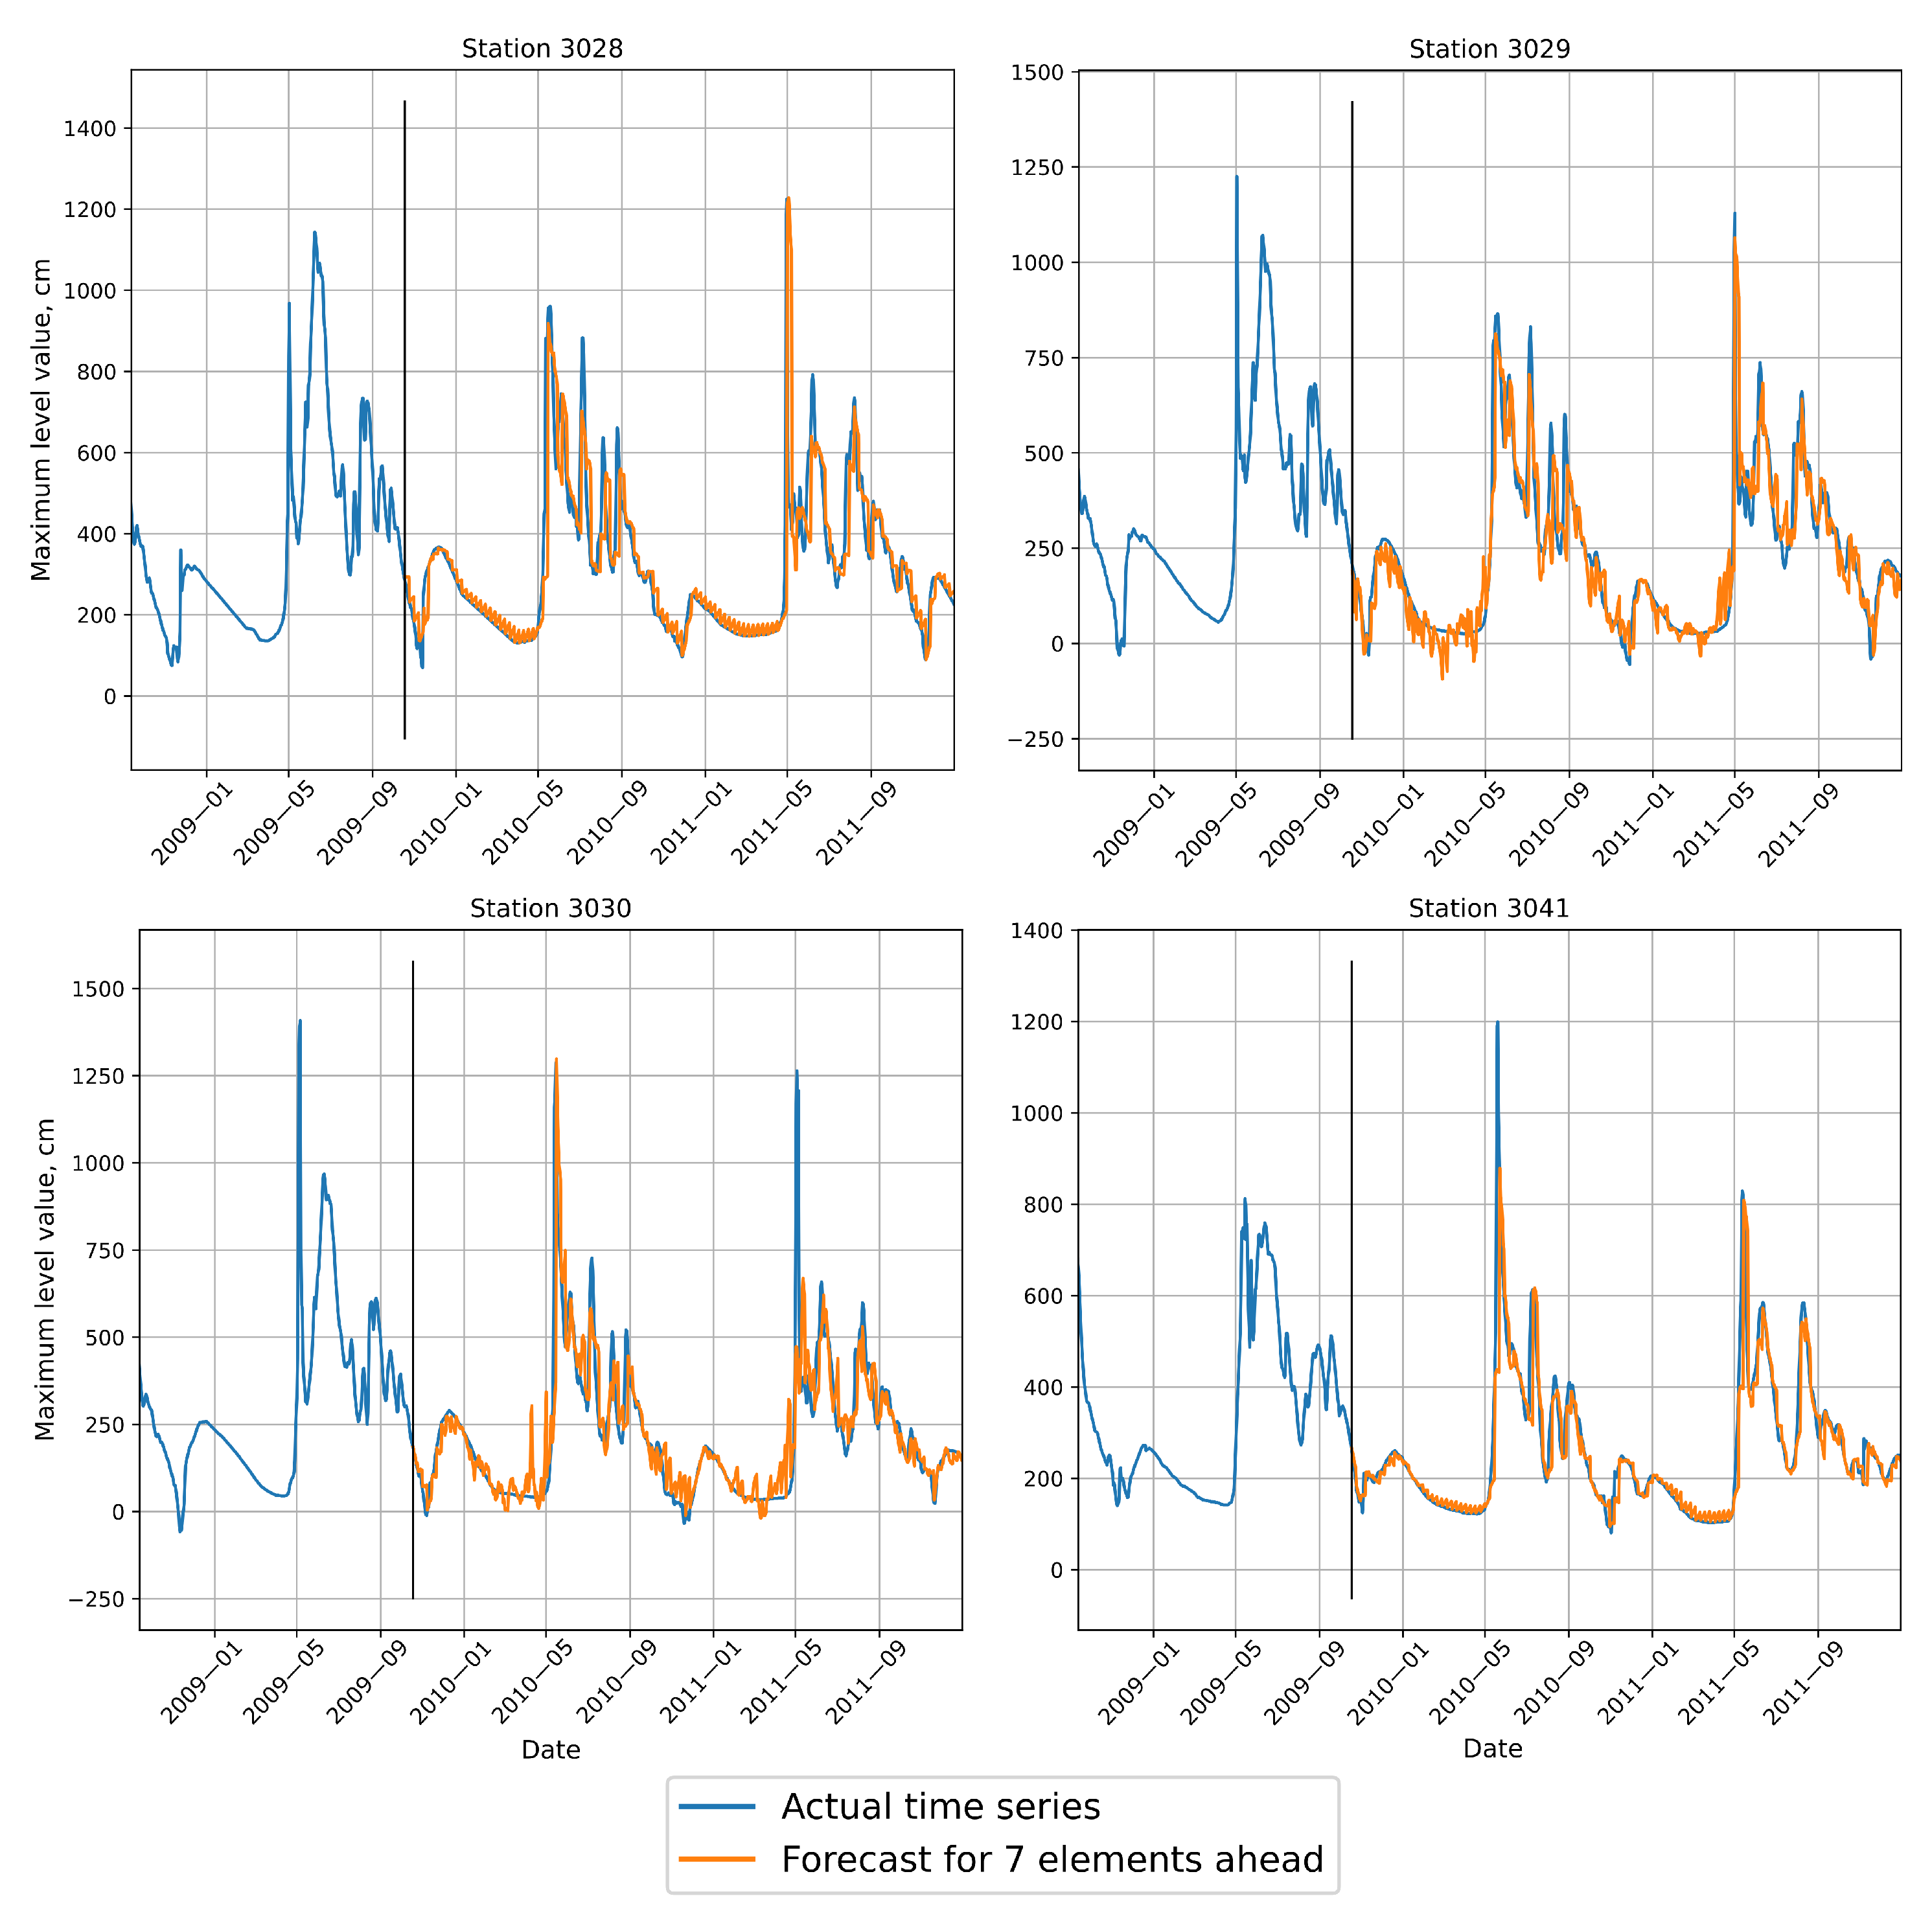
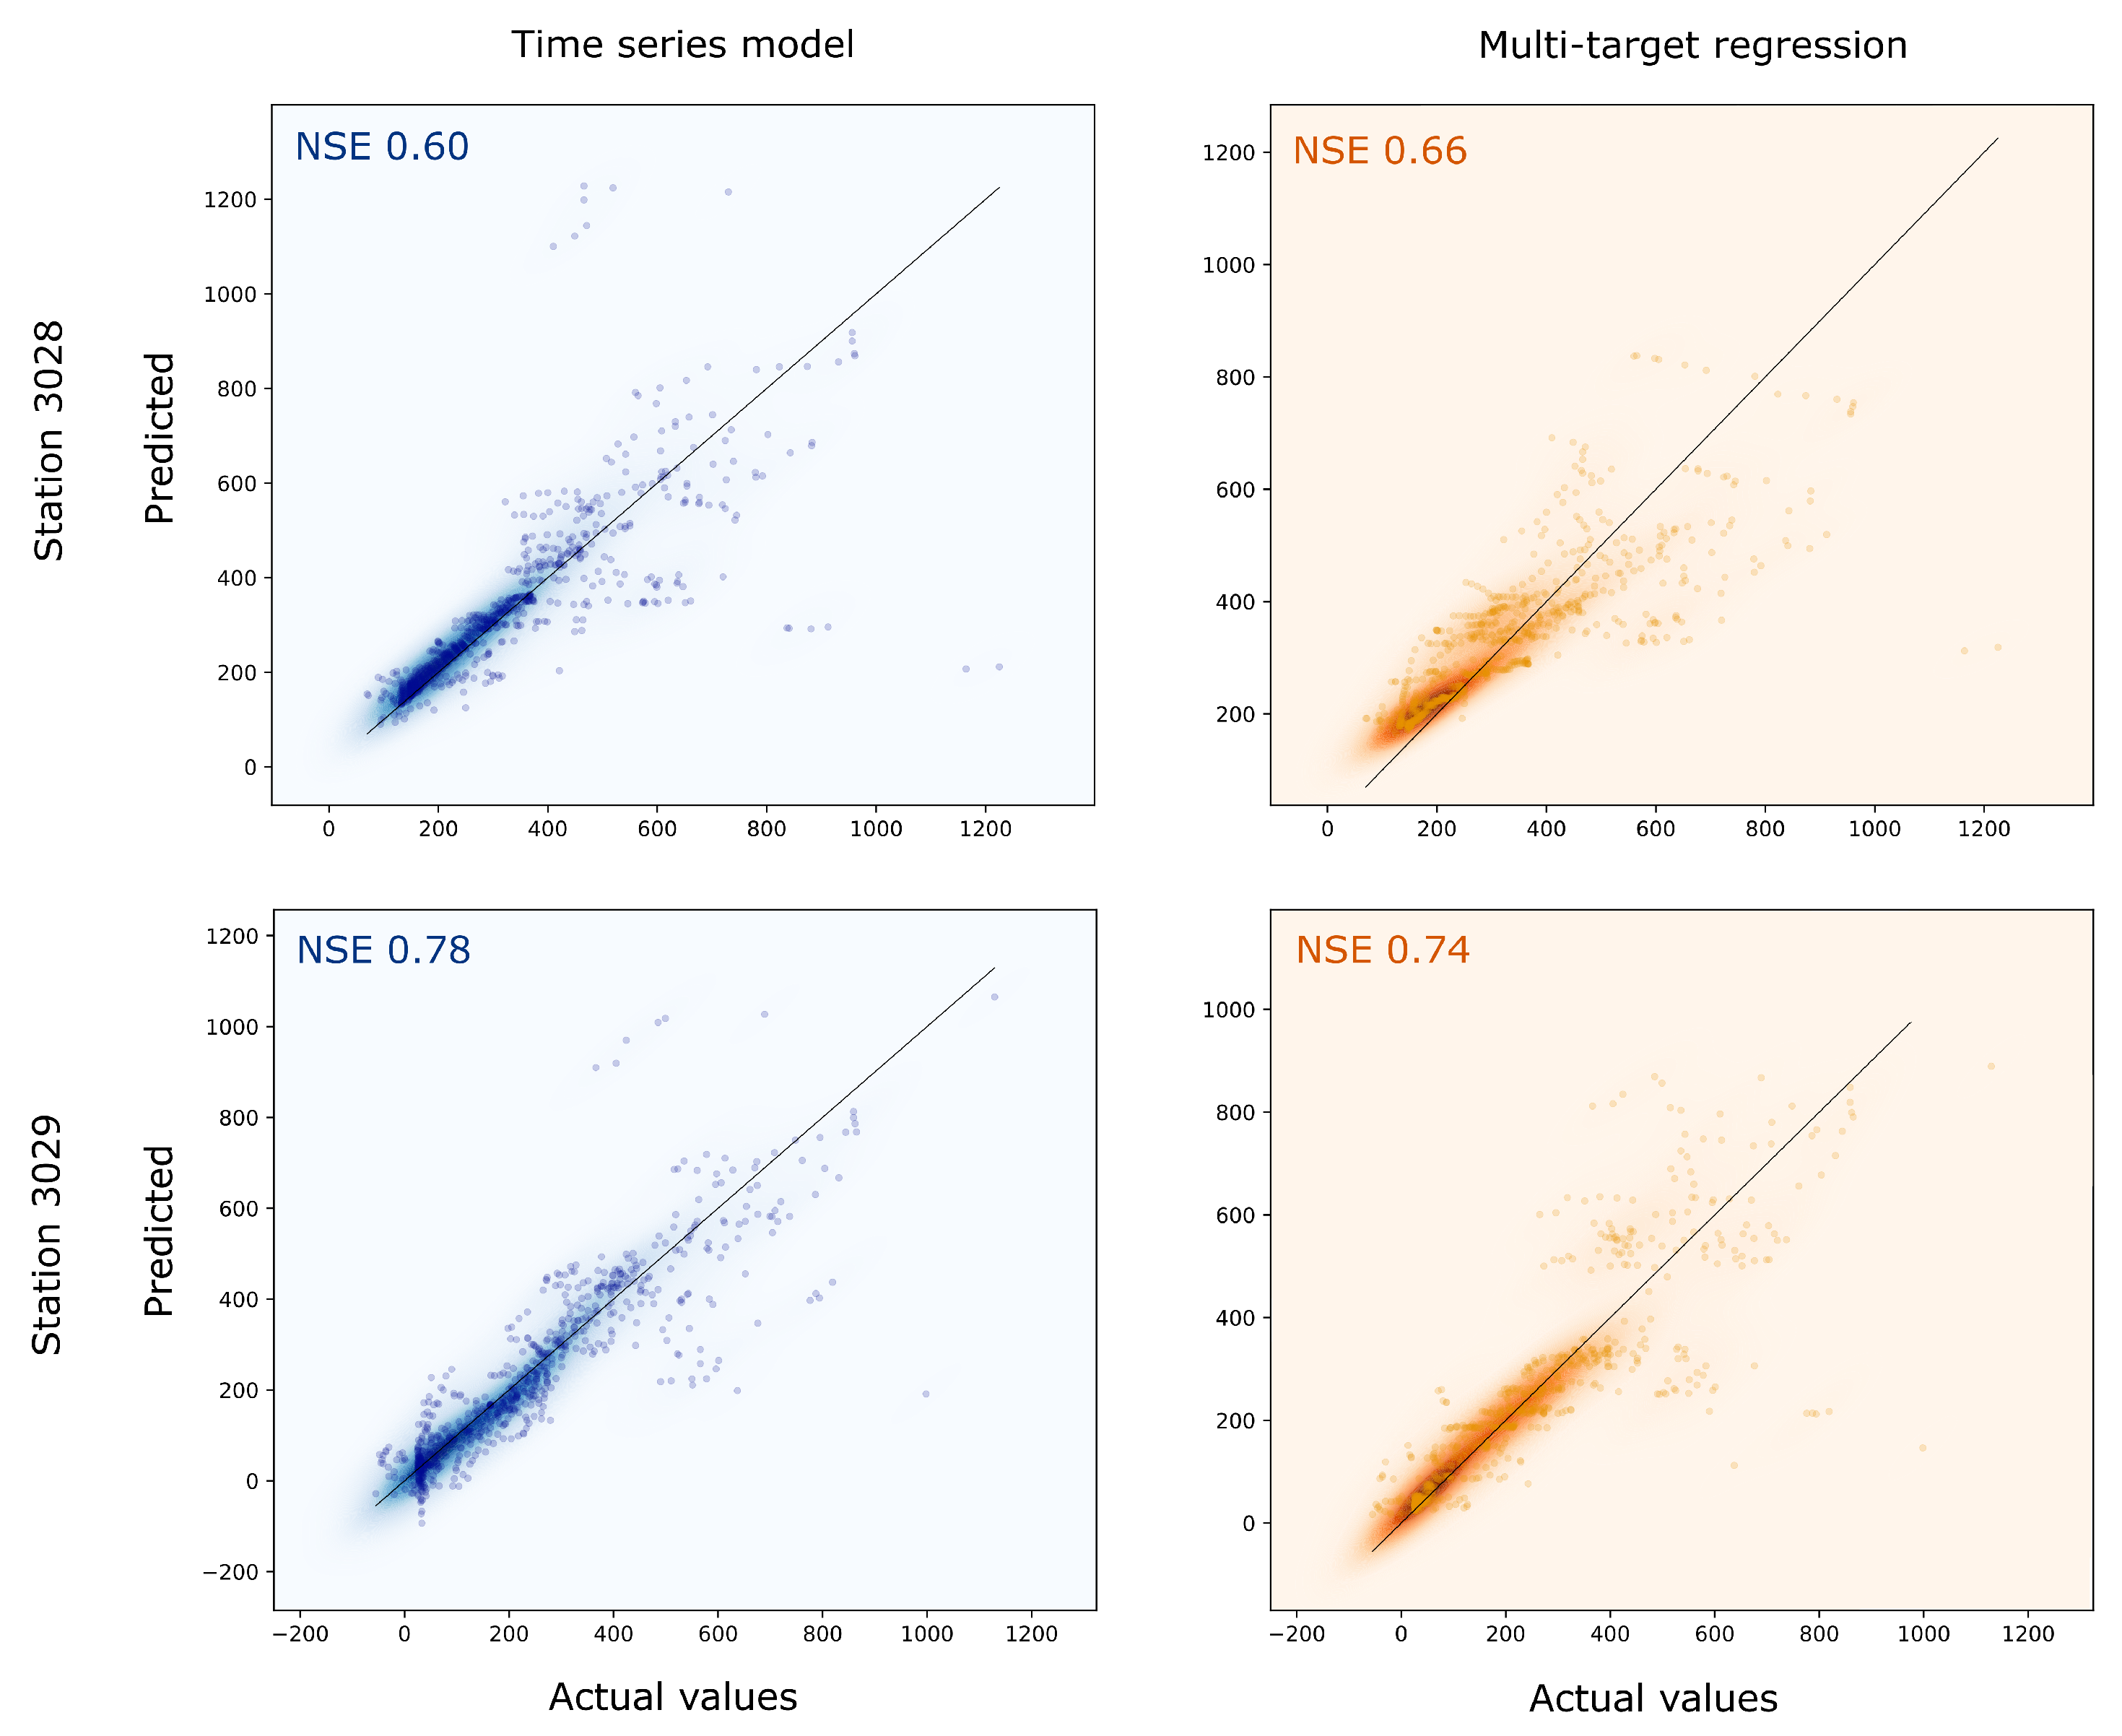
- Machine learning model for time series forecasting. Predictions of such a model based on time series of water levels. The number of such models equals the number of gauging stations;
- Machine learning model for multi-output regression. Predictions of such a model based on meteorological conditions. The number of such models equals the number of gauging stations;
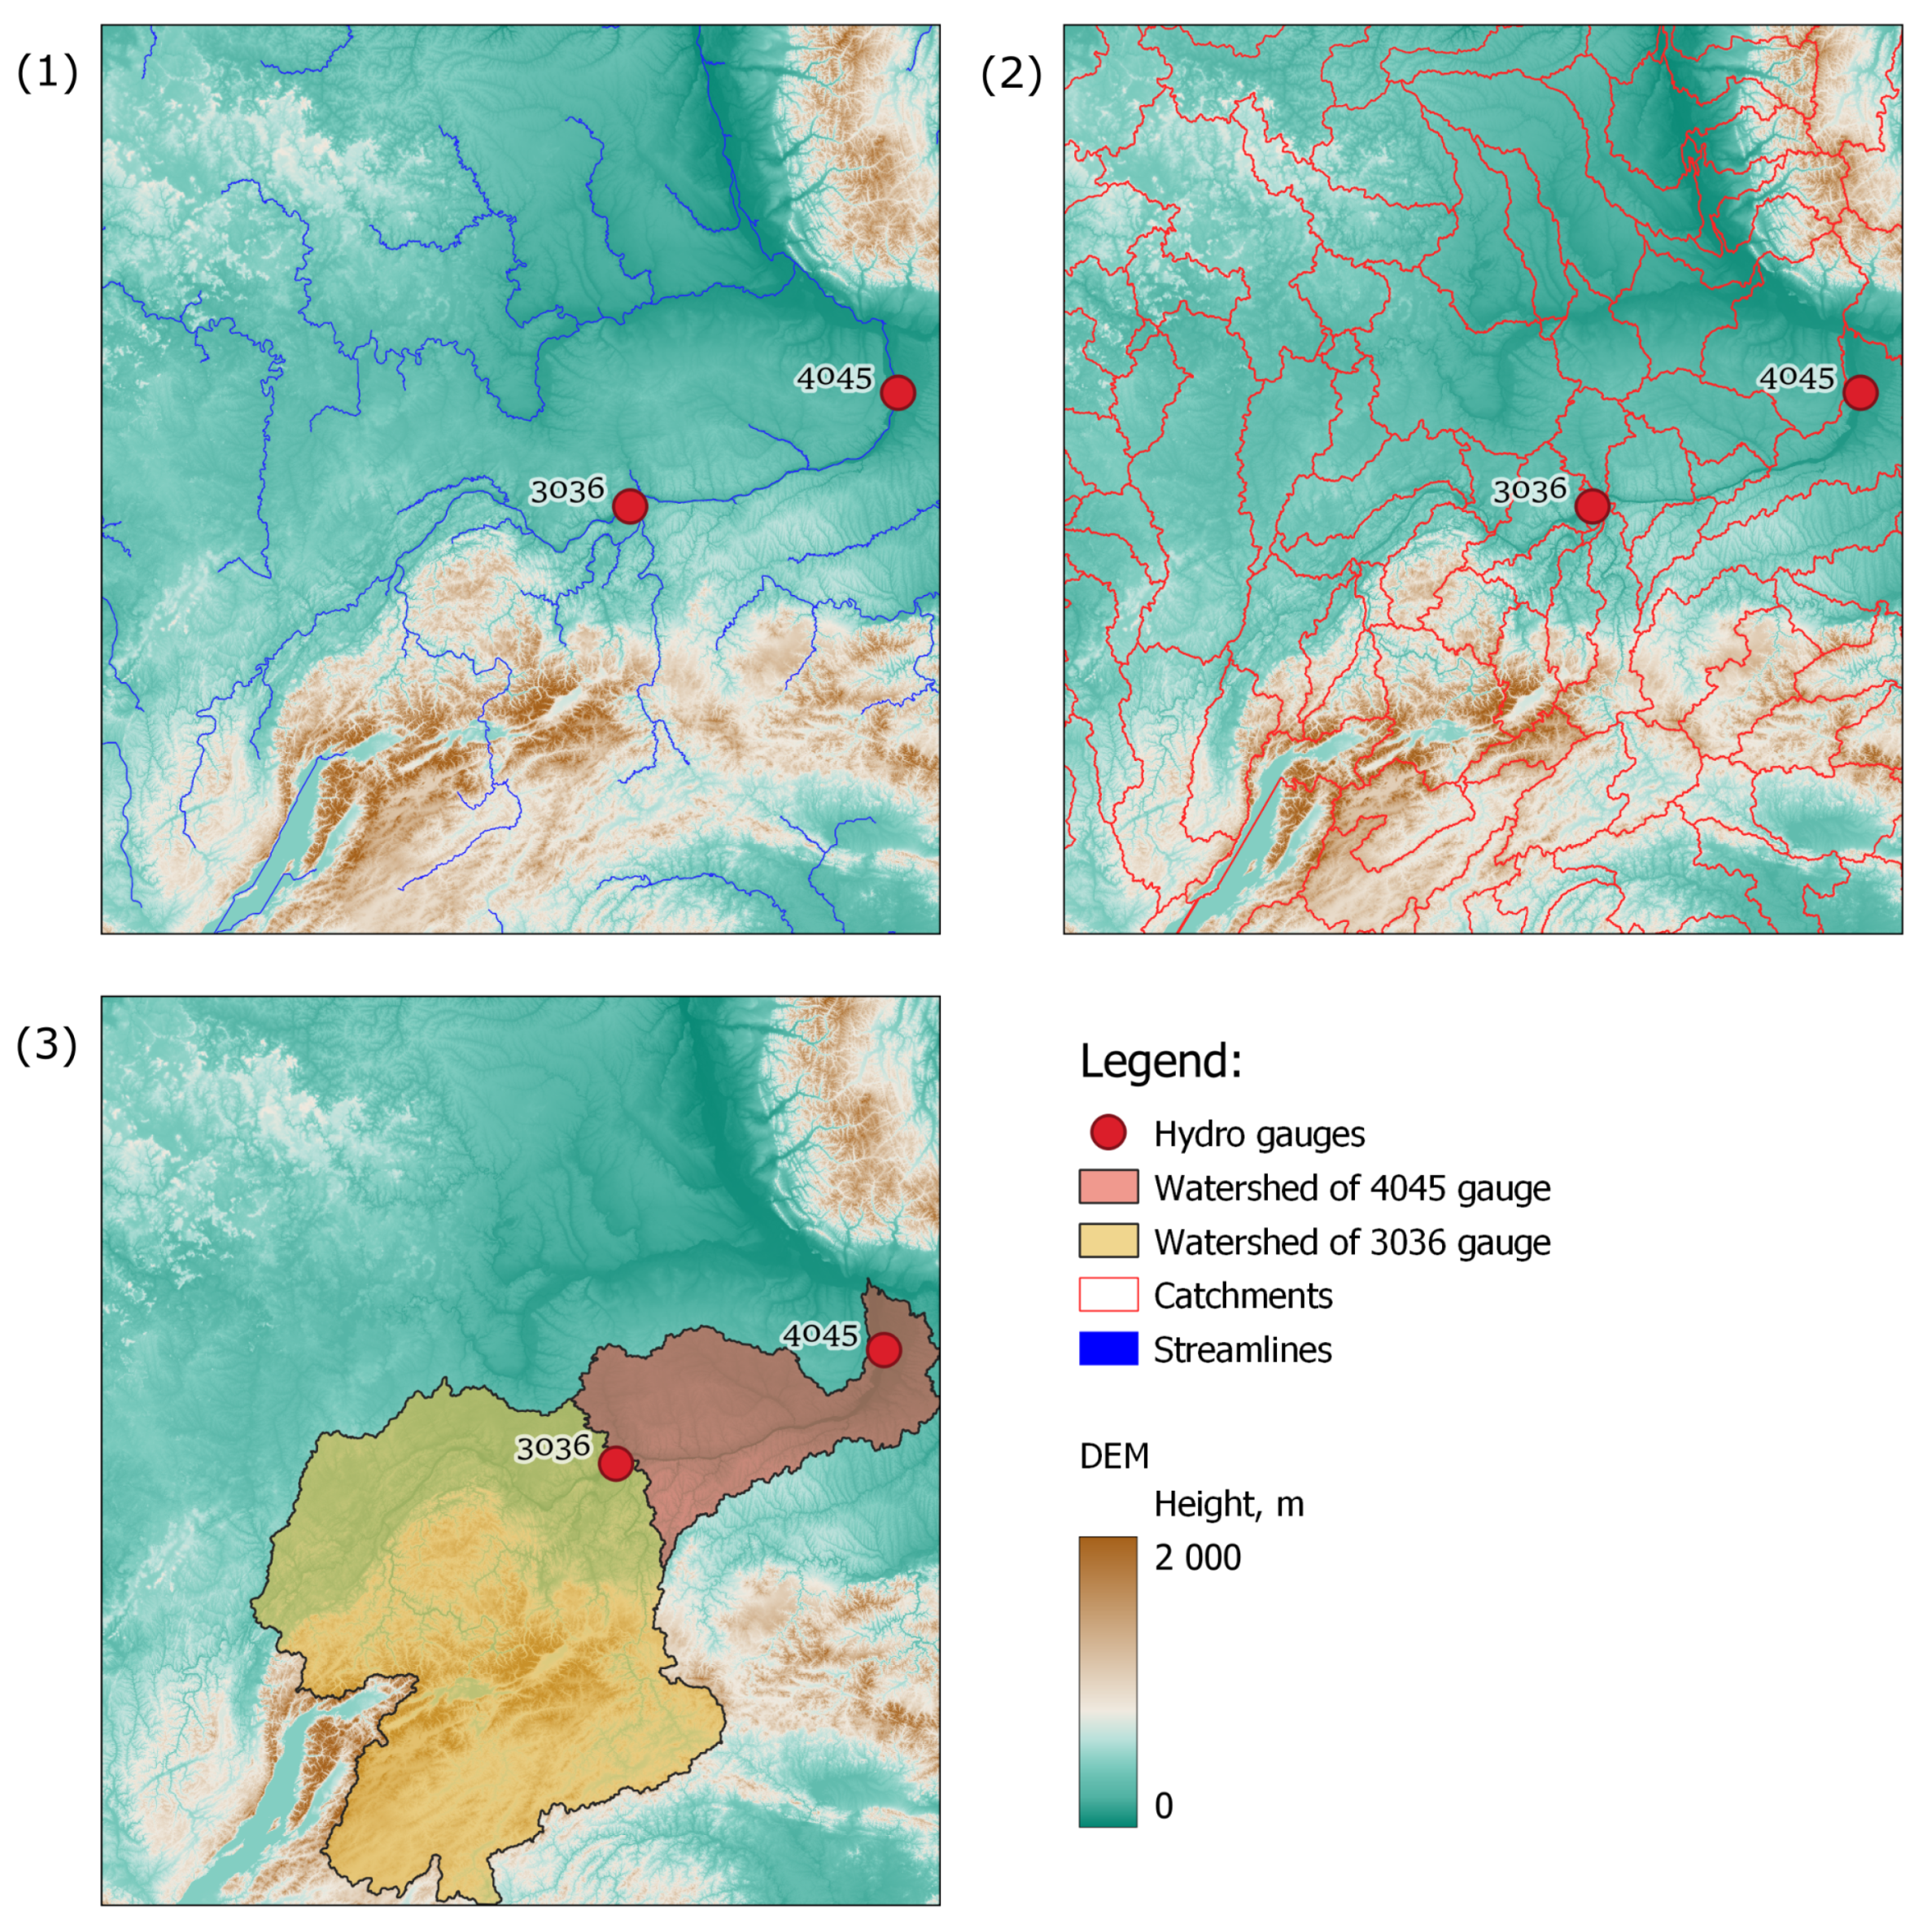
- Snowmelt-Runoff Model. The physical model is implemented and configured for the most critical level gauges;
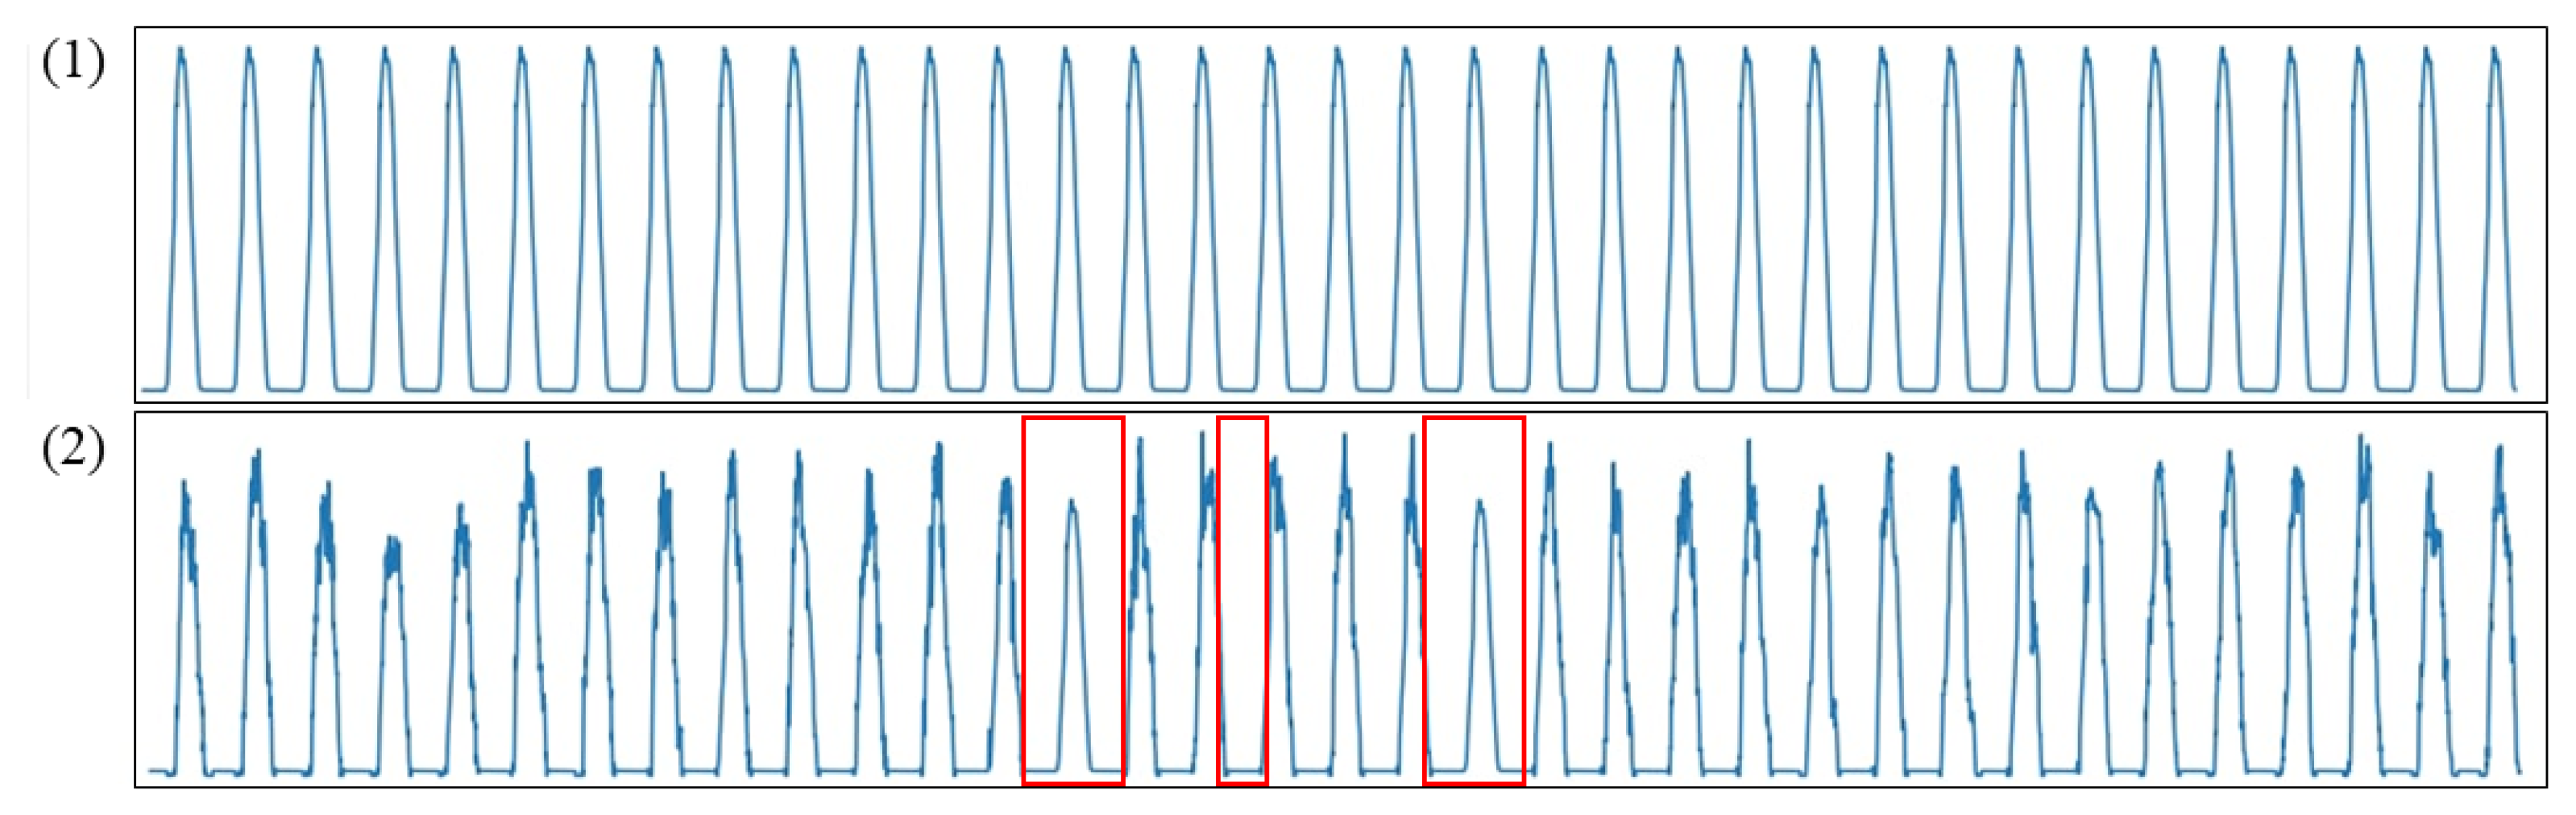
2.3. Data Preprocessing
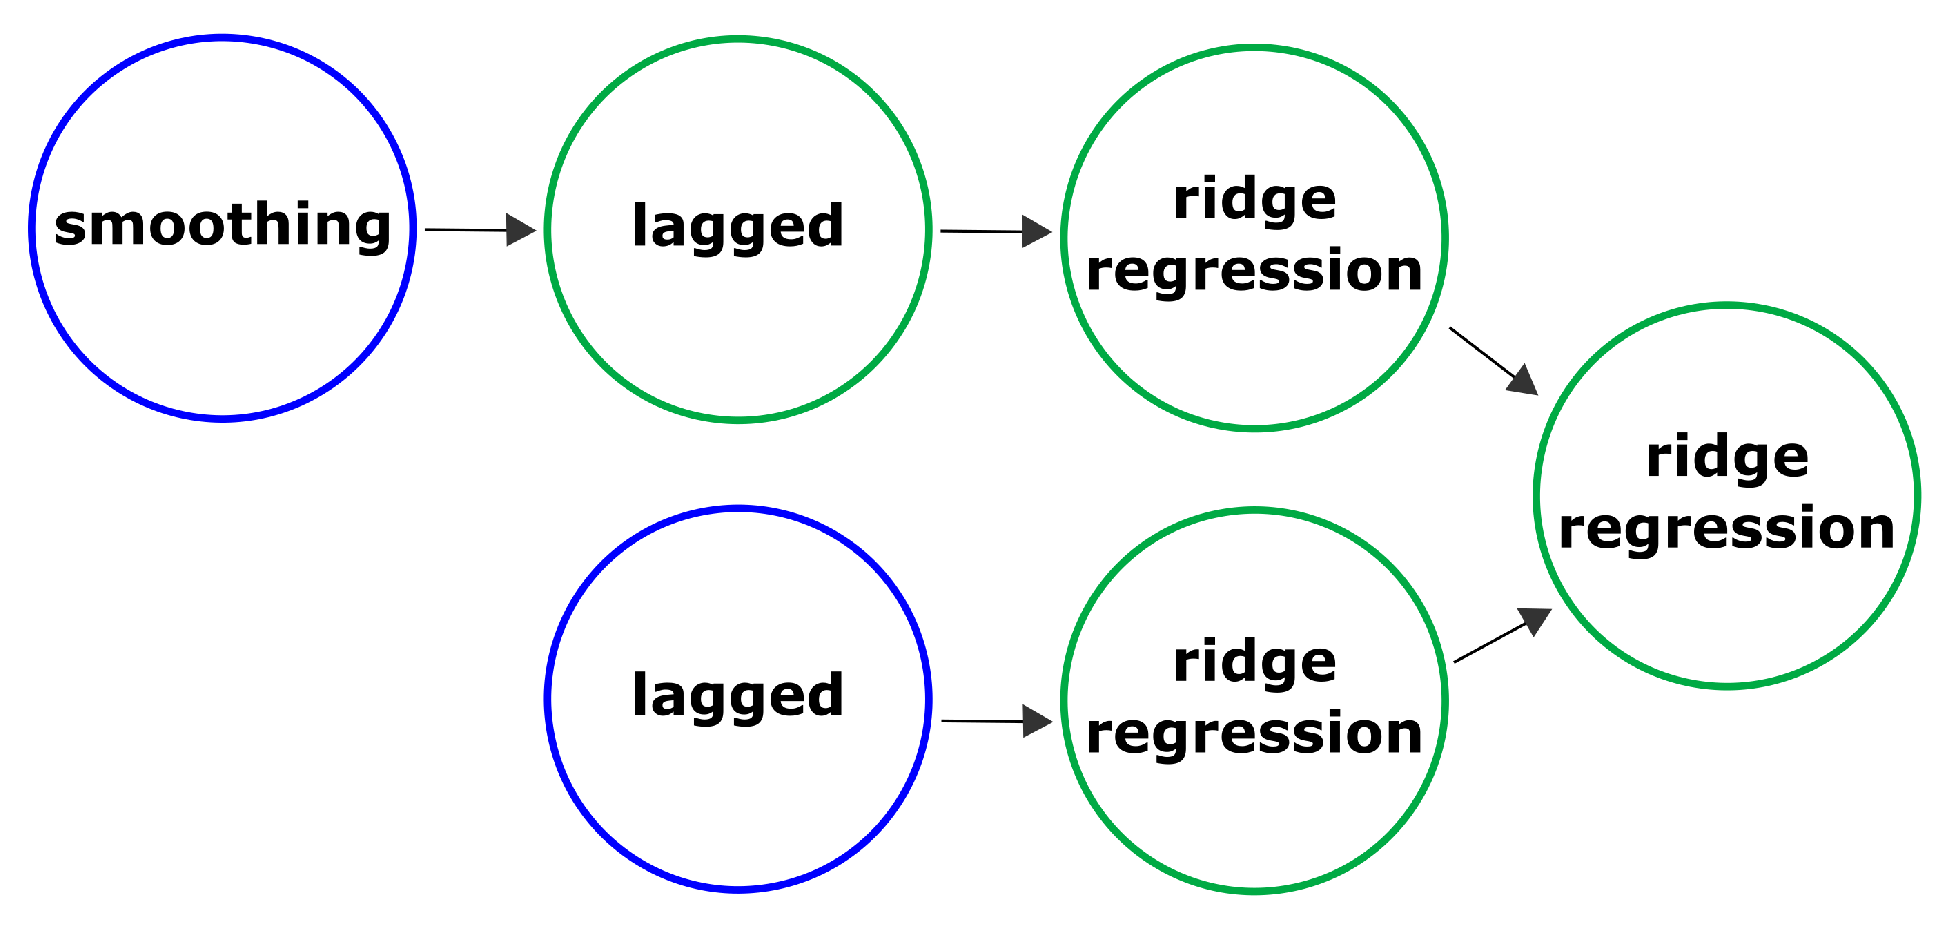
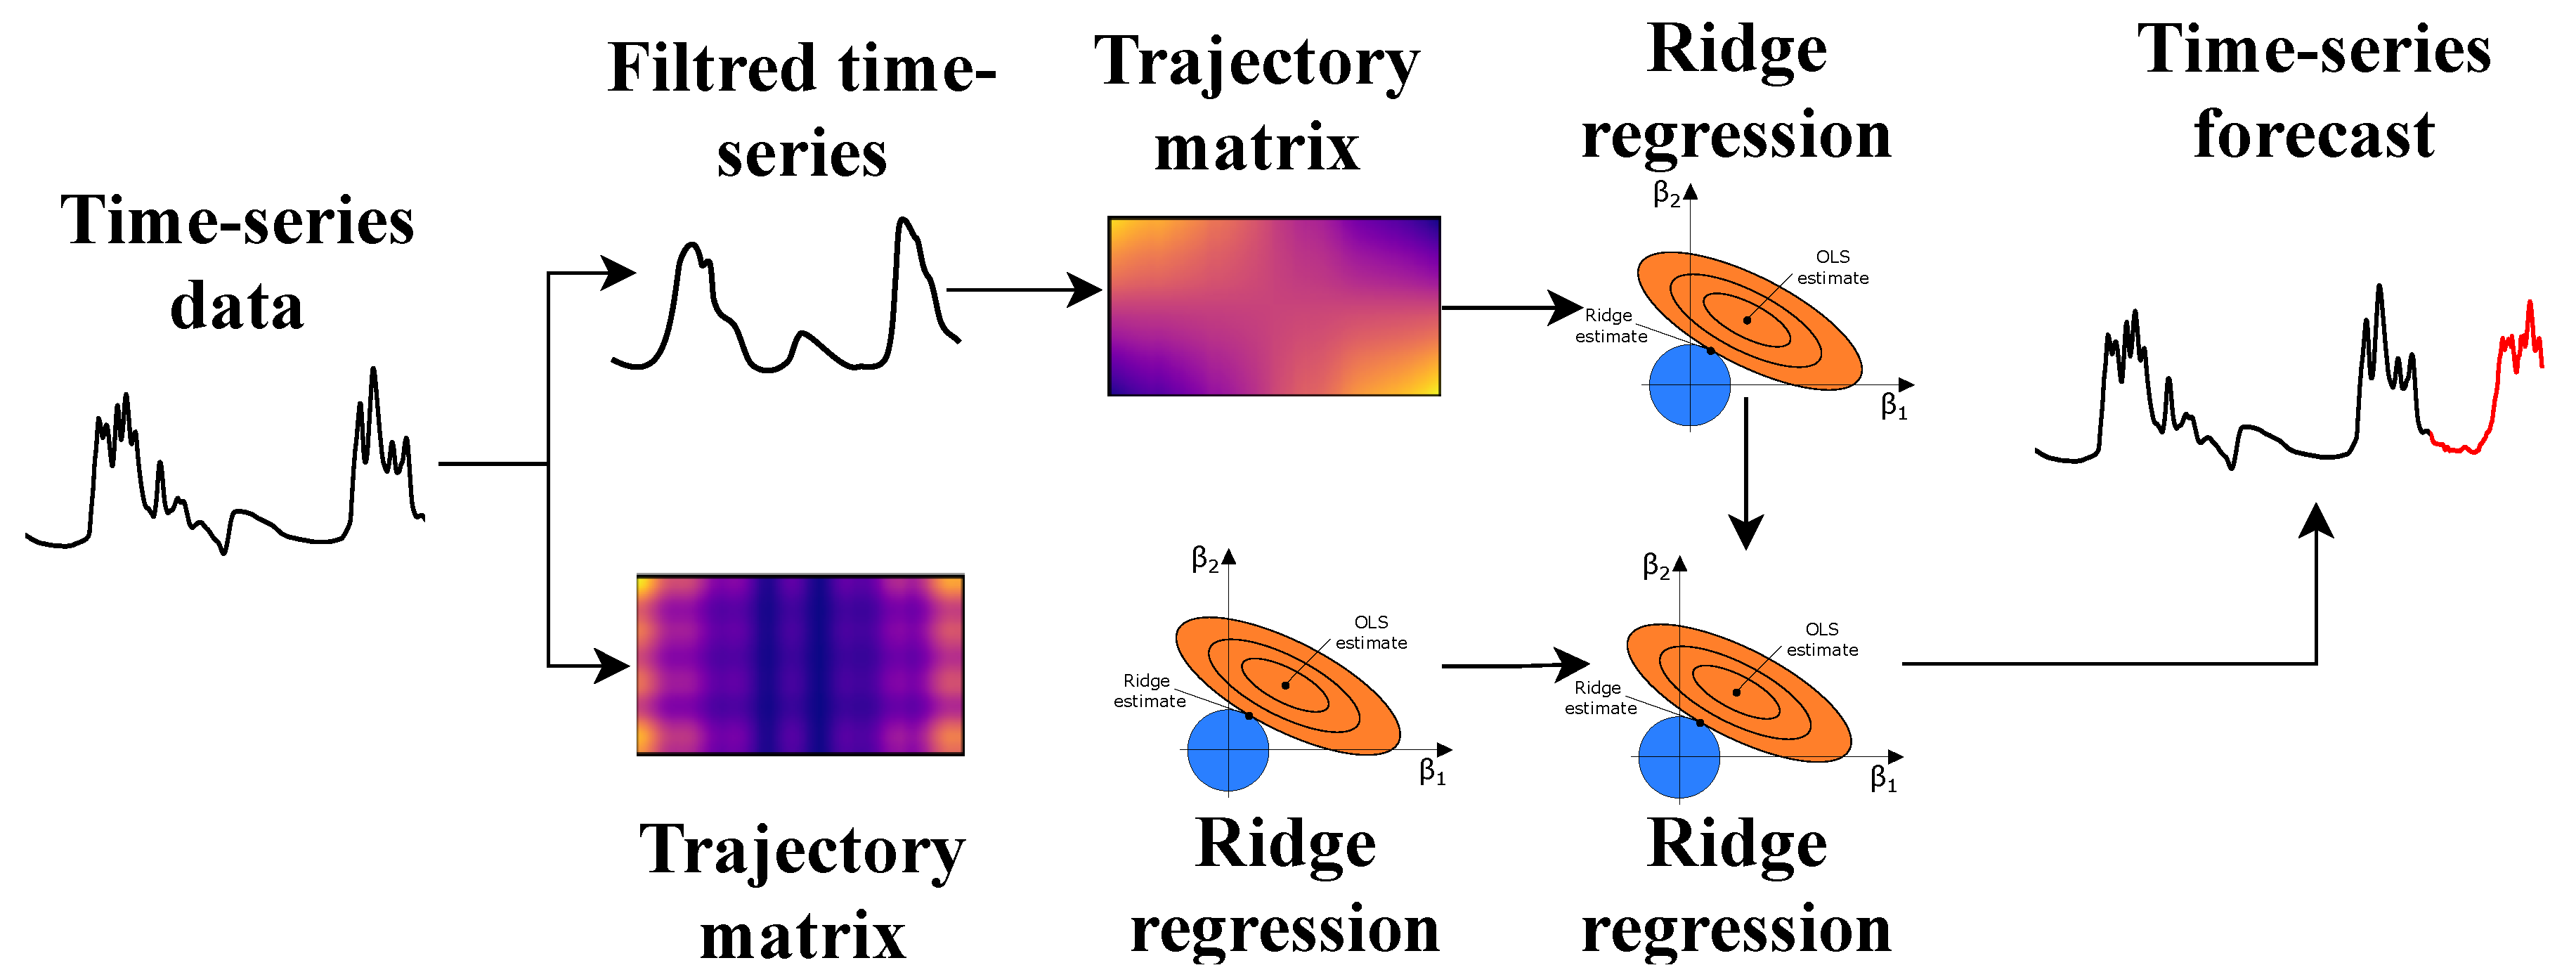
2.4. Time Series Forecasting
- The smoothing operation is a Gaussian filter. Mathematically, the Gaussian filter modifies the input signal by convolution with the Gaussian function; this transformation is also known as the Weierstrass transform. It is considered an ideal filter in the time domain.
- The lagged operation is a comparison of a time series with a sequence of multidimensional lagged vectors. An integer L (window length) is selected such that. These vectors form the trajectory matrix of the original time series. This type of matrix is known as the Hankel matrix elements of the anti-diagonals (that is, the diagonals going from bottom to left to right) are equal.
- Ridge regression is a variation of linear regression, specially adapted for data that demonstrate strong multicollinearity (that is, a strong correlation of features with each other). The consequence of this is the instability of estimates of regression coefficients. Estimates, for example, may have incorrect signs or values that far exceed those that are acceptable for physical or practical reasons.
2.5. Multi-Output Regression
- temp (FLOAT)—average daily water temperature.
- ice-thickness (INT)—thickness of ice.
- snow-height (INT)—the height of snow on ice.
- discharge (FLOAT)—average daily water consumption, m/s.
- water-level (INT)—is the target variable indicating the maximum water level.
- events—(TEXT)—the sum of events ranked by the degree for 30 days, correlated to the water level.
- discharge-mean (FLOAT)—average for five days water consumption, m/s.
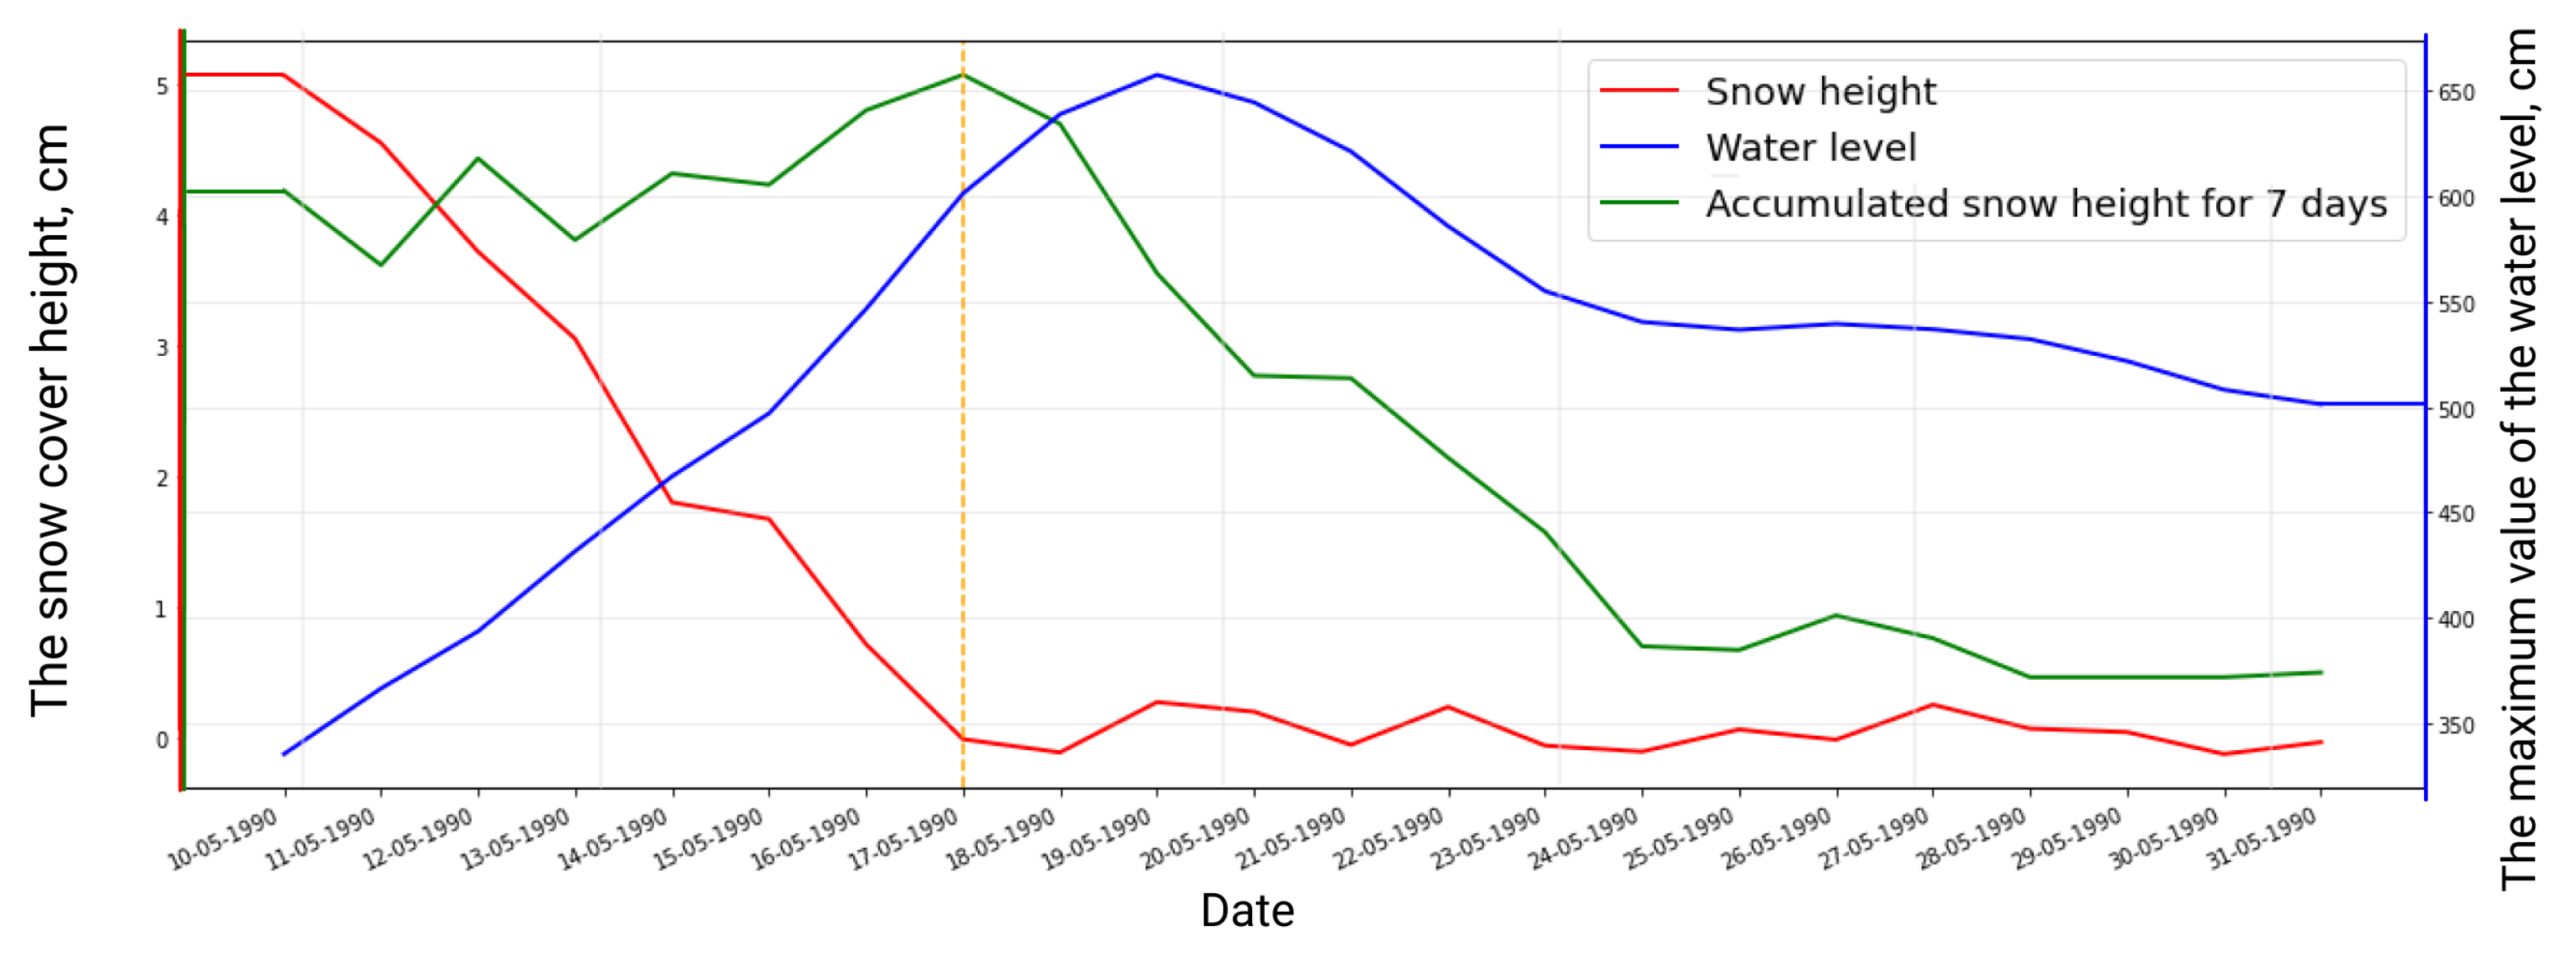
- temp-min (FLOAT)—minimum temperature on water level for 7 days. At low temperatures, ice formation, slowing of the river flow and, as a result, an increase in the water level is possible.
- ice-thickness-amplitude (INT)—amplitude thickness of ice for seven days shows an increase or decrease in the thickness of the ice.
- snow-height-amplitude (INT)—amplitude of snow height. Directly proportional to the water level.
- water-level-amplitude (INT)—the prediction of the water level depends heavily on the data for the past few days. By aggregating the values for the past seven days, we are essentially trying to predict a time series.
2.6. Physical Modelling
2.7. Quality Metrics for Forecasts
- NSE—Nash–Sutcliffe model efficiency coefficient. The metric changes from to 1. The closer the metric is to one, the better;
- MAE—Mean Absolute Error. The metric changes from 0 to ∞. The closer the metric is to zero, the better. The units of this metric are the same as the target variable—centimeters;
- SMAPE—Symmetric Mean Absolute Percentage Error. Varies from 0 to ∞. The closer the metric is to zero, the better. Measured as a percentage.
3. Results
3.1. Validation
3.2. Comparison
4. Discussion
5. Conclusions
Author Contributions
Funding
Institutional Review Board Statement
Informed Consent Statement
Data Availability Statement
Conflicts of Interest
Abbreviations
| ML | Machine learning |
| AutoML | Automated machine learning |
| AIC | Akaike criterion |
| SRM | Snowmelt-Runoff Model |
| NSE | Nash–Sutcliffe model efficiency coefficient |
| MAE | Mean Absolute Error |
| SMAPE | Symmetric Mean Absolute Percentage Error |
| MODIS | Moderate Resolution Imaging Spectroradiometer |
| AR | Autoregression model |
| ARIMA | Autoregressive Integrated Moving Average |
| DEM | Digital elevation model |
| SRTM | Shuttle Radar Topography Mission |
| NDSI | Normalized-Difference Snow Index |
| LOESS | locally estimated scatterplot smoothing |
| GIS | geographic information system. |
References
- Davies, J.B. Economic analysis of the costs of flooding. Can. Water Resour. J. Rev. Can. Des Ressources Hydriques 2016, 41, 204–219. [Google Scholar] [CrossRef] [Scilit]
- Liu, J.; Hertel, T.W.; Diffenbaugh, N.S.; Delgado, M.S.; Ashfaq, M. Future property damage from flooding: Sensitivities to economy and climate change. Clim. Chang. 2015, 132, 741–749. [Google Scholar] [CrossRef] [Scilit]
- Otto, K.; Boos, A.; Dalbert, C.; Schöps, D.; Hoyer, J. Posttraumatic symptoms, depression, and anxiety of flood victims: The impact of the belief in a just world. Personal. Individ. Differ. 2006, 40, 1075–1084. [Google Scholar] [CrossRef] [Scilit]
- Speight, L.J.; Cranston, M.D.; White, C.J.; Kelly, L. Operational and emerging capabilities for surface water flood forecasting. Wiley Interdiscip. Rev. Water 2021, 8, e1517. [Google Scholar] [CrossRef] [Scilit]
- Ramírez, J.A. Prediction and modeling of flood hydrology and hydraulics. In Inland Flood Hazards: Human, Riparian and Aquatic Communities; Cambridge University Press: Cambridge, UK, 2000; p. 498. [Google Scholar]
- Jain, S.K.; Mani, P.; Jain, S.K.; Prakash, P.; Singh, V.P.; Tullos, D.; Kumar, S.; Agarwal, S.; Dimri, A. A Brief review of flood forecasting techniques and their applications. Int. J. River Basin Manag. 2018, 16, 329–344. [Google Scholar] [CrossRef] [Scilit]
- Agudelo-Otálora, L.M.; Moscoso-Barrera, W.D.; Paipa-Galeano, L.A.; Mesa-Sciarrotta, C. Comparison of physical models and artificial intelligence for prediction of flood levels. Tecnol. Cienc. Agua 2018, 9, 209–235. [Google Scholar] [CrossRef] [Scilit]
- Sahraei, S.; Asadzadeh, M.; Unduche, F. Signature-based multi-modelling and multi-objective calibration of hydrologic models: Application in flood forecasting for Canadian Prairies. J. Hydrol. 2020, 588, 125095. [Google Scholar] [CrossRef] [Scilit]
- Aqil, M.; Kita, I.; Yano, A.; Nishiyama, S. Analysis and prediction of flow from local source in a river basin using a Neuro-fuzzy modeling tool. J. Environ. Manag. 2007, 85, 215–223. [Google Scholar] [CrossRef] [Scilit]
- Amarís Castro, G.E.; Guerrero Barbosa, T.E.; Sánchez Ortiz, E.A. Comportamiento de las ecuaciones de Saint-Venant en 1D y aproximaciones para diferentes condiciones en régimen permanente y variable. Tecnura 2015, 19, 75–87. [Google Scholar] [CrossRef] [Scilit]
- Bui, D.T.; Panahi, M.; Shahabi, H.; Singh, V.P.; Shirzadi, A.; Chapi, K.; Khosravi, K.; Chen, W.; Panahi, S.; Li, S.; et al. Novel hybrid evolutionary algorithms for spatial prediction of floods. Sci. Rep. 2018, 8, 15364. [Google Scholar] [CrossRef] [Scilit]
- Noymanee, J.; Nikitin, N.O.; Kalyuzhnaya, A.V. Urban pluvial flood forecasting using open data with machine learning techniques in pattani basin. Procedia Comput. Sci. 2017, 119, 288–297. [Google Scholar] [CrossRef] [Scilit]
- Wu, W.; Emerton, R.; Duan, Q.; Wood, A.W.; Wetterhall, F.; Robertson, D.E. Ensemble flood forecasting: Current status and future opportunities. Wiley Interdiscip. Rev. Water 2020, 7, e1432. [Google Scholar] [CrossRef] [Scilit]
- Siam, Z.S.; Hasan, R.T.; Anik, S.S.; Noor, F.; Adnan, M.S.G.; Rahman, R.M. Study of Hybridized Support Vector Regression Based Flood Susceptibility Mapping for Bangladesh. In Proceedings of the International Conference on Industrial, Engineering and Other Applications of Applied Intelligent Systems, Kuala Lumpur, Malaysia, 26–29 July 2021; Springer: Berlin/Heidelberg, Germany, 2021; pp. 59–71. [Google Scholar]
- Muñoz, D.F.; Muñoz, P.; Moftakhari, H.; Moradkhani, H. From local to regional compound flood mapping with deep learning and data fusion techniques. Sci. Total Environ. 2021, 782, 146927. [Google Scholar] [CrossRef] [Scilit]
- Zhou, Z.H. Ensemble learning. In Machine Learning; Springer: Berlin/Heidelberg, Germany, 2021; pp. 181–210. [Google Scholar]
- Kalyuzhnaya, A.V.; Nikitin, N.O.; Vychuzhanin, P.; Hvatov, A.; Boukhanovsky, A. Automatic evolutionary learning of composite models with knowledge enrichment. In Proceedings of the 2020 Genetic and Evolutionary Computation Conference Companion, Cancún, Mexico, 8–12 July 2020; pp. 43–44. [Google Scholar]
- Korytny, L.M.; Kichigina, N.V. Geographical analysis of river floods and their causes in southern East Siberia. Hydrol. Sci. J. 2006, 51, 450–464. [Google Scholar] [CrossRef] [Scilit]
- Tei, S.; Morozumi, T.; Nagai, S.; Takano, S.; Sugimoto, A.; Shingubara, R.; Fan, R.; Fedorov, A.; Gavrilyeva, T.; Tananaev, N.; et al. An extreme flood caused by a heavy snowfall over the Indigirka River basin in Northeastern Siberia. Hydrol. Process. 2020, 34, 522–537. [Google Scholar] [CrossRef] [Scilit]
- Gautier, E.; Brunstein, D.; Costard, F.; Lodina, R. Fluvial dynamics in a deep permafrost zone—the case of the middle Lena river (Central Siberia). In Permafrost; Phillips, M., Springman, S.M., Arenson, L.U., Eds.; Swets & Zeitlinger: Lisse, The Netherlands, 2003; pp. 271–275. [Google Scholar]
- Ma, X.; Fukushima, Y. A numerical model of the river freezing process and its application to the Lena River. Hydrol. Process. 2002, 16, 2131–2140. [Google Scholar] [CrossRef] [Scilit]
- Golovlyov, P.; Kornilova, E.; Krylenko, I.; Belikov, V.; Zavadskii, A.; Fingert, E.; Borisova, N.; Morozova, E. Numerical modeling and forecast of channel changes on the river Lena near city Yakutsk. Proc. Int. Assoc. Hydrol. Sci. 2019, 381, 65–71. [Google Scholar] [CrossRef] [Scilit]
- Tarasova, L.; Merz, R.; Kiss, A.; Basso, S.; Blöschl, G.; Merz, B.; Viglione, A.; Plötner, S.; Guse, B.; Schumann, A.; et al. Causative classification of river flood events. Wiley Interdiscip. Rev. Water 2019, 6, e1353. [Google Scholar] [CrossRef] [Scilit]
- Korytny, L.; Kichigina, N.; Gartsman, B.; Gubareva, T. Rain Floods of The Far East and East Siberia. In Extreme Hydrological Events: New Concepts for Security; Vasiliev, O., van Gelder, P., Plate, E., Bolgov, M., Eds.; Springer: Dordrecht, The Netherlands, 2007; pp. 125–135. [Google Scholar]
- Struchkova, G.; Lebedev, M.; Timofeeva, V.; Kapitonova, T.; Gavrilieva, A. Neural Network Approaches to Modeling of Natural. In Emergencies. Prediction of Lena River Spring High Waters. In Proceedings of the IOP Conference Series: Earth and Environmental Science, Vladivostok, Russian, 8–10 December 2020; IOP Publishing: Bristol, UK, 2021; Volume 666, p. 032084. [Google Scholar]
- Chen, W.B.; Liu, W.C. Modeling flood inundation induced by river flow and storm surges over a river basin. Water 2014, 6, 3182–3199. [Google Scholar] [CrossRef] [Scilit]
- Carling, P.; Villanueva, I.; Herget, J.; Wright, N.; Borodavko, P.; Morvan, H. Unsteady 1D and 2D hydraulic models with ice dam break for Quaternary megaflood, Altai Mountains, southern Siberia. Glob. Planet. Chang. 2010, 70, 24–34. [Google Scholar] [CrossRef] [Scilit]
- Buzin, V.; Klaven, A.; Kopaliani, Z. Laboratory modelling of ice jam floods on the lena river. In Extreme Hydrological Events: New Concepts for Security; Vasiliev, O., van Gelder, P., Plate, E., Bolgov, M., Eds.; Springer: Dordrecht, The Netherlands, 2007; pp. 269–277. [Google Scholar]
- Sankaranarayanan, S.; Prabhakar, M.; Satish, S.; Jain, P.; Ramprasad, A.; Krishnan, A. Flood prediction based on weather parameters using deep learning. J. Water Clim. Chang. 2020, 11, 1766–1783. [Google Scholar] [CrossRef] [Scilit]
- Mitra, P.; Ray, R.; Chatterjee, R.; Basu, R.; Saha, P.; Raha, S.; Barman, R.; Patra, S.; Biswas, S.S.; Saha, S. Flood forecasting using Internet of things and artificial neural networks. In Proceedings of the 2016 IEEE 7th Annual Information Technology, Electronics and Mobile Communication Conference (IEMCON), Vancouver, BC, Canada, 13–15 October 2016; IEEE: Piscataway, NJ, USA, 2016; pp. 1–5. [Google Scholar]
- Kan, G.; Liang, K.; Yu, H.; Sun, B.; Ding, L.; Li, J.; He, X.; Shen, C. Hybrid machine learning hydrological model for flood forecast purpose. Open Geosci. 2020, 12, 813–820. [Google Scholar] [CrossRef] [Scilit]
- Adamowski, J.F. Development of a short-term river flood forecasting method for snowmelt driven floods based on wavelet and cross-wavelet analysis. J. Hydrol. 2008, 353, 247–266. [Google Scholar] [CrossRef] [Scilit]
- Martinec, J.; Rango, A.; Major, E. The Snowmelt-Runoff Model (SRM) User’s Manual; NASA: Washington, DC, USA, 1983. [Google Scholar]
- World Meteorological Organization. Intercomparison of Models of Snowmelt Runoff; WMO: Geneva, Switzerland, 1986. [Google Scholar]
- Li, L.; Simonovic, S. System dynamics model for predicting floods from snowmelt in North American prairie watersheds. Hydrol. Process. 2002, 16, 2645–2666. [Google Scholar] [CrossRef] [Scilit]
- Leavesley, G.; Lichty, R.; Troutman, B.; Saindon, L. Precipitation-runoff modeling system: User’s manual. Water-Resour. Investig. Rep. 1983, 83, 207. [Google Scholar]
- Lindenschmidt, K.E.; Das, A.; Rokaya, P.; Chu, T. Ice-jam flood risk assessment and mapping. Hydrol. Process. 2016, 30, 3754–3769. [Google Scholar] [CrossRef] [Scilit]
- Chen, Y.; Gan, M.; Pan, S.; Pan, H.; Zhu, X.; Tao, Z. Application of auto-regressive (AR) analysis to improve short-term prediction of water levels in the Yangtze estuary. J. Hydrol. 2020, 590, 125386. [Google Scholar] [CrossRef] [Scilit]
- Yu, Z.; Lei, G.; Jiang, Z.; Liu, F. ARIMA modelling and forecasting of water level in the middle reach of the Yangtze River. In Proceedings of the 2017 4th International Conference on Transportation Information and Safety (ICTIS), Banff, AB, Canada, 8–10 August 2017; IEEE: Piscataway, NJ, USA, 2017; pp. 172–177. [Google Scholar]
- Takakura, H. Local Perception of River Thaw and Spring Flooding of the Lena River. In Global Warming and Human—Nature Dimension in Northern Eurasia; Hiyama, T., Takakura, H., Eds.; Springer: Singapore, 2018; pp. 29–51. [Google Scholar] [CrossRef] [Scilit]
- Kapitonova, T.; Lebedev, M.; Timofeeva, V.; Nogovitsyn, D.; Struchkova, G. Flood forecasting on river lena during spring high water in area of location of potentially dangerous objects. In Proceedings of the International Multidisciplinary Scientific GeoConference: SGEM, Albena, Bulgaria, 30 June–6 July 2016; Volume 1, pp. 329–334. [Google Scholar]
- Smith, L.C.; Pavelsky, T.M. Estimation of river discharge, propagation speed, and hydraulic geometry from space: Lena River, Siberia. Water Resour. Res. 2008, 44. [Google Scholar] [CrossRef] [Scilit]
- Sakai, T.; Hatta, S.; Okumura, M.; Hiyama, T.; Yamaguchi, Y.; Inoue, G. Use of Landsat TM/ETM+ to monitor the spatial and temporal extent of spring breakup floods in the Lena River, Siberia. Int. J. Remote Sens. 2015, 36, 719–733. [Google Scholar] [CrossRef] [Scilit]
- Horritt, M.; Bates, P. Evaluation of 1D and 2D numerical models for predicting river flood inundation. J. Hydrol. 2002, 268, 87–99. [Google Scholar] [CrossRef] [Scilit]
- Kornilova, E.; Krylenko, I.; Golovlyov, P.; Sazonov, A.; Nikitsky, A. Verification of the two-dimensional hydrodynamic model of the Lena River near Yakutsk by time-varying satellite data. Sovrem. Probl. Distantsionnogo Zondirovaniya Zemli Kosmosa 2018, 15, 169–178. [Google Scholar] [CrossRef] [Scilit]
- Ferreira, L.; Pilastri, A.; Martins, C.M.; Pires, P.M.; Cortez, P. A Comparison of AutoML Tools for Machine Learning, Deep Learning and XGBoost. In Proceedings of the 2021 International Joint Conference on Neural Networks (IJCNN), Shenzhen, China, 18–22 July 2021; IEEE: Piscataway, NJ, USA, 2021; pp. 1–8. [Google Scholar]
- Roshydromet; Rosvodresursy. Daily Hydrological Data and Ice Weakening Activities for the Lena River and Tributaries, data-processing: Research Development Infrastructure, CAG. 2021. Available online: http://data-in.ru/data-catalog/datasets/172/ (accessed on 9 November 2021).
- Roshydromet. Meteorology of the Lena River and Tributaries Area: Monthly, Daily and Three Hourly Weather Characteristics for 1985–2020, data-Processing: Research Development Infrastructure, CAG. 2021. Available online: http://data-in.ru/data-catalog/datasets/173/ (accessed on 9 November 2021).
- Yang, D.; Kane, D.L.; Hinzman, L.D.; Zhang, X.; Zhang, T.; Ye, H. Siberian Lena River hydrologic regime and recent change. J. Geophys. Res. Atmos. 2002, 107, ACL 14–1–ACL 14–10. [Google Scholar] [CrossRef] [Scilit]
- Zhang, T.; Barry, R.G.; Knowles, K.; Heginbottom, J.; Brown, J. Statistics and characteristics of permafrost and ground-ice distribution in the Northern Hemisphere. Polar Geogr. 1999, 23, 132–154. [Google Scholar] [CrossRef] [Scilit]
- Kil’myaninov, V. The effect of meteorological conditions prior to ice run on the extent of ice jam floods on the Lena River. Russ. Meteorol. Hydrol. 2012, 37, 276–278. [Google Scholar] [CrossRef] [Scilit]
- Nikitin, N.O.; Vychuzhanin, P.; Sarafanov, M.; Polonskaia, I.S.; Revin, I.; Barabanova, I.V.; Maximov, G.; Kalyuzhnaya, A.V.; Boukhanovsky, A. Automated evolutionary approach for the design of composite machine learning pipelines. Future Gener. Comput. Syst. 2022, 127, 109–125. [Google Scholar] [CrossRef] [Scilit]
- Sagi, O.; Rokach, L. Ensemble learning: A survey. Wiley Interdiscip. Rev. Data Min. Knowl. Discov. 2018, 8, e1249. [Google Scholar] [CrossRef] [Scilit]
- Bergstra, J.; Komer, B.; Eliasmith, C.; Yamins, D.; Cox, D.D. Hyperopt: A python library for model selection and hyperparameter optimization. Comput. Sci. Discov. 2015, 8, 014008. [Google Scholar] [CrossRef] [Scilit]
- Bergstra, J.; Bardenet, R.; Bengio, Y.; Kégl, B. Algorithms for hyper-parameter optimization. In Proceedings of the International Conference on Advances in Neural Information Processing Systems, Granada, Spain, 12–15 December 2011; Volume 24. [Google Scholar]
- Ponkina, E.; Illiger, P.; Krotova, O.; Bondarovich, A. Do ARMA Models Provide Better Gap Filling in Time Series of Soil Temperature and Soil Moisture? The Case of Arable Land in the Kulunda Steppe, Russia. Land 2021, 10, 579. [Google Scholar] [CrossRef] [Scilit]
- Körner, P.; Kronenberg, R.; Genzel, S.; Bernhofer, C. Introducing Gradient Boosting as a universal gap filling tool for meteorological time series. Meteorol. Z. 2018, 27, 369–376. [Google Scholar] [CrossRef] [Scilit]
- Moffat, A.M.; Papale, D.; Reichstein, M.; Hollinger, D.Y.; Richardson, A.D.; Barr, A.G.; Beckstein, C.; Braswell, B.H.; Churkina, G.; Desai, A.R.; et al. Comprehensive comparison of gap-filling techniques for eddy covariance net carbon fluxes. Agric. For. Meteorol. 2007, 147, 209–232. [Google Scholar] [CrossRef] [Scilit]
- Ren, H.; Cromwell, E.; Kravitz, B.; Chen, X. Using deep learning to fill spatio-temporal data gaps in hydrological monitoring networks. Hydrol. Earth Syst. Sci. Discuss. 2019, 1–20. [Google Scholar] [CrossRef] [Scilit]
- Sarafanov, M.; Nikitin, N.O.; Kalyuzhnaya, A.V. Automated data-driven approach for gap filling in the time series using evolutionary learning. arXiv 2021, arXiv:2103.01124. [Google Scholar]
- Rojo, J.; Rivero, R.; Romero-Morte, J.; Fernández-González, F.; Pérez-Badia, R. Modeling pollen time series using seasonal-trend decomposition procedure based on LOESS smoothing. Int. J. Biometeorol. 2017, 61, 335–348. [Google Scholar] [CrossRef] [Scilit] [PubMed]
- Chen, D.; Zhang, J.; Jiang, S. Forecasting the short-term metro ridership with seasonal and trend decomposition using loess and LSTM neural networks. IEEE Access 2020, 8, 91181–91187. [Google Scholar] [CrossRef] [Scilit]
- Golyandina, N.; Korobeynikov, A.; Zhigljavsky, A. SSA for Multivariate Time Series. In Singular Spectrum Analysis with R; Springer: Berlin/Heidelberg, Germany, 2018; pp. 189–229. [Google Scholar] [CrossRef] [Scilit]
- Hall, D.K.; Riggs, G.A. MODIS/Terra Snow Cover Daily L3 Global 500 m SIN Grid, Version 61. MOD10A1; NASA: Washington, DC, USA, 2021. [Google Scholar]
- Ehlschlaeger, C.R. Using the Aˆ T search algorithm to develop hydrologic models from digital elevation data. In Proceedings of the International Geographic Information System (IGIS) Symposium, Baltimore, MD, USA, 18–19 March 1989; pp. 275–281. [Google Scholar]
- Rodriguez, E.; Morris, C.S.; Belz, J.E. A global assessment of the SRTM performance. Photogramm. Eng. Remote Sens. 2006, 72, 249–260. [Google Scholar] [CrossRef] [Scilit]
- Wang, X.Y.; Wang, J.; Jiang, Z.Y.; Li, H.Y.; Hao, X.H. An Effective Method for Snow-Cover Mapping of Dense Coniferous Forests in the Upper Heihe River Basin Using Landsat Operational Land Imager Data. Remote Sens. 2015, 7, 17246–17257. [Google Scholar] [CrossRef] [Scilit]
- Ghashghaie, M.; Nozari, H. Effect of dam construction on Lake Urmia: Time series analysis of water level via ARIMA. J. Agric. Sci. Technol. 2018, 20, 1541–1553. [Google Scholar]
- Beltaos, S. Effects of climate on mid-winter ice jams. Hydrol. Process. 2002, 16, 789–804. [Google Scholar] [CrossRef] [Scilit]
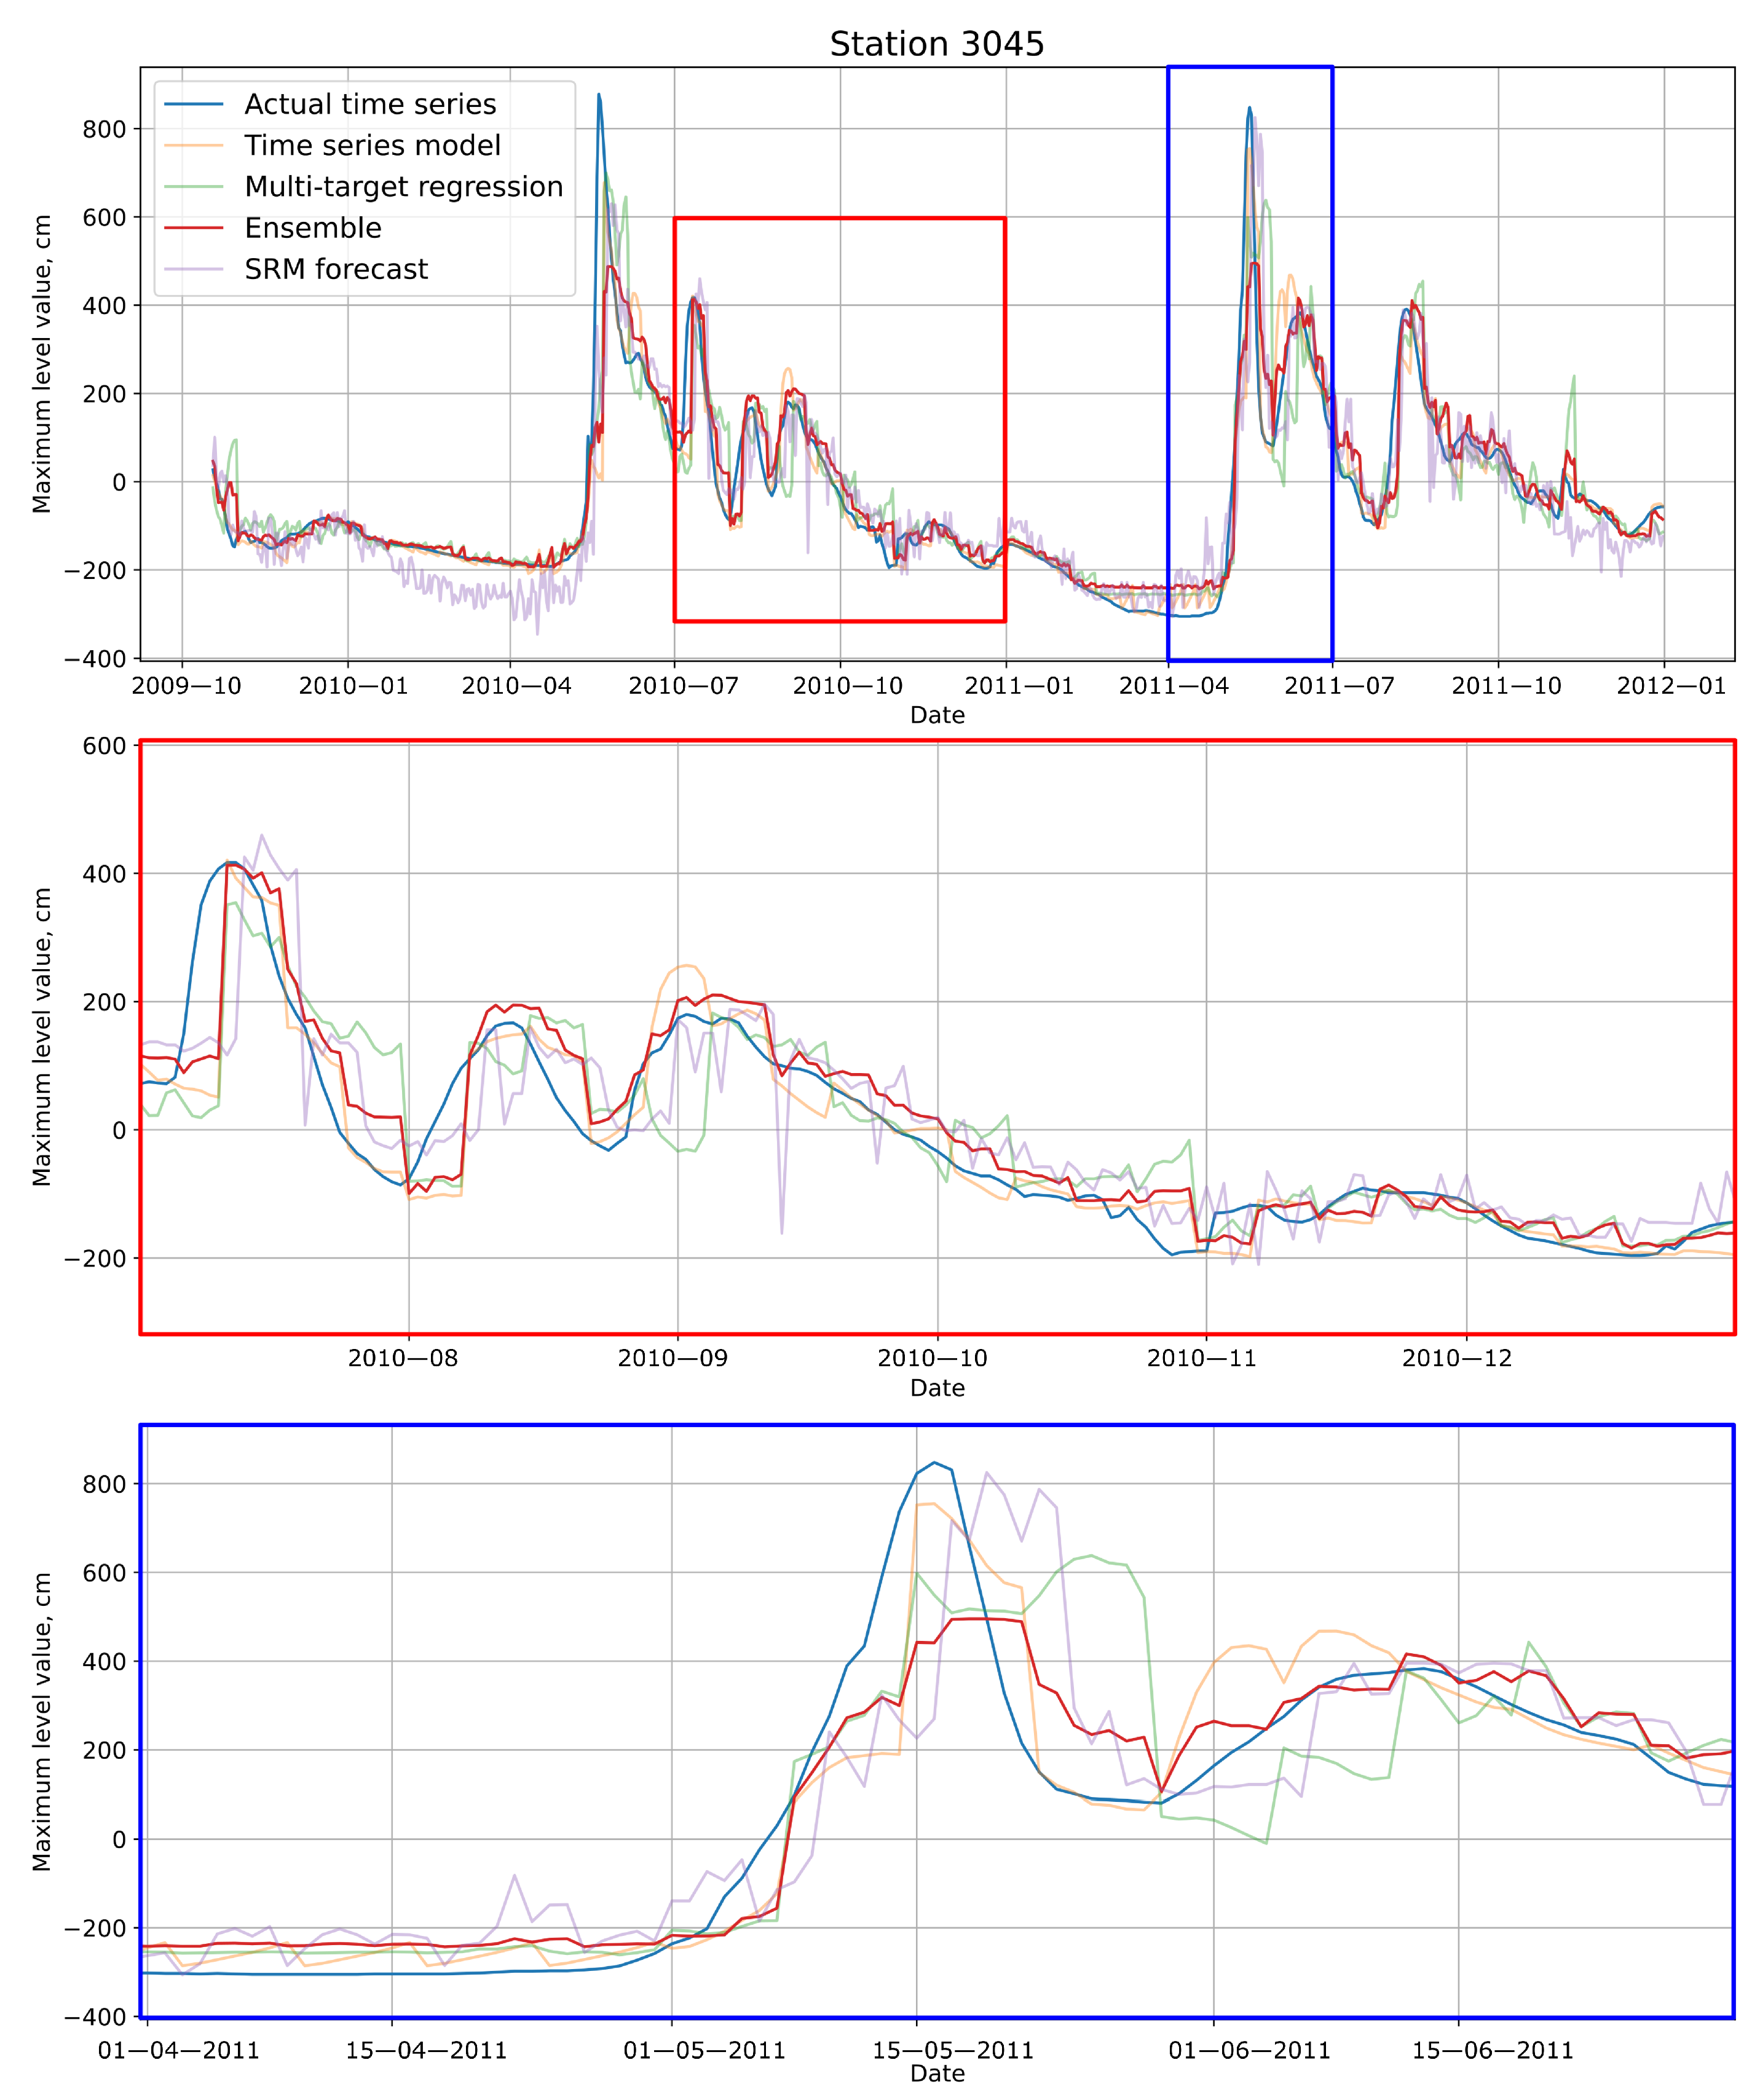
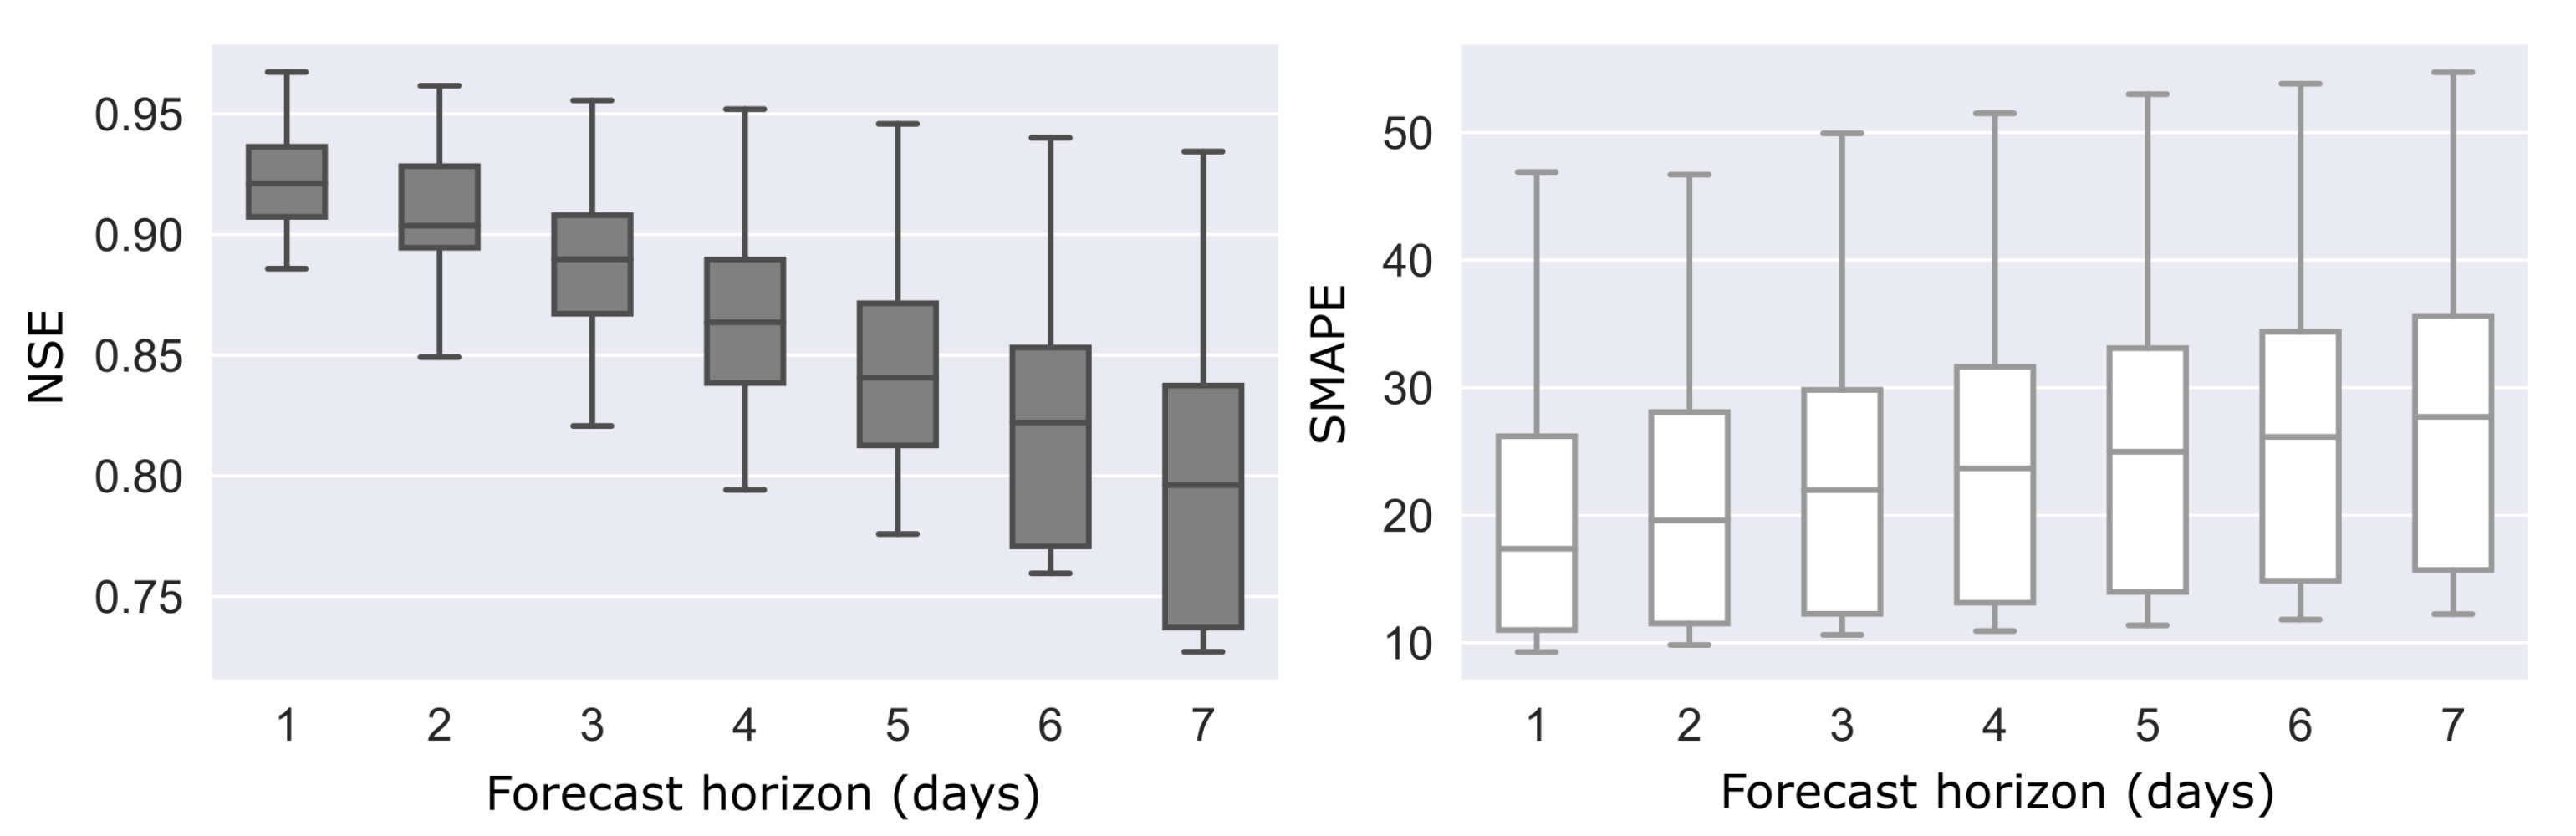
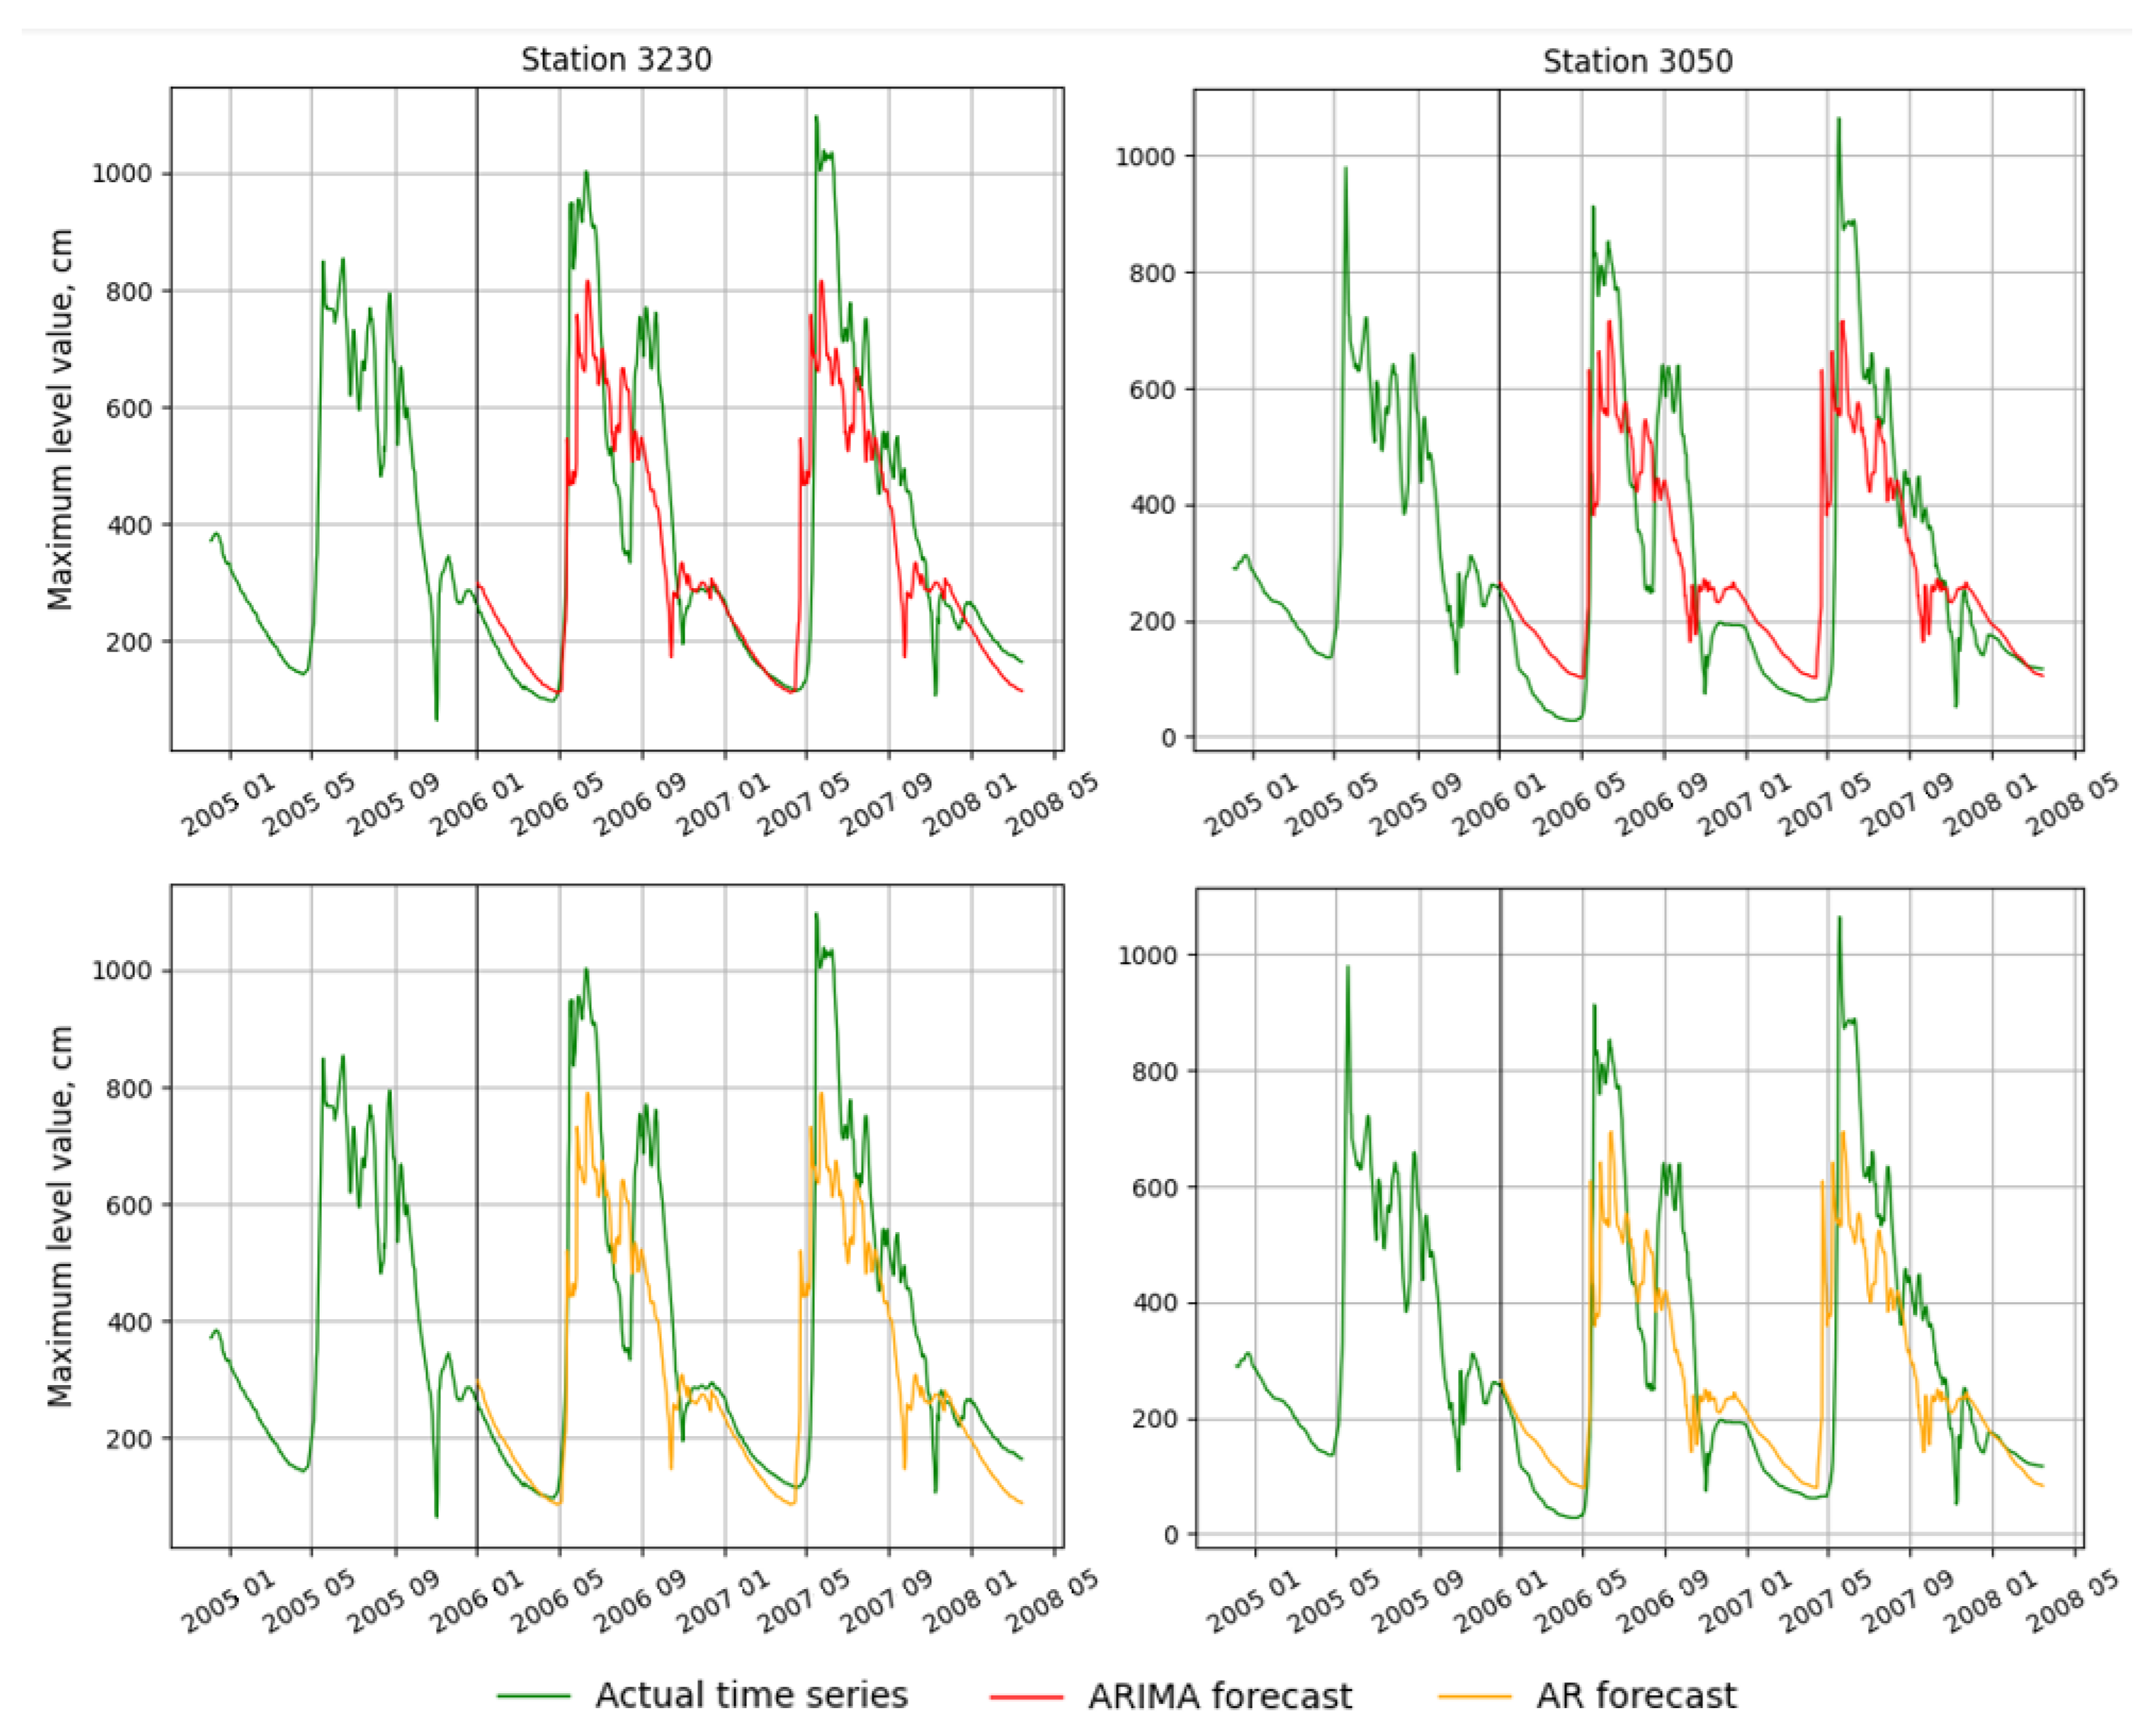

| Model | Description | Advantages | Limitations | Flood Type |
|---|---|---|---|---|
| Deep neural network [29,30] | Based only on seasonal data | Few data are required | Only rainfall flood can be simulated | Rainfall |
| Hybrid ML (ANN and K-nearest neighbors ) [31] | Determing dependence from rainfall and time step | Less prediction error than stand-alone models | Only rainfall flood can be simulated | Rainfall |
| Wavelet analysis [32] | Based on flow and meteorological time series | Relatively low forecast error | Short (1–2 days) forecast horizons | Rainfall, Snowmelt |
| Snowmelt Runoff model [33] | Transform snowmelt and rainfall water into the daily discharge | Reliable model [34], detailed user’s manual | Requires accurate snowfall data | Rainfall, Snowmelt |
| System dynamics approach [35] | Calculation of vertical water balance based on storages | Relatively low forecast error | Large amount of data are required | Rainfall, Snowmelt |
| Precipitation Runoff Modeling System [36] | Modeling based on physical equations | Detailed user’s manual | Large amount of data are required | Rainfall, Snowmelt |
| RIVICE [37] | Ice dynamics and hydraulic processes calculation | High temporal sampling rate for simulation | Large amount of data are required | Snowmelt, Ice-jam |
| AR [38], ARIMA [39] | Time series forecasting models | Few data are required | Inability to model nonlinear processes, relatively “weak” models | Common |
| Data Source | Time Step | Parameter | Description |
|---|---|---|---|
| Hydro gauges | 1 d | stage_max | Maximum water level per day, cm |
| temp | Average daily water temperature, C | ||
| water_code | Code of events registered on the river | ||
| ice_thickness | Ice thickness, cm | ||
| discharge | Average daily water discharge, m c | ||
| Weather stations | 3 h | air_temperature | Air temperature, C |
| relative_humidity | Relative humidity, % | ||
| pressure | Atmospheric pressure at station level, hPa | ||
| precipitation | Sum of precipitation between timestamps, mm | ||
| 1 d | snow_coverage_station | Snow coverage of the station vicinity, % | |
| snow_height | Snow height, cm |
| w.amp | w.mean | s.mean | s.amp | Event | 1 | 2 | 3 | 4 | 5 | 6 | 7 |
|---|---|---|---|---|---|---|---|---|---|---|---|
| 20 | 33.8 | 18.0 | 39.5 | 0 | 43 | 44 | 49 | 62 | 74 | 102 | 169 |
| 20 | 37.6 | 16.0 | 39.0 | 1 | 44 | 49 | 62 | 74 | 102 | 169 | 276 |
| 20 | 40.4 | 14.2 | 40.5 | 2 | 49 | 62 | 74 | 102 | 169 | 276 | 330 |
| 25 | 43.0 | 12.4 | 41.0 | 3 | 62 | 74 | 102 | 169 | 276 | 330 | 456 |
| 32 | 47.8 | 10.6 | 41.5 | 3 | 74 | 102 | 169 | 276 | 330 | 456 | 464 |
| Event | Importance Rank |
|---|---|
| The river has dried up | 0 |
| Distortion of water level and water flow by artificial phenomena | 2 |
| Blockage below the station | 3 |
| Metric | All Period | Spring/Summer | ||||
|---|---|---|---|---|---|---|
| Time Series | Multi Target | Ensemble | Time Series | Multi Target | Ensemble | |
| NSE | 0.74 | 0.72 | 0.80 | 0.60 | 0.61 | 0.71 |
| MAE, cm | 45.02 | 54.84 | 45.51 | 80.78 | 91.86 | 78.92 |
| SMAPE, % | 28.44 | 31.97 | 28.65 | 28.80 | 31.86 | 28.97 |
| Model | NSE | MAE, cm | ||||
|---|---|---|---|---|---|---|
| Train | Test | Validation | Train | Test | Validation | |
| Time series | 0.92 | 0.90 | 0.83 | 33.1 | 37.1 | 43.9 |
| Multi-target | 0.94 | 0.89 | 0.74 | 20.1 | 40.6 | 54.6 |
| SRM | 0.90 | 0.74 | 0.74 | 72.1 | 81.2 | 93.5 |
| Ensemble | 0.94 | 0.92 | 0.84 | 28.8 | 28.9 | 41.8 |
| Gaps Size (%) | 0 | 10 | 20 | 30 | 40 |
|---|---|---|---|---|---|
| NSE | 0.92 | 0.92 | 0.89 | 0.80 | 0.81 |
| MAE, cm | 28.9 | 28.9 | 31.4 | 35.9 | 41.1 |
| SMAPE, % | 25.4 | 26.2 | 29.9 | 33.5 | 39.2 |
| Metric | ARIMA | AR | SRM | Ensemble |
|---|---|---|---|---|
| All period | ||||
| NSE | 0.69 | 0.67 | 0.74 | 0.84 |
| MAE, cm | 90.07 | 84.14 | 93.49 | 41.80 |
| SMAPE, % | 64.95 | 55.83 | 67.02 | 36.85 |
| Spring/Summer | ||||
| NSE | 0.52 | 0.62 | 0.64 | 0.77 |
| MAE, cm | 99.74 | 92.48 | 108.59 | 75.82 |
| SMAPE, % | 63.92 | 63.77 | 59.07 | 44.30 |
Publisher’s Note: MDPI stays neutral with regard to jurisdictional claims in published maps and institutional affiliations. |
© 2021 by the authors. Licensee MDPI, Basel, Switzerland. This article is an open access article distributed under the terms and conditions of the Creative Commons Attribution (CC BY) license (https://creativecommons.org/licenses/by/4.0/).
Share and Cite
Sarafanov, M.; Borisova, Y.; Maslyaev, M.; Revin, I.; Maximov, G.; Nikitin, N.O. Short-Term River Flood Forecasting Using Composite Models and Automated Machine Learning: The Case Study of Lena River. Water 2021, 13, 3482. https://doi.org/10.3390/w13243482
Sarafanov M, Borisova Y, Maslyaev M, Revin I, Maximov G, Nikitin NO. Short-Term River Flood Forecasting Using Composite Models and Automated Machine Learning: The Case Study of Lena River. Water. 2021; 13(24):3482. https://doi.org/10.3390/w13243482
Chicago/Turabian StyleSarafanov, Mikhail, Yulia Borisova, Mikhail Maslyaev, Ilia Revin, Gleb Maximov, and Nikolay O. Nikitin. 2021. "Short-Term River Flood Forecasting Using Composite Models and Automated Machine Learning: The Case Study of Lena River" Water 13, no. 24: 3482. https://doi.org/10.3390/w13243482
APA StyleSarafanov, M., Borisova, Y., Maslyaev, M., Revin, I., Maximov, G., & Nikitin, N. O. (2021). Short-Term River Flood Forecasting Using Composite Models and Automated Machine Learning: The Case Study of Lena River. Water, 13(24), 3482. https://doi.org/10.3390/w13243482