
User Satisfaction and Crowding at Florida Keys National Marine Sanctuary
by
 , ,
, ,
Melissa Hurtado
1, 
Robert C. Burns
1,*,
Ross G. Andrew
1,
Danielle Schwarzmann
2 and
Jasmine Cardozo Moreira
3 1
School of Natural Resources, West Virginia University, Morgantown, WV 26506, USA
2
NOAA Office of National Marine Sanctuaries, Silver Spring, MD 20910, USA
3
Tourism Department, Ponta Grossa State University, Ponta Grossa 84010-330, Brazil
*
Author to whom correspondence should be addressed.
Water 2021, 13(23), 3423; https://doi.org/10.3390/w13233423
Submission received: 6 October 2021
/
Revised: 22 November 2021
/
Accepted: 1 December 2021
/
Published: 3 December 2021
(This article belongs to the Special Issue The Blue Economy: Evaluating the Human Benefits from and Pressures on Marine and Coastal Environments)
Abstract
:Effective management and monitoring of recreational use is fundamental in marine protected areas. The primary purpose of this study is to examine user’s satisfaction levels, crowding levels and the relationship between them at Florida Keys National Marine Sanctuary. Online surveys were sent via Qualtrics to email addresses obtained from the state of Florida during the summer of 2020. The results showed that the respondents felt very satisfied and only slightly crowded while snorkeling or scuba diving during their most recent 2019 trip in the Florida Keys, although satisfaction was still negatively impacted by crowding. An analysis of variance (ANOVA) showed that satisfaction levels were significantly lower in users who saw more people than they expected. A linear regression indicated significantly lower satisfaction with increasing age. Furthermore, a multiple regression showed that experiencing natural surroundings has a significant positive relationship in overall trip satisfaction, i.e., users that are more satisfied experiencing natural surroundings are also likely to be more satisfied with their overall trip satisfaction. This study suggests that the convergence of social and natural resource research and practices can help managers to create better policies that will maximize human benefits from, and minimize human pressures on, ocean and coastal environments.
1. Introduction
The International Union for Conservation of Nature (IUCN) guidelines for Marine Protected Areas (MPAs) stated that MPAs are not only vital in conserving the marine cultural heritage and supporting vital living systems of the world, but they also ensure that the use of living marine resources is sustained ecologically in those areas [1,2]. Worldwide, approximately 500 million people depend on coral reefs for food, coastal protection, building materials, and income from tourism [3,4,5]. Coral reefs provide exceptional value of ecosystem services and they are a key source of food, livelihoods and economic opportunity to people. They protect shorelines from erosion, they host a quarter of all known marine species and attract national and international tourists. Tourism, coastal development, and commercial fisheries are three specific sectors that benefit directly from the presence of functional coral reefs [6,7,8].
Outdoor recreation in marine protected areas has been increasing over the years [9,10]. People are often attracted to these areas because of the natural qualities of the environment and the recreational opportunities that can be found [11]. The increasing popularity of marine areas presents a paradox [12,13]. On the one hand, people seek to recreate in unique natural coastal environments with settings that match their needs and desires. On the other hand, the same increased recreational attention may result in negative impacts on the physical and social environment. There is a great variety of natural and anthropogenic stressors affecting reefs, including activities such as diving and snorkeling. Divers can collide with reefs and produce short and longer-term damage to corals, resulting in losses that can be exacerbated by the intensity of site use by divers [14]. Understanding the positive and negative impacts caused by people is one of the main reasons why an effective management and monitoring of recreational use is fundamental in marine protected areas.
Carrying capacity is a term that has emerged within the environmental and outdoor recreation fields of study and can be used as a potential management indicator, leading to management action if necessary. Wagar [15] was one of the first authors to relate the term to recreational use, and stated that wild lands should have maximum recreational carrying capacity limits. Wagar analyzed the human, ecological and management considerations that must go into administrative decisions to limit recreational use. Carrying capacity refers to the amount of users that can be accommodated at a given site or area without negatively affecting the biological environment or the experience, and this definition is still applicable across cotemporary settings [16,17,18]. A three-dimensional view describes three types of carrying capacity: resource, social and managerial [17]. Determining the carrying capacity of an area is important from an ecological and social perspective [19]. Thus, it is critical to accommodate the optimum levels of use in order to guarantee the best possible recreational experience for visitors while preserving natural resources [20]. Studies have shown that the concept of social carrying capacity is more common in the U.S than in European countries. Nonetheless, it is suggested that managers incorporate social carrying capacity issues into recreation ecology studies in order to improve the integration of scientific disciplines [19].
A background examination of social carrying capacity leads to two important terms: satisfaction and crowding. There are many different variables that can influence overall satisfaction and crowding levels [21]. To understand the concept of satisfaction, it is necessary to understand the basis of expectancy disconfirmation. Disconfirmation take place “when there are differences between what one receives and what he or she wanted to receive in an experience” [22]. The expectancy theory suggests that recreationists fulfill selected needs and motivations while recreating; therefore, the congruence between expectations and outcomes is typically defined as satisfaction [17]. In this case, it is also known that finding specific fauna and impressive ecosystems can be key expressive attributes of satisfaction in protected areas [23]. Contemporary literature about user satisfaction in MPAs suggests that establishing channels of communication between stakeholders (e.g., managers, scientists, fishermen, and divers) and cultivating good relations amongst these groups can increase their satisfaction and help assure management success [24]. Other studies have used Importance-Performance Analysis (IPA) techniques to examine the users’ satisfaction on the sustainable management of MPAs [25] and users’ satisfaction on coral restoration projects [26]. Studies from Carvache-Franco et al. [23,27] have done a great job exploring the users’ satisfaction and motivations of ecotourism in the contemporary literature of MPAs.
On the other hand, crowding is related to an individual judgment on the density of people. However, the normative approach suggests that use level is not interpreted negatively as crowding until it is perceived to disrupt the users’ objectives or values. It is important to recognize that the recreation experience can have potential threats to satisfaction resulting from crowding or conflicts between recreationists [16,17,22]. The perception of crowding can also be influenced by the amount of people that a user expects to see. Hence, it is suggested that management agencies deliver to the visitor proper communication or education on the amount of people that can be expected in certain areas [28,29].
The primary purpose of this study is to examine the satisfaction and crowding of people recreating at Florida Keys National Marine Sanctuary. There are different variables that can influence overall satisfaction and crowding levels, and this study compares these variables across recreation user types, such as snorkelers and divers, and other demographic variables in the sanctuary. The specific objectives of this paper include: (1) describing the sample of users and their socio-demographics; (2) defining user satisfaction levels for overall trip experience; (3) defining user crowding levels; (4) identifying if the perception of crowding impacts users’ level of satisfaction. Satisfaction can be identified as a human benefit derived from marine and coastal environments in this study. However, with high levels of recreational use comes the potential for added pressures on these environments. By examining and understanding the relationship between satisfaction, crowding, and other segmentation characteristics of users, we hope to help define carrying capacity for both social and ecological thresholds in this setting.
This study is part of a larger scale project called National Marine Sanctuaries Visitor Counting Process (NMS-COUNT) [30], which will be used to aid NOAA management decisions regarding recreational use in national marine sanctuaries. It is clear that Florida Keys National Marine Sanctuary is a touristic destination that offers users several recreational activities such as world-class diving, swimming, snorkeling, and fishing. Therefore, an understanding of social and natural resource carrying capacity can help managers to create better policies that will maximize human benefits from, and minimize human pressures on, ocean and coastal environments.
2. Materials and Methods
2.1. Study Area
Florida Keys National Marine Sanctuary is part of the National Marine Sanctuary System and is administered by the National Oceanic and Atmospheric Administration (NOAA) Office of National Marine Sanctuaries (ONMS). NOAA defines National Marine Sanctuaries as “protected waters that include habitats such as rocky reefs, kelp forests, deep-sea canyons, and underwater archaeological sites” [31]. The National Marine Sanctuaries Act established Florida Keys National Marine Sanctuary for the purpose of “managing and protecting the conservation, recreational, ecological, historical, scientific, educational, cultural, archaeological or aesthetic resources and qualities of a national marine sanctuary” [32]. Florida Keys National Marine Sanctuary was designated on November 16, 1990 and now protects 2,900 square nautical miles of waters. The boundaries of the sanctuary are from south of Miami, Florida to the Dry Tortugas, although it excludes Dry Tortugas National Park (Figure 1). This sanctuary protects a coral barrier reef, extensive seagrass beds, mangrove-fringed islands, more than 6000 species of marine life, as well as historical and archeological heritage such as shipwrecks [33].
2.2. Data Collection
Two survey instruments, one designed for general use information and one designed for more economic information related to scuba divers and snorkelers in Florida Keys National Marine Sanctuary were part of the NMS-COUNT project [30] and were the two survey instruments used for this study. The questions selected from the survey instruments were designed to measure recreational satisfaction and crowding levels. The survey instruments used for the NMS-COUNT project included other questions related to the users’ trip characteristics. The authors will examine the relationships between coral reef perceptions and satisfaction on a different manuscript.
The examination of overall satisfaction measurements varies throughout the outdoor recreation literature. Many studies have paid attention to overall satisfaction, measured with a single item [22,34,35]. In this study, the overall trip satisfaction scores were collected using a single item, 10-point scale with increasing values, meaning a higher satisfaction level (i.e., 1 being not at all satisfied and 10 being extremely satisfied). However, other studies have shown that multiple-item scales have been developed to measure alternative dimensions of satisfaction and some studies have stated that multiple-item scales are more useful than single-item measures [17,28,36,37]. Therefore, a second question about satisfaction was included in the survey. This question asked respondents to rate the satisfaction of eight different environmental items on a scale from 1 to 5 with 1 being not at all satisfied and 5 being extremely satisfied.
Crowding scores were similarly collected using a 9-point scale with four levels of description, i.e., not at all crowded, slightly crowded, moderately crowded and extremely crowded [38]. This single-item crowding measure has been widely used in outdoor recreation research [29]. On the other hand, studies often evaluate the density of other participants as negative or neutral, but do not always have the option of assessing the density of participants positively [39]. In order to give to the respondents a second alternative to evaluate crowding, they were asked to report how the number of people they saw compared with what they expected to see, the six answer options varied from a lot less than expected to a lot more than expected. Finally, basic socio-demographics, such as age, gender, ethnicity, race, education, income and residence, were also collected and examined. The questions selected from the survey instrument can be seen in Table 1.
While the original aim for this study was to collect data through in-person interviews in Florida Keys National Marine Sanctuary, the ongoing COVID-19 pandemic precluded in-person activities. Accordingly, a database of active recreationists who hold various Florida outdoor recreation licenses (e.g., fishing licenses, boating licenses, diving licenses) was used to obtain a sample for the study. The database included people from around the United States, with the greatest proportion (89%) of the responses from Florida. A small minority of respondents came from states other than Florida (e.g., 4% from Michigan, 2% from Alabama, 1% from Ohio, 1% from Illinois). The survey distribution followed the Dillman method [40], which describes the most desirable web surveying practices for contacting and reminding respondents about survey participation. After the first personalized email with the survey link, two weekly reminder emails were sent to the non-respondents to increase the likelihood of a response. The respondents were able to skip questions while taking the survey on Qualtrics. For this reason, valid and missing numbers vary greatly for each variable, resulting in variance of sample size for specific questions (Tables 2, 3 and 5). The total number of effective survey contacts was 1077. Effective survey contacts are represented as those recipients who received the email to a legitimate email address and opened the email (was not sent to junk mail folder, etc.) From those effective survey contacts, 791 surveys were completed, for an effective response rate of 73.4%.
2.3. Data Analysis
The database with the survey responses was exported from Qualtrics as a CSV file, then imported and analyzed on the IBM Statistical Package for the Social Sciences (SPSS) v.27. The majority of the answers were recoded from categorical to numerical in order to run statistical tests (e.g., 1 = male, 2 = female). An alpha level of 0.05 was used to determine significance for all analyses. This study is divided into four sections: (1) sample profile; (2) satisfaction; (3) crowding; and (4) relationship between satisfaction and crowding. The first section describes the socio-demographic profile of survey respondents with the valid percentage and frequencies of each item. The second section is about satisfaction and describes the means, valid percent and frequencies of satisfaction levels by socio-demographics and user type (i.e., snorkeler vs. scuba diver). It also contains an independent t-test to see the difference in the overall satisfaction level mean between user types, independent sample t-tests and ANOVAs to identify the mean satisfaction level differences between each socio-demographic group, a regression to test the relationship of age and overall satisfaction, and a regression to test the relationship between overall satisfaction and satisfaction of a list of environmental items.
The third section is about crowding, and similarly to satisfaction, this section describes means, valid percentages, and frequencies of crowding levels by socio-demographics and user types. Independent t-tests and ANOVAs of crowding level between user types and socio-demographic groups, as well as regression of age and crowding level, are done for analyses. The fourth and final section is about the relationship and influence that crowding has on overall satisfaction. This section presents a linear regression to test the relationship between crowding and satisfaction levels. It also presents an ANOVA of crowding expectations and overall satisfaction.
3. Results
3.1. Sample Profile
The socio-demographic profile of the respondents included their residence status, age, sex, race, ethnicity, education and income levels (Table 2). The results showed that a majority (75.2%) of the respondents were visitors, while 16.2% were permanent residents of Monroe County, Florida and 8.6% were seasonal residents of Monroe County. The average age of the respondents was 53.4 ± 0.6 years and the majority were male (75.5%). Regarding race and ethnicity, 91.5% classified themselves as white and 82.9% as non-Hispanic. Overall, the sample was highly educated, with a high income. More than half of the respondents (66.2%) had at least a college graduate completed and a considerable number (62.8%) indicated an annual household income of over $100,001. The statistical analyses performed showed that satisfaction level did not differ significantly across any of the presented socio-demographic groups.
3.2. Overall Sastisfaction Level
Considering the most recent 2019 snorkeling or scuba diving trip to Florida Keys National Marine Sanctuary, the respondents rated their overall satisfaction level as 8.1 ± 0.1 on average. The median value reported for this variable was 8.5 and the mode was 10 (Table 3).
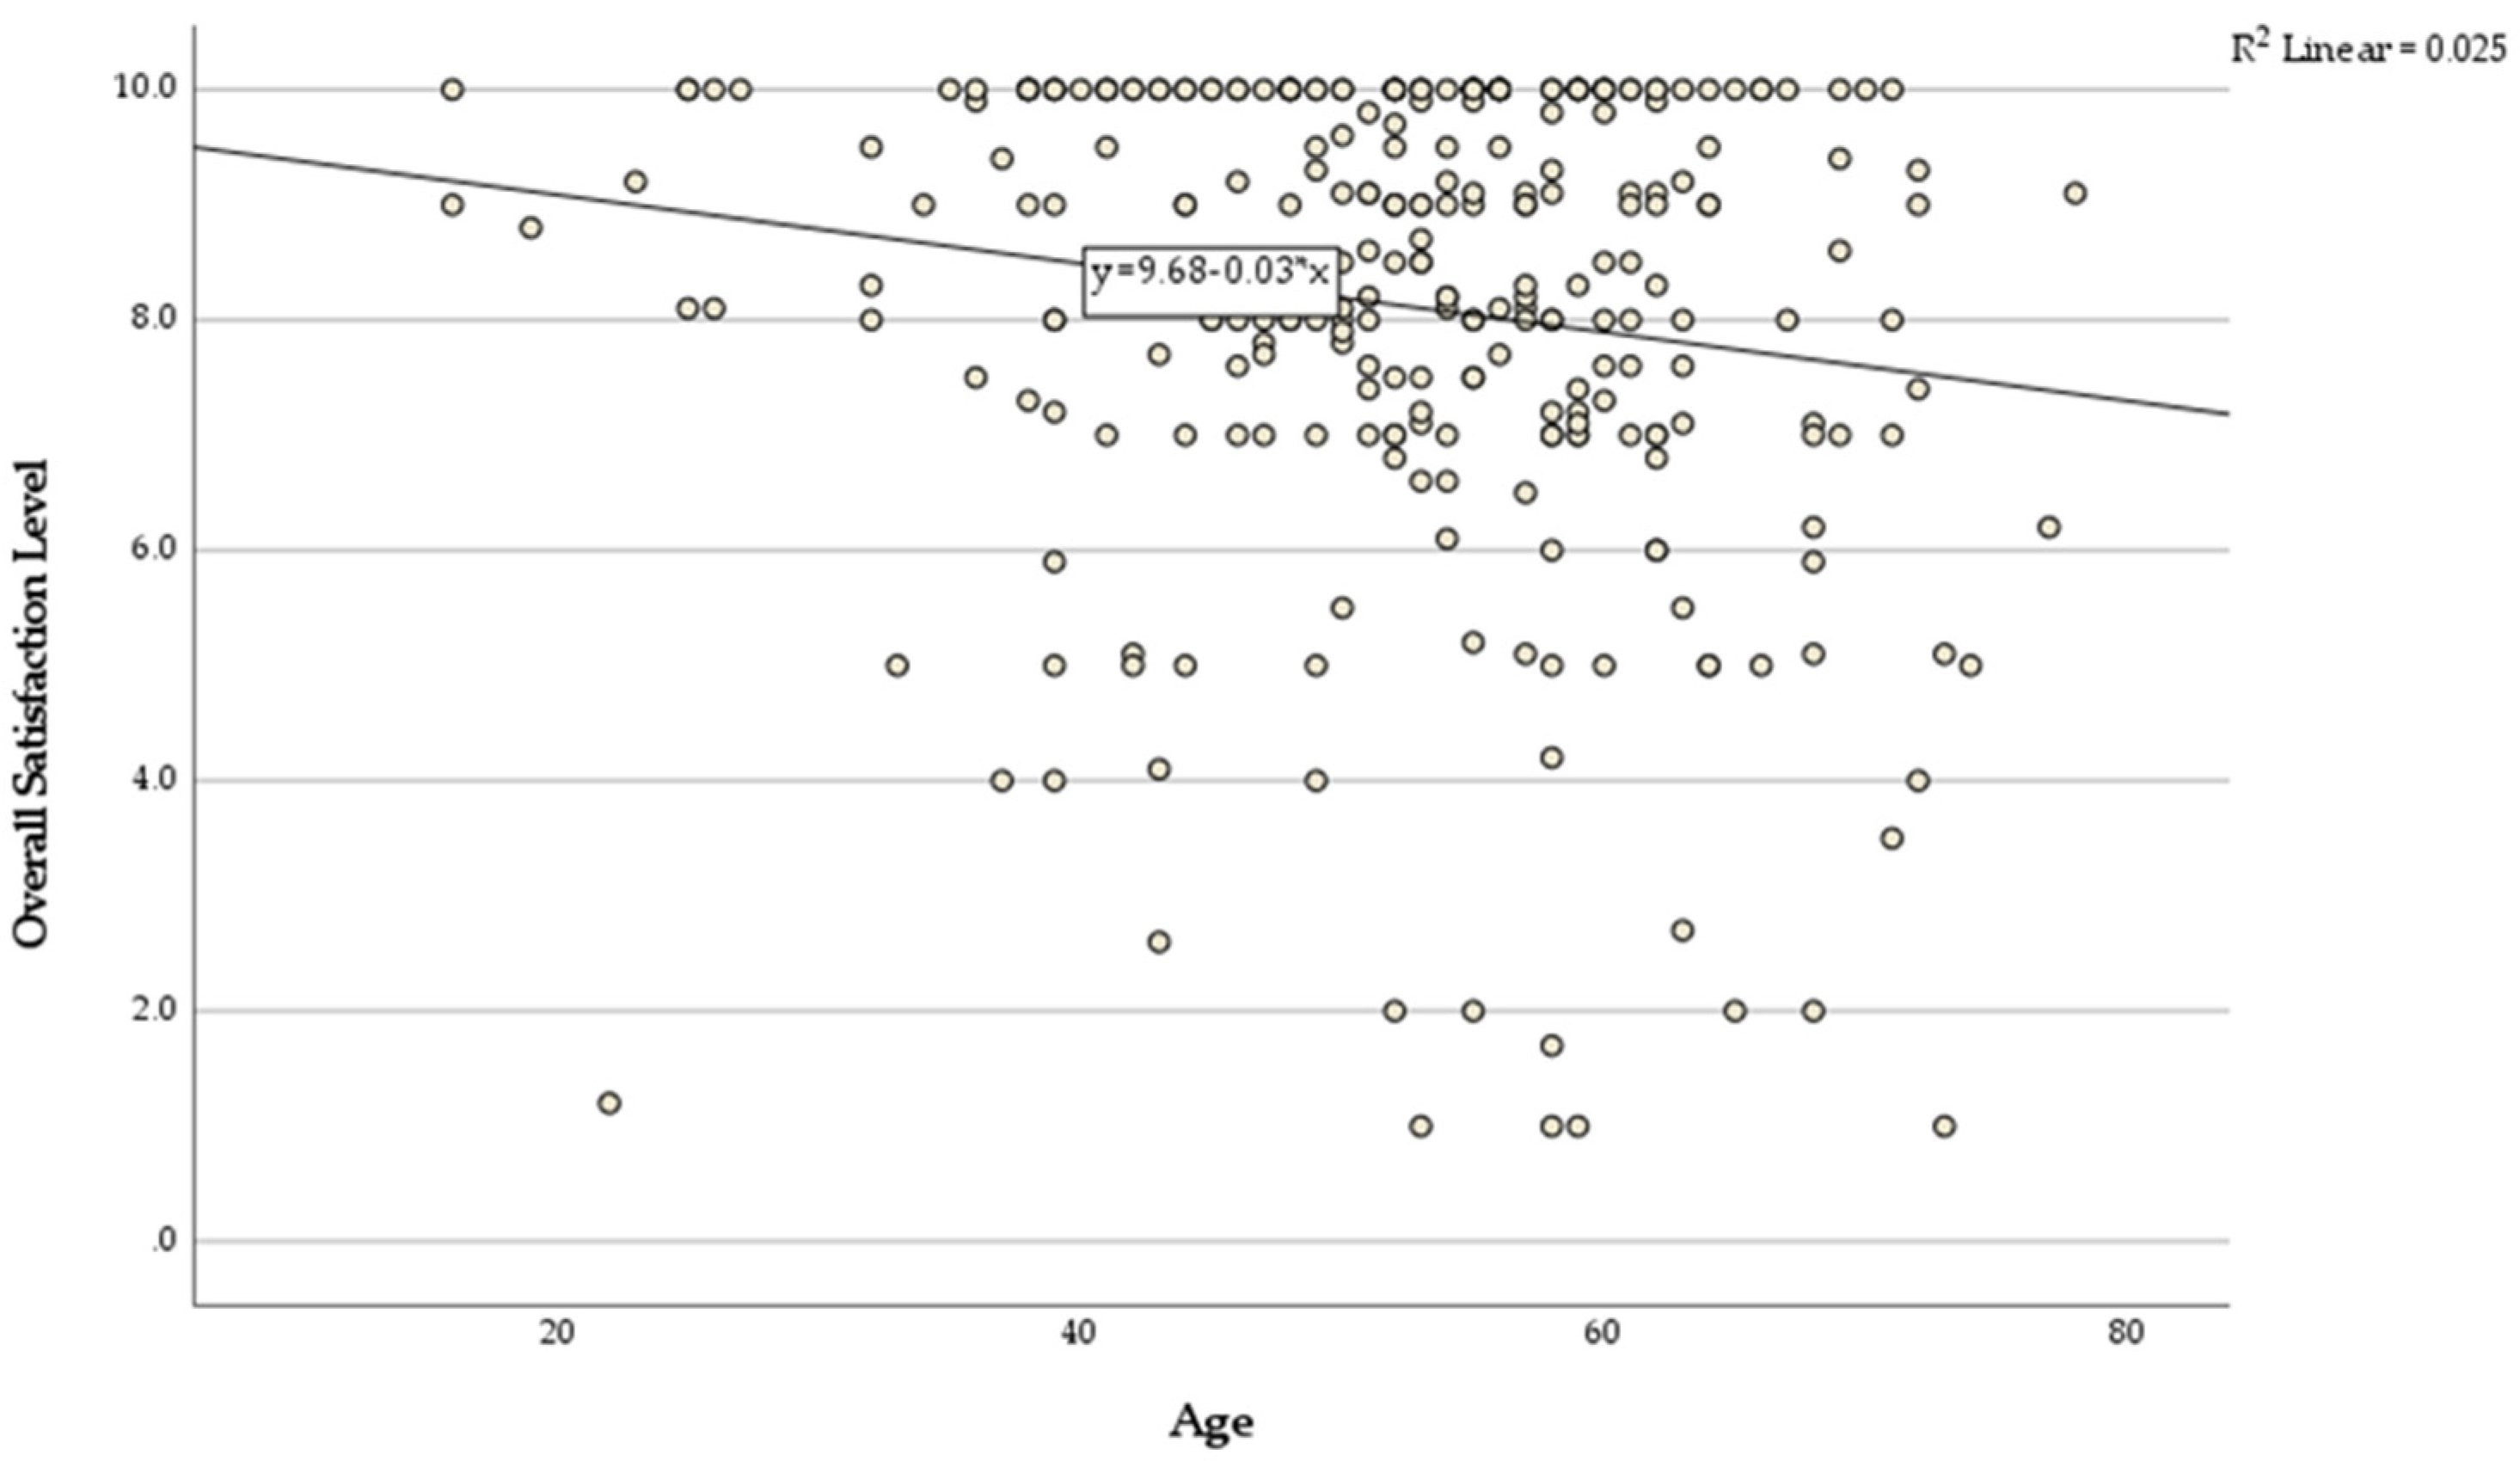
Independent sample t-tests and ANOVAs were run to identify the mean satisfaction level differences between each socio-demographic group. No statistical differences were detected across all groups with respect to overall satisfaction level. Linear regression between overall satisfaction and age showed a significant (p = 0.008; β = −0.157; R2 adj. = 0.021) negative relationship. This means that for every additional year in age, the mean satisfaction level is expected to drop by 0.157 units; in other words, this result showed that the level of overall satisfaction decreases as age increases (Figure 2).
Respondents were asked to rate how satisfied they were with a set of eight environmental items in their most recent trip to Florida Keys National Marine Sanctuary (Table 4). The results compared overall satisfaction to the eight different environmental predictor values. Out of the total, only the item experiencing natural surroundings (p = 0.013; β = 0.318; R2 adj. = 0.308) showed a significant positive relationship. This means that for every unit of satisfaction that increases in this environmental item, the mean of overall trip satisfaction level is expected to go up by 0.31 units. In other words, this result showed that the respondents that are very satisfied with experiencing natural surroundings during their trip are also likely to have a high level of overall trip satisfaction.
3.3. Crowding Level
The survey instrument included a question that asked how crowded the respondents felt while actively snorkeling or diving during their most recent 2019 trip at Florida Keys National Marine Sanctuary. The scores varied from 1, being not crowded at all, to 9, being extremely crowded. The results showed that the crowding mean level was 4.3 ± 0.1, the median reported for this variable was 4.2 and the mode was 5.0. These responses fall into the category of slightly and moderately crowded (Figure 3). The number of valid answers for this question was 371.
An independent sample t-test was run to identify the differences in the crowding level mean between user types, (i.e., snorkelers and scuba divers). However, no statistical differences were detected between these groups (p = 0.938). Consequently, the data showed that snorkelers (4.3 ± 0.1) and scuba divers (4.3 ± 0.2) had the same average crowding level. Independent sample t-tests and ANOVAs were run to identify the mean crowding level differences between each socio-demographic group. The results showed that crowding level did not differ significantly across these groups, except for the education variable (p = 0.05). The respondents that had some college as their highest grade of school completed indicated the lowest crowding level (mean = 3.9), while the respondents that were college graduates indicated high crowding levels (mean = 4.7). This result does not represent a relevant trend, since respondents with the lowest education level completed, in this case high school graduates, also indicated a high crowding level (mean = 4.7). Finally, a linear regression was run between crowding and age to predict the relationship between these two variables and the results showed that there are no significant differences (p = 0.442; β = -0.046; R2 adj. = -0.001). The means of overall crowding level by socio-demographic categories in survey responses are shown in Table 5.
3.4. Relationships between Satisfaction and Crowding
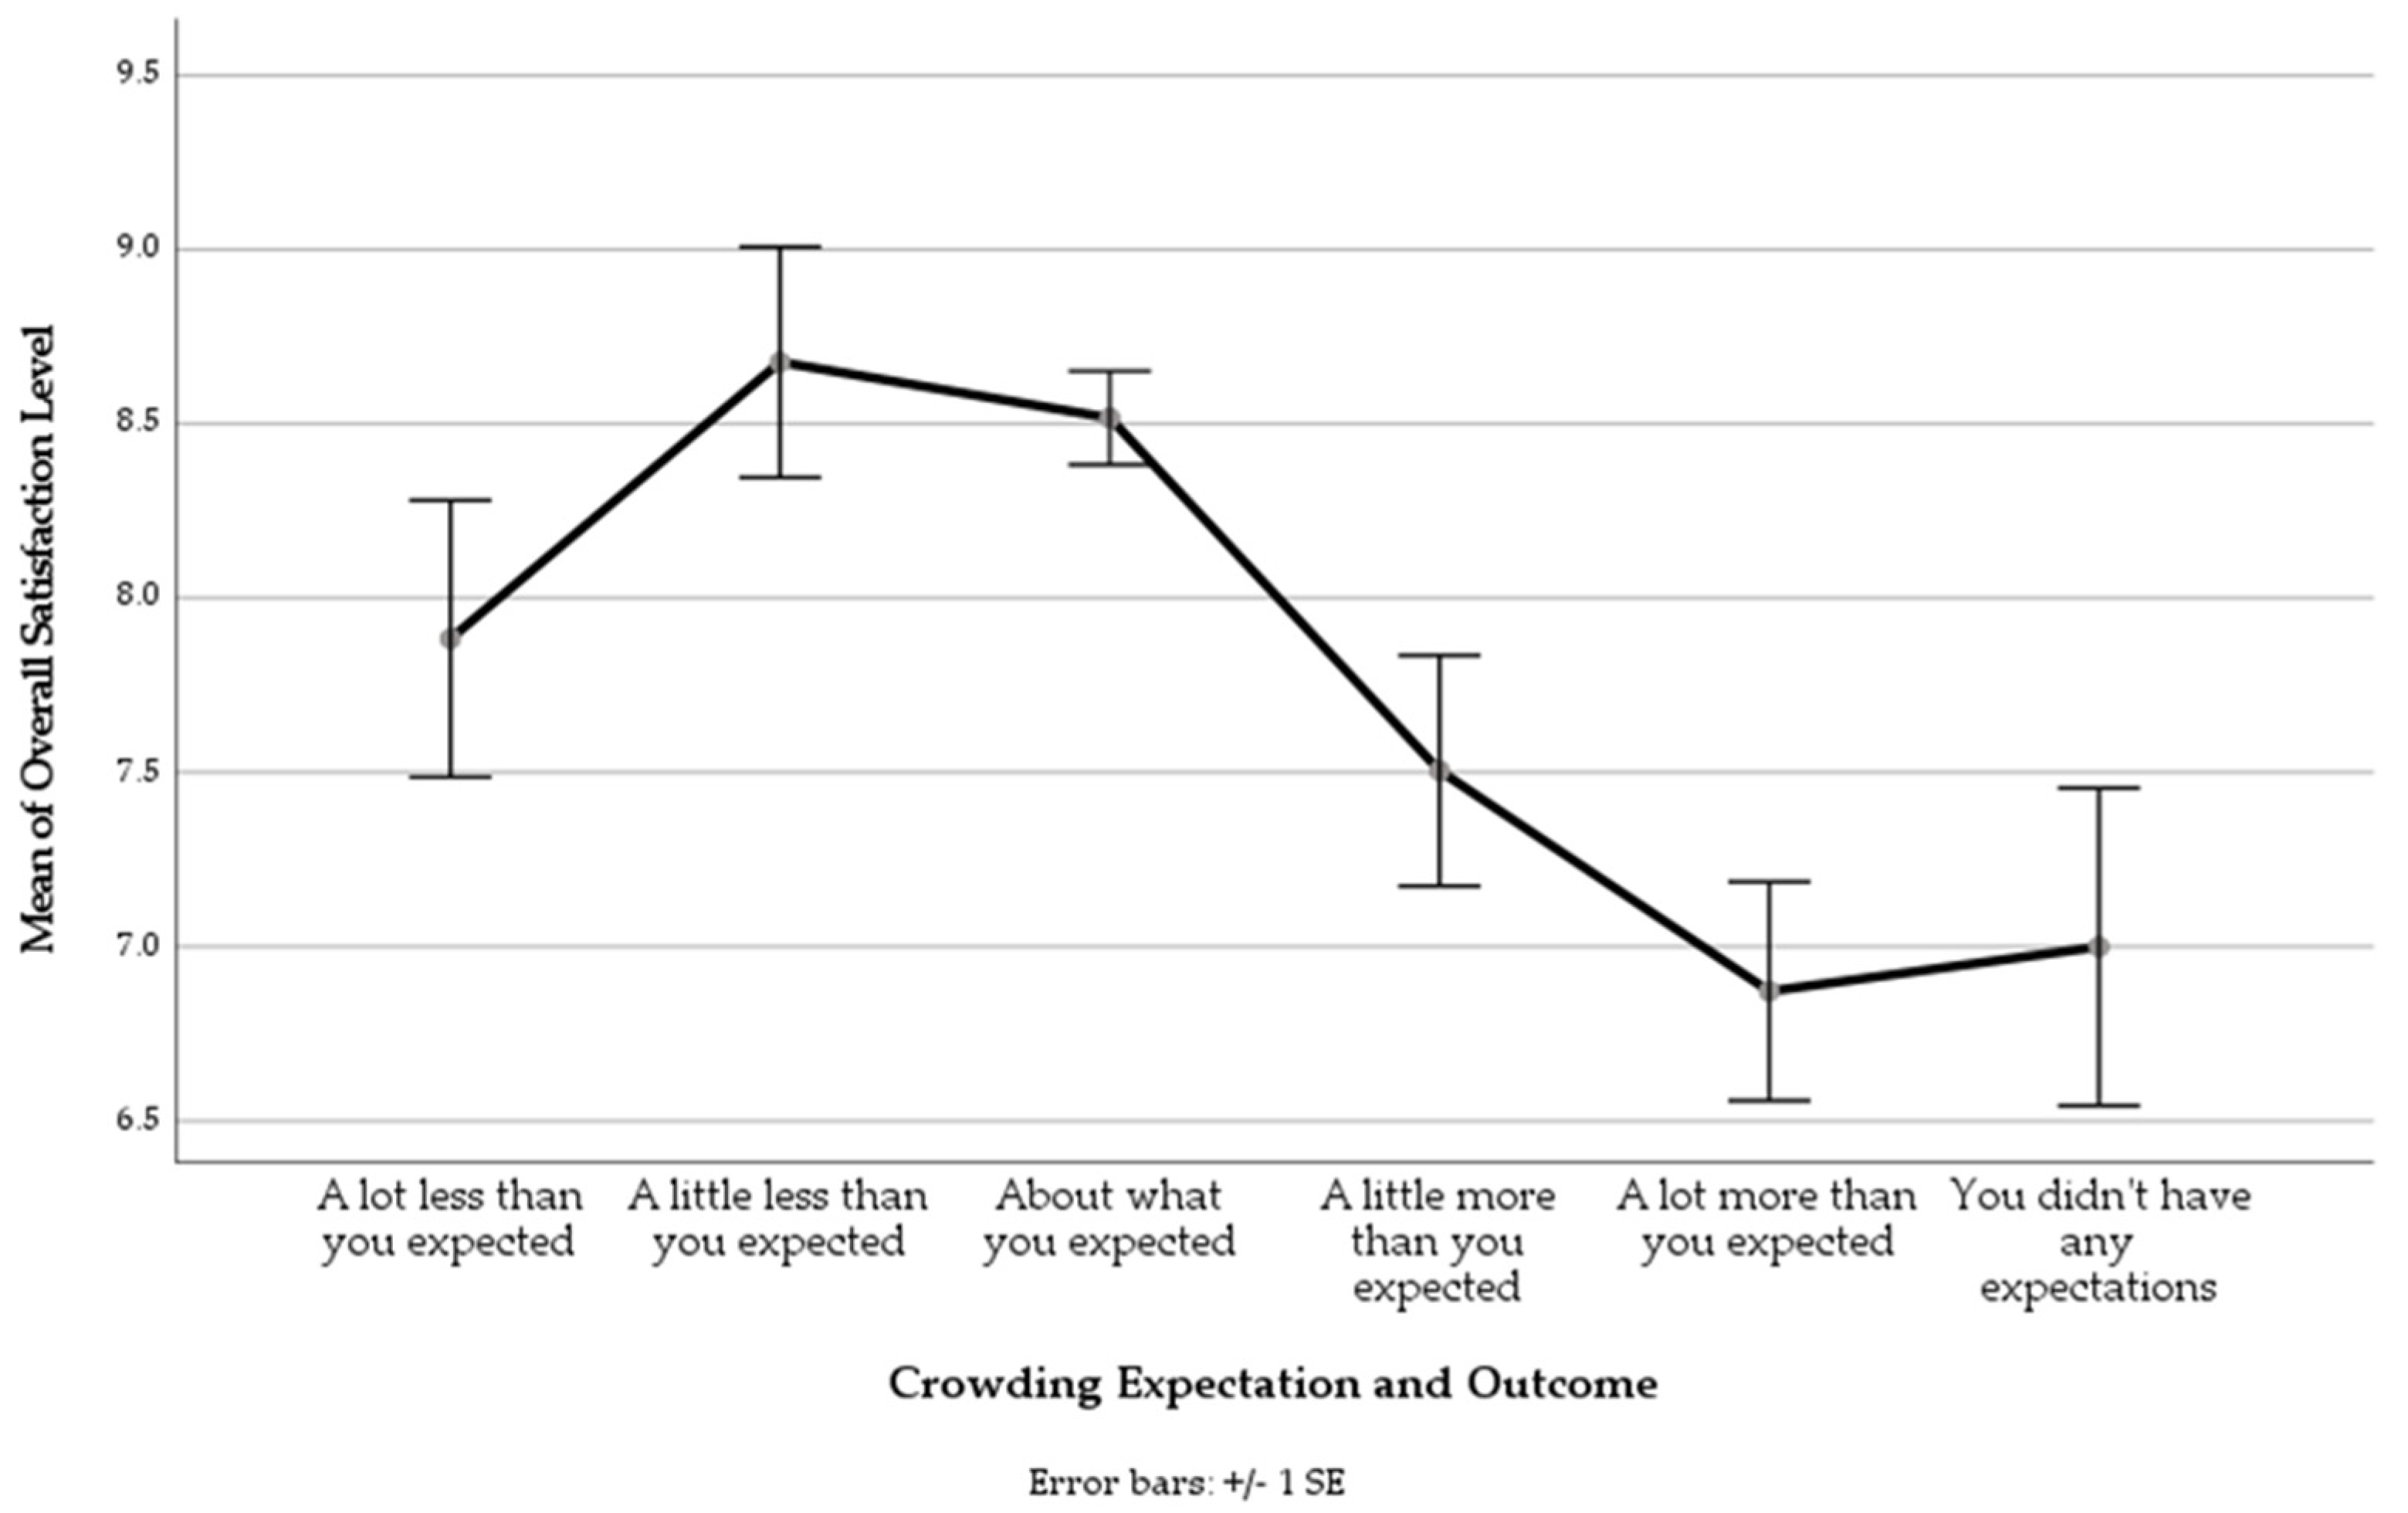
Visitors can have reductions in satisfaction resulting from crowding and for that reason, research indicates that crowding perceived levels can negatively influence the overall trip satisfaction [22]. However, the linear regression between overall satisfaction and crowding levels was not significant (p = 0.062; β = −0.099; R2 adj. = 0.007) in this study. Another question in the survey instrument assessed crowding level through expectation of the number of people seen compared with expectation. An ANOVA among satisfaction level and this alternative measurement of crowding level indicated significant differences across the six different crowding scale points (F = 7.443; p ≤ 0.001). Multiple comparisons using least significant differences illustrate a generally negative relationship between crowding expectation outcome and satisfaction (Figure 4). This test showed that satisfaction levels were significantly lower in users who saw more people than they expected. The test of homogeneity of variances based on mean (i.e., Levene’s test) was significant (F = 9.58, p ≤ 0.001); therefore, the test indicated unequal variances.
4. Discussion
The sample of users in this study were predominantly middle-aged, well-educated, white males with a high income. Understanding the socio-demographic profile of the users in Florida Keys National Marine Sanctuary is fundamental to provide equitable and inclusive recreational opportunities. Unfortunately, despite a relatively high ethnically and racially diverse population in the United States, studies indicate that minorities are underrepresented in outdoor recreation and visitation [41]. Research has shown the gender differences that exist in the outdoors, emphasizing the fact that men are more likely to participate in outdoor recreation activities than women [42,43,44]. Simultaneously, the sample of respondents in this study indicated that 24.5% were female while 75.5% were male. Race and ethnicity are also a key element of diversity and inclusion. Results of this study showed that only 8.5% of the sample identified as non-White and 17% identified as Hispanic. Therefore, there is little involvement of non-White populations and a negligible proportion of the Hispanic population recreating in Florida Keys National Marine Sanctuary. The National Survey on Recreation and the Environment 2000 published the current participation patterns in marine recreation in the US and showed that the majority of participants are highly educated men with high incomes [45]. Another study showed that income is one of the major variables affecting the choice of coastal recreation activities [46]. From a managerial perspective, a research study pointed out the income requirements of marine protected areas, since northern hemisphere MPAs with high incomes still claim to be under-funded [47]. However, there is a lack of recent research about visitor profile monitoring in MPAs.
The underrepresentation of minority populations (e.g., Hispanic, Black, American Indian, etc.) suggests that inclusion should be a point of attention in outdoor recreation management [48,49]. Only a small proportion (7.8%) of the sample reported an annual household income of under $25,000. This suggests that people with very low income levels were not captured in the surveyed activity types within the sanctuary [50]. While the majority of respondents were visitors, some of the responses were from permanent residents of the local area around the sanctuary. Permanent residents had higher rates of response than seasonal residents, which could be related to their level of interest and engagement in the visitor use management of this sanctuary. Providing equitable recreation opportunities can be very complex but it can be greatly beneficial for all the stakeholders involved and especially for the conservation of Florida Keys National Marine Sanctuary [41,50,51].
One of the limitations of this study include nonresponse errors. There are potential methodological complexities with the use of online questionnaires. In this study, the survey data collected was coming only from the people who decided to open the Qualtrics link that was sent via email and took the online survey. Therefore, the study did not include all the actual people visiting and recreating in the Sanctuary. Research shows that there could be relationships between nonresponse rates and nonresponses bias [52]. A great example to understand this could be that the people who have high incomes may often have desk jobs and are more likely to answer an online survey compared to the people with lower income jobs that have manual jobs. There is a possibility that nonresponse error may bias the findings of research studies. Preventative measures such as the Tailored Design Method (TDM) and sample size determination could have been used in order to minimize nonresponse errors in this study [53].
Other research has indicated lower concern about facilities and services provided during recreational use associated with high levels of income and education in users [54]. However, this study found no significant relationships or differences among sociodemographic endpoints defined by groups and satisfaction levels. Overall, satisfaction was quite high, and the only significant trend was associated with age when modeled as a continuous variable to indicate a lower satisfaction level with increasing age. Some of the suggestions shared by Florida residents in the Statewide Comprehensive Outdoor Recreation Plan (SCORP) indicated that there should be an improvement in the variety of recreational opportunities for people of all ages [55]. Research has shown that the aging population, especially baby boomers, are known to have good health conditions, high incomes and the desire to recreate outdoors [56,57]. Respondents that are 51 years or older and have household incomes over $100,001 make up the majority of the sample of this study, which holds potential for significant financial contribution to the local economy and development of Florida Keys National Marine Sanctuary. It is also important to remember that satisfaction can be linked to the fulfillment of motivations and expectations [58]. Therefore, studying satisfaction and motivations of this aging population can be a key element to maintain the benefits that come from recreation and go into the social and economic development of this area.
People recreate for different reasons, such as being outdoors, relaxation, getting away from a regular routine, being with friends and family, developing skills, etc. In this case, having the opportunity to see a healthy reef, experience adventure, good underwater clarity and natural surroundings while snorkeling or scuba diving can influence satisfaction. In this study, experiencing natural surroundings was a significant predictor item that showed a positive relationship to satisfaction. Studies in ecotourism also showed that finding megafaunas and inspiring ecosystems are key expressive attributes of satisfaction in protected areas; other factors can include tranquility and conservation of natural heritage [23]. This research also showed that positive attitudes toward the natural environment are associated with higher levels of satisfaction in the visitation of natural protected areas [59]. Different people might have different reactions to the same environment [60], therefore, as a suggestion for future research directions in this field, we recommend a study that identifies differences in satisfaction levels between people with pro-environmental values and those with anti-environmental values. Research about satisfaction in MPAs have showed that user satisfaction can be influenced by different variables such as health of coral reefs [26], customer service received and access to the infrastructure [23]. However, there is a lack of studies that focus on the user satisfaction affected by crowding in MPAs.
This study investigated the crowding levels of users who were actively snorkeling or scuba diving during their most recent 2019 trip in Florida Keys National Marine Sanctuary. The results showed that the crowding mean level was 4.3 ± 0.1, which falls under the category of slightly crowded. The data showed that crowding was not statistically related to demographics such as income, age and even user type (i.e., snorkeler vs. diver). The results also showed that crowding level did not differ significantly across these groups except for the education variable. Other studies have shown that visitor age is a significant predictor for crowding [61,62,63] and prior studies also found that females are more uncomfortable with crowding than males [62,64]. Other types of factors can influence perceived crowding levels, as another study highlighted that expectations regarding use levels significantly influence perceived crowding [65]. Factors such as parking waiting time, waiting time at different recreational sites, reported level of use and acceptable level of use can also significantly influence perceived crowding [20]. Enjoyment may be negatively impacted by crowding for recreationists, but users may also employ a combination of cognitive and behavioral coping strategies to maintain their enjoyment when perceived crowding is high [62,66,67].
Research related to crowding perceptions has been traditionally focused on terrestrial and not on marine settings but there are considerable differences in terms of social carrying capacity between these two environments [68,69]. A snorkeler or scuba diver will see structural features of the underwater landscape, such as coral reefs, in a large variety of shapes and sizes while the person is floating or swimming above them [70]. Research indicates that coral reefs are unfamiliar environments to most people and visitors have different cognitive perceptions when interpreting the features they see around them [68]. On top of having a unique underwater experience surrounded by marine biodiversity, having multiple unexpected encounters with different people may affect the recreational experience. First-time visitors can also have different perceptions from repeat visitors. In this case those who are more experienced and specialized in marine recreation hold stronger preferences for the number of people they observe in the setting and may be less tolerant than novice first-time visitors. This suggests that experienced snorkelers and scuba divers may seek feelings of solitude as an important component of their experience [68]. The respondents of this study reported to feel somewhat crowded while snorkeling and diving in Florida Keys National Marine Sanctuary. Even though it is not a high level of crowding, this result supports the importance of providing to the users the opportunity of experiencing a feeling of solitude while practicing the activity if desired. The findings of this study showed that crowding at Florida Keys National Marine Sanctuary is not an issue today, but there is still a possibility that it may be a problem in the future. Research that monitors recreation is needed in this area to record reliable data of crowding and satisfaction levels today; thus, it will also be possible to compare this data 20 years from now, if needed. An example of this management practice can be seen in a study that started in 2010 on perceived crowding of climbers on Mt. Baker, WA and Mt. Hood, OR [71] and the concept continues to be analyzed in the area until today [72].
When overall satisfaction levels were compared in this study across groups categorized by an alternative variable of crowded defined by expectation, significant differences were illustrated. This result indicated that the overall satisfaction levels were higher when the respondents saw a little less people than they expected. At the same time, satisfaction levels were lower when the respondents saw a lot more people than they expected. The significant result from the Levene’s test means that there is a difference between the variances in the groups and samples across this ANOVA. This result might have been impacted by the fact that a few respondents that saw a lot more people than expected still reported high satisfaction levels. As was previously mentioned, users may use coping strategies to maintain their enjoyment even when perceived crowding is high. The unequal variances might also have been impacted by the fact that the respondents had the option to skip questions while answering the online survey on Qualtrics. Therefore, the total number of responses of the satisfaction variable was different from the total number of responses of the crowding expectation variable, resulting in unequal variances across the samples. Activating the “mandatory” command in each of the questions from Qualtrics is suggested for future studies. The number of encounters that a snorkeler or scuba diver has during the practice of the activity and the acceptable number of these are also important. Another study in Florida Keys National Marine Sanctuary showed that as the number of snorkelers or scuba divers increases, the mean acceptance decreases; consequently, scuba divers can tolerate around 10 other divers or snorkelers, while snorkelers can tolerate more snorkelers (around 17) than divers [73].
There is a dearth of research about crowding and satisfaction, specifically while snorkeling and scuba diving in marine protected areas. However, other research in different settings also found that crowding has a negative effect on satisfaction [22,62,74,75]. This relationship can be affected by skill levels and social behaviors of other users [76]. A study suggested that delivering appropriate messages at the right time and place can improve the control of visitor flow and crowding, so visitors may be more aware of the number of encounters and avoid crowding if they are more sensitive to large groups of people [77]. At the same time, educating visitors through different types of interpretation methods can clarify their expectations, minimize their negative feeling of unfavorable situations and maximize their satisfaction [56,77]. Overall, one of the most critical limitations that this study faced was the ongoing COVID-19 pandemic, which precluded in-person activities. The original sampling plan for this study aimed to collect on-site visitor use data during spring and summer seasons of 2020 in Florida Keys National Marine Sanctuary. It is important to emphasize that there are different advantages and disadvantages to online surveys vs. in-person interviews. The on-site data collection would have allowed the research team to approach snorkelers and divers that were recreating in targeted locations of the Sanctuary. Finally, there is one specific future research direction that the authors of this study are focusing on to address the need of enhancing the social diversity of the users in the Sanctuary. One of the objectives is to create inclusion through the convergence of ocean and social technologies. This new research project is part of the NSF Convergence Accelerator and it seeks to create a community of resources and knowledge to increase equitable access to the Blue Economy and engage underserved populations to improve their lives.
5. Conclusions
The objectives of this study were to describe the sample of users, define user satisfaction levels, define user crowding levels, and identifying the relationship between these two endpoints. The results and discussion of this study showed that there is a need for enhancing the social diversity of the users that visit this sanctuary. Creating a destination that is accessible for all different types of populations, especially one that includes minorities, can be a complex challenge. However, other studies showed that involving all types of populations in recreational activities has benefits beyond society, as diverse users may even promote the conservation of the sanctuary in a myriad of pathways. This thought comes from the idea that we as humans protect what we know and care about, and consequently, it is harder to protect what we do not know. Crowding is a negative individual judgment that can be a good indicator for carrying capacity management. Although the findings of this study indicated that snorkelers and scuba divers of the Florida Keys National Marine Sanctuary felt intermediate crowding levels, this needs to be a point of attention for managers in order to avoid increases in such levels. The snorkelers and divers of this study felt very satisfied overall during their trip experience and this is a good indicator that helps monitor whether these users are fulfilling their needs and desires.
Monitoring crowding can be complex for managers in marine protected areas; thus, further research in this field can facilitate a better understanding of crowding and provide efficient management recommendations that cut across these different user characteristics and expectations. The complexity of monitoring crowding is connected to the visitor use monitoring limitations that management agencies often face. These challenges can include factors such as lack of funding, staff and other resources. In addition to that, National Marine Sanctuaries vary in size, may be located along shorelines or may lack a physical boundary when located offshore. Finding ways to facilitate visitor use monitoring can include data collection methods that are cost-effective. A quick example of this is online questionnaires, which usually require fewer expenses than in-person interviews. The findings about crowding in this study will help managers better understand their visitors and will allow them to provide better services and facilities. Understanding visitation characteristics in Florida Keys National Marine Sanctuary is one of the first steps to accurately estimate the associated benefits and economic contributions. It is likely that managers in marine protected areas focus high levels of their research attention on natural sciences; however, this study emphasizes the importance of social sciences to better manage national marine sanctuaries in a way that is sustainable and ecologically balanced.
The growth limits and carrying capacity in marine environments must be considered when the objective is a sustainable management of a coastal area [63,78]. Activities such as snorkeling and scuba diving are not only related to social perceptions and interactions, but these are also directly related to the impacts on marine biodiversity. It is important to acknowledge the critical connection that human dimensions have in marine natural resources. On the one hand, studying social crowding while snorkeling or diving can be a significant indicator of the pressures that are created in the biodiverse ecosystems that are living underwater. On the other hand, satisfaction of snorkelers and scuba divers can be a critical indicator for the economic contribution that outdoor recreation is making in the local socioeconomic development of the area. Therefore, it is crucial to find a balance between the benefits and pressures that human activity can cause in Florida Keys National Marine Sanctuary.
Author Contributions
Conceptualization, M.H., R.C.B., R.G.A. and J.C.M.; methodology, M.H., R.C.B. and R.G.A.; formal analysis, M.H. and R.G.A.; writing—original draft preparation, M.H.; writing—review and editing, M.H., R.C.B., R.G.A., D.S. and J.C.M.; supervision, R.C.B.; project administration, R.C.B. and D.S. funding acquisition, R.C.B. and D.S. All authors have read and agreed to the published version of the manuscript.
Funding
This research was funded by the National Marine Sanctuary Foundation, award number 19-04-B-210.
Institutional Review Board Statement
Not applicable.
Informed Consent Statement
Not applicable.
Data Availability Statement
Please contact the authors for specific information about the data used, survey design, and questions asked.
Acknowledgments
The authors would like to thank staff at the NOAA Office of National Marine Sanctuaries for their helpful support of this research project.
Conflicts of Interest
The funders had no role in the design of the study; in the collection, analyses, or interpretation of data; in the writing of the manuscript, or in the decision to publish the results.
References
- Kelleher, G. Guidelines for Marine Protected Areas; IUCN: Gland, Switzerland; Cambridge, UK, 1999; ISBN 2831705053.
- IUCN World Conservation Strategy. Living Resource Conservation for Sustainable Development; IUCN: Gland, Switzerland, 1980; ISBN 2880321042. [Google Scholar]
- Wilkinson, C. Status of Coral Reefs of the World: 2008; Global Coral Reef Monitoring Network and Reef and Rainforest Research Centre: Townsville, Australia, 2008; Volume 296. [Google Scholar]
- Brander, L.; van Beukering, P. The Total Economic Value of U.S. Coral Reefs: A Review of The Literature. In NOAA Coral Reef Conservation Program; NOAA Coral Reef Conservation Program: Silver Spring, MD, USA, 2013; p. 32. [Google Scholar]
- Eddy, T.D.; Lam, V.W.Y.; Reygondeau, G.; Cisneros-Montemayor, A.M.; Greer, K.; Palomares, M.L.D.; Bruno, J.F.; Ota, Y.; Cheung, W.W.L. Global decline in capacity of coral reefs to provide ecosystem services. One Earth 2021, 4, 1278–1285. [Google Scholar] [CrossRef]
- UN Environment, ISU, ICRI and Trucost. The Coral Reef Economy: The Business Case for Investment in the Protection, Preservation and Enhancement of Coral Reef Health. Available online: https://wedocs.unep.org/handle/20.500.11822/26694;jsessionid=D3BE1BE814ED8708146E68CEE134BD05 (accessed on 6 October 2021).
- NOAA Office for Coastal Management Coral Reefs. Available online: https://coast.noaa.gov/states/fast-facts/coral-reefs.html#:~:text=Healthycoralreefsabsorb97,oferosionthanthosewithout (accessed on 4 May 2021).
- Loomis, D.K.; Anderson, L.E.; Hawkins, C.; Paterson, S.K. Understanding Coral Reef Use: Snorkeling in the Florida Keys by Residents and Non Residents during 2006–2007; Springs: Altamonte, FL, USA, 2008. [Google Scholar]
- UNWTO. Tourism Dashboard Global and Regional Tourism Performance: Purpose of Trip. Available online: https://www.unwto.org/global-and-regional-tourism-performance (accessed on 21 August 2021).
- World Tourism Organization (UNWTO). Methodological Notes to the Tourism Statistics Database, 2021th ed.; World Tourism Organization (UNWTO): Madrid, Spain, 2021; ISBN 9789284422517.
- Hall, C.M.; Page, S.J. The Geography of Tourism and Recreation: Environment, Place and Space; Routledge: London, UK, 2014; ISBN 0415160030. [Google Scholar]
- Hansen, A.S. Monitoring and Managing Outdoor Recreation in Coastal and Marine Areas-What do We Know and What do We Need to Know? University of Gothenburg: Gothenburg, Sweden, 2015. [Google Scholar]
- Sharpley, R. Tourism, sustainable development and the theoretical divide: 20 years on. J. Sustain. Tour. 2020, 28, 1932–1946. [Google Scholar] [CrossRef]
- Uyarra, M.C.; Watkinson, A.R.; Côté, I.M. Managing dive tourism for the sustainable use of coral reefs: Validating diver perceptions of attractive site features. Environ. Manag. 2009, 43, 1–16. [Google Scholar] [CrossRef]
- Wagar, J.A. The carrying capacity of wild lands for recreation. For. Sci. 1964, 10, a001-24. [Google Scholar]
- Shelby, B.; Heberlein, T. Carrying Capacity of Recreational Settings; Oregon State University Press: Corvallis, OR, USA, 1987. [Google Scholar]
- Manning, R.E. Studies in Outdoor Recreation: Search and Research for Satisfaction, 3rd ed.; Oregon State University: Corvallis, OR, USA, 2011. [Google Scholar]
- Wang, J.; Huang, X.; Gong, Z.; Cao, K. Dynamic assessment of tourism carrying capacity and its impacts on tourism economic growth in urban tourism destinations in China. J. Destin. Mark. Manag. 2020, 15, 100383. [Google Scholar] [CrossRef]
- Von Ruschkowski, E.; Burns, R.; Arnberger, A.; Smaldone, D.; Meybin, J. Recreation Management in Parks and Protected Areas: A Comparative Study of Resource Managers Perceptions in Austria, Germany, and the United States. J. Park Recreat. Adm. 2013, 31, 95–114. [Google Scholar]
- Burns, R.; Leveque, J.; Allen, M.; Arnberger, A.; Kainzinger, S. Investigating Crowding at the Lower Youghiogheny River, Pennsylvania, U.S. J. Park Recreat. Adm. 2021, 39, 1–11. [Google Scholar] [CrossRef]
- Burns, R.C.; Graefe, A.R. Customer Satisfaction at Water-Based Outdoor Recreation Settings: Understanding Differences across Market Segments. Available online: http://larnet.org/2005-02.html (accessed on 6 October 2021).
- Burns, R.C.; Graefe, A.R.; Absher, J.D. Alternate measurement approaches to recreational customer satisfaction: Satisfaction-only versus gap scores. Leis. Sci. 2003, 25, 363–380. [Google Scholar] [CrossRef]
- Carvache-Franco, M.; Carvache-Franco, O.; Carvache-Franco, W. Exploring the Satisfaction of Ecotourism in Protected Natural Areas. GeoJ. Tour. Geosites 2020, 29, 672–683. [Google Scholar] [CrossRef]
- Miles, A.; Perea Muñoz, J.M.; Bayle-Sempere, J.T. Low satisfaction and failed relational coordination among relevant stakeholders in Spanish Mediterranean marine protected areas. J. Environ. Manag. 2020, 272, 111003. [Google Scholar] [CrossRef]
- Zhang, J.; Yin, N.; Wang, S.; Yu, J.; Zhao, W.; Fu, B. A multiple importance–satisfaction analysis framework for the sustainable management of protected areas: Integrating ecosystem services and basic needs. Ecosyst. Serv. 2020, 46, 101219. [Google Scholar] [CrossRef]
- Fiore, F.; Siena, F.; Saponari, L.; Galli, P.; Montano, S. Users’ satisfaction on coral restoration projects: The case of the Maldives. Reg. Stud. Mar. Sci. 2020, 38, 101369. [Google Scholar] [CrossRef]
- Carvache-Franco, M.; Carvache-Franco, W.; Manner-Baldeon, F. Market Segmentation Based on Ecotourism Motivations in Marine Protected Areas and National Parks in the Galapagos Islands, Ecuador. J. Coast. Res. 2021, 37, 620–633. [Google Scholar] [CrossRef]
- Graefe, A.R.; Fedler, A.J. Situational and subjective determinants of satisfaction in marine recreational fishing. Leis. Sci. 1986, 8, 275–295. [Google Scholar] [CrossRef]
- Vaske, J.J.; Shelby, L.B. Crowding as a Descriptive Indicator and an Evaluative Standard: Results from 30 Years of Research. Leis. Sci. 2008, 30, 111–126. [Google Scholar] [CrossRef]
- Burns, R.C.; Andrew, R.G.; Allen, M.E.; Schwarzmann, D.; Cardozo Moreira, J. Conceptualizing the National marine sanctuary visitor counting process for marine protected areas. J. Ecotourism 2020, 19, 362–372. [Google Scholar] [CrossRef]
- NOAA. What Is a National Marine Sanctuary? Available online: https://oceanservice.noaa.gov/facts/nms.html (accessed on 4 June 2021).
- NMSA National Marine Sanctuaries Act Agencies: 16 U.S.C. §§ 1431 et seq. 1992. Available online: https://coast.noaa.gov/data/Documents/OceanLawSearch/Summary%20of%20Law%20-%20National%20Marine%20Sanctuaries%20Act.pdf (accessed on 11 May 2021).
- Florida Keys National Marine Sanctuary about Florida Keys National Marine Sanctuary. Available online: https://floridakeys.noaa.gov/about/welcome.html?s=about (accessed on 4 June 2021).
- Cronin, J.J.; Taylor, S.A. Measuring Service Quality: A Reexamination and Extension. J. Mark. 1992, 56, 55. [Google Scholar] [CrossRef]
- Howat, G.; Murray, D.; Crilley, G. The relationships between service problems and perceptions of service quality, satisfaction, and behavioral intentions of Australian public sports and leisure center customers. J. Park Recreat. Adm. 1999, 17, 42–64. [Google Scholar]
- Parasuraman, A.; Zeithaml, V.A.; Berry, L.L. Servqual: A Multiple-Item Scale for Measuring Consumer Perceptions of service quality. J. Retail. 1988, 64, 12–40. [Google Scholar]
- Lee, J.; Graefe, A.R.; Burns, R.C. Examining the Antecedents of Destination Loyalty in a Forest Setting. Leis. Sci. 2007, 29, 463–481. [Google Scholar] [CrossRef]
- Heberlein, T.A.; Vaske, J.J. Crowding and Visitor Conflict on the Bois Brule River; Water Resource Center: Madison, WI, USA, 1977. [Google Scholar]
- Gigliotti, L.M.; Chase, L. A Bivalent Scale for Measuring Crowding among Deer Hunters. Hum. Dimens. Wildl. 2014, 19, 96–103. [Google Scholar] [CrossRef]
- Dillman, D.A.; Bowker, D.K. The web questionnaire challenge to survey methodologists. Online Soc. Sci. 2001, 53–71. [Google Scholar]
- Winter, P.L.; Crano, W.D.; Basáñez, T.; Lamb, C.S. Equity in access to outdoor recreation-informing a sustainable future. Sustainability 2020, 12, 124. [Google Scholar] [CrossRef] [Green Version]
- Asselin, J. Outdoor women: Thinking about gender, self, and environment through outdoor enskillment programs. Anthropologica 2019, 61, 283–295. [Google Scholar] [CrossRef] [Green Version]
- Godtman Kling, K.; Margaryan, L.; Fuchs, M. (In) equality in the outdoors: Gender perspective on recreation and tourism media in the Swedish mountains. Curr. Issues Tour. 2020, 23, 233–247. [Google Scholar] [CrossRef]
- Rosa, C.D.; Larson, L.R.; Collado, S.; Cloutier, S.; Profice, C.C. Gender Differences in Connection to Nature, Outdoor Preferences, and Nature-Based Recreation Among College Students in Brazil and the United States. Leis. Sci. 2020, 42, 1–21. [Google Scholar] [CrossRef]
- Leeworthy, V.; Wiley, P. Current Participation Patterns in Marine Recreation; NOAA: Silver Spring, MD, USA, 2001. [Google Scholar]
- Paudel, K.P.; Caffey, R.H.; Devkota, N. An Evaluation of Factors Affecting the Choice of Coastal Recreational Activities. J. Agric. Appl. Econ. 2011, 43, 167–179. [Google Scholar] [CrossRef] [Green Version]
- Gravestock, P.; Roberts, C.M.; Bailey, A. The income requirements of marine protected areas. Ocean. Coast. Manag. 2008, 51, 272–283. [Google Scholar] [CrossRef]
- Davis, J. Black faces, black spaces: Rethinking African American underrepresentation in wildland spaces and outdoor recreation. Environ. Plan. E Nat. Space 2019, 2, 89–109. [Google Scholar] [CrossRef]
- Grill, L.; Morse, W.C.; Schelhas, J.; Barlow, B.; Wyman, M. Implications of Setting Preference Differences by Race and Gender on the Applicability of a Benefits-Based Management Approach to Recreational Planning. J. Park Recreat. Adm. 2020, 38, 62–79. [Google Scholar] [CrossRef]
- Burns, R.C.; Graefe, A.R. Toward Understanding Recreation Fees: Impacts on People with Extremely Low Income Levels. J. Park Recreat. Adm. 2006, 24, 24. [Google Scholar]
- Sánchez, J.J.; Cerveny, L.K.; Blahna, D.J.; Valenzuela, F.; Schlafmann, M. Chapter 3: Recreation opportunities and human connections on public lands: Constraints that limit recreation participation. In Igniting Research for Outdoor Recreation: Linking Science, Policy, and Action; U.S. Forest Service, Pacific Southwest Research Station: Portland, OR, USA, 2020; pp. 41–50. [Google Scholar]
- Groves, R.M.; Peytcheva, E. The Impact of Nonresponse Rates on Nonresponse Bias: A Meta-Analysis. Public Opin. Q. 2008, 72, 167–189. [Google Scholar] [CrossRef]
- Sivo, S.; Saunders, C.; Chang, Q.; Jiang, J. How Low Should You Go? Low Response Rates and the Validity of Inference in IS Questionnaire Research. J. Assoc. Inf. Syst. 2006, 7, 351–414. [Google Scholar] [CrossRef]
- Burns, R.C.; Robinson, K.F. Oregon’s Aging Population: Relationships between Facilities, Services, Participation, and Sociodemographics in Outdoor Recreation Settings. J. Park Recreat. Adm. 2017, 35, 13–23. [Google Scholar] [CrossRef]
- Magnini, V.; Chuck, W. Florida Statewide Comprehensive Outdoor Recreation Plan: Participation Study 2016–2017; Institute for Service Research for the Florida Department of Environmental Protection: Tallahassee, FL, USA, 2017.
- Robinson, K.; Burns, R.; Pierskalla, C.; Graefe, A. An Aging Population: Relationships between Socio-Demographics, Motivations and Participation. In Proceedings of the 2007 Northeastern Recreation Research Symposium, Bolton Landing, NY, USA, 15–17 April 2007; U.S. Forest Service Northern Research Station: Newtown Square, PA, USA, 2007. [Google Scholar]
- Ziegler, J. Recreating retirement: How will baby boomers reshape leisure in their 60 s? Parks Recreat. 2002, 37, 56–61. [Google Scholar]
- Graefe, A.R.; Burns, R.C. Testing a mediation model of customer service and satisfaction in outdoor recreation. J. Outdoor Recreat. Tour. 2013, 3–4, 36–46. [Google Scholar] [CrossRef]
- De Oliveira, A.C.R.; Santos, G.E.d.O.; Santos Lobo, H.A. Environmental Attitudes and Tourist Satisfaction in Overloaded Natural Protected Areas. J. Travel Res. 2020, 60, 16671676. [Google Scholar] [CrossRef]
- Ursi, S.; Towata, N. Environmental perception about marine and coastal ecosystems: Evaluation through a research instrument based on model of ecological values. Probl. Educ. 21st Century 2018, 76, 393–405. [Google Scholar] [CrossRef]
- Rasoolimanesh, S.M.; Jaafar, M.; Marzuki, A.; Mohamad, D. How Visitor and Environmental Characteristics Influence Perceived Crowding. Asia Pac. J. Tour. Res. 2016, 21, 952–967. [Google Scholar] [CrossRef]
- Zehrer, A.; Raich, F. The impact of perceived crowding on customer satisfaction. J. Hosp. Tour. Manag. 2016, 29, 88–98. [Google Scholar] [CrossRef]
- Navarro Jurado, E.; Tejada Tejada, M.; Almeida García, F.; Cabello González, J.; Cortés Macías, R.; Delgado Peña, J.; Fernández Gutiérrez, F.; Gutiérrez Fernández, G.; Luque Gallego, M.; Málvarez García, G.; et al. Carrying capacity assessment for tourist destinations. Methodology for the creation of synthetic indicators applied in a coastal area. Tour. Manag. 2012, 33, 1337–1346. [Google Scholar] [CrossRef]
- Absher, J.D.; Lee, R.G. Density as an incomplete cause of crowding in backcountry settings. Leis. Sci. 1981, 4, 231–247. [Google Scholar] [CrossRef]
- Shelby, B.; Heberlein, T.A.; Vaske, J.J.; Alfano, G. Expectations, preferences, and feeling crowded in recreation activities. Leis. Sci. 1983, 6, 1–14. [Google Scholar] [CrossRef]
- Yoon, J.I.; Kyle, G.; Hsu, Y.C.; Absher, J. Coping with crowded recreation settings: A cross-cultural investigation. J. Leis. Res. 2021, 52, 1–21. [Google Scholar] [CrossRef]
- Jacobsen, J.K.S.; Iversen, N.M.; Hem, L.E. Hotspot crowding and over-tourism: Antecedents of destination attractiveness. Ann. Tour. Res. 2019, 76, 53–66. [Google Scholar] [CrossRef]
- Inglish, G.; Johnson, V.; Ponte, F. Crowding Norms in Marine Settings: A Case Study of Snorkeling on the Great Barrier Reef. Environ. Manag. 1999, 24, 369–381. [Google Scholar] [CrossRef]
- Serrano Giné, D.; Jurado Rota, J.; Pérez Albert, M.Y.; Bonfill Cerveró, C. The Beach Crowding Index: A Tool for Assessing Social Carrying Capacity of Vulnerable Beaches. Prof. Geogr. 2018, 70, 412–422. [Google Scholar] [CrossRef]
- Shafer, C.S.; Inglis, G.J.; Johnson, V.Y.; Marshall, N.A. Visitor experiences and perceived conditions on day trips to the Great Barrier Reef. Tech. Rep. CRC Reef Res. Cent. 1998, 21, 76. [Google Scholar] [CrossRef]
- Chuprinko, T.L. Mountaineering Motivations and Perceived Crowding: An Examination of Climbers on Mt. Baker, Washington and Mt. Hood, Oregon. Master’s Thesis, Recreation, Parks and Tourism Resources, West Virginia University, Morgantown, WV, USA, 2012. [Google Scholar]
- Burns, R.C.; Allen, M.E.; Chuprinko, T.L. Crowding Perceptions at Wilderness Areas on Mount Baker, Washington and Mount Hood, Oregon. Int. J. Wilderness 2021, 27, 2. [Google Scholar]
- Vaske, J.J.; Heesemann, L.M.; Loomis, D.K.; Cottrell, S.C. Measuring variability in encounter norms among scuba divers and snorkelers: An Application of the potential for conflict index2. Tour. Mar. Environ. 2013, 9, 69–80. [Google Scholar] [CrossRef]
- Torres-Matovelle, P.; Molina-Molina, G. Evaluation of crowding and tourist satisfaction in the practice of humpback whale-watching, the case of Puerto López-Ecuador. Cuad. De Gest. 2019, 19, 185–208. [Google Scholar] [CrossRef] [Green Version]
- Giusti, M.M.; Travassos, L.E.P.; Lobo, H.A.S. Percepção de lotação e grau de satisfação dos visitantes da Gruta da Lapinha (Parque Estadual do Sumidouro, MG, Brasil). Cad. De Geogr. 2019, 29, 1139–1160. [Google Scholar] [CrossRef]
- Pikkemaat, B.; Bichler, B.F.; Peters, M. Exploring the crowding-satisfaction relationship of skiers: The role of social behavior and experiences. J. Travel Tour. Mark. 2020, 37, 902–916. [Google Scholar] [CrossRef]
- Jin, Q.; Hu, H.; Kavan, P. Factors influencing perceived crowding of tourists and sustainable tourism destination management. Sustainability 2016, 8, 976. [Google Scholar] [CrossRef] [Green Version]
- Kim, H.R.; Yoon, S.Y. How to help crowded destinations: Tourist anger vs. sympathy and role of destination social responsibility. Sustainability 2020, 12, 2358. [Google Scholar] [CrossRef] [Green Version]
Figure 1.
Florida Keys National Marine Sanctuary.
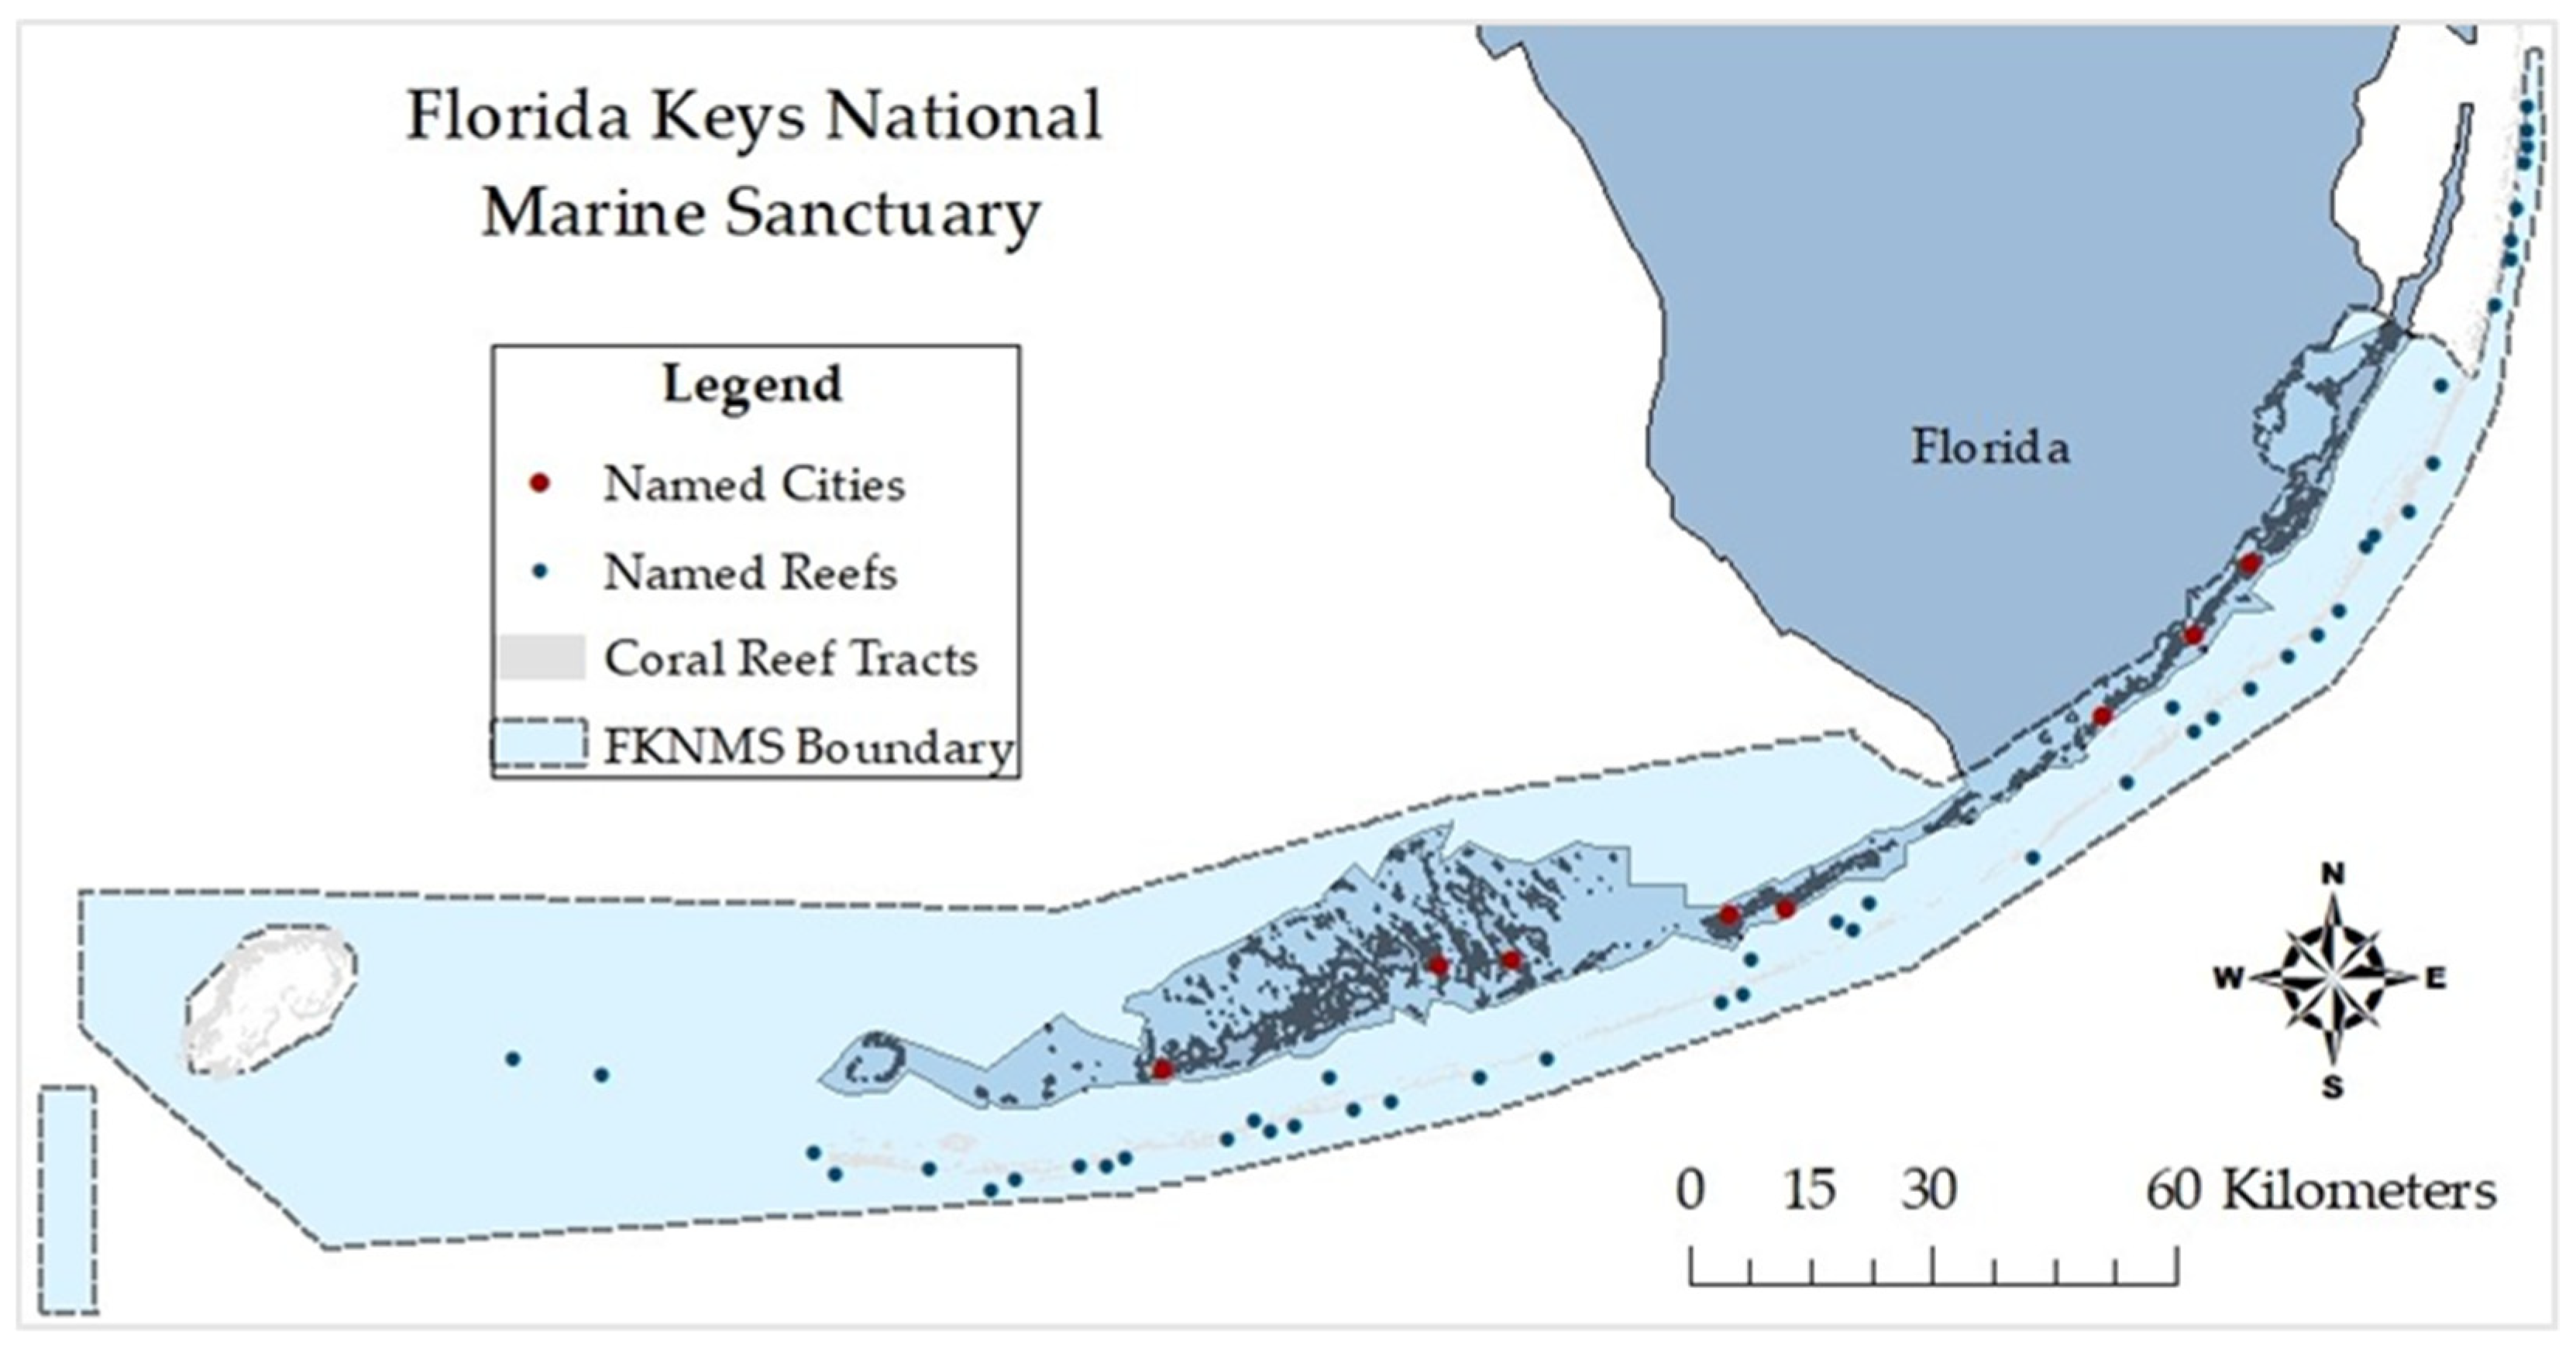
Figure 2.
Linear regression results for overall satisfaction level and age.

Figure 3.
Overall crowding level scale, shown with mean and mode values from survey responses.

Figure 4.
Means plot of ANOVA between satisfaction and crowding expectation/outcome with standard error bars.
Figure 4.
Means plot of ANOVA between satisfaction and crowding expectation/outcome with standard error bars.


Table 1.
Questions selected from a survey instrument for use in analysis in this study are shown with a response scale.
Table 1.
Questions selected from a survey instrument for use in analysis in this study are shown with a response scale.
| Questions | Answers |
|---|---|
| Consider your most recent 2019 snorkeling or scuba diving trip to the Florida Keys National Marine Sanctuary. Overall, how satisfied were you with your experience? 1 | Scale from 1 to 10 1 = Not at all Satisfied 10 = Extremely Satisfied |
| How satisfied were you with each of the following during your most recent trip to the Florida Keys National Marine Sanctuary? 2 1 = Not at all Satisfied 5 = Extremely Satisfied | Seeing a healthy reef |
| Diving in an uncrowded area | |
| Experiencing good underwater clarity | |
| Experiencing natural surroundings | |
| Experiencing adventure | |
| Experiencing a clean reef | |
| Availability of an open mooring buoy | |
| Diving on an area free of discarded fishing traps, line, or tackle | |
| How crowded did you feel while actively snorkeling or diving during your most recent 2019 trip in the Florida Keys National Marine Sanctuary? 3 | Scale from 1 to 9 1 = Not Crowded at all 9 = Extremely Crowded |
| On your most recent 2019 snorkeling or scuba diving trip to a coral reef in the Florida Keys National Marine Sanctuary, how did the number of people you saw compare with what you expected to see? ⁴ | A lot less than you expected |
| A little less than you expected | |
| About what you expected | |
| A little more than you expected | |
| A lot more than you expected | |
| You didn’t have any expectations |
Table 2.
Socio-demographic profile of survey respondents, shown with frequency and percentage of responses for each optional survey question.
Table 2.
Socio-demographic profile of survey respondents, shown with frequency and percentage of responses for each optional survey question.
| Socio-Demographic | Profile | Valid Percent (%) | Frequency | N |
|---|---|---|---|---|
| Residence | Permanent resident | 16.2 | 53 | 327 |
| Seasonal resident | 8.6 | 28 | ||
| Visitor | 75.2 | 246 | ||
| Sex | Male | 75.5 | 244 | 323 |
| Female | 24.5 | 79 | ||
| Age Recoded | 30 or younger | 3.5 | 11 | 315 |
| 31–50 | 29.8 | 94 | ||
| 51 and over | 66.7 | 210 | ||
| Ethnicity | Hispanic | 17.1 | 55 | 322 |
| Non-Hispanic | 82.9 | 267 | ||
| Race Recoded | White | 91.5 | 291 | 318 |
| Non-White | 8.5 | 27 | ||
| Education | High school graduate | 7.8 | 25 | 320 |
| Some college | 25.9 | 83 | ||
| College graduate | 38.1 | 122 | ||
| Post graduate | 28.1 | 90 | ||
| Income Recoded | Under $50,000 | 7.8 | 23 | 296 |
| $50,001–100,000 | 29.4 | 87 | ||
| Over $100,001 | 62.8 | 186 |
Table 3.
Means of overall satisfaction level by socio-demographics across optional survey question responses.
Table 3.
Means of overall satisfaction level by socio-demographics across optional survey question responses.
| Overall Trip Satisfaction Level | |||||
|---|---|---|---|---|---|
| Socio-Demographic | Profile | M | SD | SE | N |
| Residence | Permanent resident | 8.1 | 1.8 | 0.2 | 50 |
| Seasonal resident | 8.5 | 1.8 | 0.3 | 28 | |
| Visitor | 8.0 | 2.1 | 0.1 | 219 | |
| Gender | Male | 8.1 | 2.1 | 0.1 | 215 |
| Female | 8.3 | 1.9 | 0.2 | 75 | |
| Age Recoded | 30 or younger | 8.5 | 2.5 | 0.7 | 11 |
| 31–50 | 8.3 | 1.8 | 0.1 | 91 | |
| 51 and over | 7.9 | 2.1 | 0.1 | 183 | |
| Ethnicity | Hispanic | 8.3 | 2.1 | 0.3 | 51 |
| Non-Hispanic | 8.0 | 2.0 | 0.1 | 238 | |
| Race Recoded | White | 8.2 | 2.0 | 0.1 | 263 |
| Non-White | 7.6 | 2.7 | 0.5 | 22 | |
| Education | High school graduate | 8.1 | 2.1 | 0.4 | 21 |
| Some college | 8.3 | 2.1 | 0.2 | 72 | |
| College graduate | 8.1 | 2.0 | 0.2 | 107 | |
| Post graduate | 7.9 | 2.0 | 0.2 | 87 | |
| Income Recoded | Under $50,000 | 7.6 | 2.6 | 0.5 | 19 |
| $50,001–100,000 | 8.4 | 2.0 | 0.2 | 74 | |
| Over $100,001 | 8.1 | 1.9 | 0.1 | 173 | |
Note: M, SD, SE, N represent mean, standard deviation, standard error of mean and total responses, respectively. There were no significant differences found between the mean groups.
Table 4.
Multiple regression results for overall satisfaction level and satisfaction of environmental items.
Table 4.
Multiple regression results for overall satisfaction level and satisfaction of environmental items.
| Variable | B | 95% CI | β | t | p |
|---|---|---|---|---|---|
| (Constant) | 3.26 | [1.94, 4.58] | 4.88 | 0.000 | |
| Seeing a healthy reef | 0.35 | [−0.10, 0.81] | 0.19 | 1.51 | 0.133 |
| Diving in an uncrowded area | −0.04 | [−0.47, 0.38] | −0.02 | −0.20 | 0.841 |
| Experiencing good underwater clarity | 0.29 | [−0.15, 0.73] | 0.14 | 1.30 | 0.194 |
| Experiencing natural surroundings | 0.72 | [0.15, 1.29] | 0.31 | 2.51 | 0.013 * |
| Experiencing adventure | 0.10 | [−0.37, 0.57] | 0.04 | 0.41 | 0.679 |
| Experiencing a clean reef | 0.08 | [−0.43, 0.60] | 0.04 | 0.33 | 0.738 |
| Availability of an open mooring buoy | 0.15 | [−0.14, 0.46] | 0.09 | 1.03 | 0.302 |
| Diving on an area free of discarded fishing traps, line, or tackle | −0.28 | [−0.65, 0.07] | −0.16 | −1.55 | 0.122 |
Note: R2 adj. = 0.308. CI = confidence interval for B. * p < 0.05.
Table 5.
Means of overall crowding level by socio-demographic categories in survey responses.
| Overall Crowding Level | |||||
|---|---|---|---|---|---|
| Socio-Demographic | Profile | M | SD | SE | N |
| Residence | Permanent resident | 4.6 | 2.2 | 0.3 | 51 |
| Seasonal resident | 4.1 | 2.1 | 0.4 | 27 | |
| Visitor | 4.2 | 2.1 | 0.1 | 215 | |
| Gender | Male | 4.4 | 2.2 | 0.1 | 214 |
| Female | 4.2 | 2.1 | 0.2 | 74 | |
| Age Recoded | 30 or younger | 3.9 | 2.1 | 0.6 | 11 |
| 31–50 | 4.5 | 2.2 | 0.2 | 86 | |
| 51 and over | 4.3 | 2.1 | 0.1 | 185 | |
| Ethnicity | Hispanic | 4.5 | 2.3 | 0.3 | 50 |
| Non-Hispanic | 4.3 | 2.1 | 0.1 | 237 | |
| Race Recoded | White | 4.4 | 2.1 | 0.1 | 258 |
| Non-White | 3.7 | 2.4 | 0.4 | 25 | |
| Education * | High school graduate | 4.7 | 2.2 | 0.4 | 21 |
| Some college | 3.9 | 2.1 | 0.2 | 72 | |
| College graduate | 4.7 | 2.2 | 0.2 | 106 | |
| Post graduate | 4.1 | 2.1 | 0.2 | 86 | |
| Income Recoded | Under $50,000 | 5.4 | 2.5 | 0.5 | 20 |
| $50,001–100,000 | 4.4 | 2.3 | 0.2 | 74 | |
| Over $100,001 | 4.2 | 2.1 | 0.1 | 171 | |
Note: M, SD, SE, N represent mean, standard deviation, standard error of mean and total responses, respectively. * p = 0.05.
Publisher’s Note: MDPI stays neutral with regard to jurisdictional claims in published maps and institutional affiliations. |
© 2021 by the authors. Licensee MDPI, Basel, Switzerland. This article is an open access article distributed under the terms and conditions of the Creative Commons Attribution (CC BY) license (https://creativecommons.org/licenses/by/4.0/).
Share and Cite
MDPI and ACS Style
Hurtado, M.; Burns, R.C.; Andrew, R.G.; Schwarzmann, D.; Moreira, J.C. User Satisfaction and Crowding at Florida Keys National Marine Sanctuary. Water 2021, 13, 3423. https://doi.org/10.3390/w13233423
AMA Style
Hurtado M, Burns RC, Andrew RG, Schwarzmann D, Moreira JC. User Satisfaction and Crowding at Florida Keys National Marine Sanctuary. Water. 2021; 13(23):3423. https://doi.org/10.3390/w13233423
Chicago/Turabian StyleHurtado, Melissa, Robert C. Burns, Ross G. Andrew, Danielle Schwarzmann, and Jasmine Cardozo Moreira. 2021. "User Satisfaction and Crowding at Florida Keys National Marine Sanctuary" Water 13, no. 23: 3423. https://doi.org/10.3390/w13233423
Note that from the first issue of 2016, this journal uses article numbers instead of page numbers. See further details here.