
Hydrochemical Characteristics and Cause Analysis of Natural Water in the Southeast of Qinghai-Tibet Plateau


Abstract
:1. Introduction
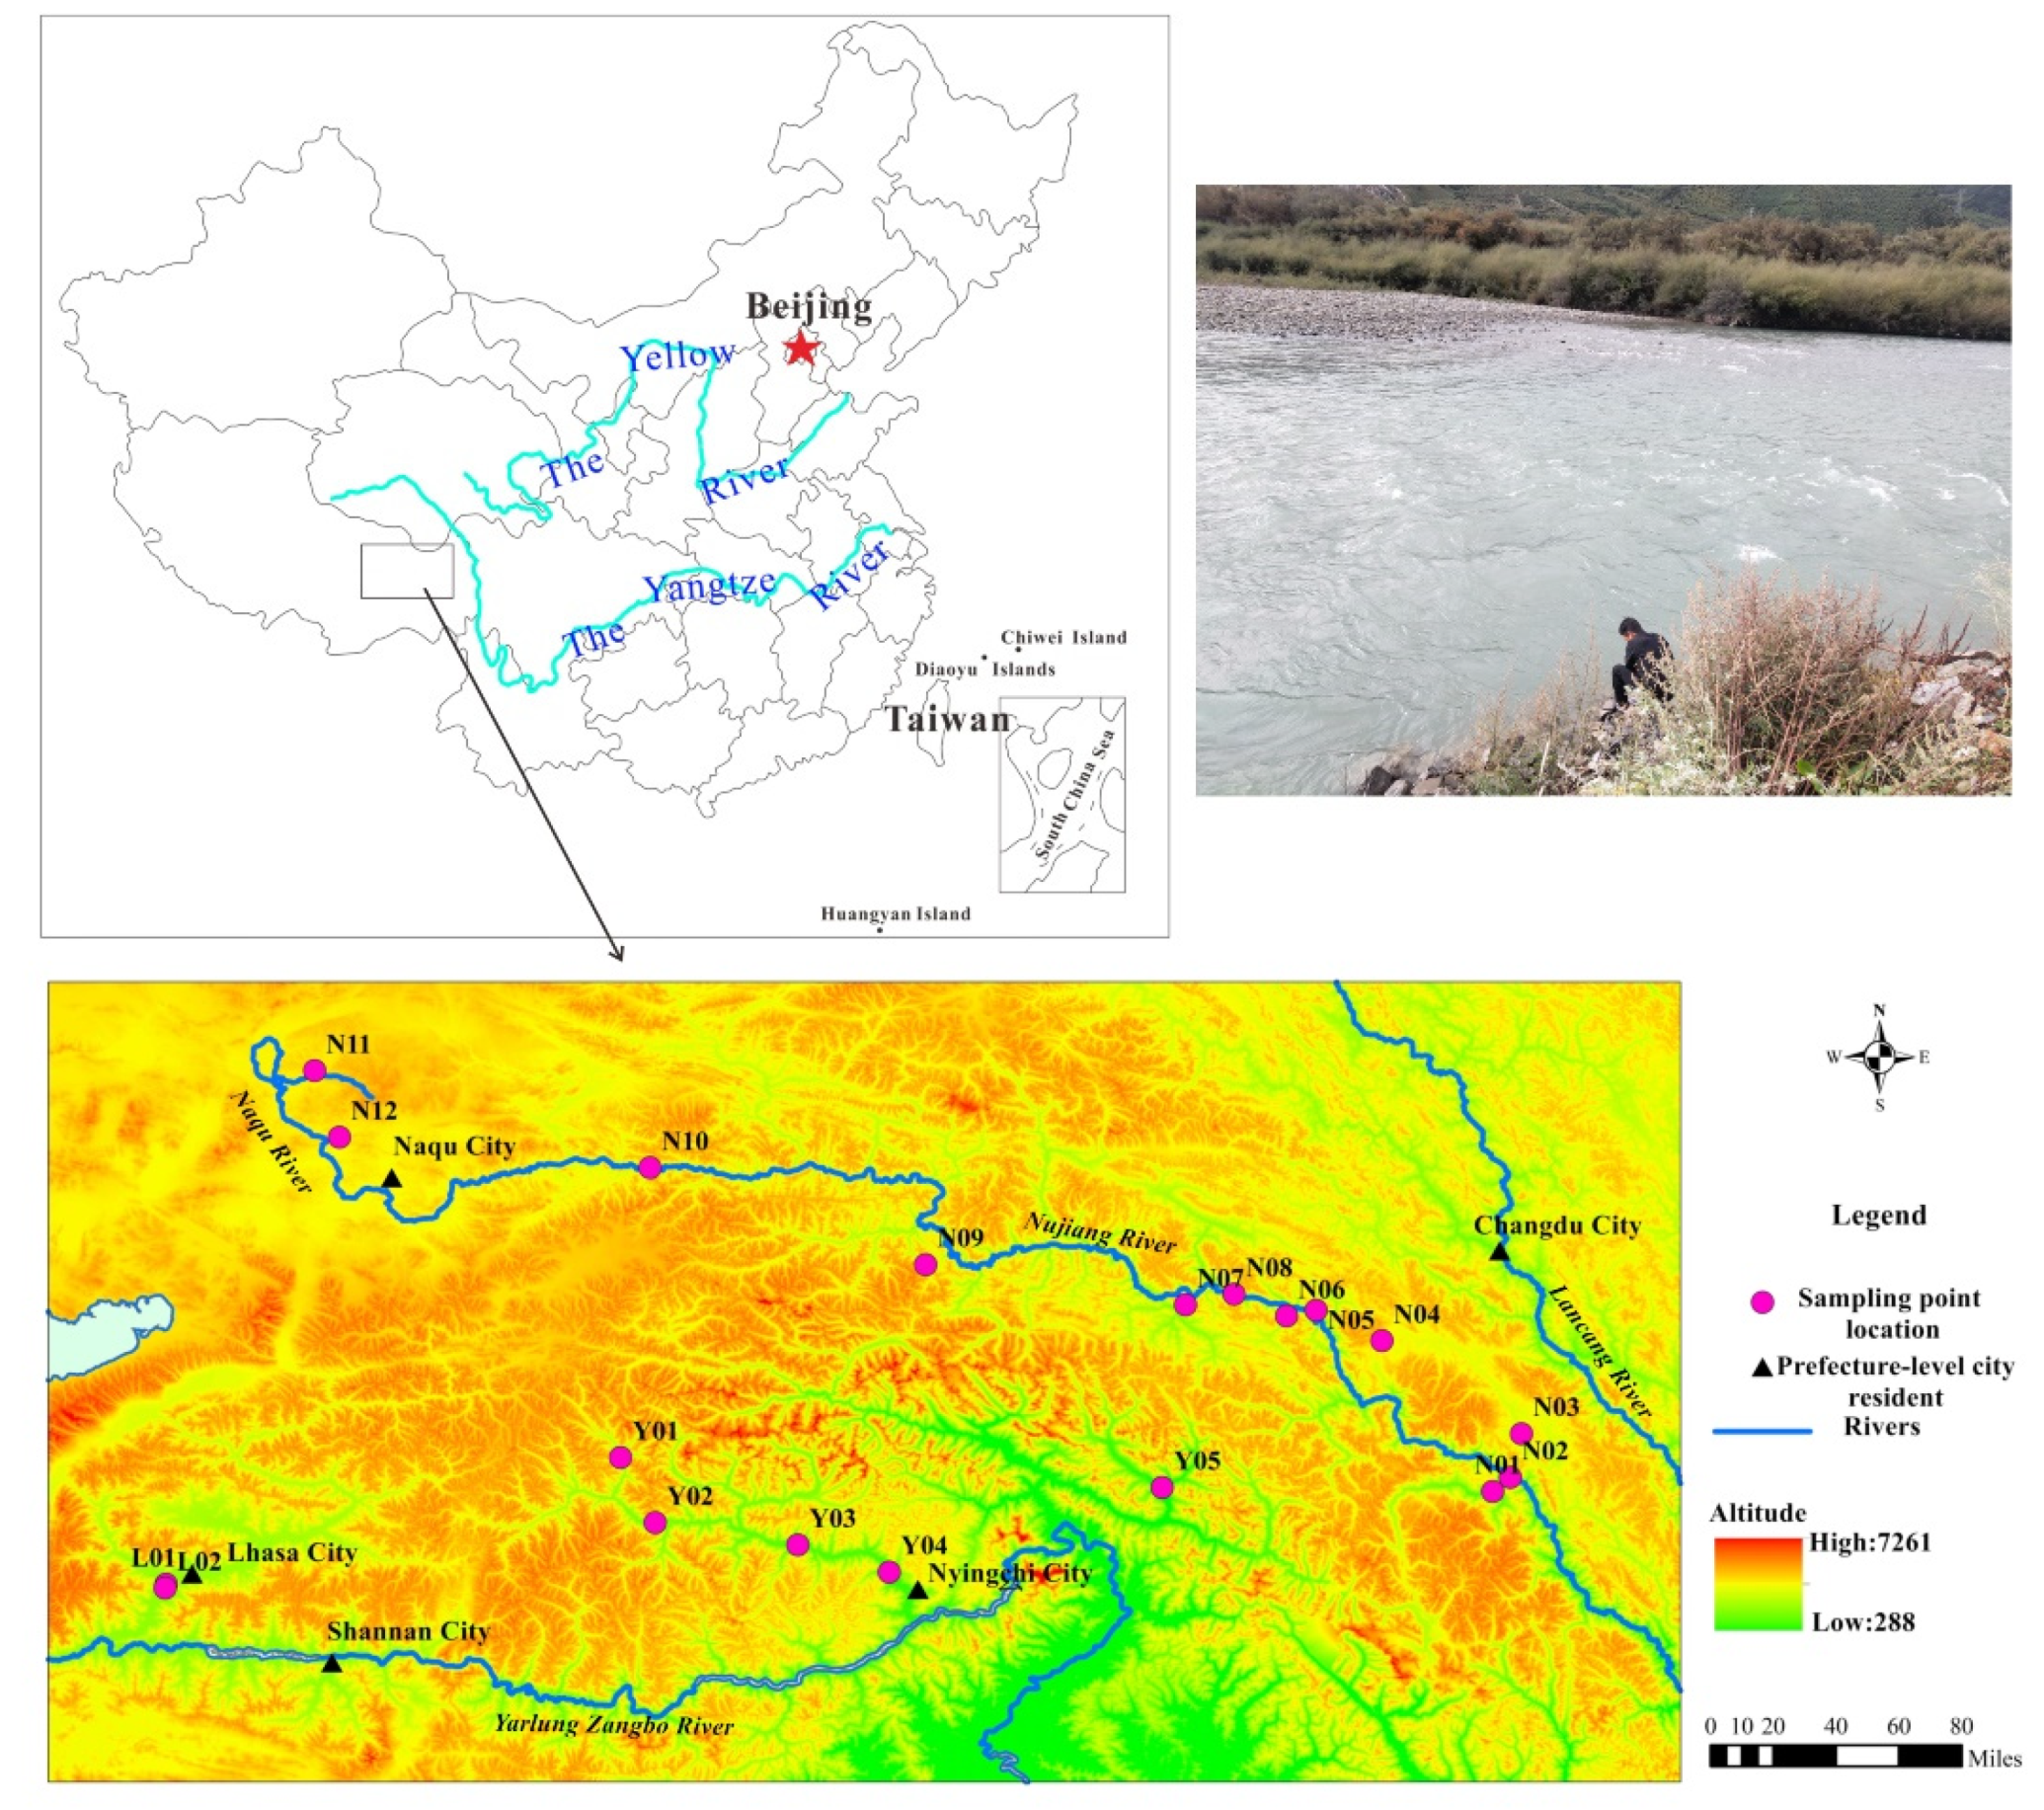
2. Study Area
3. Materials and Methods
3.1. Sampling and Analysis
3.2. Analysis of Hydrogeochemical Processes
4. Results and Discussion
4.1. Statistical Analysis
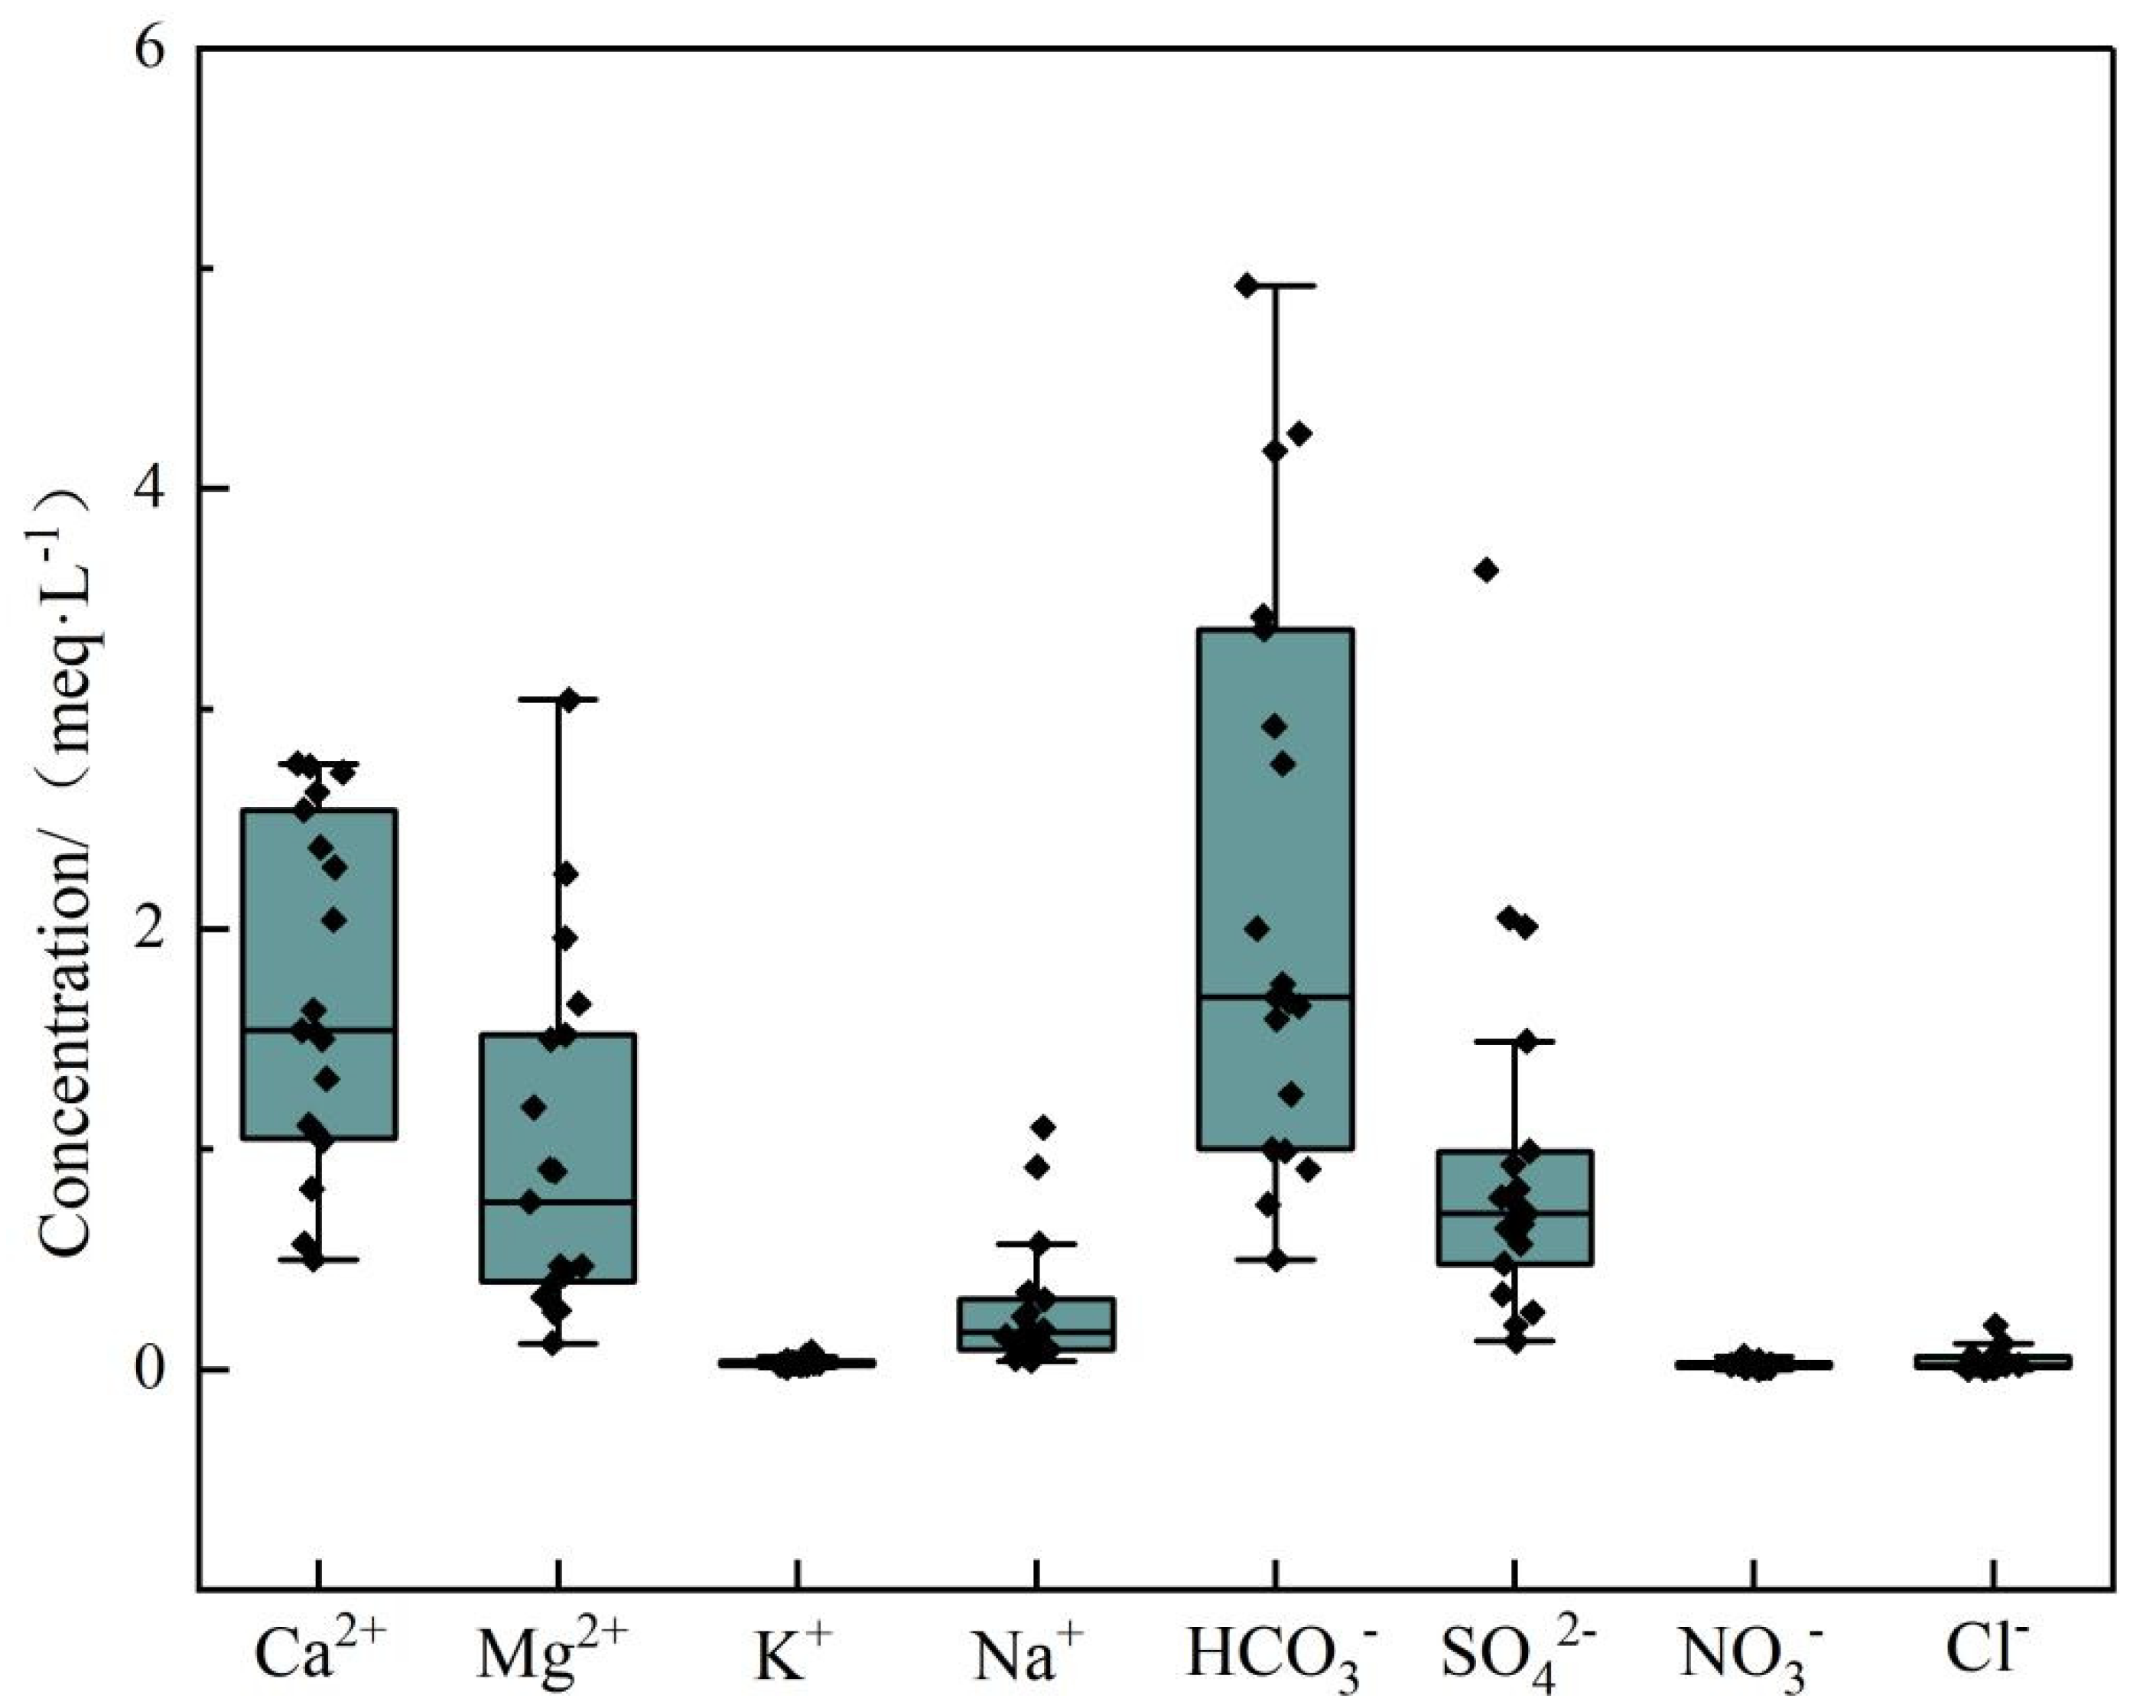
4.1.1. Hydrochemical Characteristics
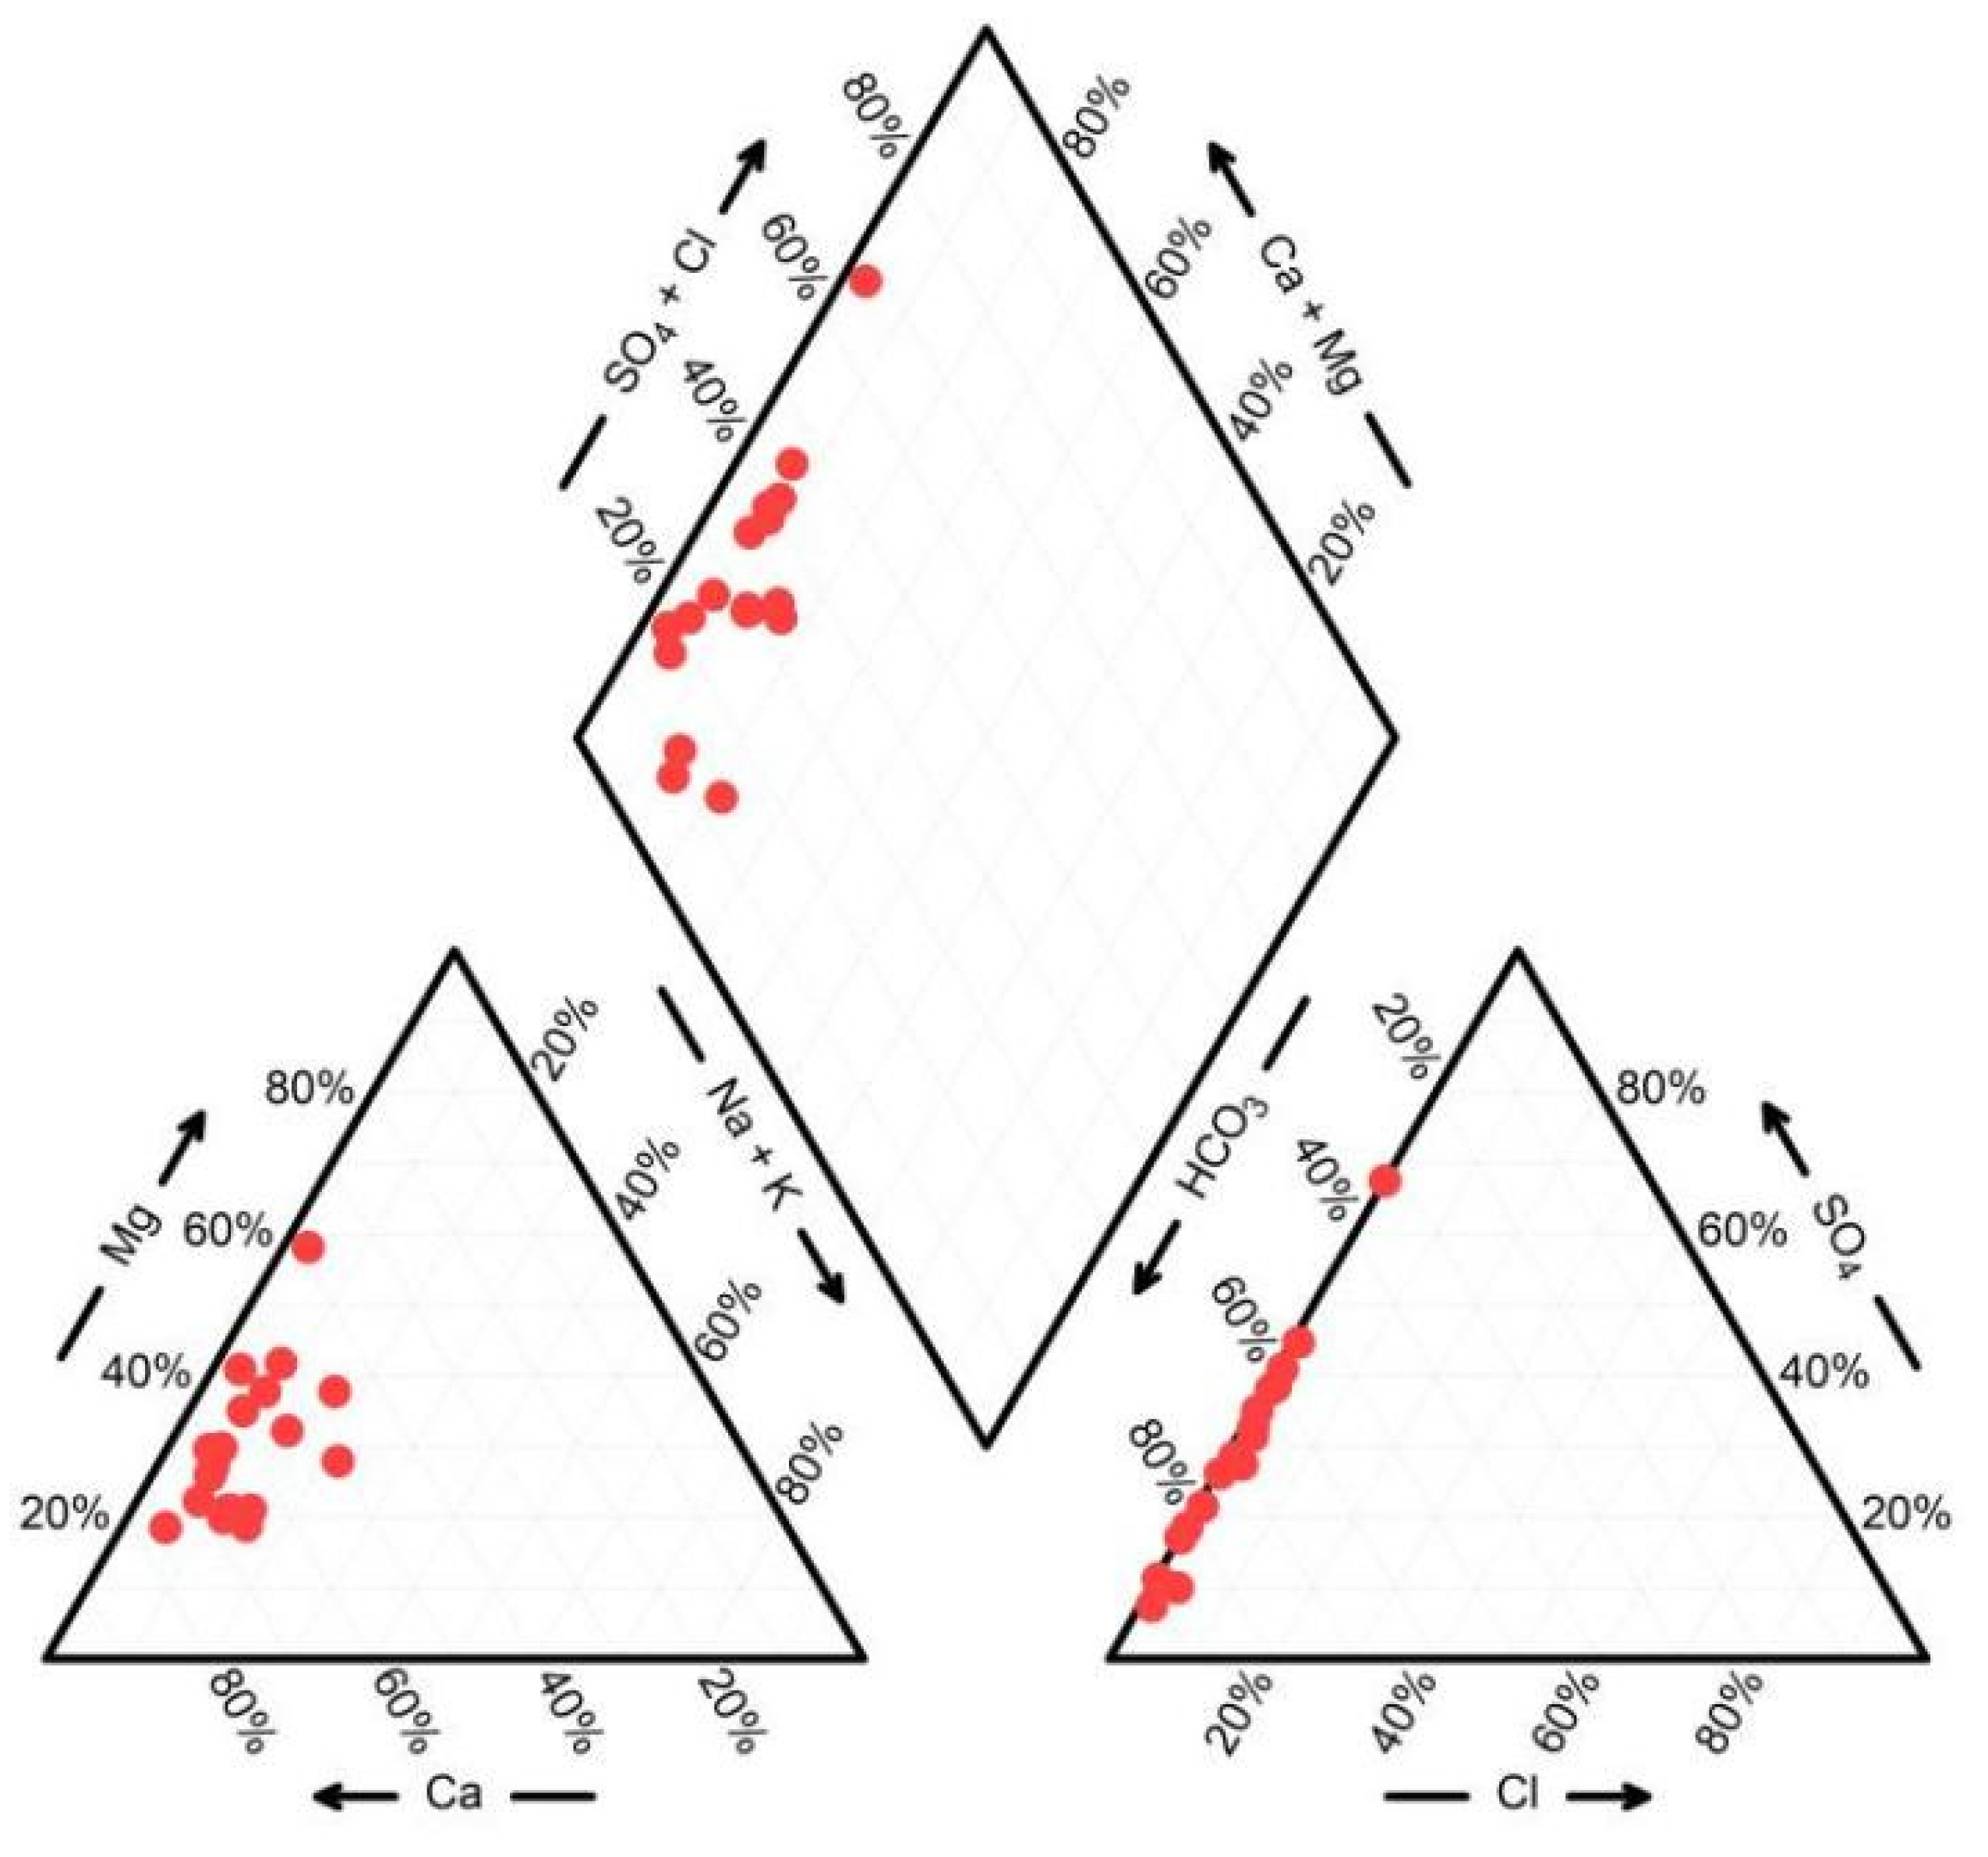
4.1.2. Hydrochemical Types
4.2. Cause Analysis of Hydrochemical Characteristics
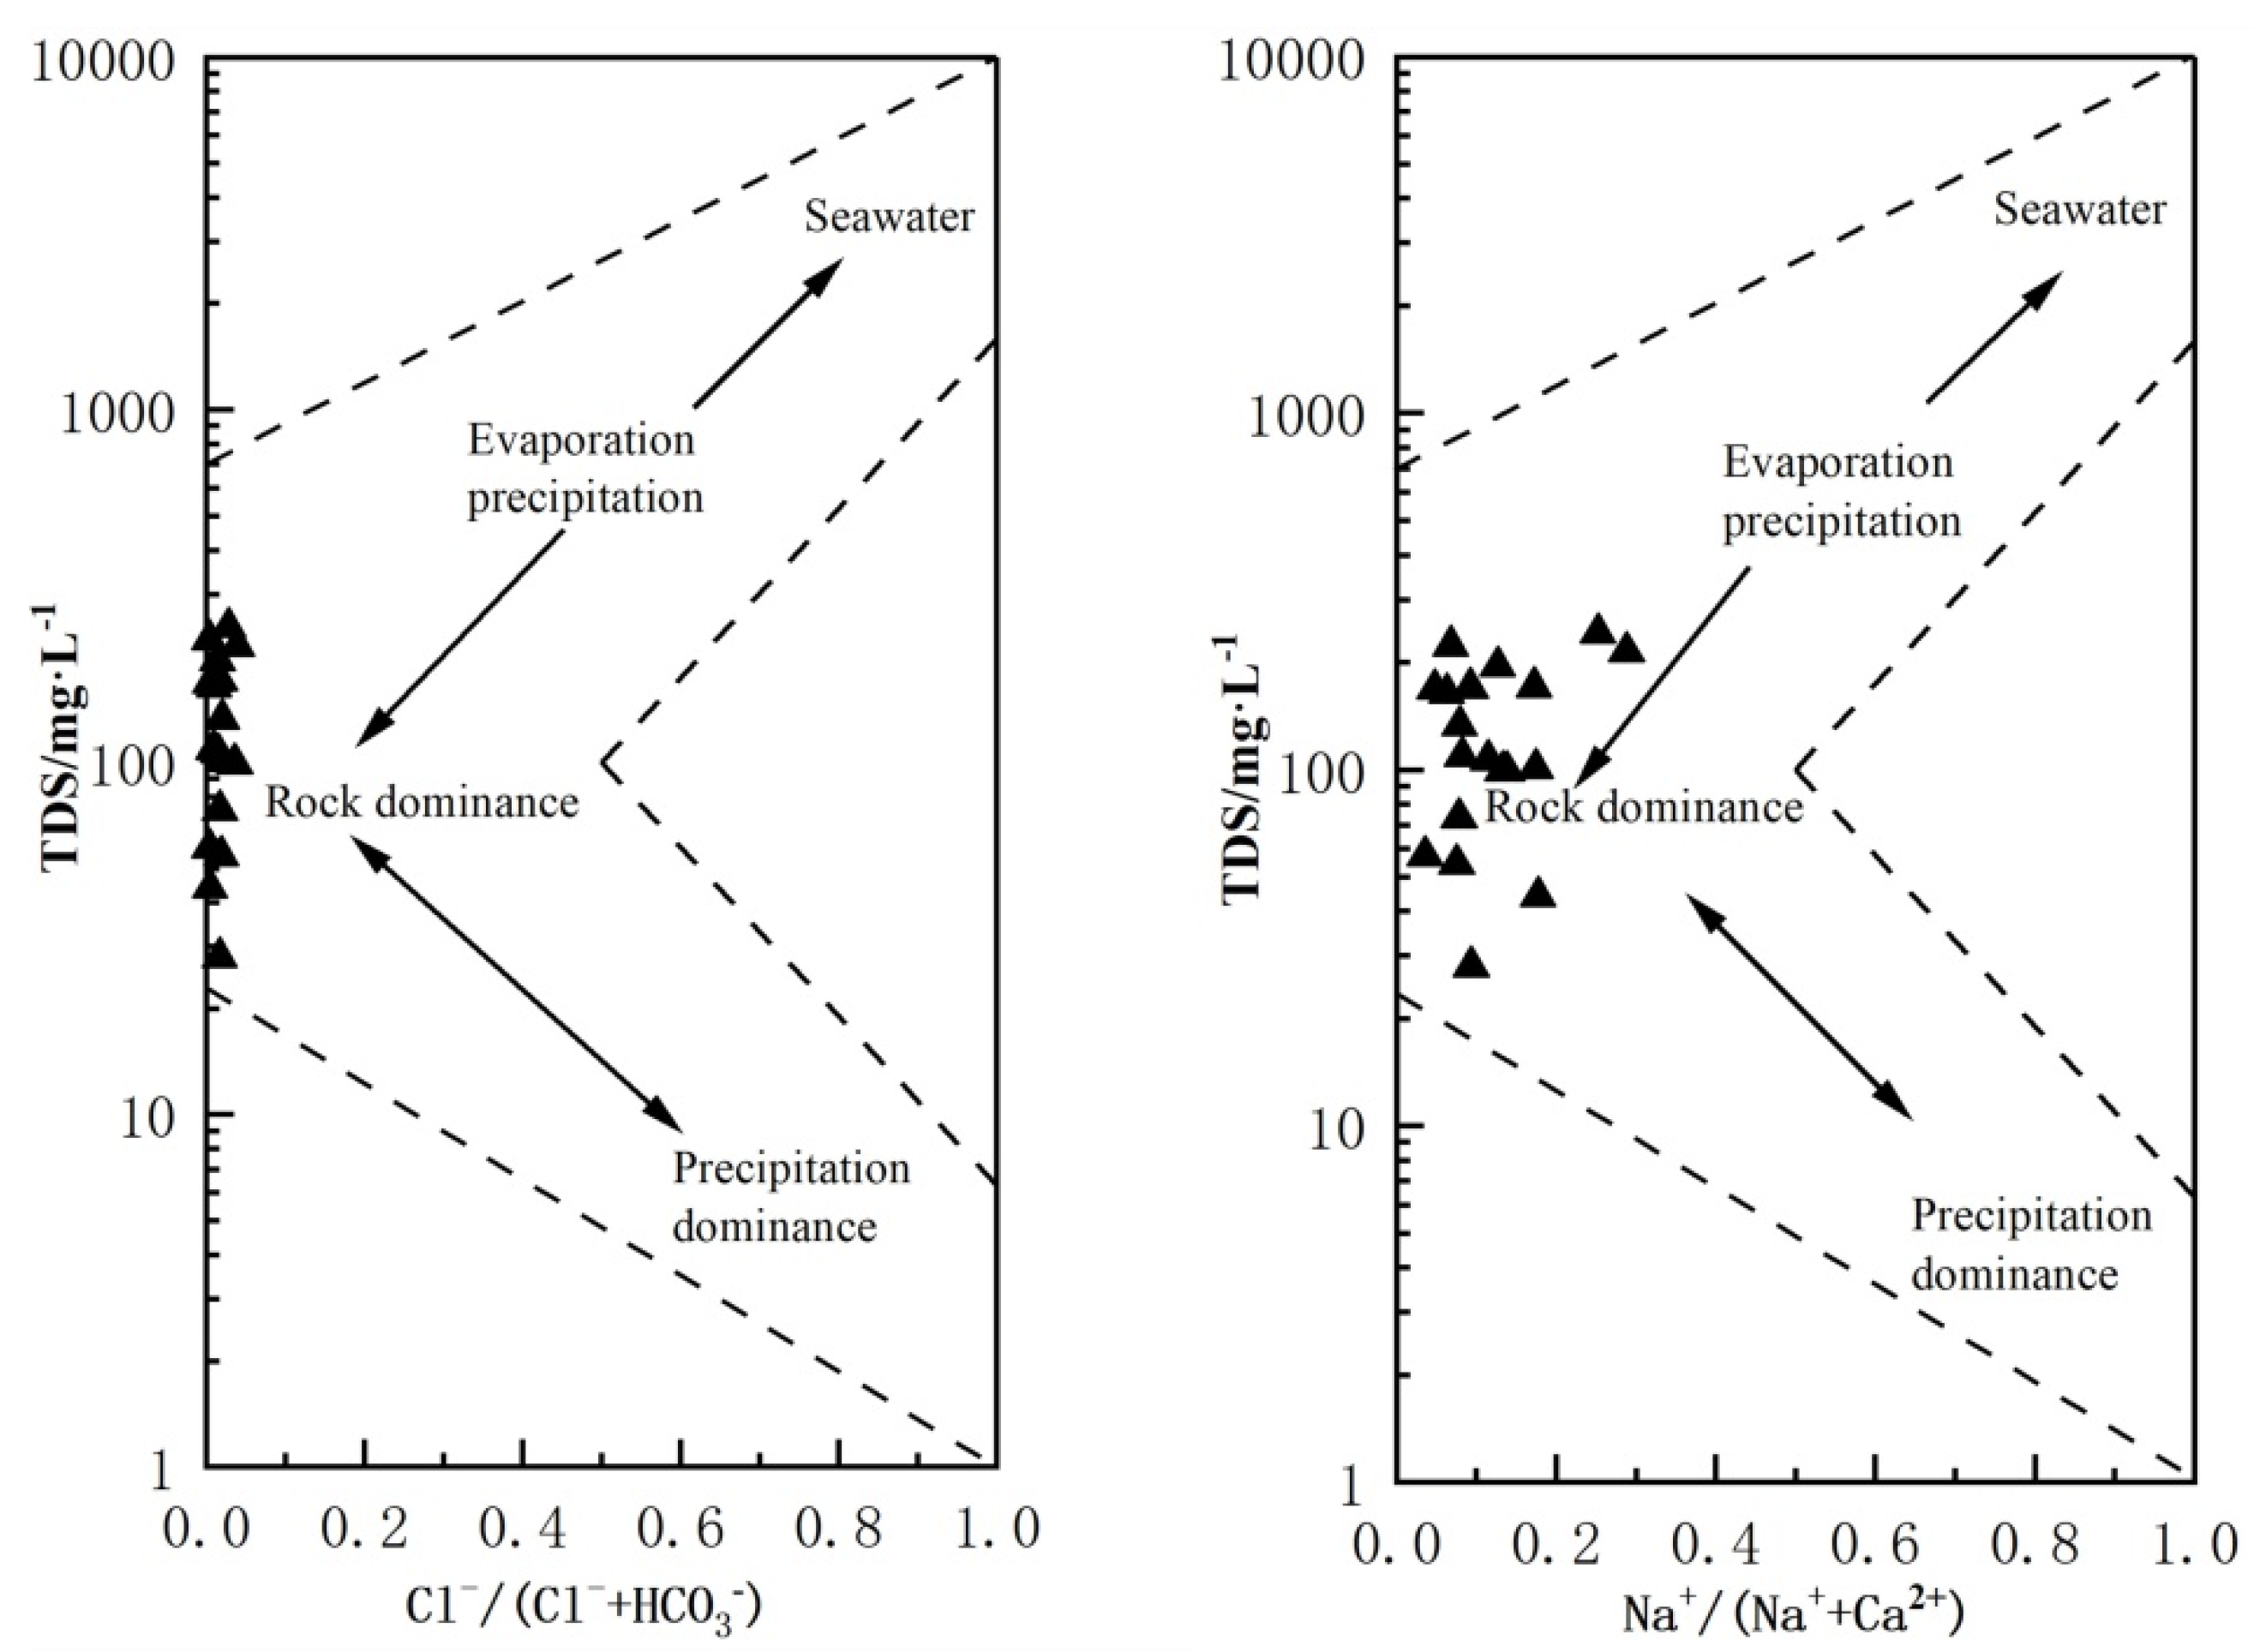
4.2.1. Gibbs Diagram
4.2.2. Correlation Analysis
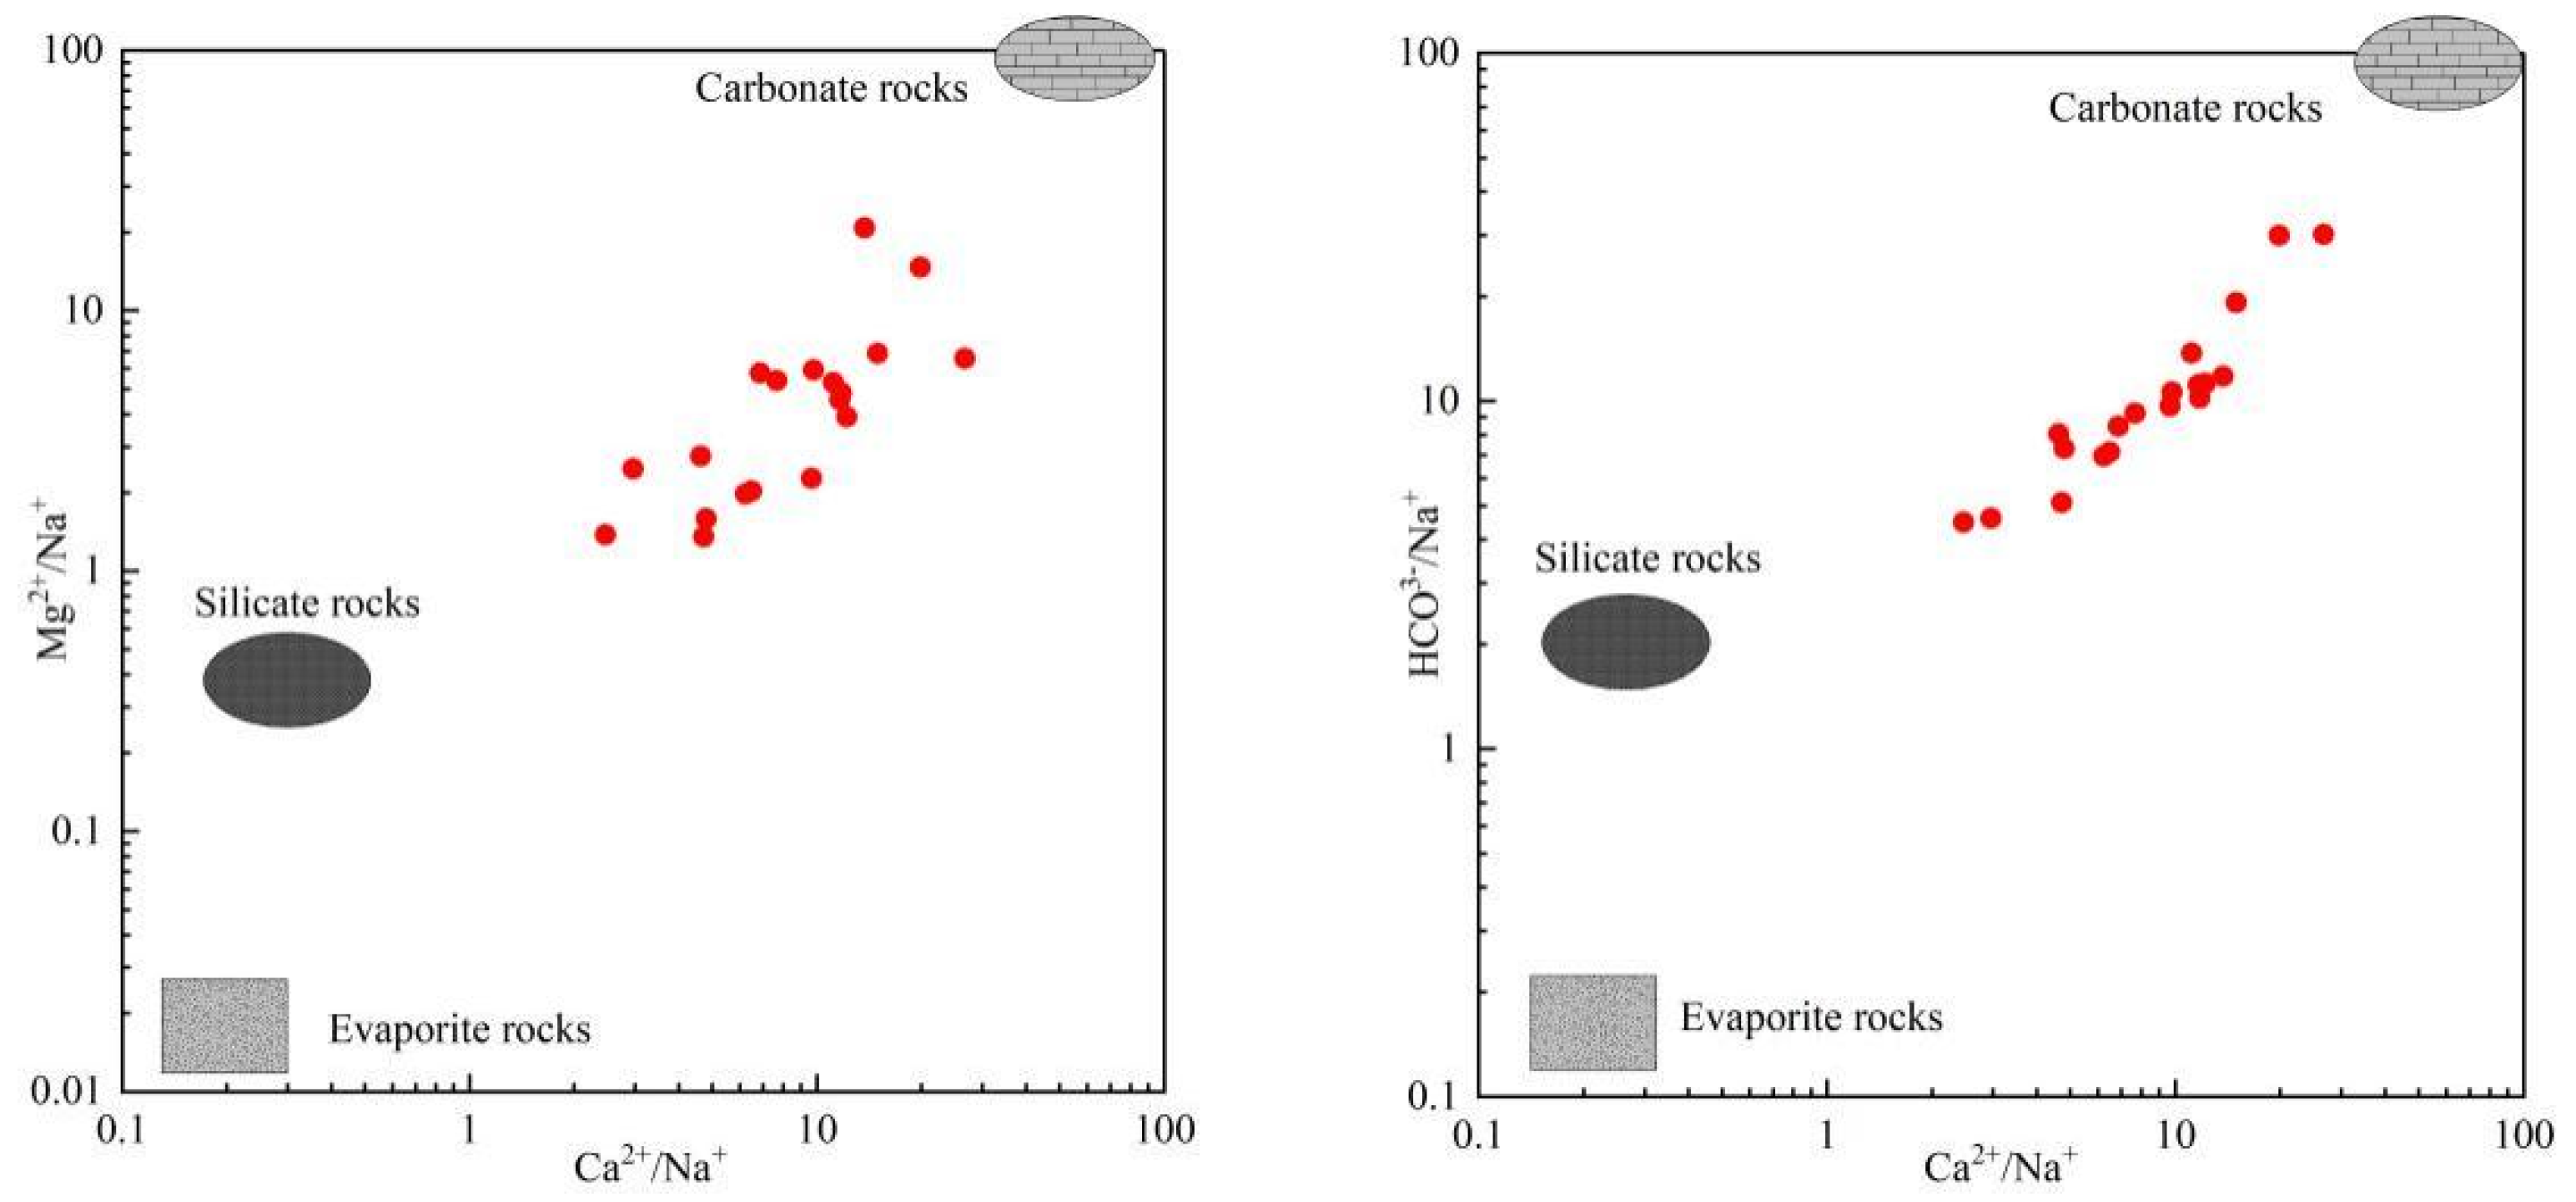
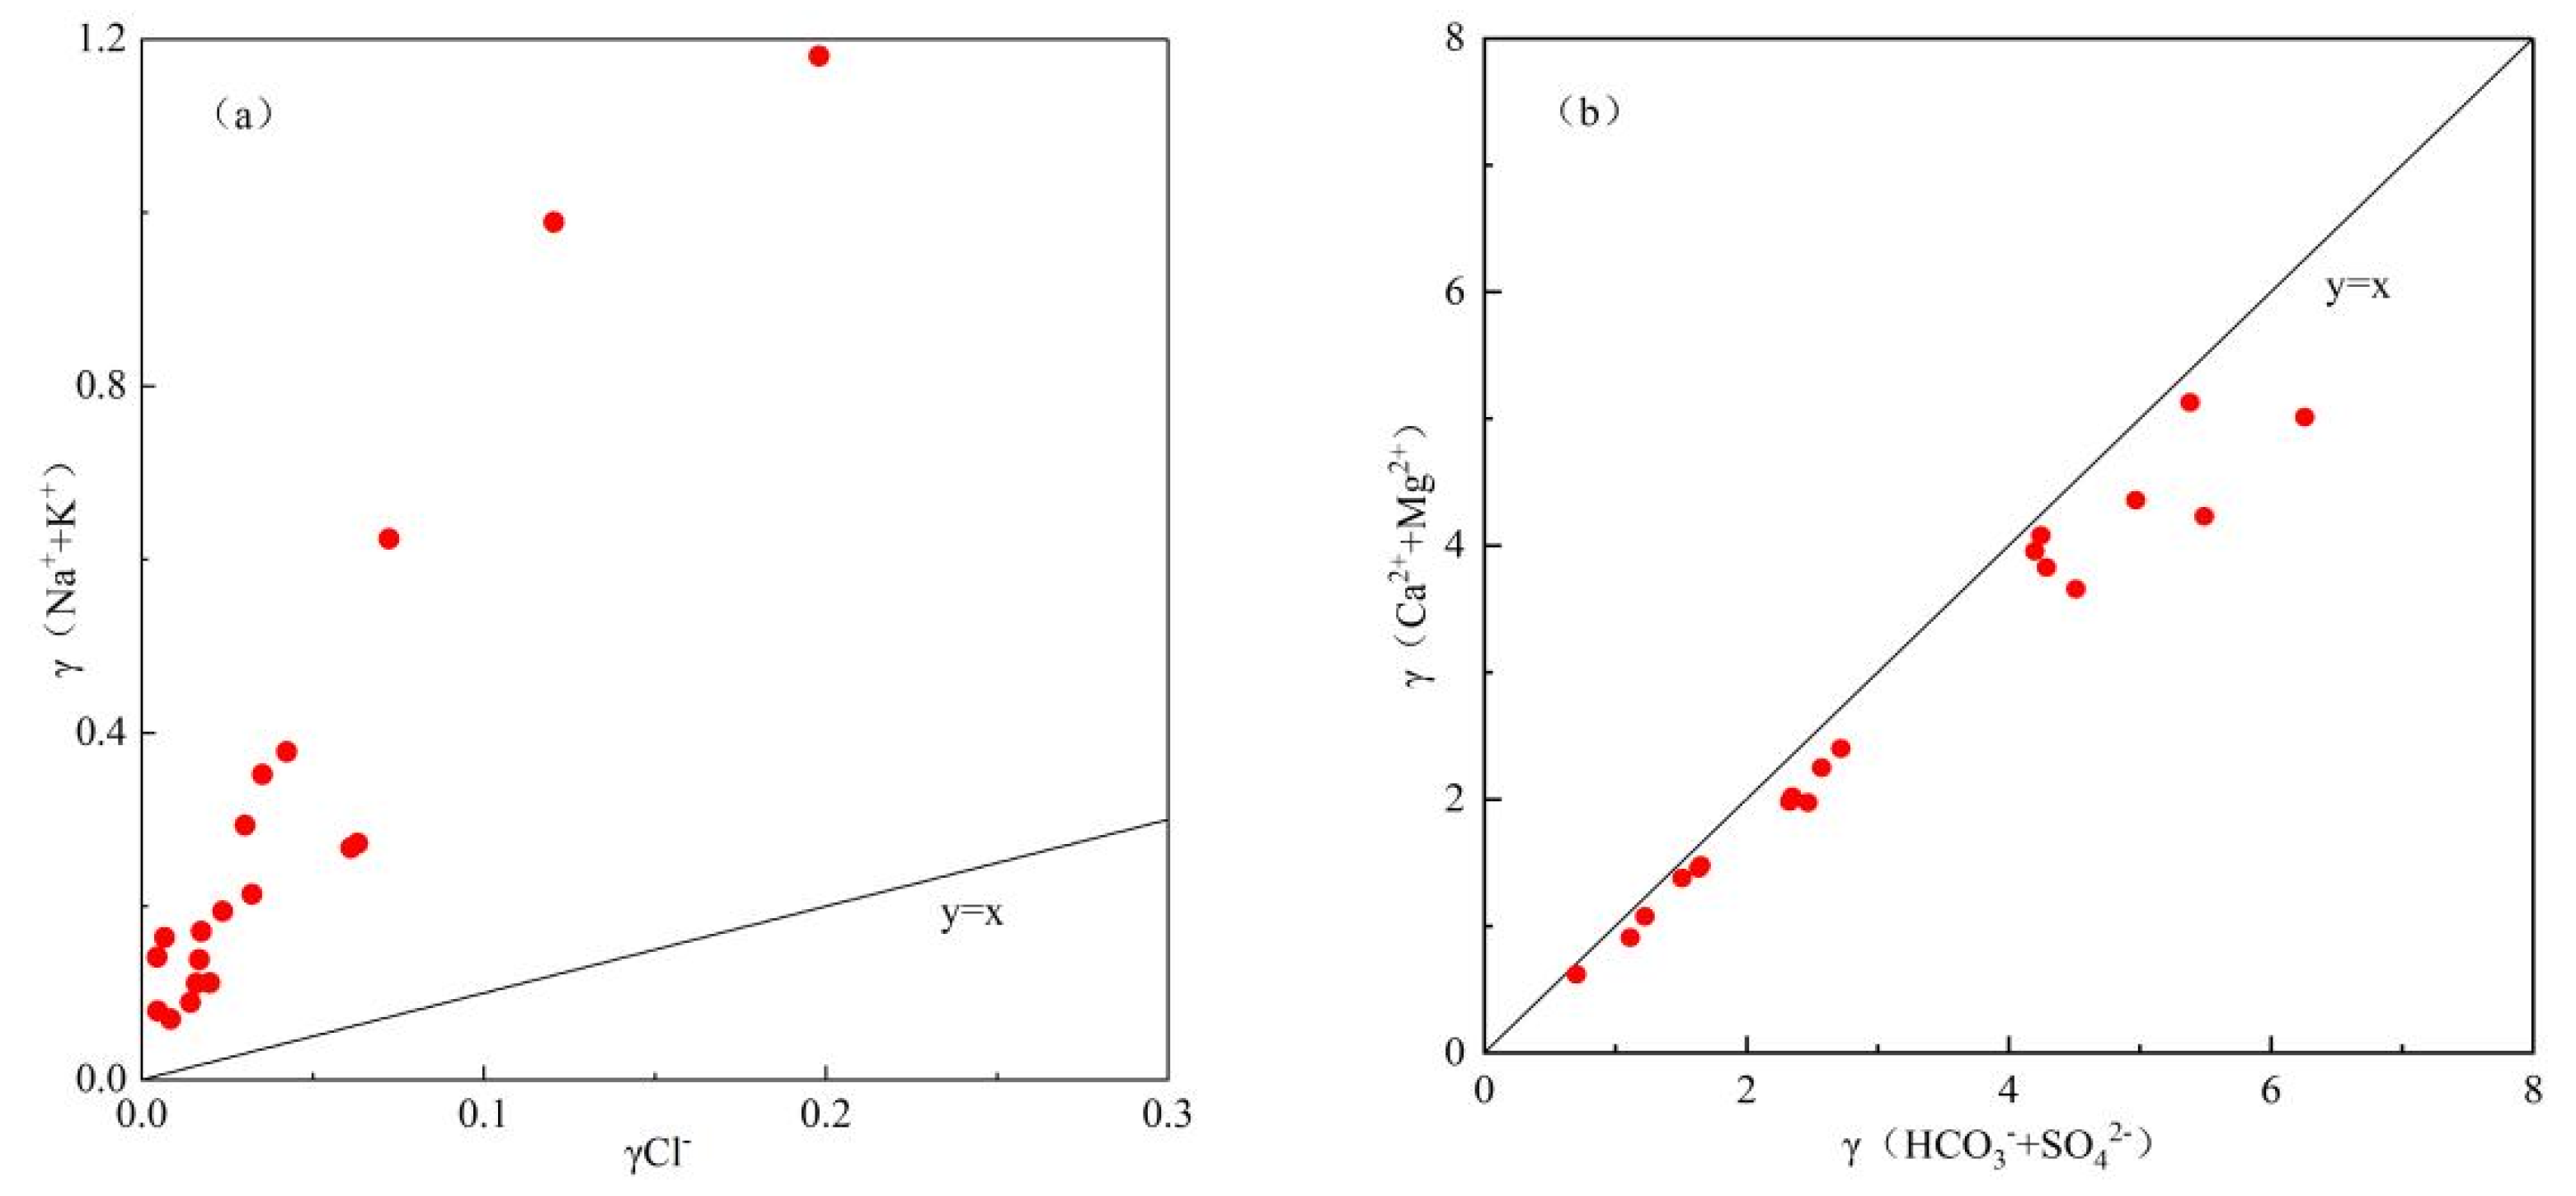
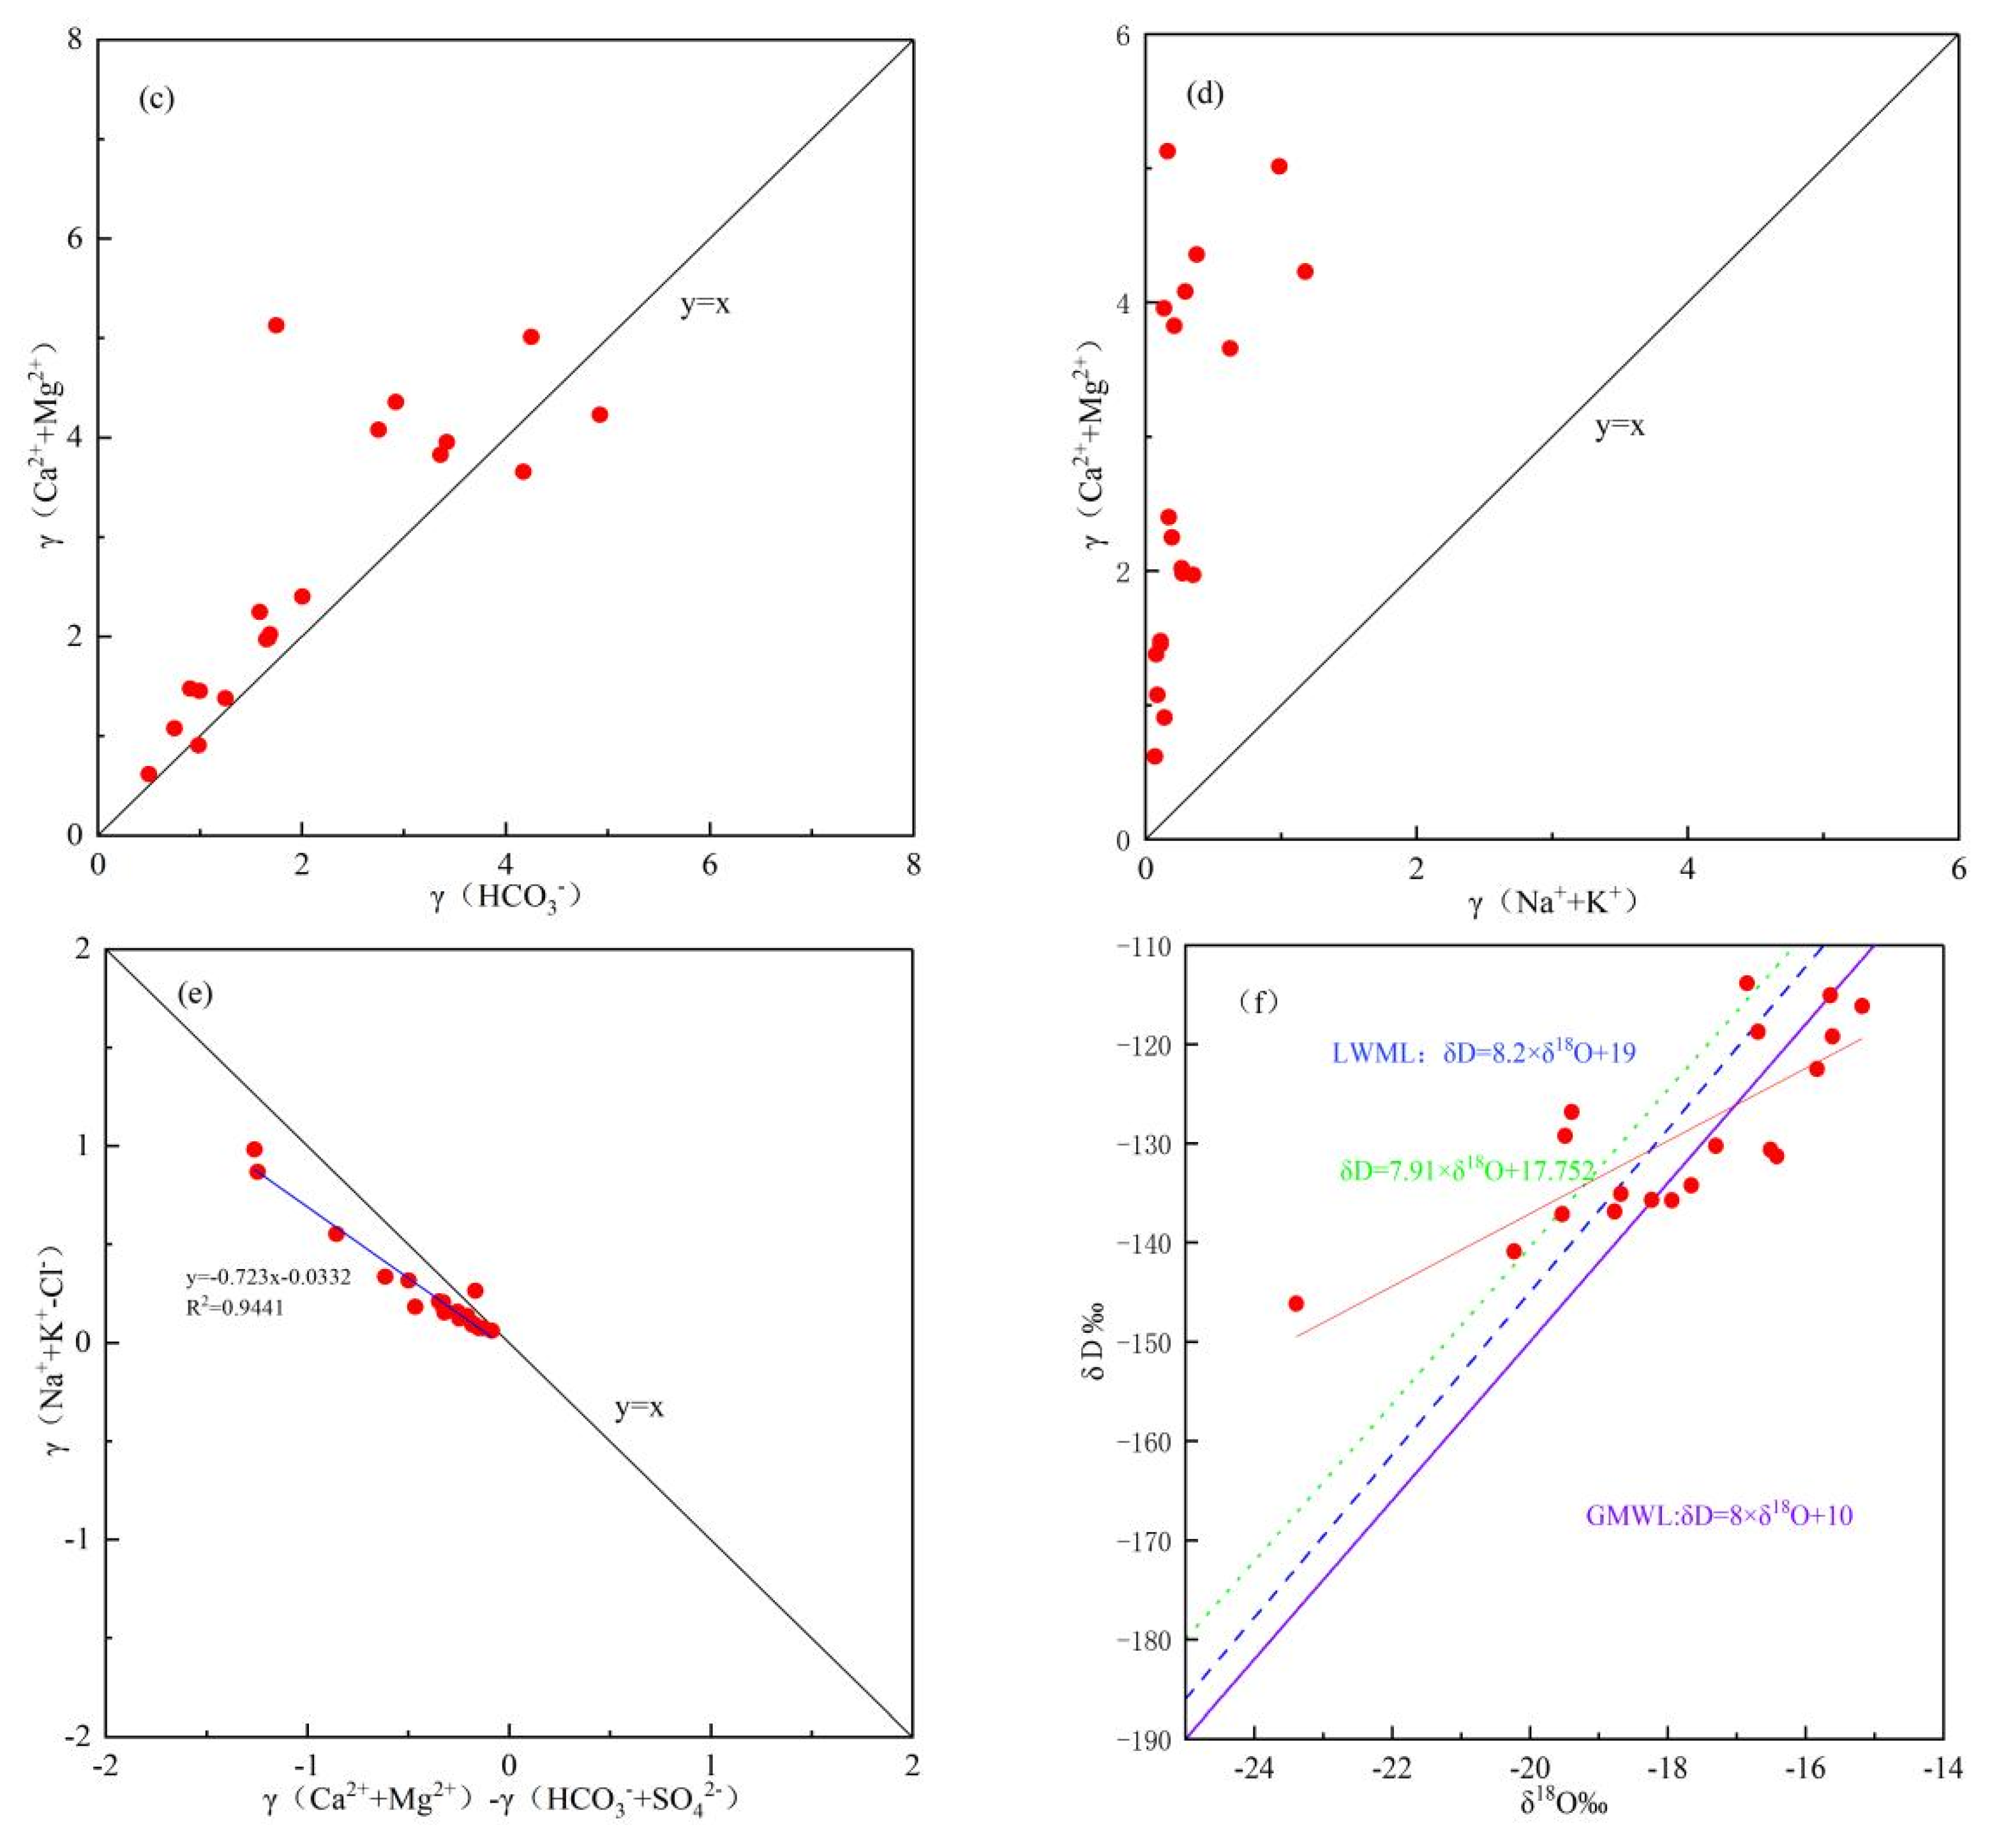
4.2.3. Ion Ratio
4.3. Isotopic Characteristics
5. Conclusions
Author Contributions
Funding
Data Availability Statement
Acknowledgments
Conflicts of Interest
References
- Li, P.Y.; Qian, H. Water resources research to support a sustainable China. Int. J. Water Resour. Dev. 2018, 34, 327–336. [Google Scholar] [CrossRef] [Green Version]
- Hao, A.; Zhang, Y.; Zhang, E.; Li, Z.; Yu, J.; Wang, H.; Yang, J.; Wang, Y. Review: Groundwater resources and related environmental issues in China. Hydrogeol. J. 2018, 26, 1325–1337. [Google Scholar] [CrossRef]
- Ren, X.Z.; Li, J.G.; Liu, M.; Li, J.Y. Hydrochemical composition of natural waters and its affecting factors in the East Hunshandak Sandy Land. Arid. Zone Res. 2019, 36, 791–800. (In Chinese) [Google Scholar]
- Xing, L.N.; Guo, H.M.; Zhan, Y.H. Groundwater hydrochemical characteristics and processes along flow paths in the North China Plain. J. Asian Earth Sci. 2013, 70, 250–264. [Google Scholar] [CrossRef]
- Houria, B.; Mahdi, K.; Zohra, T.F. Hydrochemical characterisation of groundwater quality: Merdja plain (Tebessa town, Algeria). Civ. Eng. J. 2020, 6, 318–325. [Google Scholar] [CrossRef] [Green Version]
- Zhang, T.; Cai, W.T.; Li, Y.Z.; Zhang, Z.Y.; Geng, T.T.; Bian, C.; Zhao, M.; Cai, Y.M. Major ionic features and their possible controls in the water of the Niyang River Basin. Environ. Sci. 2017, 38, 4537–4545. [Google Scholar]
- Wang, S.L.; Li, Z.F.; Liu, J.S.; Liang, Z.X. Study on neon isotopes in surface water and groundwater in the eastern part of the Qinghai-Tibet Plateau. Environ. Sci. 1990, 11, 23–27. (In Chinese) [Google Scholar]
- Liu, J.T.; Gao, Z.J.; Wang, M.; Li, Y.Z.; Yu, C.; Shi, M.J.; Zhang, H.Y.; Ma, Y.Y. Stable isotope characteristics of different water bodies in the Lhasa River Basin. Environ. Earth Sci. 2019, 78, 71. [Google Scholar] [CrossRef]
- Zhang, Q.H.; Sun, P.A.; He, S.Y.; Wen, H.; Liu, M.L.; Yu, S. Chemical characteristics and sources of main ions in the river water of Lhasa River Basin in Tibet. Environ. Sci. 2018, 39, 1065–1075. (In Chinese) [Google Scholar]
- Tian, Y.; Yu, C.; Zha, X.; Gao, X.; Dai, E. Hydrochemical characteristics and controlling factors of natural water in the border areas of the Qinghai-Tibet Plateau(Article). J. Geogr. Sci. 2019, 29, 1876–1894. [Google Scholar] [CrossRef] [Green Version]
- Pan, G.T.; Wang, L.Q.; Zhang, W.P.; Wang, B.D. The Geotectonic Map and Instructions of the Qinghai-Tibet Plateau and Adjacent Areas (1:1,500,000); Geological Publishing House: Beijing, China, 2013. (In Chinese) [Google Scholar]
- Lu, Y.; Li, Y.B.; Mima, P.C.; Hao, J.T.; Dexi, Z.Y. Evolution of structural geology and metallogenic unite, Xizang (Tibet) Autonomous Region. Geol. Rev. 2016, 62, 219–220. (In Chinese) [Google Scholar]
- Zhang, J.; Zhou, J.L.; Nai, W.H.; Zeng, Y.Y.; Chen, Y.F.; Wei, X. Spatial distribution and cause of shallow groundwater salinization in the plain area of the Yeerqiang River Basin in Xinjiang. J. Agric. Eng. 2019, 35, 135–143. (In Chinese) [Google Scholar]
- World Health Organization. Guidelines for Drinking-Water Quality; World Health Organization: Geneva, Switzerland, 2011.
- Ministry of Health of the PRC; Standardization Administration of the PRC. Standards for Drinking Water Quality (GB5749–2006); China Standard: Beijing, China, 2006; (In Chinese).
- Piper, A.M. A graphic procedure in the geochemical interpretation of water-analyses. Trans. Am. Geophys. Union 1944, 25, 914–928. [Google Scholar] [CrossRef]
- Ebrahimi, M.; Kazemi, H.; Ehtashemi, M.; Rockaway, T.D. Assessment of groundwater quantity and quality and saltwater intrusion in the Damghan basin, Iran. Geochemistry 2016, 76, 227–241. [Google Scholar] [CrossRef]
- Reddy, A.G.S.; Kumar, K.N. Identification of the hydrogeochemical processes in groundwater using major ion chemistry: A case study of Penna-Chitravathi river basins in Southern India. Environ. Monit. Assess. 2010, 170, 365–382. [Google Scholar] [CrossRef]
- Tian, Y.; Yu, C.Q.; Luo, K.L.; Zha, X.J.; Wu, J.S.; Zhang, X.Z.; Ni, R.X. Hydrochemical characteristics and element contents of natural waters in Tibet, China. J. Geogr. Sci. 2015, 25, 669–686. [Google Scholar] [CrossRef]
- Gibbs, R.J. Mechanisms controlling world water chemistry. Science 1970, 170, 1088–1090. [Google Scholar] [CrossRef]
- Aref, F.; Roosta, R. Assessment of groundwater quality and hydrochemical characteristics in Farashband plain, Iran. Arab. J. Geosci. 2016, 9, 752. [Google Scholar] [CrossRef]
- Redwan, M.; Abdel Moneim, A.A. Factors controlling groundwater hydrogeochemistry in the area west of Tahta, Sohag, Upper Egypt. J. Afr. Earth Sci. 2016, 118, 328–338. [Google Scholar] [CrossRef]
- Stallard, R.F.; Edmond, J.M. Geochemistry of the Amazon: 3. Weathering chemistry and limits to dissolved inputs. J. Geophys. Res. Part C Ocean. 1987, 92, 8293–8302. [Google Scholar] [CrossRef]
- Qaisar, F.U.R.; Zhang, F.; Pant, R.R.; Wang, G.X.; Khan, S.; Zeng, C. Spatial variation, source identification, and quality assessment of surface water geochemical composition in the Indus River Basin, Pakistan. Environ. Sci. Pollut. Res. 2018, 25, 12736–12749. [Google Scholar] [CrossRef]
- Wu, H.W.; Wu, J.L.; Li, J.; Fu, C.S. Spatial variations of hydrochemistry and stable isotopes in mountainous river water from the Central Asian headwaters of the Tajikistan Pamirs. CATENA 2020, 193, 104639. [Google Scholar] [CrossRef]
- Tian, Y.; Yu, C.Q.; Zha, X.J.; Wu, J.S.; Gao, X.; Feng, C.J.; Luo, K.L. Distribution and Potential Health Risks of Arsenic, Selenium, and Fluorine in Natural Waters in Tibet, China. Water 2016, 8, 568. [Google Scholar] [CrossRef] [Green Version]
- Liu, J.T.; Gao, Z.J.; Wang, M.; Li, Y.Z.; Yu, C.; Shi, M.J.; Zhang, H.Y.; Ma, Y.Y. Hydrochemical characteristics and possible controls in the groundwater of the Yarlung Zangbo River Valley, China. Environ. Earth Sci. 2019, 78, 76. [Google Scholar] [CrossRef]
- Jiang, L.G.; Yao, Z.J.; Liu, Z.F.; Wang, R.; Wu, S.S. Hydrochemistry and its controlling factors of rivers in the source region of the Yangtze River on the Tibetan Plateau. J. Geochem. Explor. 2015, 155, 76–83. [Google Scholar] [CrossRef]
- Zhu, L.P.; Ju, J.T.; Wang, Y.; Xie, M.P.; Wang, J.B.; Peng, P.; Zhen, X.L.; Lin, X. Composition, spatial distribution, and environmental significance of water ions in Pumayum Co catchment, southern Tibet. J. Geogr. Sci. 2010, 20, 109–120. [Google Scholar] [CrossRef]
- Ren, C.B.; Zhang, Q.Q. Groundwater Chemical Characteristics and Controlling Factors in a Region of Northern China with Intensive Human Activity. Int. J. Environ. Res. Public Health 2020, 17, 9126. [Google Scholar] [CrossRef] [PubMed]
- Meybeck, M. Global chemical-weathering of surficial rocks estimated from river dissolved loads. Am. J. Sci. 1987, 287, 401–428. [Google Scholar] [CrossRef]
- Shen, Z.L. The Basis of Hydrogeochemistry; Geological Publishing House: Beijing, China, 1993. (In Chinese) [Google Scholar]
- Fadili, A.; Najib, S.; Mehdi, K.; Riss, J.; Makan, A.; Guessir, H. Hydrochemical features and mineralization processes in coastal groundwater of Oualidia, Morocco. J. Afr. Earth Sci. 2016, 116, 233–247. [Google Scholar] [CrossRef]
- Ahmad, T.; Khanna, P.P.; Chakrapani, G.J.; Balakrishnan, S. Geochemical characteristics of water and sediment of the Indus river, Trans-Himalaya, India: Constraints on weathering and erosion. J. Asian Earth Sci. 1998, 16, 333–346. [Google Scholar] [CrossRef]
- Zhu, B.Q.; Yang, X.P. The ion chemistry of surface and ground waters in the Taklimakan Desert of Tarim Basin, western China. Chin. Sci. Bull. 2007, 52, 2123–2129. [Google Scholar] [CrossRef]
- Zhang, L.A.; Song, X.F.; Xia, J.; Yuan, R.Q.; Zhang, Y.Y.; Liu, X.; Han, D.M. Major element chemistry of the Huai River basin, China. Appl. Geochem. 2011, 26, 293–300. [Google Scholar] [CrossRef]
- Ren, X.H.; Gao, Z.J.; An, Y.H.; Liu, J.T.; Wu, X.; He, M.H.; Feng, J.G. Hydrochemical and isotopic characteristics of groundwater in the Jiuquan East Basin, China. Arab. J. Geosci. 2020, 13, 545. [Google Scholar] [CrossRef]
- Wen, X.H.; Wu, Y.Q.; Wu, J. Hydrochemical characteristics of groundwater in the Zhangye Basin, Northwestern China. Environ. Geol. 2008, 55, 1713–1724. [Google Scholar] [CrossRef]
- Li, S.Y.; Zhang, Q.F. Geochemistry of the upper Han River basin, China, 1: Spatial distribution of major ion compositions and their controlling factors. Appl. Geochem. 2008, 23, 3535–3544. [Google Scholar] [CrossRef]
- Sun, R.; Zhang, X.Q.; Wu, Y.H. Major ion chemistry ofwater and its controlling factors in the Yamzhog Yumco basin, south Tibet. J. Lake Sci. 2012, 24, 600–608. (In Chinese) [Google Scholar]
- Qin, J.; Huh, Y.; Edmond, J.M.; Du, G.; Ran, J. Chemical and physical weathering in the Min Jiang, a headwater tributary of the Yangtze River. Chem. Geol. 2007, 227, 53–69. [Google Scholar] [CrossRef]
- Li, Y.Z.; Liu, J.T.; Gao, Z.J.; Wang, M.; Yu, L.Q. Major ion chemistry and water quality assessment of groundwater in the Shigaze urban area, Qinghai-Tibetan Plateau, China. Water Supply 2020, 20, 335–347. [Google Scholar] [CrossRef]
- Yu, J.S.; Zhang, H.B.; Yu, F.J.; Liu, D.P. Characteristics of oxygen isotope composition of atmospheric precipitation in eastern Tibet. Geochemistry 1980, 2, 113–121. (In Chinese) [Google Scholar]
- Craig, H. Isotopic variations in meteoric waters. Science 1961, 133, 1702–1703. [Google Scholar] [CrossRef]
- Qin, H.H.; Gao, B.; Chen, Y.P.; Sun, Z.X. Spatial Distribution of Hydrogen and Oxygen Isotopes in Lhasa River in Summer and the Implications. Earth Environ. 2021, 49, 277–284. [Google Scholar]
- Dansgaard, W. Stable isotopes in precipitation. Tellus 1964, 16, 436–468. [Google Scholar] [CrossRef]
- Gu, H.B.; Chi, B.M.; Wang, H.; Zhang, Y.W.; Wang, M.Y. Hydrogen and oxygen stable isotopes and hydrochemical evidence of the transformation relationship between surface water and groundwater in the Liujiang Basin. Adv. Earth Sci. 2017, 32, 789–799. (In Chinese) [Google Scholar]


| Number | K+ | Na+ | Ca2+ | Mg2+ | Cl− | HCO3− | SO42− | NO3− | PH | TDS | EC | δD | δ18O |
|---|---|---|---|---|---|---|---|---|---|---|---|---|---|
| Y01 | 0.86 | 2.07 | 20.92 | 4.89 | 0.71 | 61.02 | 30.54 | 1.26 | 7.57 | 133 | 250 | −146.15 | −23.39 |
| Y02 | 0.85 | 2.05 | 20.90 | 5.17 | 0.57 | 55.28 | 35.70 | 0.84 | 7.87 | 73.4 | 138.8 | −140.90 | −20.23 |
| Y03 | 0.86 | 1.54 | 16.31 | 3.13 | 0.51 | 45.77 | 22.83 | 0.72 | 7.8 | 54.5 | 103.9 | −129.25 | −19.49 |
| Y04 | 0.70 | 1.19 | 10.00 | 1.41 | 0.30 | 30.51 | 9.71 | 0.36 | 7.77 | 28 | 53.5 | −119.22 | −15.61 |
| Y05 | 1.47 | 0.96 | 22.14 | 3.26 | 0.17 | 76.28 | 12.36 | 0.30 | 7.67 | 57.3 | 108.5 | −118.76 | −16.69 |
| N01 | 1.09 | 7.46 | 30.64 | 5.27 | 1.25 | 100.79 | 39.19 | 0.76 | 7.6 | 101 | 190.2 | −130.25 | −17.30 |
| N02 | 1.31 | 5.97 | 50.85 | 18.45 | 1.07 | 167.81 | 71.74 | 1.04 | 7.58 | 170 | 318 | −136.87 | −18.77 |
| N03 | 0.98 | 3.36 | 32.59 | 9.25 | 0.62 | 122.30 | 34.30 | 0.93 | 7.73 | 109.1 | 205.2 | −135.72 | −18.23 |
| N04 | 0.72 | 2.82 | 11.36 | 4.07 | 0.16 | 60.28 | 6.04 | 0.49 | 7.7 | 44 | 83.6 | −135.75 | −17.94 |
| N05 | 0.93 | 2.63 | 45.50 | 20.17 | 0.60 | 208.83 | 37.37 | 1.29 | 7.71 | 168.5 | 315 | −131.28 | −16.42 |
| N06 | 1.50 | 4.04 | 52.49 | 14.41 | 1.15 | 205.08 | 44.55 | 1.08 | 8.04 | 164.1 | 306 | −130.62 | −16.51 |
| N07 | 0.85 | 3.96 | 26.43 | 11.12 | 0.84 | 96.79 | 47.29 | 0.81 | 8.02 | 106.5 | 200 | −122.52 | −15.83 |
| N08 | 1.29 | 7.94 | 47.46 | 23.80 | 1.51 | 178.32 | 98.27 | 1.36 | 7.99 | 194.9 | 363 | −126.83 | −19.39 |
| N09 | 0.58 | 3.42 | 40.87 | 36.99 | 0.24 | 106.79 | 174.34 | 0.77 | 7.94 | 223.0 | 411 | −137.14 | −19.53 |
| N10 | 2.53 | 21.25 | 54.75 | 27.30 | 4.28 | 259.34 | 96.37 | 2.13 | 8.14 | 242.0 | 449 | −115.09 | −15.64 |
| N11 | 2.00 | 13.17 | 55.02 | 10.88 | 2.57 | 254.59 | 16.31 | 3.48 | 8.30 | 170.7 | 319 | −113.86 | −16.85 |
| N12 | 3.11 | 25.31 | 54.27 | 18.20 | 7.03 | 300.36 | 27.25 | 2.76 | 8.18 | 214.2 | 397 | −116.18 | −15.18 |
| L01 | 1.22 | 5.55 | 30.08 | 5.72 | 2.24 | 102.04 | 31.46 | 1.74 | 8.14 | 99.4 | 186.7 | −134.24 | −17.66 |
| L02 | 1.19 | 5.45 | 30.80 | 5.76 | 2.17 | 103.04 | 31.65 | 1.85 | 7.87 | 99.3 | 186.5 | −135.08 | −18.68 |
| Min | 0.58 | 0.96 | 10.00 | 1.41 | 0.16 | 30.51 | 6.04 | 0.30 | 7.57 | 28.00 | 53.50 | −146.15 | −23.39 |
| Max | 3.11 | 25.31 | 55.02 | 36.99 | 7.03 | 300.36 | 174.34 | 3.48 | 8.30 | 242.00 | 449.00 | −113.86 | −15.18 |
| Mean | 1.27 | 6.32 | 34.39 | 12.07 | 1.47 | 133.43 | 45.65 | 1.26 | 7.87 | 129.10 | 241.31 | −129.25 | −17.86 |
| SD | 0.63 | 6.50 | 14.95 | 9.49 | 1.65 | 78.07 | 39.23 | 0.80 | 0.21 | 62.44 | 115.02 | 9.07 | 1.97 |
| CV | 0.50 | 1.03 | 0.43 | 0.79 | 1.12 | 0.59 | 0.86 | 0.64 | 0.03 | 0.48 | 0.48 | −0.07 | −0.11 |
| WHO | 10 | 200 | 75 | 50 | 250 | 300 | 400 | 45 | 8.5 | 500 | |||
| CS | 200 | 250 | - | 250 | 10 | 6.5−8.5 | 1000 |
| Na+ | HCO3− | K+ | Mg2+ | Ca2+ | Cl− | SO42− | NO3− | TDS | |
|---|---|---|---|---|---|---|---|---|---|
| Na+ | 1 | ||||||||
| HCO3− | 0.815 ** | 1 | |||||||
| K+ | 0.926 ** | 0.830 ** | 1 | ||||||
| Mg2+ | 0.418 | 0.594 ** | 0.281 | 1 | |||||
| Ca2+ | 0.669 ** | 0.933 ** | 0.677 ** | 0.724 ** | 1 | ||||
| Cl− | 0.953 ** | 0.751 ** | 0.919 ** | 0.285 | 0.590 ** | 1 | |||
| SO42− | 0.146 | 0.213 | −0.031 | 0.883 ** | 0.448 | 0.014 | 1 | ||
| NO3− | 0.768 ** | 0.770 ** | 0.746 ** | 0.257 | 0.675 ** | 0.780 ** | −0.016 | 1 | |
| TDS | 0.660 ** | 0.820 ** | 0.570 * | 0.890 ** | 0.900 ** | 0.560 ** | 0.687 ** | 0.581 ** | 1 |
Publisher’s Note: MDPI stays neutral with regard to jurisdictional claims in published maps and institutional affiliations. |
© 2021 by the authors. Licensee MDPI, Basel, Switzerland. This article is an open access article distributed under the terms and conditions of the Creative Commons Attribution (CC BY) license (https://creativecommons.org/licenses/by/4.0/).
Share and Cite
Gao, Z.; Tong, H.; Su, Q.; Liu, J.; Gao, F.; Han, C. Hydrochemical Characteristics and Cause Analysis of Natural Water in the Southeast of Qinghai-Tibet Plateau. Water 2021, 13, 3345. https://doi.org/10.3390/w13233345
Gao Z, Tong H, Su Q, Liu J, Gao F, Han C. Hydrochemical Characteristics and Cause Analysis of Natural Water in the Southeast of Qinghai-Tibet Plateau. Water. 2021; 13(23):3345. https://doi.org/10.3390/w13233345
Chicago/Turabian StyleGao, Zongjun, Hui Tong, Qiao Su, Jiutan Liu, Fasheng Gao, and Cong Han. 2021. "Hydrochemical Characteristics and Cause Analysis of Natural Water in the Southeast of Qinghai-Tibet Plateau" Water 13, no. 23: 3345. https://doi.org/10.3390/w13233345
APA StyleGao, Z., Tong, H., Su, Q., Liu, J., Gao, F., & Han, C. (2021). Hydrochemical Characteristics and Cause Analysis of Natural Water in the Southeast of Qinghai-Tibet Plateau. Water, 13(23), 3345. https://doi.org/10.3390/w13233345