Article

Efficient Adsorption of Lead Ions from Synthetic Wastewater Using Agrowaste-Based Mixed Biomass (Potato Peels and Banana Peels)

1
Department of Chemistry, University of Agriculture, Faisalabad 38040, Pakistan
2
Department of Material Sciences, Shandong University, Jinan 250100, China
3
Institute of Nanoscience and Nanotechnology (ION2), Universiti Putra Malaysia (UPM), Serdang 43400, Malaysia
*
Authors to whom correspondence should be addressed.
Water 2021, 13(23), 3344; https://doi.org/10.3390/w13233344
Submission received: 16 September 2021 / Revised: 11 October 2021 / Accepted: 15 October 2021 / Published: 25 November 2021
(This article belongs to the Section Wastewater Treatment and Reuse)

Abstract

:
The aquatic environment is continuously being polluted by heavy metals released from industrial, domestic, agricultural, and medical applications. It is difficult to remove heavy metals, as they are nonbiodegradable. Heavy metals cause genotoxicity and serious carcinogenic disorders. Various conventional methods have been used for the removal of heavy metals, but these are time-consuming and not economical, so green methods, being economical, are preferred over conventional methods. Adsorption, being effective, environmentally friendly, and cheap, is often preferred. The present investigation investigated the adsorption efficiency of agrowaste-based biosorbents for removal of Pb(II) ion from the synthetic wastewater. Mixed biomass of banana peel and potato peels was used to create biosorbents. The biosorbents were characterized in terms of structural and surface morphology by SEM, while functional groups were analyzed by FT-IR and XRD analysis. The adsorption of Pb(II) was studied by a batch method, and various experimental parameters were studied. Optimum conditions for the removal of lead were pH = 5, concentration = 10 ppm, adsorbent dosage = 1.0 g, and contact time = 2 h. Kinetic modelling studies showed that the adsorption of Pb(II) ions followed a pseudo-second-order mechanism, and the Langmuir isotherm model was found to fit well for this study. Highlights: Synthesis of biosorbents (mixed biomass of potato peel and banana peel, biochar, TiO2 nanocomposites). Characterization of prepared biosorbents (SEM, XRD, FT-IR). Optimized parameters (pH, initial concentration, adsorbent dosage, and contact time) for removal of pollutant.

1. Introduction

Water is a fundamental component of human life. Its chemical properties and dissolving ability are enhanced by its structural polarity and hydrogen bonding. This essential resource is continuously being polluted with various contaminants. Heavy metals are one of the most important threats to our environment. Leathermaking, electroplating, tannin, battery manufacturing, mining, and smelting are major sources of the discharge of heavy metals which contaminate water [1]. Heavy metals are often found in excess levels in ecosystems and are extremely toxic, ranked among highly lethal metals [2]. Among these trace metals, Cu2+, Pb2+, Hg2+, Zn2+, Cd2+, Cr6+, Ni2+, and As3+ have been considered as pollutants in the contaminated water. Small amounts of these metals can greatly injure the human body, affecting the central brain, kidney, and liver. Central nervous system disorders can in turn lead to coma and death. Also, lead poisoning in lower concentrations may cause anemia and produce lining on gums. The permitted safety level for Pb+2 content in drinking water is no more than 0.01 mg/L [3,4]. Heavy metals are conventionally treated through ion exchange, precipitation, membrane processes, adsorption with activated carbon oxidation, and reduction [5]. However, these techniques result in the generation of secondary pollutants, incomplete removal of metal ions, high operational cost, low selectivity, high consumption of reagents and energy [6]. Furthermore, it has been reported that some of these techniques are generally incapable of meeting the discharged standard limits for the concentration of heavy metals, with results in the range of 0.1–3 mg/L [7]. Biosorption of metals to the surface of an adsorbent involves the mechanism of either physical binding (electrostatic or Van der Waals forces) or chemical linkage (covalent or ionic bonding) between the adsorbate and adsorbent. Biosorption is more economical and less effective for health than many of the latest techniques, which is why it has become a focus of attention among researchers [8]. The phenomenon of biosorption depends on the metal and properties of the cell surface. Several researchers have reported the functional groups of biomasses and revealed biosorption mechanisms, including biosorption of metals. The significance of group present in biosorbent for a certain pollutant depends on different factors such as several active sites, the chemical state of those sites, and affinity between sites. Adsorbents must have accessible sites, strong binding with the pollutant, large surface area, and a porous structure to remove contaminants in little time [9]. Many agricultural waste-based adsorbents have been found useful in removing heavy metals from industrial wastewater, such as orange peel [9,10,11], almond shell [12], chestnut [13], corncobs [14], sugarcane bagasse [15], pomegranate peel [16], peanut shell [17], apricot stone [18], and many others. In this study, we used a 1:1 mixture of banana and potato peels for adsorption of selective heavy metals on a batch scale from wastewater, because these peels are excessively available from local households, canteens, and juice shops. Many active functional groups are present in banana and potato peels; hence, they are effective for the biosorption of heavy metals.
Potato (Solanum tuberosum) peels contain vitamins, starch, nonstarch polysaccharides, protein, acid-soluble/insoluble lignin, lipids, and ash. They have been reported as adsorbents for removal of Cu(II) and Cr(VI) [19]; As3+ and Pb2+ [20]; and Ni(II), Cu(II), Co(II), Cd(II), Fe(II), La(III), and Pb(II) [21]. Banana (Musa acuminate) peels have an affinity for heavy metal adsorption because of various potential groups such as amino, alkoxy hydroxyl, and carbonyl groups [22] Peels of banana have been reported as adsorbents for Cr(VI) ions [23], Pb(II) [24], Cd(II) [25], Fe(II) ions [26], and Cr(VI) and Mn(II) [27]. In the present research, a mixture of both banana and potato peels was used for adsorption of Pb(II) on the batch scale, and different operational parameters were investigated.
Biochar is a material that contains an abundant amount of carbon and is gained from biomass. It is interesting because it has availability in excess, wide surface area, a large amount of functional groups present on the surface area, a possible conversion process, and ecofriendly behavior [28]. Synthesis of functional biochar of enhanced surface characteristics has drawn great attention but is a great challenge for the development of adsorption processes. Two main factors that greatly affect biochar’s surface properties are biomass type and carbonization [29]. In the present study, banana peel and potato peel were used as agrowaste that was further pyrolyzed into biochar.
Nanotechnologies are a group of methods for treating matter; their main focus is to obtain materials with enhanced characteristics. Nanoparticles play an essential role in many applications. In particular, there have been many studies related to nanoparticles of titanium dioxide. Titanium dioxide nanoparticles have been synthesized and studied since the 20th century. They have been considered for uses including air purification, and specifically the reduction of sulfur oxides, nitrogen oxides, carbon monoxide, aromatic hydrocarbons and polycondensed aromatic hydrocarbons, and volatile organic compounds emitted from plasters and paints in adjacent environments [30].
Nanocomposite materials have an exceptionally large surface-to-volume ratio because of their nanosize and the activity of their surfaces. By charging nanoparticles to the appropriate matrix, the properties of the obtained polymer nanocomposites are improved, e.g., thermal stability, mechanical properties, and electrical conductivity [31,32]. Therefore, nanomaterials have played a supporting role in improving the mechanical properties of barrier food packaging materials and developing structures for active and smart packaging applications. Bionanocomposites are a particular type of material distinguished by having one very fine dimension of at most a few nanometers. Moreover, nanocomposites have gained a great deal of attention in engineering and polymer science [33].
The present work aimed to compare the adsorption capacity (mg/g) of mixed biomass of potato peel and banana peel, the biochar of the prepared biomass, and TiO2/agrowaste-based biochar nanocomposites (which were made by using Psidium guajava leaf extract for preparation of nanoparticles and potato and banana peel as a matrix) and investigate the factors affecting adsorption capacity.
Parameters including contact time, pH, initial concentration, and adsorbent dosage were studied. The kinetic data and equilibrium of biosorption were tested using isotherm models (Langmuir and Freundlich) and two kinetic models (pseudo-first-order and pseudo-second-order).

2. Material and Methods

2.1. Pollutant

The synthetic polluted solutions of desired concentrations of Pb(II) were prepared by dissolving Pb(NO3)2 in deionized water. The reagents used were of analytical grade. A total of 1.5984 g of Pb(NO3)2 was dissolved in 1000 mL of deionized water to give a concentration of 1000 mg/L of Pb2+ ion in solution. From the 1000 mg/L stock solution, 10 mL was diluted to 100 mL, which gave a 100 mg/L (100 ppm) working solution. Experimental solutions of desired concentrations were then obtained by successive dilutions. The initial pH measurements were conducted with a pH instrument and were calibrated using buffer solutions with known pH values. The pH of the synthetic contaminated water was modified by the addition of dilute NaOH and HCl solutions.

2.2. Biosorbent

Three biosorbents were made for comparative study.
Peels of Musa acuminata and Solanum tuberosum were collected from a local market and household waste. They were washed properly and rinsed with deionized water to remove all dust particles and then dried in sunlight for a week. The dried peels were then ground to fine powder, and the agrowaste was further ground to a particle size of ~0.5 mm. The resulting particles were stored in hermetic plastic bags for further use [34].
Prepared biomass was pyrolyzed at 550 °C for 2 h at a heating rate of 2 °C min−1 [35]
To prepare TiO2 nanocomposites, first, titanium dioxide nanoparticles were prepared by a green synthesis method using titanium tetraisopropoxide (TTIP) and extract of guava leaves [36]. Fifty milligrams of biochar was sonicated with ethanol, and then titanium dioxide nanoparticles were added into the dispersed biochar. The developed dispersed mixture was ultrasonicated for 3 h, followed by drying at moderate conditions to remove the solvent. After drying, the prepared nanocomposite was deposited on a petri dish and subjected to microwave irradiation for 2 min to give better exfoliation [37].

3. Characterization of Adsorbent

The surface functional groups on the biosorbent sample were identified by FT-IR spectrophotometry, while SEM was used to identify the surface morphology and X-ray diffraction (XRD) was used to determine the crystalline structure and orientation of the biosorbent.

3.1. FT-IR Spectroscopy

The molecular fingerprint of the materials was examined through Fourier transform infrared spectroscopy, which allows close examination of a sample’s chemical composition.

3.1.1. FT-IR Analysis of TiO2 NPs

FT-IR spectra of TiO2 are shown in Figure 1a. Peaks were present at 498 to 550 cm−1; these peaks correspond to O-Ti-O and Ti-O bending vibrations and are present in the fingerprint region of the spectra. No peaks were observed in the functional group because there was no functional group present in the prepared sample. A broad peak present at 1621.69 cm−1 showed a Ti-OH stretching vibration [38].

3.1.2. FT-IR Analysis of Biochar

Spectra shown in Figure 1b confirmed the presence of abundant surface functional groups such as carboxyl and hydroxyl, which greatly enhanced the adsorption performance. A conjugated (Hibbert’s) ketone C=O band at 1699 cm−1 might have been derived from lignin demethylation of an aromatic methoxy group. The absorption bands at 1704–1612 cm−1 were assigned to C–O/C=O stretching vibrations of aromatic rings of lignin, while those at 2925–1375 cm−1 were assigned to the bending vibration of CH3 and CH2 [39,40].

3.1.3. FT-IR Analysis of TiO2 NCs

After combining biochar with TiO2 NPs, an increase in the relative peak intensity at about 512.32 cm−1 was observed for TiO2 NCs, which is often used for confirmation of vibrations of Ti-O. The bands at 2925–1375 cm−1 correspond to the bending vibration of CH3 and CH2. Spectra are shown in Figure 1c.

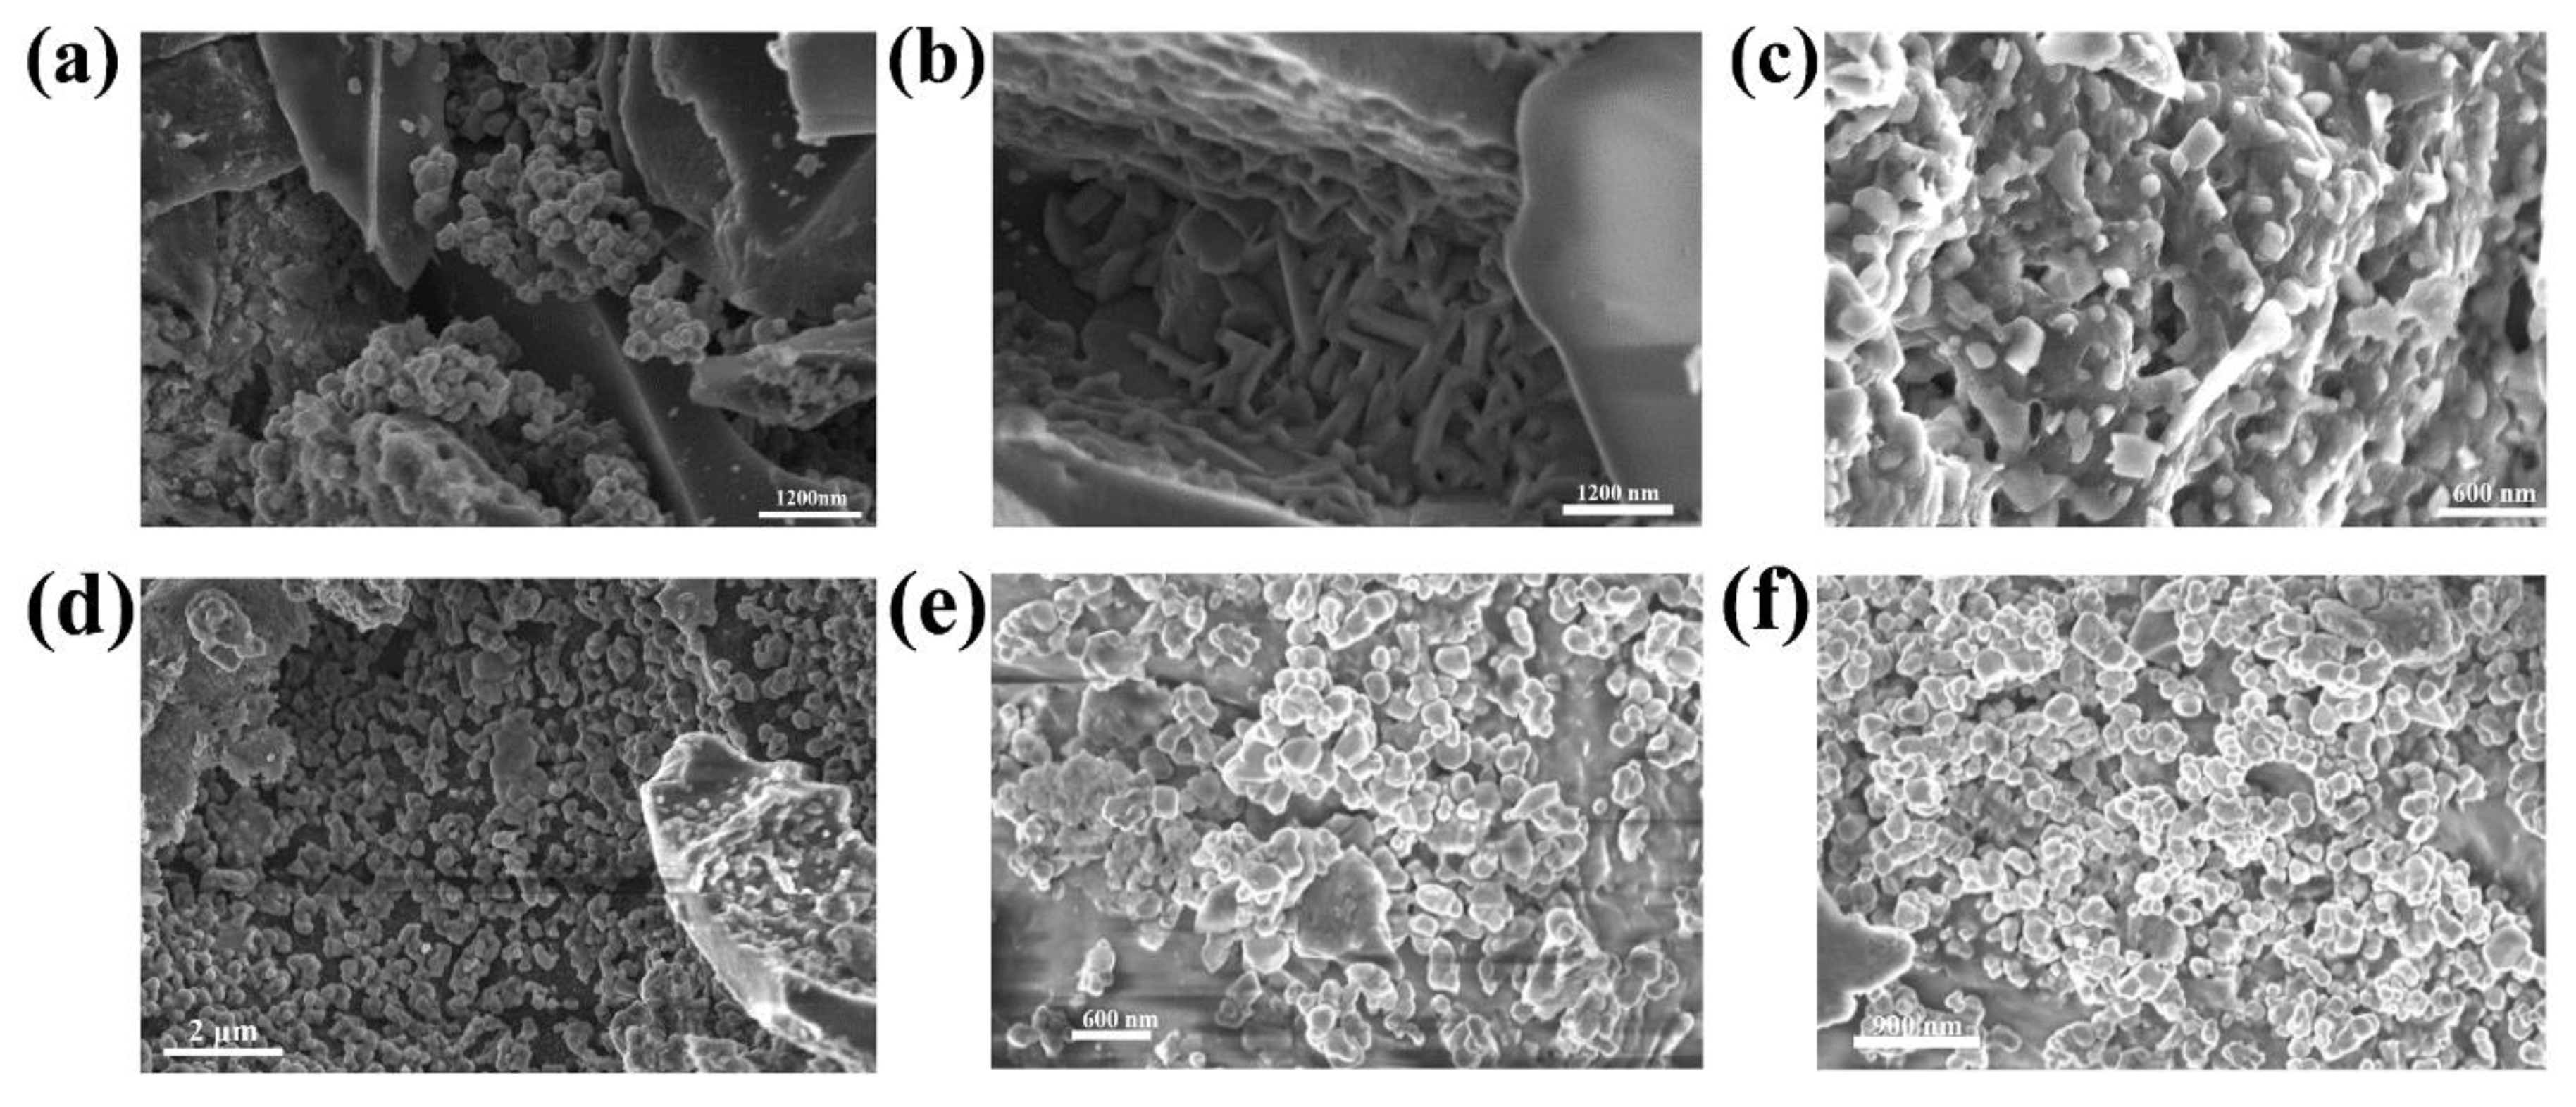
3.2. Scanning Electron Microscopy (SEM) Analysis

Biocomposites are particularly sensitive to imaging techniques that are carried out to describe them, as they are deformable and sensitive materials. SEM micrographs of bare and lead-loaded mixed biomass, biochar, and TiO2 NC are shown in Figure 2. Figure 2a–c shows the bulky and smooth morphology of the bare biosorbents. However, Figure 2d–f indicates the presence of fine spherical nanostructures. By the simple comparison of the SEM images of the loaded and unloaded biosorbents, it is clearly shown that Pb(II) was adsorbed on the surface of biosorbents.

3.3. XRD Analysis of TiO2 NP

The results of X-ray diffraction of TiO2 NP are given in Figure 3. Strong diffraction peaks were present at 2theta values of 25.19°, 36.82°, 37.65°, 38.44°, 47.92°, 53.73°, 54.93°, and 61.96°; they were associated with planes (011), (013), (004), (112), (020), (015), (121), and (024). These peaks are characteristic of TiO2.The X-ray diffraction pattern at 25.19° and 36.82° indicated that all peaks observed for TiO2 were under the standard spectrum (JCPDS no.: 88-1175 and 84-1286). This diffraction pattern shows that diffraction peak intensity increased with increasing particle size [41]. The average particle size was calculated by using the Scherrer formula, which is given as:
D = K λ β cos θ
where K is a constant, λ is the wavelength of radiation, and β is the full-width half maximum. The average particle size of TiO2 was found to be 11.73 nm. The lattice parameters were a = 3.78 Å and c = 9.53 Å, and the system was tetragonal. The XRD pattern of TiO2 NPs is shown in Figure 3.

3.4. UV Analysis of TiO2 Nanoparticles (TiO2 NP)

Synthesis of nanoparticles was confirmed by a UV/visible spectroscopy peak of maximum absorption observed between 290 and 310 nm. A maximum adsorption peak was observed at 295 nm. The results agreed with already reported literature, where the peak was observed at 310 nm [42]. The UV spectrum is shown in Figure 4.

4. Results and Discussion

A batch adsorption experiment was conducted to optimize the parameters. The efficiency of lead removal was examined by different parameters. The amount of lead removal was calculated using the following formula:
q = ( C i C e ) v C i × m
where Ci and Ce are the lead concentrations (mg/L) initially and at a given time, V is the volume of solution (L), and m is the mass of the adsorbent (g).

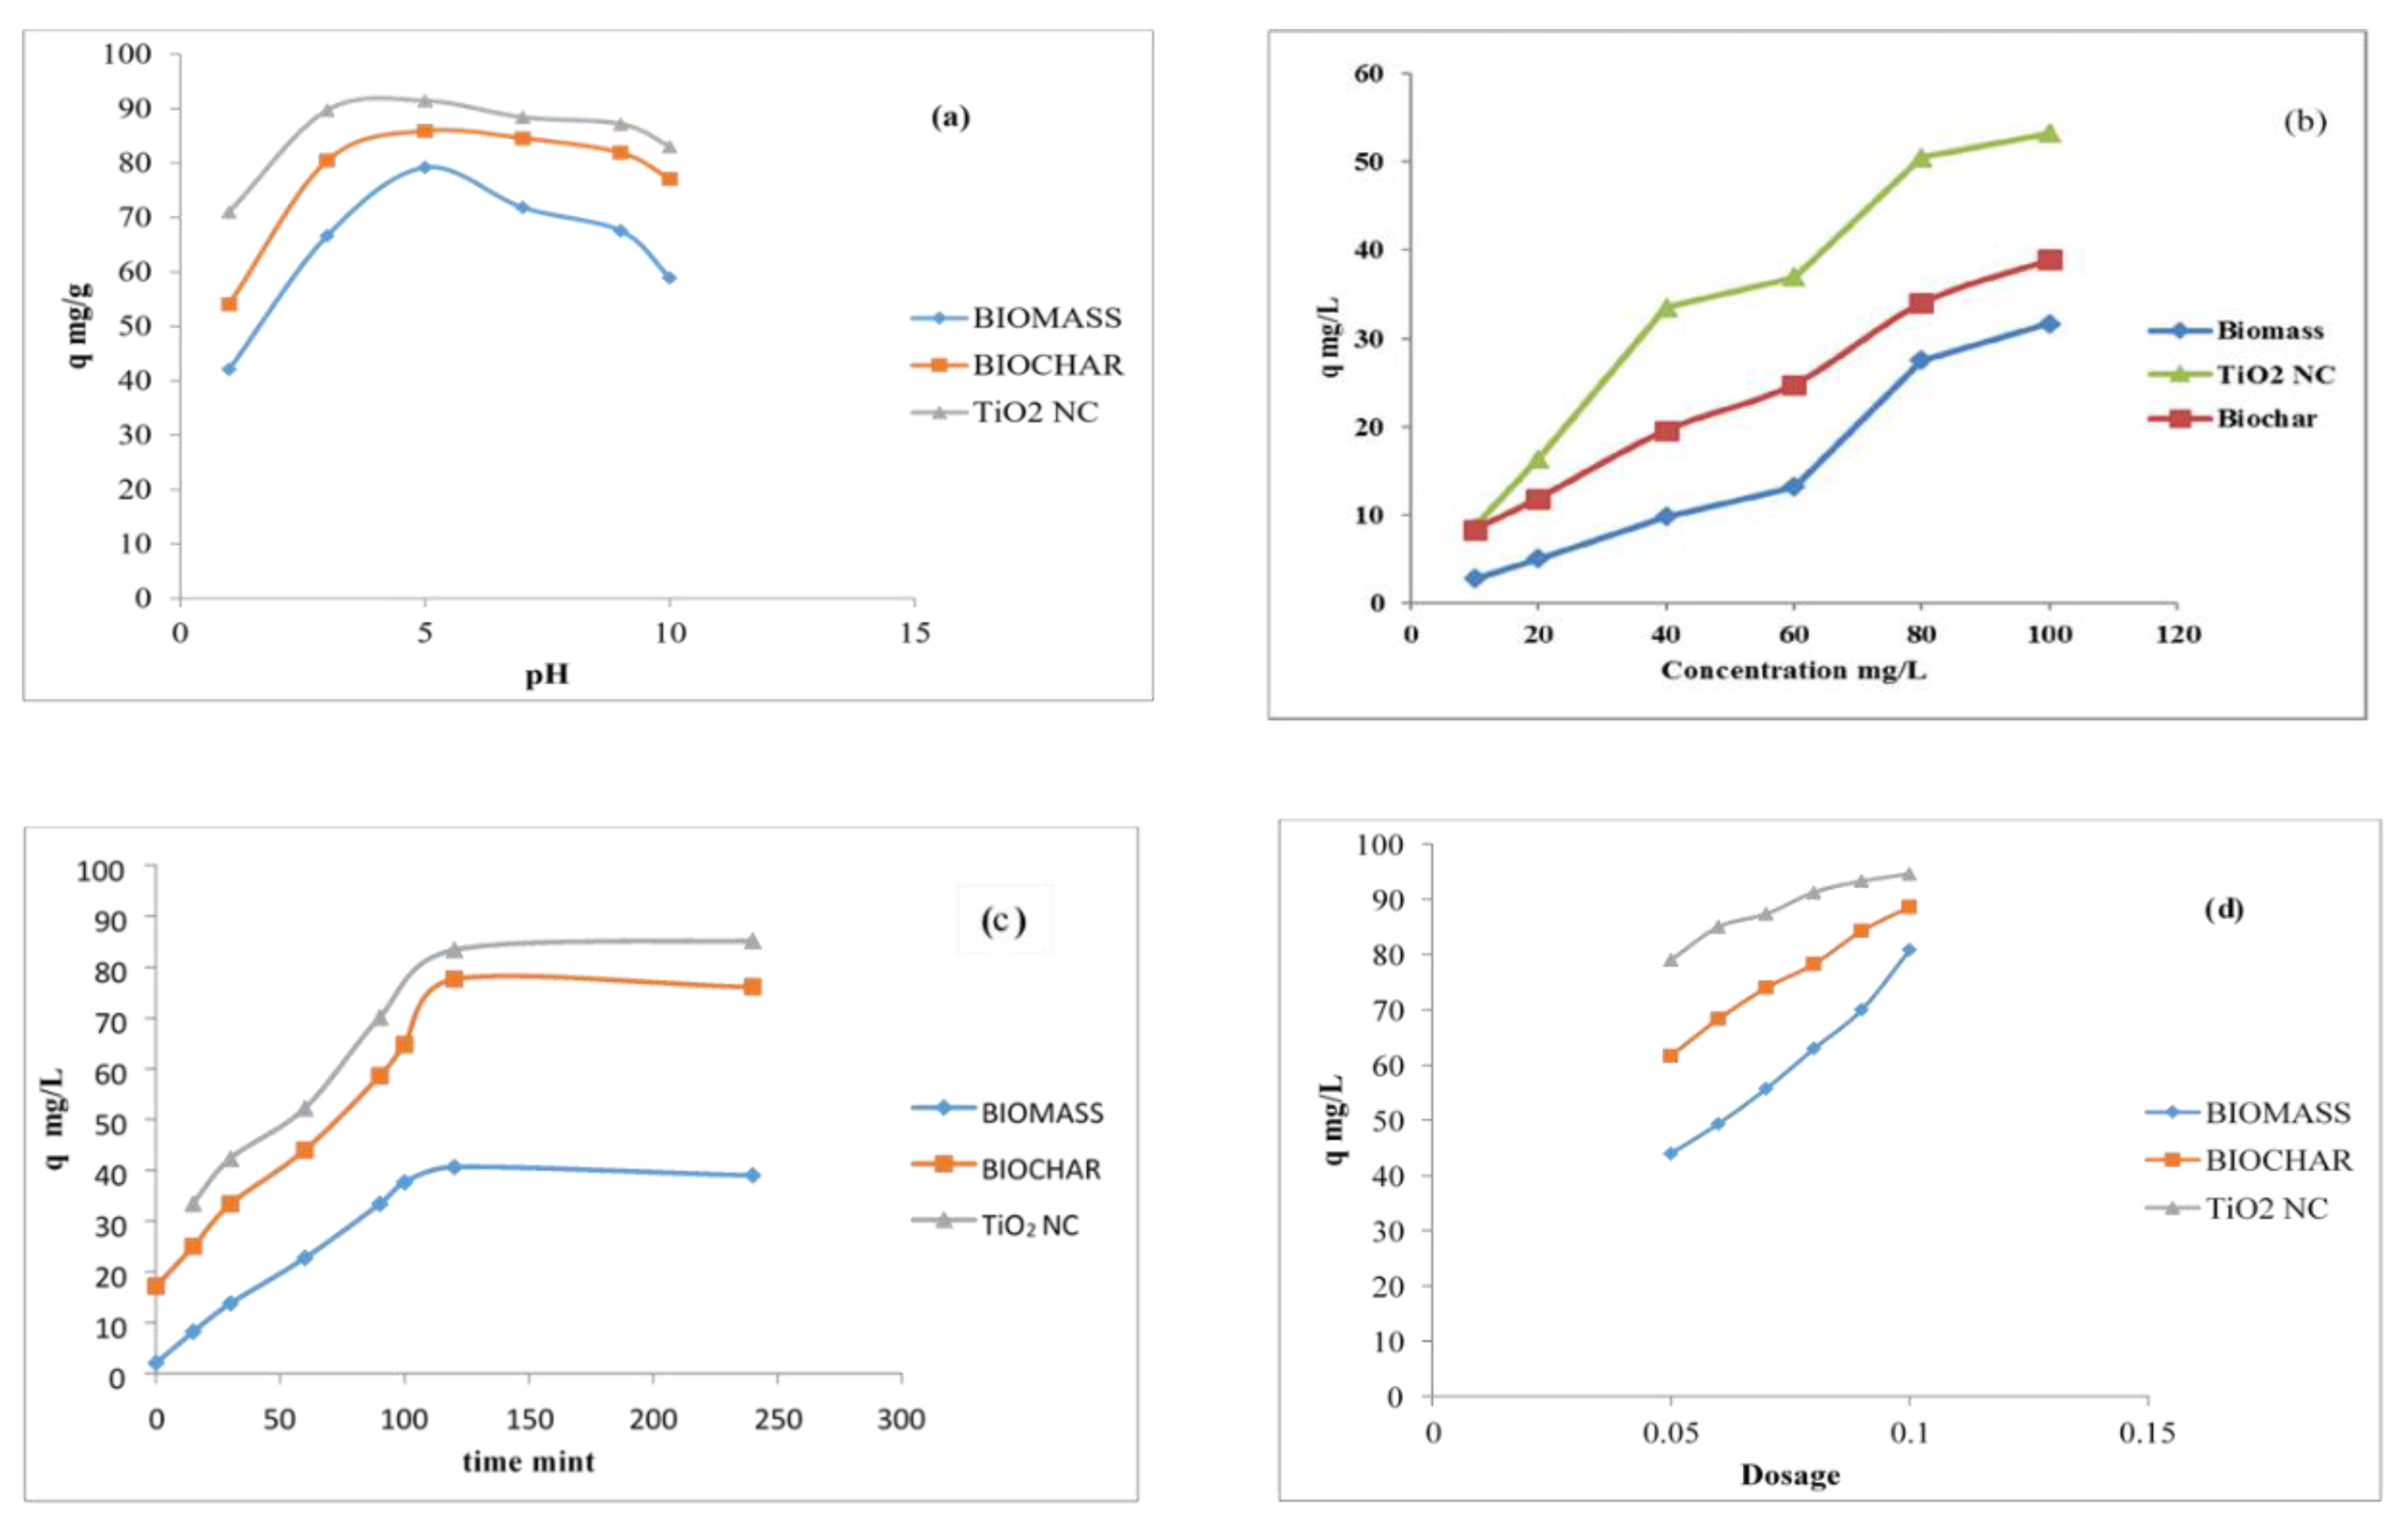
4.1. Effect of pH on Lead Adsorption

pH affects the process of adsorption; indeed, it is the most important parameter. Adsorption varies because of change in the pH of a solution. This variation in adsorption results in variation of uptake capacity of lead, as the pH of the solution may affect the functional groups present on the surface of adsorbents. Charges on the surface of adsorbents were regulated by the pH of the solution through deprotonation and protonation of functional groups present on the surface.
In the solution, removal efficiency generally decreased as pH increased, and maximum removal efficiency for lead was observed at a pH of 5. Said maximum removal efficiency of lead was observed to be 91.4634 mg/g with TiO2 NCs. The maximum uptake in mg/g of lead for each adsorbent was as follows: 91.4634 (TiO2 NCs) ˃ 85.9146 (biochar) ˃ 79.2073 (biomass).
Different adsorbents showed a comparable binding pattern for lead. The adsorbent surface became negatively charged. This was responsible for electrostatic interaction between the adsorbent surface and the metals, which resulted in efficient removal of heavy metals.
The effect of pH on the adsorption of lead by biomass of banana peel and potato peel, biochar, and TiO2 NCs was investigated. The pH range of 1.0–10 was studied to evaluate the optimum pH, while other variables were kept constant (amount of adsorbent = 0.1 g, temperature = 35 °C, shaking speed = 120 rpm, and concentration = 100 ppm). The effect of pH on adsorption of lead by using biomass, biochar, and TiO2 NC is shown in Figure 5a.

4.2. Effect of Initial Concentration on Lead Adsorption

Initial concentration is responsible for overcoming all barriers for mass transfer of particles between the solid and liquid phases. The effect of initial concentration on adsorption for the elimination of lead from liquid solution was evaluated in this study using different adsorbents. The solution concentration of lead was varied from 10 to 100 ppm. A pH of 5 was maintained for lead solution. Adsorbent dosage was 0.1 g. The results illustrated that the percentage of lead removed decreased as initial concentration increased [43]. As the amount of adsorbent was the same, the competition was negligible at low concentrations but became prominent with the increase in concentration of adsorbate molecules. In simple words, the number of adsorption sites was limited at high solution concentrations, which hindered the further uptake, and hence, diffusion, and with it the percentage of lead removed, decreased.
The maximum removal efficiency of lead, 90.742 mg/g, was observed at 10 ppm with TiO2 NCs. The maximum uptake in mg/g of lead at 10 ppm for each adsorbent was as follows: 90.742 (TiO2 NCs) ˃ 83.2797 (biochar) ˃ 73.578 (biomass). It was demonstrated that percentage of removal increased with the decrease in initial concentration. This pattern might be due to the reason that at low initial concentration, there was a large number of active sites and adsorbate molecules that bound lead ions independently, and so the process of adsorption was fast. However, when the concentration was high, there were fewer binder sites as compared to the number of adsorbate molecules. The process of adsorption depends on the active sites present on the surface of the adsorbent. There was a limited number of active sites for the adsorption of lead on each adsorbate; the active sites became saturated at a certain concentration, and hence the percentage of removal decreased once concentration increased to the saturation point and there were no more active sites for the loading of heavy metals [44]. The effect of initial concentration on the adsorption of lead with biomass, biochar, and TiO2 NCs is shown in Figure 5b.

4.3. Effect of Contact Time on Lead Adsorption

Contact time is a vital factor in the process of adsorption. Over time, more interaction occurs between adsorbent and adsorbate molecules, and so the adsorption rate is increased. In the present work, the effect of contact time on the adsorption of lead with comparable biosorbents was studied with a distinct time interval over a range from 15 to 120 min. The concentration of heavy metals solution was kept at 100 ppm. The percentage of lead removed increased as time increased until equilibrium was achieved. Different studies have revealed that most of heavy metals are removed by the adsorption process within two hours, as equilibrium is attained at 120 min.
At the start of the process, there was a higher concentration gradient between the biosorbents and lead ions that sped up the process. When the adsorption process started, a large number of binding sites were available. As time passed, functional groups present on the surface of the adsorbent took part in process of adsorption of heavy metals until equilibrium was achieved. The percentage of removal increased with an increase in contact time but becomes constant after attaining equilibrium. After equilibrium, the adsorption process may slow down because of the contribution of other processes, e.g., complexation, saturation of binding sites, and microprecipitation. As equilibrium was achieved, no more lead ions were further adsorbed by increasing contact time because there were no vacant sites available. Therefore, contact time for the adsorption process was optimized. The adsorption process was rapid within the first 2 h because of the availability of empty adsorption sites at the initial stage. As time passed, adsorption sites became saturated, and equilibrium was attained.
The uptake of both adsorbates increased rapidly at the beginning. The maximum adsorption capacity of more than 80% was achieved within 2 h. This behavior may have been due to the large number of vacant sites available at the beginning. Adsorption then slowed down until the attainment of equilibrium [45]. The effect of contact time on adsorption of lead by using biomass, biochar, and TiO2 NCs is shown in Figure 5c. The maximum uptake in mg/g of lead for each adsorbent was as follows: 89.2621 (TiO2 NCs) ˃ 83.8276 (biochar) ˃ 78.963 (biomass).

4.4. Effect of Adsorbent Dosage on Lead Adsorption

Lead adsorption efficiency as a function of adsorbent dosage was studied. The adsorbent dosage was kept in between 0.05 and 0.1 g, while other studied parameters (pH, contact time, and initial ion concentration) were kept optimum, the temperature was maintained at 25 °C, and the agitation speed was kept at 200 rpm. The removal efficiency increased as the dosage of biosorbents was increased. This was expected, because more binding sites were available for lead ions when the dose of biosorbents was high. These observations described that lead adsorption in the wastewater is related to available binding sites. Adsorbents with more surface area were more efficient for removing lead, as they had more binding sites. Moreover, at precise adsorbent dosage, an adsorption peak was seen.
It was observed that the percentage of lead removed increased with the dosage of absorbent. Maximum removal was achieved when 0.1 g of absorbent was used for adsorption in 100 ppm solution of lead. The mechanism of composite adsorption may be due to Van der Waals forces between the surface of the adsorbent and the heavy metals or to electrostatic attraction between the charged surface of the adsorbent and the heavy metals.
The maximum removal efficiency of lead was observed at 93.506 mg/g with TiO2 NCs. Maximum uptake in mg/g of lead for each adsorbent was as follows: 93.506 (TiO2 NCs) ˃ 88.621 (biochar) ˃ 80.876 (biomass).
The effect of adsorbent dosage on the adsorption of lead by using biomass, biochar, and TiO2 NCs is shown in Figure 5d.

5. Comparison among Different Adsorbents

The efficiency of the three adsorbents at removing lead from liquid solution was shown in the order of TiO2 NCs > biochar > biomass. A comparison of the uptake capacity of the three adsorbents is shown in Figure 6.
The uptake capacity of prepared biosorbents can also be compared with some reported biosorbents from the literature. A list of some reported agrowaste with the potential to be applied as biosorbents to remove heavy metals from aqueous solutions is presented in Table 1 that can also be compared with the results of the present work.

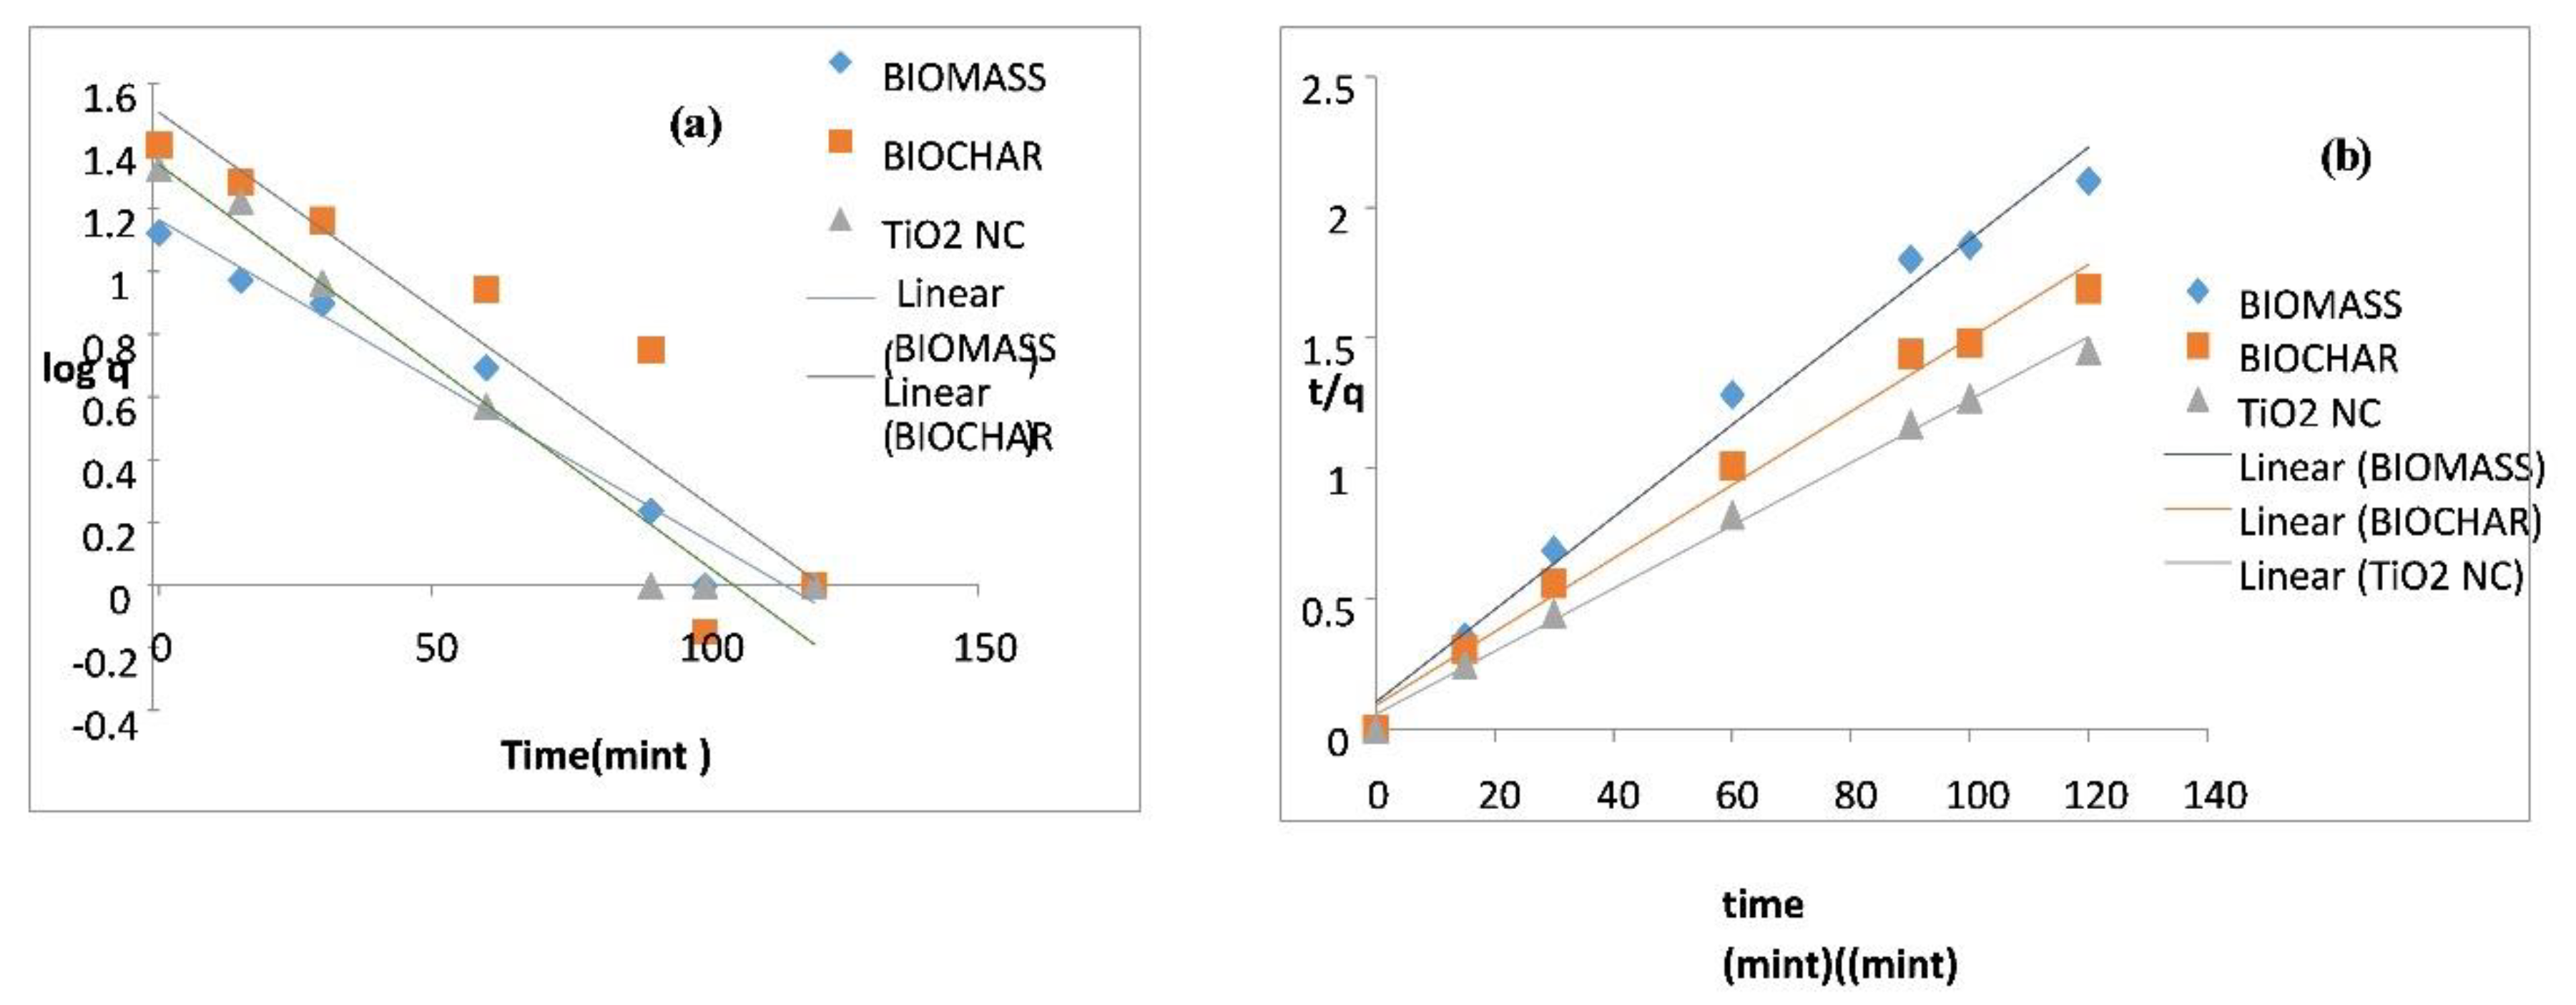
6. Adsorption Kinetics

To evaluate the potential rate-controlling step and kinetic mechanism of Pb(II) biosorption on biomass, biochar, and TiO2 nanocomposites, the pseudo-first-order equation of Laguerre and pseudo-second-order equation of Ho and McKay [54] were investigated. The pseudo-first-order model depends only on the several adsorbate molecules present in an aqueous solution at a definite time. However, the pseudo-second-order model describes that lead ions are present in said aqueous solution as well as the many free active sites present on the surface of the adsorbent.

6.1. Pseudo-First-Order Model

The equation of the pseudo-first-order regression model for adsorption was stated as follows:
log ( q e q t ) = log ( q e ) ( k 1 0.2303 ) t
where qe (mg/g) is the amount of lead; qt (mg/g) is the amount of lead that is adsorbed on the biomass at equilibrium state, t is the time to achieve equilibrium, and k1 (min−1) represents the rate constant for the pseudo-first-order reaction equation. The pseudo-first-order regression model presumes that the rate of adsorption and the unoccupied sites of lead are proportional to each other. The intercept and slopes of the plot of the graph between the values of log(qe − q) time(t) were used for the calculation of the pseudo-first-order rate constant k1 and the capacity for the equilibrium adsorption. On comparison between the pseudo-first-order and pseudo-second-order models, it was found that the value of R2 for the former was less than that of the latter, so the pseudo-first-order model was not well fitted.
Relatively lower R2 values were obtained for the pseudo-first-order model for lead: 0.9638 for biomass, 0.8477 for biochar, and 0.961 for nanocomposite. The theoretically calculated qe (mg/g) did not agree well with experimentally calculated qexp. The value of the correlation coefficient was lower than 1 and most often equal to 0.8. This proved that it was not precise to use this model to conclude the adsorption kinetics of lead by the adsorbents biomass, biochar, and TiO2 nanocomposite.

6.2. Pseudo-Second-Order Model

The data of adsorption kinetics were again studied by a pseudo-second-order kinetic model, which presumes that sorption rate depends on adsorption capacity, i.e., that the square of the unoccupied sites is proportional to the sorption rate. It is shown as:
t q = 1 k 2 q e 2 + t q e
where k2 is the equilibrium rate constant (g/mg/min). The slopes and intercepts of plots of t/q versus t were used to calculate the pseudo-second-order rate constant k2 and qe.
Comparison between the pseudo-first- and -second regression models in regard to the kinetic parameters revealed that lead adsorption on the biomass of potato peel and banana peel, biochar, and TiO2 nanocomposites was better fitted with pseudo-second-order kinetics than pseudo-first-order. The qe value obtained from the pseudo-second-order model was close to conformation with the experimental data, while the value of qe evaluated from contrasting kinetic models did not comply with the experimental value. This shows that the pseudo-first-order model was not satisfactory to explain the mechanism of Pb(II) biosorption. Evaluation of kinetic data showed that R2 values for the pseudo-first- and -second-order models were high (>0.96) but qcal did not match qexp to a great extent [55]. Comparison of the values obtained from psudo first order and pseudo second order given in Table 2 and their graphical representation is in Figure 7a,b.

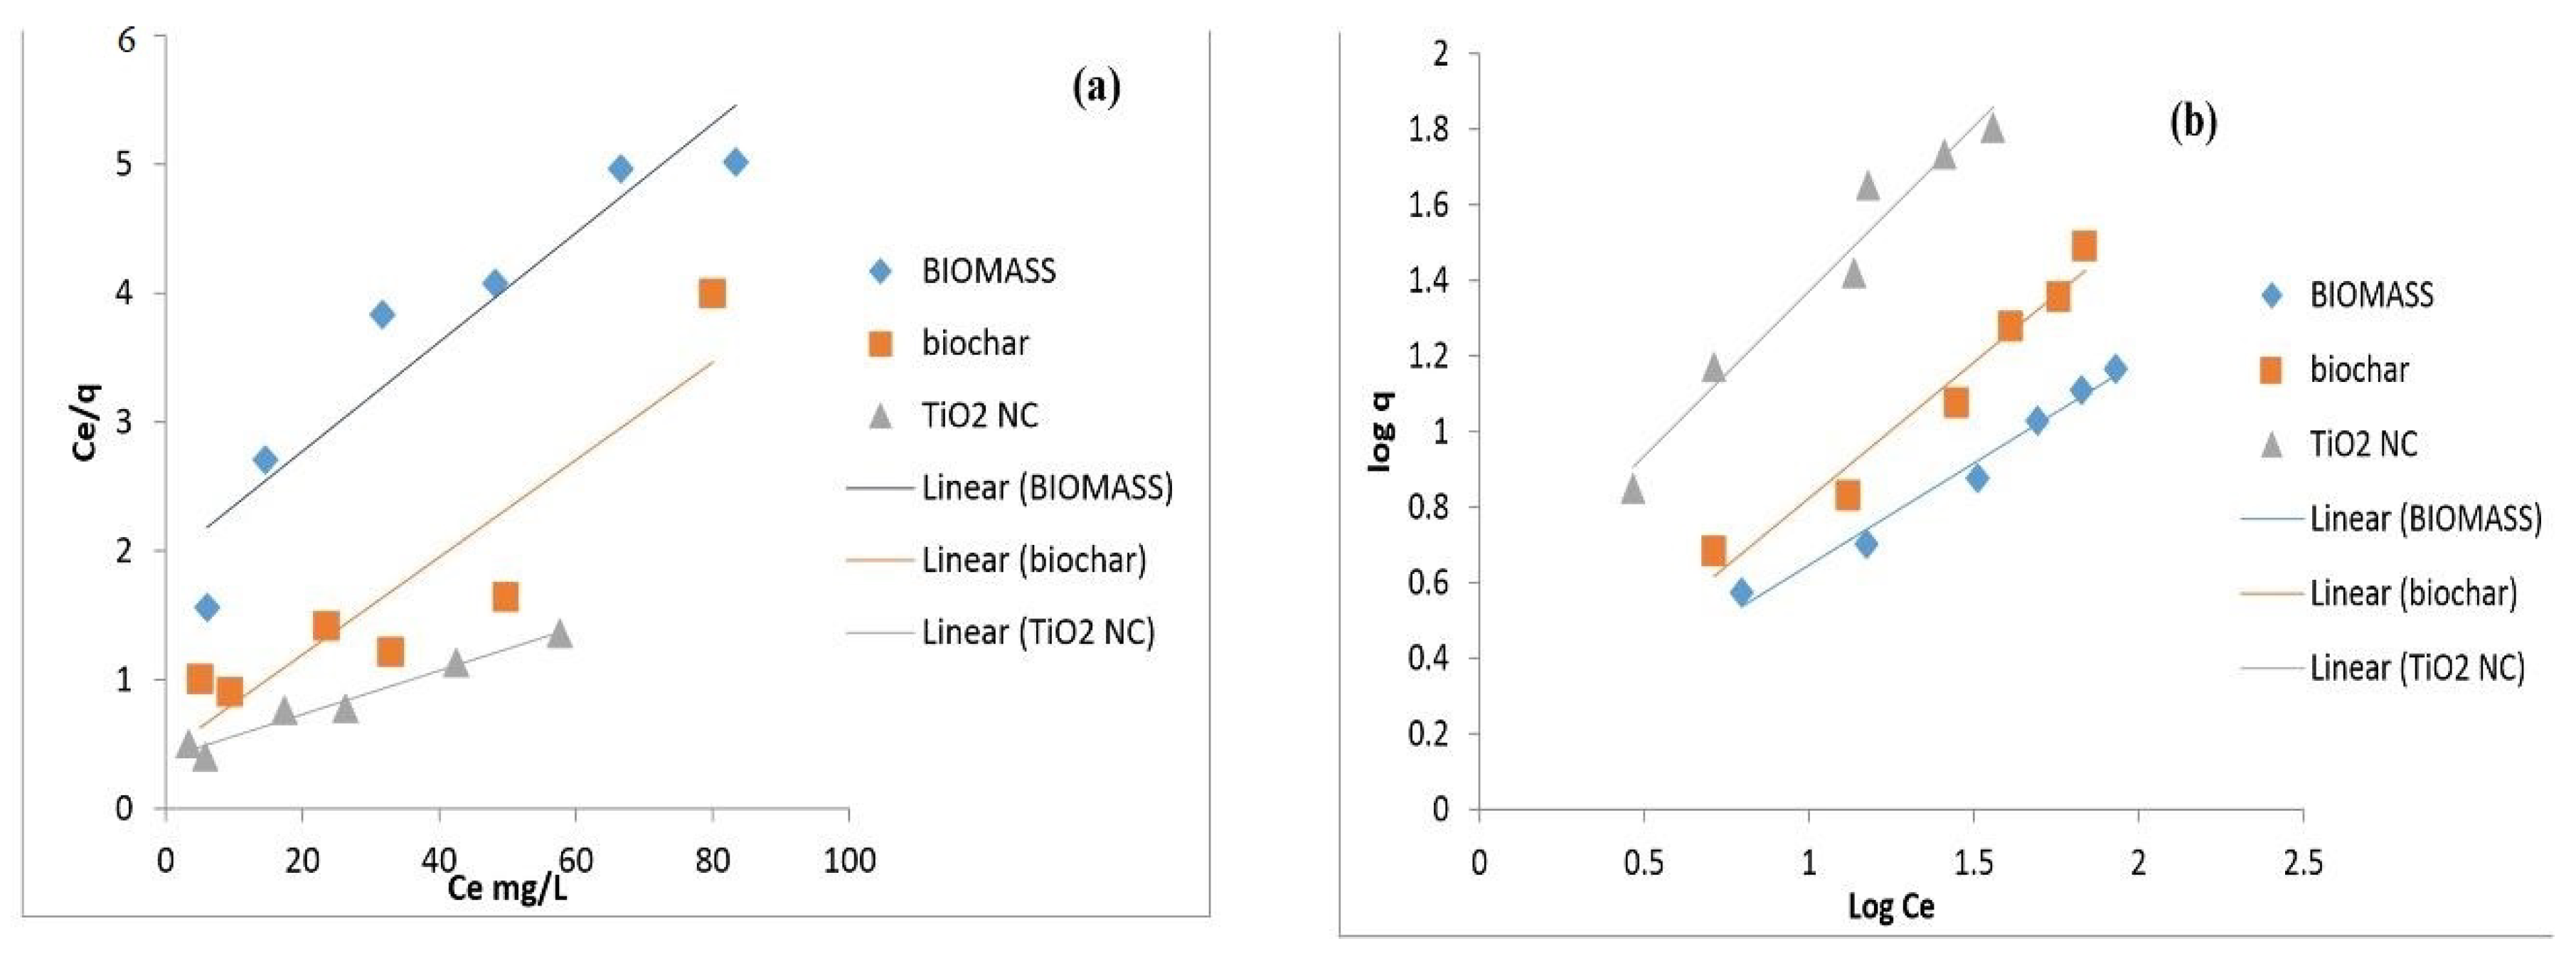
7. Equilibrium Modelling

The adsorption isotherms of lead from concentrations of 10 to 100 ppm were studied with a fixed pH of 5 and an adsorbent dose of 0.1 g. Freundlich and Langmuir adsorption isotherms were used to define the relationship between the adsorbent and adsorbate molecules in aqueous solution. When there was a changing balance in adsorbate concentration in a large volume of solution with that of boundary, sorption equilibrium was established. To develop the equilibrium data, the primary concentration of lead changed. The quantity of adsorbent was kept constant. To obtain equilibrium data, the initial concentration of lead was changed, whereas the number of biosorbents was kept constant. A contact time of 24 h was used to ensure the equilibrium condition of sorption.

7.1. Langmuir Isotherm

Generally, the Langmuir isotherm equation is written as:
C i q e = 1 q m a x + 1 b   q m a x C e
where
Ce is equilibrium concentration, qe is equilibrium adsorption capacity, b is slope, and 1/qmax is the intercept obtained from the regression equation.
The Langmuir isotherm revealed that the surfaces of the biosorbent and lead had equal sites with the same energy. According to this model, adsorbate molecules do not interact with each other, only with the site. Adsorption is restricted to a monolayer. It is assumed that once a lead ion adsorbs with a site, no more adsorption occurs, and when equilibrium is achieved, a monolayer appears [56].
The linear equation of the Langmuir isotherm is written as:
C e q e = 1 X m K L + C e X m
where
Ce is equilibrium concentration, qe is the amount of lead adsorbed at equilibrium, and
Xm and KL are Langmuir constants obtained by using the linearized Langmuir equation and Langmuir parameters. A comparison of linear plot of the Langmuir isotherm model and Freundlich model for adsorption of lead is presented in Figure 8 which represents a plot of Ce/qe (g/L) versus Ce (mg/L) under various concentrations of lead sorption by biomass, biochar, and TiO2 nanocomposites. Most of the points on this graph were out of linearity. The obtained R2 values were 0.9016 for biomass, 0.5188 for biochar, and 0.6641 for nanocomposite for lead. The R2 values obtained with the Freundlich model were greater than those obtained with the Langmuir model, which suggests the nonapplicability of this model in interpreting sorption equilibrium data [57].

7.2. Freundlich Isotherm

The Freundlich isotherm equation is generally written as:
Qe = K Ce 1/n
It presumes monolayer adsorption distribution of active sites that are energetically heterogeneous, followed by interaction between biosorbents and adsorbed lead. The Freundlich isotherm equation is a mathematical expression that describes the adsorption of solute from an adsorbate solution to an adsorbent [58].
The linear equation for the Freundlich isotherm is
Log qe = log Kf + (1/n) log Ce
where
qe (mg/g) is the quantity of lead adsorbed by specified amount of adsorbent at equilibrium, Ce (mg/L) is the equilibrium concentration, Kf is the intercept constant obtained from the regression equation, and 1/n = the slope constant obtained from the regression equation [59]. Compared to the Langmuir isotherm plot, this showed more linearity. The Freundlich model is better equipped to model lead sorption on the studied adsorbents than the Langmuir model.The value of R2 was near to unity in Freundlich model (0.9795 for biomass, 0.9592 for biochar, and 0.958 for TiO2 nanocomposite), which was a result of the higher correlation coefficient displayed by this model. The Freundlich isotherm was thus proven to be the best suited, and the equilibrium sorption information was well interpreted. Comparison of the values obtained Langmuir and Freundlich model is given in Table 3.

8. Conclusions

In the present research work, the adsorption efficiency of biomass, biochar, and biochar-based TiO2 nanocomposites for lead was compared. Among these, the synthesized novel nanocomposites proved very effective for the removal of heavy metals. In the present research, potato peel and banana peel were dried and then ground to make biomass. The prepared biomass was then pyrolyzed to make biochar. Leaves of Psidium guajava were utilized to prepare TiO2 nanoparticles by using titanium precursors. The prepared biochar was then sonicated with the TiO2 NPs to make nanocomposites for better adsorption of heavy metals. Several parameters, such as initial concentration of heavy metals, pH, contact time, and dosage rate, were optimized. The percentage of removal of heavy metals was investigated. The maximum removal of lead was at pH 5. Lead removal decreased when lead concentration was increased, while it increased as dosage rate and contact time were increased. Uptake capacity of heavy metals from aqueous solution was in order of biomass ˂ biochar ˂ TiO2 nanocomposites. Among them, the NCs were confirmed to have the maximum uptake capacity. The Freundlich model better explained the adsorption process of heavy metals as compared to the Langmuir model, as R2 for the Freundlich isotherm was higher than that for the Langmuir isotherm.

Author Contributions

Conceptualization, A.A.; methodology, A.A., R.N. and M.N.; validation, A.A., R.N., M.A., U.R. and M.N.; formal analysis, A.A., A.H., N.J. and Z.A. (Zeeshan Ashfaq); investigation, A.A., S.B. and M.A.; resources, N.J. and Z.A. (Zeeshan Ashfaq); data curation, Z.A. (Zeeshan Ashfaq) and Z.A. (Zubair Ahmed); writing—original draft preparation, A.A.; visualization, R.N.; supervision, A.A. and R.N.; funding acquisition, R.N., S.B., U.R. and A.H.; Project administration, R.N., U.R. and Z.A. (Zubair Ahmed) All authors have read and agreed to the published version of the manuscript.

Funding

Higher Education Commission of Pakistan, viz grant #TDF-02-153.

Institutional Review Board Statement

Not applicable.

Informed Consent Statement

Not applicable.

Data Availability Statement

Not applicable.

Acknowledgments

The work was supported by the Technology Development Fund and Higher Education Commission of Pakistan, viz grant #TDF-02-153. The authors would like to thank the TDF and HEC of Pakistan for their support.

Conflicts of Interest

Authors have no conflict of interest.

References

  1. Azimi, A.; Azari, A.; Rezakazemi, M.; Ansarpour, M. Removal of heavy metals from industrial wastewaters: A review. Chem. BioEng. Rev. 2017, 4, 37–59. [Google Scholar] [CrossRef]
  2. Kyzas, G.Z.; Bomis, G.; Kosheleva, R.I.; Efthimiadou, E.K.; Favvas, E.P.; Kostoglou, M.; Mitropoulos, A.C. Nanobubbles effect on heavy metal ions adsorption by activated carbon. Chem. Eng. J. 2019, 356, 91–97. [Google Scholar] [CrossRef]
  3. Dai, Q.H.; Bian, X.Y.; Li, R.; Jiang, C.B.; Ge, J.M.; Li, B.L.; Ou, J. Biosorption of lead(II) from aqueous solution by lactic acid bacteria. Water Sci. Technol. 2019, 79, 627–634. [Google Scholar] [CrossRef]
  4. Davies, K.M.; Mercer, J.F.B.; Chen, N.; Double, K.L. Copper dyshomoeostasis in Parkinson’s disease: Implications for pathogenesis and indications for novel therapeutics. Clin. Sci. 2016, 130, 565–574. [Google Scholar] [CrossRef]
  5. Hashem, M.A.; Momen, M.A.; Hasan, M.; Nur-A-Tomal, M.S.; Sheikh, M.H.R. Chromium removal from tannery wastewater using Syzygium cumini bark adsorbent. Int. J. Environ. Sci. Technol. 2018, 16, 1395–1404. [Google Scholar] [CrossRef]
  6. Crini, G.; Lichtfouse, E.; Wilson, L.D.; Morin-Crini, N. Conventional and non-conventional adsorbents for wastewater treatment. Environ. Chem. Lett. 2018, 17, 195–213. [Google Scholar] [CrossRef]
  7. Wang, B.; Bai, Z.; Jiang, H.; Prinsen, P.; Luque, R.; Zhao, S.; Xuan, J. Selective heavy metal removal and water purification by microfluidically-generated chitosan microspheres: Characteristics, modeling and application. J. Hazard. Mater. 2019, 364, 192–205. [Google Scholar] [CrossRef] [PubMed] [Green Version]
  8. Akhtar, K.; Akhtar, M.W.; Khalid, A.M. Removal and recovery of zirconium from its aqueous solution by Candida tropicalis. J. Hazard. Mater. 2008, 156, 108–117. [Google Scholar] [CrossRef]
  9. Abdi, O.; Kazemi, M. A review study of biosorption of heavy metals and comparison between different biosorbents. J. Mater. Environ. Sci. 2015, 6, 1386–1399. [Google Scholar]
  10. Oyewo, O.A.; Boshielo, A.; Adeniyi, A.; Onyango, M.S. Evaluation of the efficiency of nanoadsorbent derived from orange peels in the removal of cerium from aqueous solution. Part. Sci. Technol. 2021, 39, 43–51. [Google Scholar] [CrossRef]
  11. Sun, J.; Li, X.; Ai, X.; Liu, J.; Yin, Y.; Huang, Y.; Zhou, H.; Huang, K. Efficient removal of cadmium from soil-washing effluents by garlic peel biosorbent. Environ. Sci. Pollut. Res. 2018, 25, 19001–19011. [Google Scholar] [CrossRef]
  12. Pehlivan, E.; Altun, T. Biosorption of chromium (VI) ion from aqueous solutions using walnut, hazelnut and almond shell. J. Hazard. Mater. 2018, 155, 378–384. [Google Scholar] [CrossRef]
  13. Çetinkaya, S.; Targan, Ş.; Tirtom, V.N. Comparative adsorption of Pb (II) and Cd (II) ions on chestnut shell in aqueous system. Chem. Ecol. 2018, 34, 640–654. [Google Scholar] [CrossRef]
  14. Zheng, L.; Peng, D.; Meng, P. Corncob-supported aluminium-manganese binary oxide composite enhanced removal of cadmium ions. Colloids Surf. A Physicochem. Eng. Asp. 2019, 561, 109–119. [Google Scholar] [CrossRef]
  15. Elias, M.M.C.; Ferreira, G.M.D.; Almeida, F.T.R.; MartinsRosa, N.C.; AlmeidaSilva, I.; GonçalvesFilgueiras, J.; Azevedo, E.R.; Silva, L.H.M.; Melo, T.M.S.; FrédéricGil, L.; et al. Synthesis and application of sugarcane bagasse cellulose mixed esters. Part I: Removal of Co2+ and Ni2+ from single spiked aqueous solutions in batch mode using. J. Colloid Interface Sci. 2019, 533, 678–691. [Google Scholar] [CrossRef] [PubMed]
  16. Mohammed, T.; Ibrahim, R.; Naji, A. Experimental investigation and thermodynamic study of heavy metal removal from industrial wastewater using pomegranate peel. MATEC Web Conf. EDP Sci. 2018, 162, 05007. [Google Scholar] [CrossRef]
  17. Chamarthy, S.; Seo, C.W.; Marshall, W.E. Adsorption of selected toxic metals by modified peanut shells. J. Chem. Technol. Biotechnol. 2001, 76, 593–597. [Google Scholar] [CrossRef]
  18. El-Saharty, A.; Mahmoud, S.; Manjood, A.H.; Nassar, A.A.H.; Ahmed, A.M. Effect of apricot stone activated carbon adsorbent on the removal of toxic heavy metals ions from aqueous solutions. Int. J. Ecotoxicol. Ecobiol. 2018, 3, 51–62. [Google Scholar] [CrossRef]
  19. Ahirwar Tech, B.M.; Scholar, R.; Kumar Sharma Professor, A.; Sharma Professor, S.; Bharti Ahirwar Tech, C.M.; Ahirwar, B.; Kumar Sharma, A.; Sharma, S. Impact Factor: 5.2 IJAR. IJAR 2017, 3, 459–462. [Google Scholar]
  20. Sun, Y.; Yang, G.; Zhang, L. Biosorption of heavy metals: A case study using potato peel waste. Desalin. Water Treat. 2017, 83, 159–167. [Google Scholar] [CrossRef]
  21. El-Azazy, M.; El-Shafie, A.; Issa, A.; Al-Sulaiti, M.; Al-Yafie, J.; Shomar, B.; Al-Saad, K. Potato peels as an adsorbent for heavy metals from aqueous solutions: Eco-structuring of a green adsorbent operating Plackett–Burman design. J. Chem. 2019. [Google Scholar] [CrossRef] [Green Version]
  22. Ali, A. Removal of Mn (II) from water using chemically modified banana peels as efficient adsorbent. Environ. Nanotechnol. Monit. Manag. 2017, 7, 57–63. [Google Scholar] [CrossRef]
  23. Mondal, N.K.; Samanta, A.; Chakraborty, S.; Shaikh, W.A. Enhanced chromium(VI) removal using banana peel dust: Isotherms, kinetics and thermodynamics study. Sustain. Water Resour. Manag. 2017, 4, 489–497. [Google Scholar] [CrossRef]
  24. Sahmoune, M.N. Evaluation of thermodynamic parameters for adsorption of heavy metals by green adsorbents. Environ. Chem. Lett. 2019, 17, 697–704. [Google Scholar] [CrossRef]
  25. Chen, Y.; Wang, H.; Zhao, W.; Huang, S. Four different kinds of peels as adsorbents for the removal of Cd (II) from aqueous solution: Kinetics, isotherm and mechanism. J. Taiwan Inst. Chem. Eng. 2018, 88, 146–151. [Google Scholar] [CrossRef]
  26. Shrestha, S.L. A Comparative Study of Fe (II) Ion Adsorption onto Chemically Activated Banana Peel and Sawdust Bio-adsorbent. Int. J. Appl. Sci. Biotechnol. 2018, 6, 137–141. [Google Scholar] [CrossRef]
  27. Sharma, H.K.; Sofi, I.R.; Wani, K.A. Low cost absorbents, techniques, and heavy metal removal efficiency. In Biostimulation Remediation Technologies for Groundwater Contaminants; IGI Global: Gwalior, India, 2018. [Google Scholar]
  28. Regkouzas, P.; Diamadopoulos, E. Adsorption of selected organic micro-pollutants on sewage sludge biochar. Chemosphere 2019, 224, 840–851. [Google Scholar] [CrossRef] [PubMed]
  29. Zhou, N.; Chen, H.; Xi, J.; Yao, D.; Zhou, Z.; Tian, Y.; Lu, X. Biochars with excellent Pb(II) adsorption property produced from fresh and dehydrated banana peels via hydrothermal carbonization. Bioresour. Technol. 2017, 232, 204–210. [Google Scholar] [CrossRef]
  30. Yahia, I.S.; Shkir, M.; Keshk, S.M.A.S. Physicochemical properties of a nanocomposite (graphene oxide-hydroxyapatite-cellulose) immobilized by Ag nanoparticles for biomedical applications. Results Phys. 2020, 16, 102990. [Google Scholar] [CrossRef]
  31. Thostenson, E.T.; Li, C.; Chou, T.W. Nanocomposites in context. Compos. Sci. Technol. 2005, 65, 491–516. [Google Scholar] [CrossRef]
  32. Youssef, A.M.; El-Naggar, M.E.; Malhat, F.M.; El Sharkawi, H.M. Efficient removal of pesticides and heavy metals from wastewater and the antimicrobial activity of f-MWCNTs/PVA nanocomposite film. J. Clean. Prod. 2019, 206, 315–325. [Google Scholar] [CrossRef]
  33. Youssef, A.M.; El-Sayed, S.M. Bionanocomposites materials for food packaging applications: Concepts and future outlook. Carbohydr. Polym. 2018, 193, 19–27. [Google Scholar] [CrossRef]
  34. Rehman, R.; Farooq, S.; Mahmud, T. Use of agro-waste Musa acuminata and Solanum tuberosum peels for economical sorptive removal of emerald green dye in ecofriendly way. J. Clean. Prod. 2019, 206, 819–826. [Google Scholar] [CrossRef]
  35. Sakthivel, T.; Ramachandran, R.; Kirubakaran, K. Photocatalytic properties of copper-two dimensional graphitic carbon nitride hybrid film synthesized by pyrolysis method. J. Environ. Chem. Eng. 2018, 6, 2636–2642. [Google Scholar] [CrossRef]
  36. Deshmukh, K.K.; Hase, G.J.; Gaje, T.R.; Phatangare, N.D.; Shilpa, G.; Ashwini, V. Titanium oxide nanoparticles and degradation of dye by nanoparticles. Int. J. Mater. Sci. 2018, 13, 23–30. [Google Scholar]
  37. Dey, A.; Nangare, V.; More, P.V.; Khan, M.A.S.; Khanna, P.K.; Sikder, A.K.; Chattopadhyay, S. A graphene titanium dioxide nanocomposite (GTNC): One pot green synthesis and its application in a solid rocket propellant. RSC Adv. 2015, 5, 63777–63785. [Google Scholar] [CrossRef]
  38. Chougala, L.S.; Yatnatti, M.S.; Linganagoudar, R.K.; Kamble, R.R.; Kadadevarmath, J.S. A simple approach on synthesis of TiO2 nanoparticles and its application in dye sensitized solar cells. J. Nano Electron. Phys. 2017, 9. [Google Scholar] [CrossRef]
  39. Liang, S.; Han, Y.; Wei, L.; McDonald, A.G. Production and characterization of bio-oil and bio-char from pyrolysis of potato peel wastes. Biomass Convers. Biorefin. 2015, 5, 237–246. [Google Scholar] [CrossRef]
  40. Thamaphat, K.; Limsuwan, P.; Ngotawornchai, B. Phase Characterization of TiO2 Powder by XRD and TEM. Nat. Sci. 2008, 42, 357–361. [Google Scholar]
  41. Subhapriya, S.; Gomathipriya, P. Green synthesis of titanium dioxide (TiO2) nanoparticles by Trigonella foenum-graecum extract and its antimicrobial properties. Microb. Pathog. 2018, 116, 215–220. [Google Scholar] [CrossRef]
  42. Ali, A.; Saeed, K.; Mabood, F. Removal of chromium (VI) from aqueous medium using chemically modified banana peels as efficient low-cost adsorbent. Alex. Eng. J. 2016, 55, 2933–2942. [Google Scholar] [CrossRef] [Green Version]
  43. Adebowale, K.O.; Unuabonah, I.E.; Olu-Owolabi, B.I. The effect of some operating variables on the adsorption of lead and cadmium ions on kaolinite clay. J. Hazard. Mater. 2006, 134, 130–139. [Google Scholar] [CrossRef] [PubMed]
  44. Bueno, B.Y.M.; Torem, M.L.; Molina, F.; Mesquita, L.M.S. de Biosorption of lead(II), chromium(III) and copper(II) by R. opacus: Equilibrium and kinetic studies. Miner. Eng. 2008, 1, 65–75. [Google Scholar] [CrossRef]
  45. Azouaou, N.; Sadaoui, Z.; Mokaddem, H. Removal of cadmium from aqueous solution by adsorption on vegetable wastes. J. Appl. Sci. 2008, 8, 4638–4643. [Google Scholar] [CrossRef] [Green Version]
  46. Osman1a, H.E.; Badwy, R.K.; Ahmad, H.F. Usage of some agricultural by-products in the removal of some heavy metals from industrial wastewater. J. Phytol. 2010, 2, 51–62. [Google Scholar]
  47. Jacques, R.A.; Lima, E.C.; Dias, S.L.P.; Mazzocato, A.C.; Pavan, F.A. Yellow passion-fruit shell as biosorbent to remove Cr (III) and Pb (II) from aqueous solution. Sep. Purif. Technol. 2007, 57, 193–198. [Google Scholar] [CrossRef]
  48. Aksu, Z.; İşoğlu, İ.A. Removal of copper (II) ions from aqueous solution by biosorption onto agricultural waste sugar beet pulp. Process. Biochem. 2005, 40, 3031–3044. [Google Scholar] [CrossRef]
  49. Pehlivan, E.; Cetin, S.; Yanık, B.H. Equilibrium studies for the sorption of zinc and copper from aqueous solutions using sugar beet pulp and fly ash. J. Hazard. Mater. 2006, 135, 193–199. [Google Scholar] [CrossRef]
  50. Eslamzadeh, T.; Nasernezhad, B.; Esmaeil, B.M. Removal of heavy metals from aqeous solution by carrot residues. Iran. J. Sci. Technol. Trans. A-Sci. 2004, 28, 161–167. [Google Scholar]
  51. Schiewer, S.; Patil, S.B. Pectin-rich fruit wastes as biosorbents for heavy metal removal: Equilibrium and kinetics. Bioresour. Technol. 2008, 99, 1896–1903. [Google Scholar] [CrossRef]
  52. Arslanoglu, H.; Altundogan, H.S.; Tumen, F. Preparation of cation exchanger from lemon and sorption of divalent heavy metals. Bioresour. Technol. 2008, 99, 2699–2705. [Google Scholar] [CrossRef] [Green Version]
  53. Ho, Y.S.; Ng, J.C.Y.; McKay, G. Kinetics of pollutant sorption by biosorbents: Review. Sep. Purif. Methods 2000, 29, 189–232. [Google Scholar] [CrossRef]
  54. Sari, A.; Tuzen, M.; Citak, D.; Soylak, M. Equilibrium, kinetic and thermodynamic studies of adsorption of Pb(II) from aqueous solution onto Turkish kaolinite clay. J. Hazard. Mater. 2007, 149, 283–291. [Google Scholar] [CrossRef] [PubMed]
  55. Gouanvé, F.; Marais, S.; Bessadok, A.; Langevin, D.; Morvan, C.; Métayer, M. Study of water sorption in modified flax fibers. J. Appl. Polym. Sci. 2006, 101, 4281–4289. [Google Scholar] [CrossRef]
  56. Huang, Y.; Shih, M. Effect of linearized expressions of Langmuir equations on the prediction of the adsorption of methylene blue on rice husk. Int. J. Sci. Res. Publ. 2016, 6, 549–554. [Google Scholar]
  57. Chung, H.K.; Kim, W.H.; Park, J.; Cho, J.; Jeong, T.Y.; Park, P.K. Application of Langmuir and Freundlich isotherms to predict adsorbate removal efficiency or required amount of adsorbent. J. Ind. Eng. Chem. 2015, 28, 241–246. [Google Scholar] [CrossRef]
  58. Ayawei, N.; Ebelegi, A.N.; Wankasi, D. Modelling and Interpretation of Adsorption Isotherms. J. Chem. 2017, 2017, 3039817. [Google Scholar] [CrossRef]
  59. Kim, H.; Kang, S.O.; Park, S.; Park, H.S. Adsorption isotherms and kinetics of cationic and anionic dyes on three-dimensional reduced graphene oxide macrostructure. J. Ind. Eng. Chem. 2015, 21, 1191–1196. [Google Scholar] [CrossRef]
Figure 1. FT-IR spectra of (a) TiO2 NP; (b) biochar; (c) TiO2 nanocomposite.
Water 13 03344 g001
Figure 2. SEM micrographs: (a) bare biomass; (b) bare biochar; (c) bare TiO2 NCs; (d) lead-loaded biomass; (e) lead-loaded biochar; (f) lead-loaded TiO2 NCs.
Water 13 03344 g002
Figure 3. XRD pattern of TiO2 NPs.
Water 13 03344 g003
Figure 4. UV spectra of TiO2 NPs.
Water 13 03344 g004
Figure 5. (a) Effect of pH; (b) effect of concentration; (c) effect of contact time; (d) effect of adsorbent dosage.
Water 13 03344 g005
Figure 6. Comparison of adsorption efficiency by adsorbents.
Water 13 03344 g006
Figure 7. (a) Pseudo-first-order graph; (b) pseudo-second-order graph.
Water 13 03344 g007
Figure 8. (a) Langmuir isotherm; (b) Freundlich isotherm for the adsorption of lead.
Water 13 03344 g008
Table 1. List of reported agrowaste with the potential to be applied as biosorbents to remove heavy metals from aqueous solutions.
AdsorbentsHeavy MetalsMaximum Adsorption
Capacity (m mol g−1)
Olive wasteCd0.0655 [46]
Orange peelCd0.335 [42]
Orange barkCd0.3101 [46]
Rice hull Ni, Cd, Cu, Zn, Pb 0.085, 0.125, 0.93, 0.17, 0.2 [47]
Yellow passion-fruit shellCr0.732–1.637 [48]
Sugar beet pulp (Beta vulgaris)Cu, Zn0.309, 0.356 [49,50]
Carrot residuesCu0.937 [51]
Grapefruit peelCd0.24 [52]
Lemon peelCd, Mn, Pb0.46, 0.43, 0.869 [53]
Lemon resinMn, Pb0.429, 0.869 [53]
Table 2. Comparison of pseudo-first- and -second-order models.
AdsorbateAdsorbentsPseudo-First-Order Pseudo-Second-Order
qeK1adR2qexpqeK2adR2
(mg/g)(min−1)(mg/g)(mg/g)(mg/gmin)
LeadBiomass14.561−0.0040.96351.67156.4970.0030.9863
Biochar32.055−0.00530.84768.23770.9214.4260.9878
TiO2 NC21.892−0.0050.96176.75182.6440.00250.9949
Table 3. Comparison of Langmuir and Freundlich Models.
AdsorbateAdsorbentsLangmuir Model Experimental ValueFreundlich Model
XmKLR2 qe
(mg/g)
1/nKF
(mg/g)
R2
(mg/g)(L/mg)
LeadBiomass20.960.020.9014.667.840.53−2.220.97
Biochar67.110.0090.5131.2113.480.71−2.260.95
TiO2 NC2000.0070.6663.8547.720.870.690.95
Publisher’s Note: MDPI stays neutral with regard to jurisdictional claims in published maps and institutional affiliations.

