
Cost-Effectiveness of Treatment Wetlands for Nitrogen Removal in Tropical and Subtropical Australia

 , , , , ,
Abstract
:1. Introduction
2. Materials and Methods
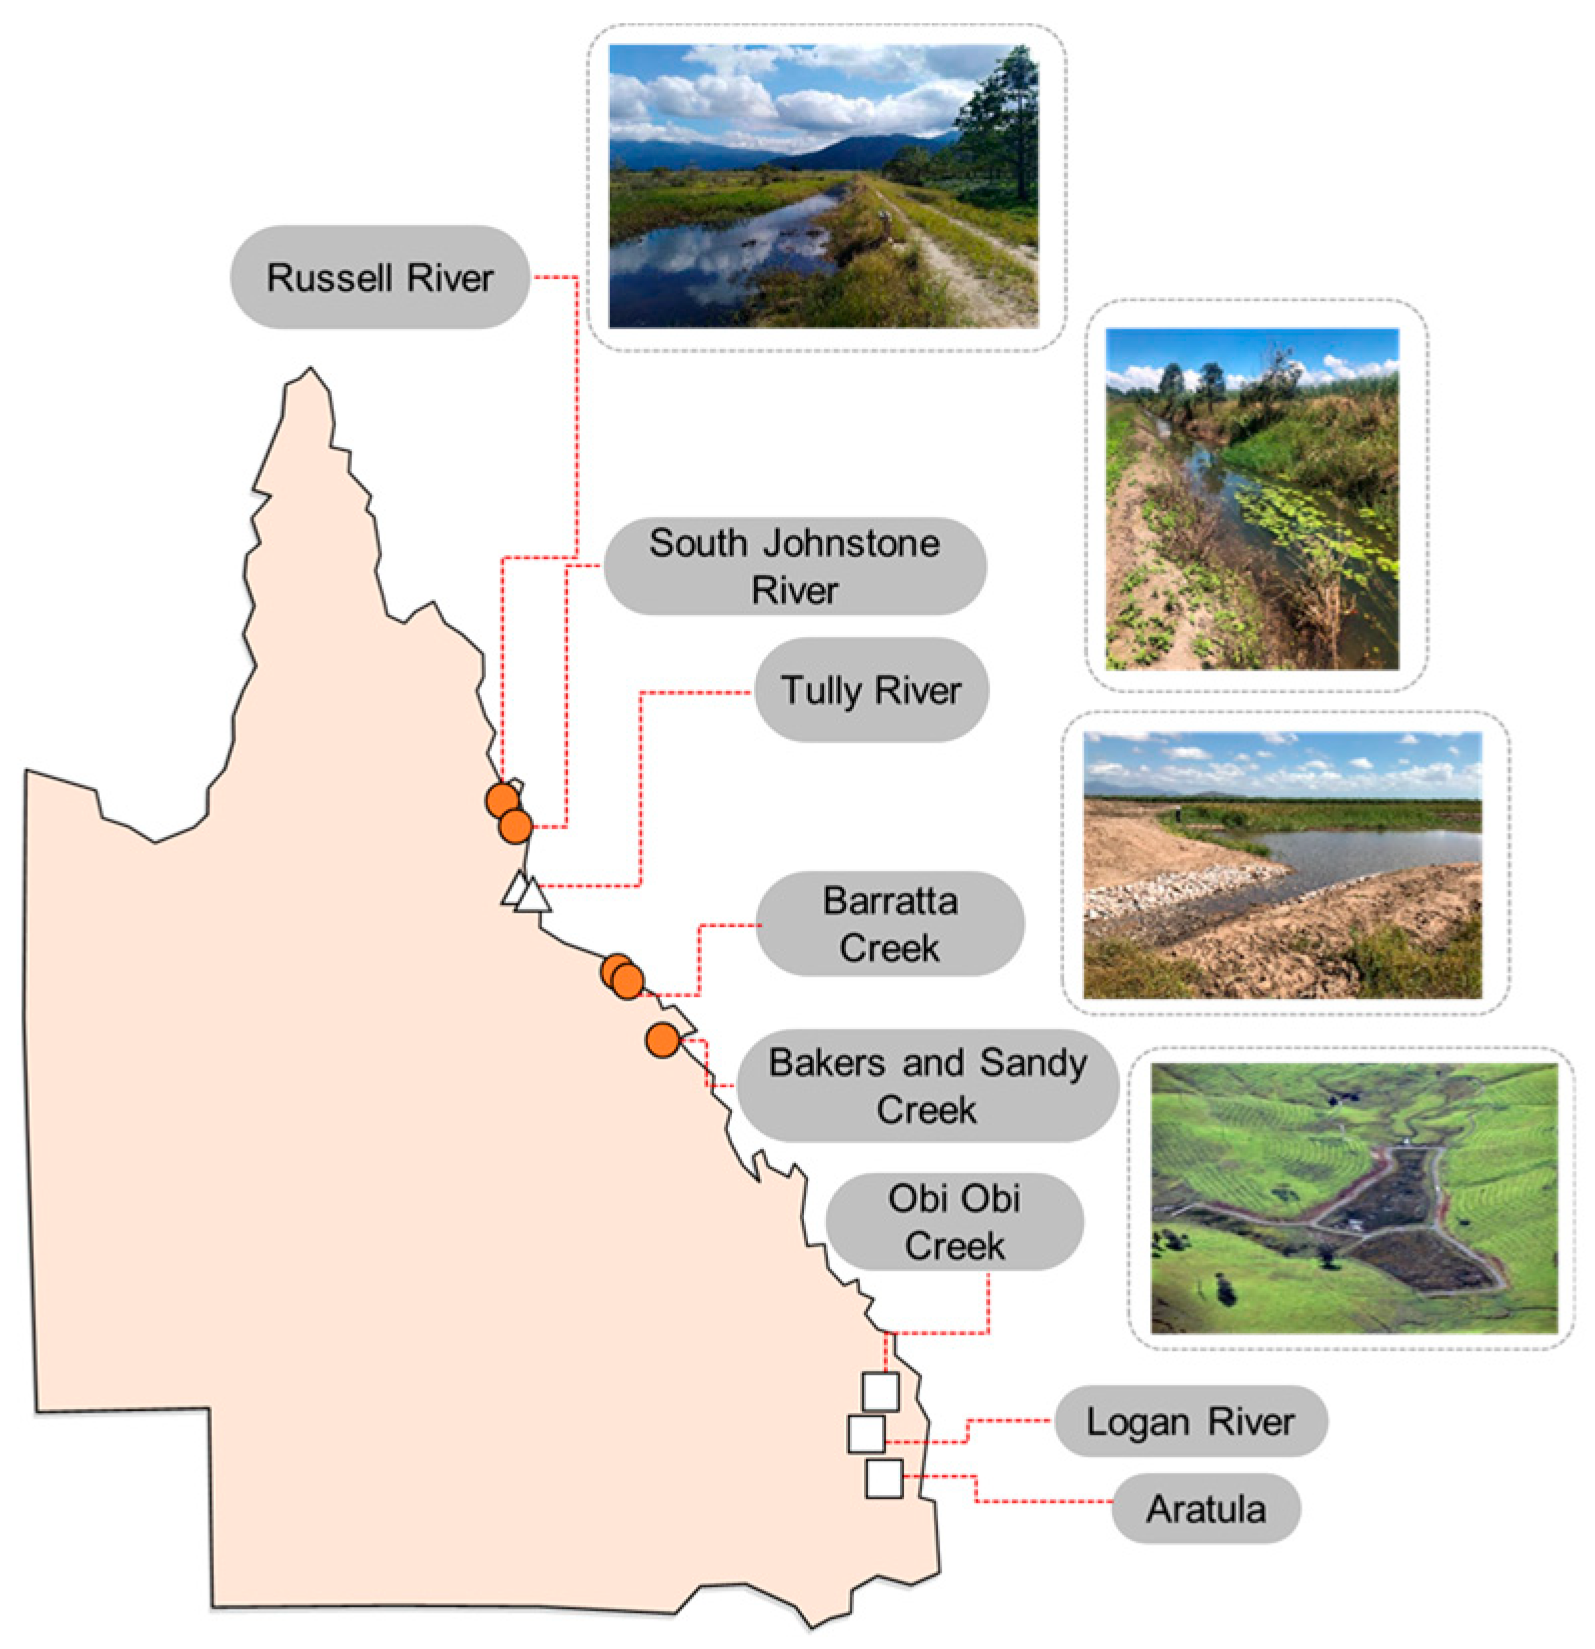
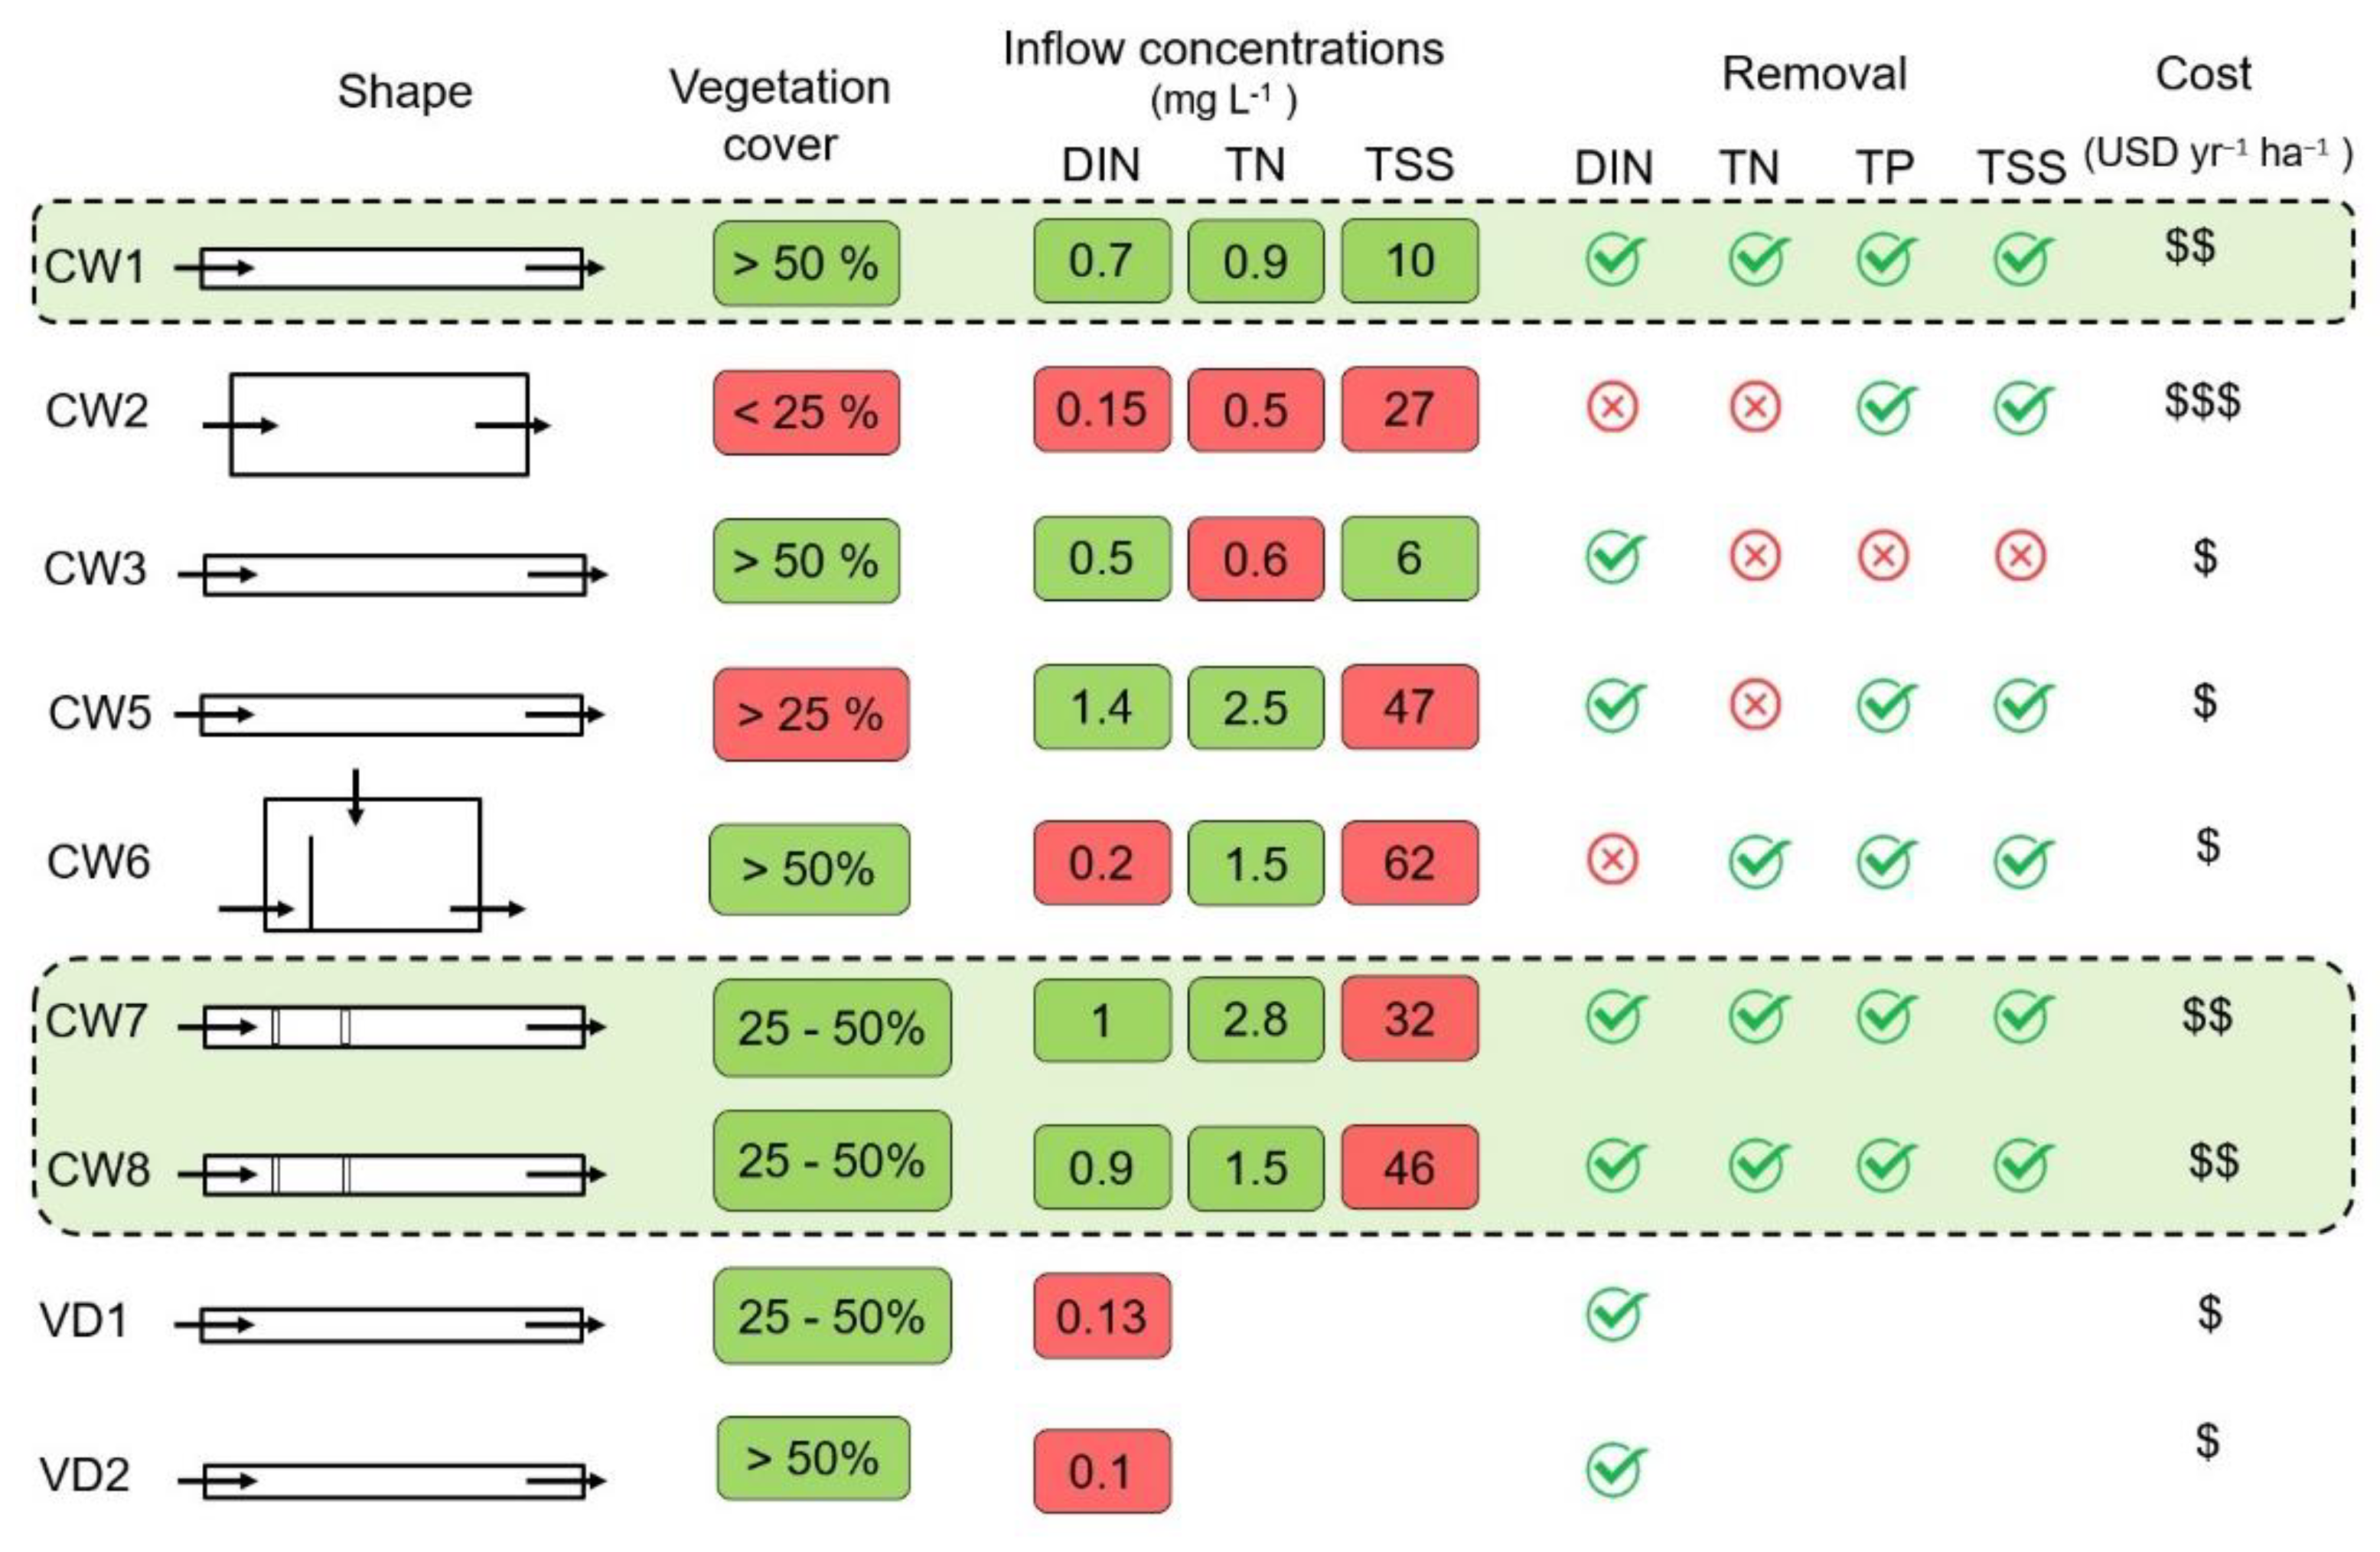
2.1. Study Sites
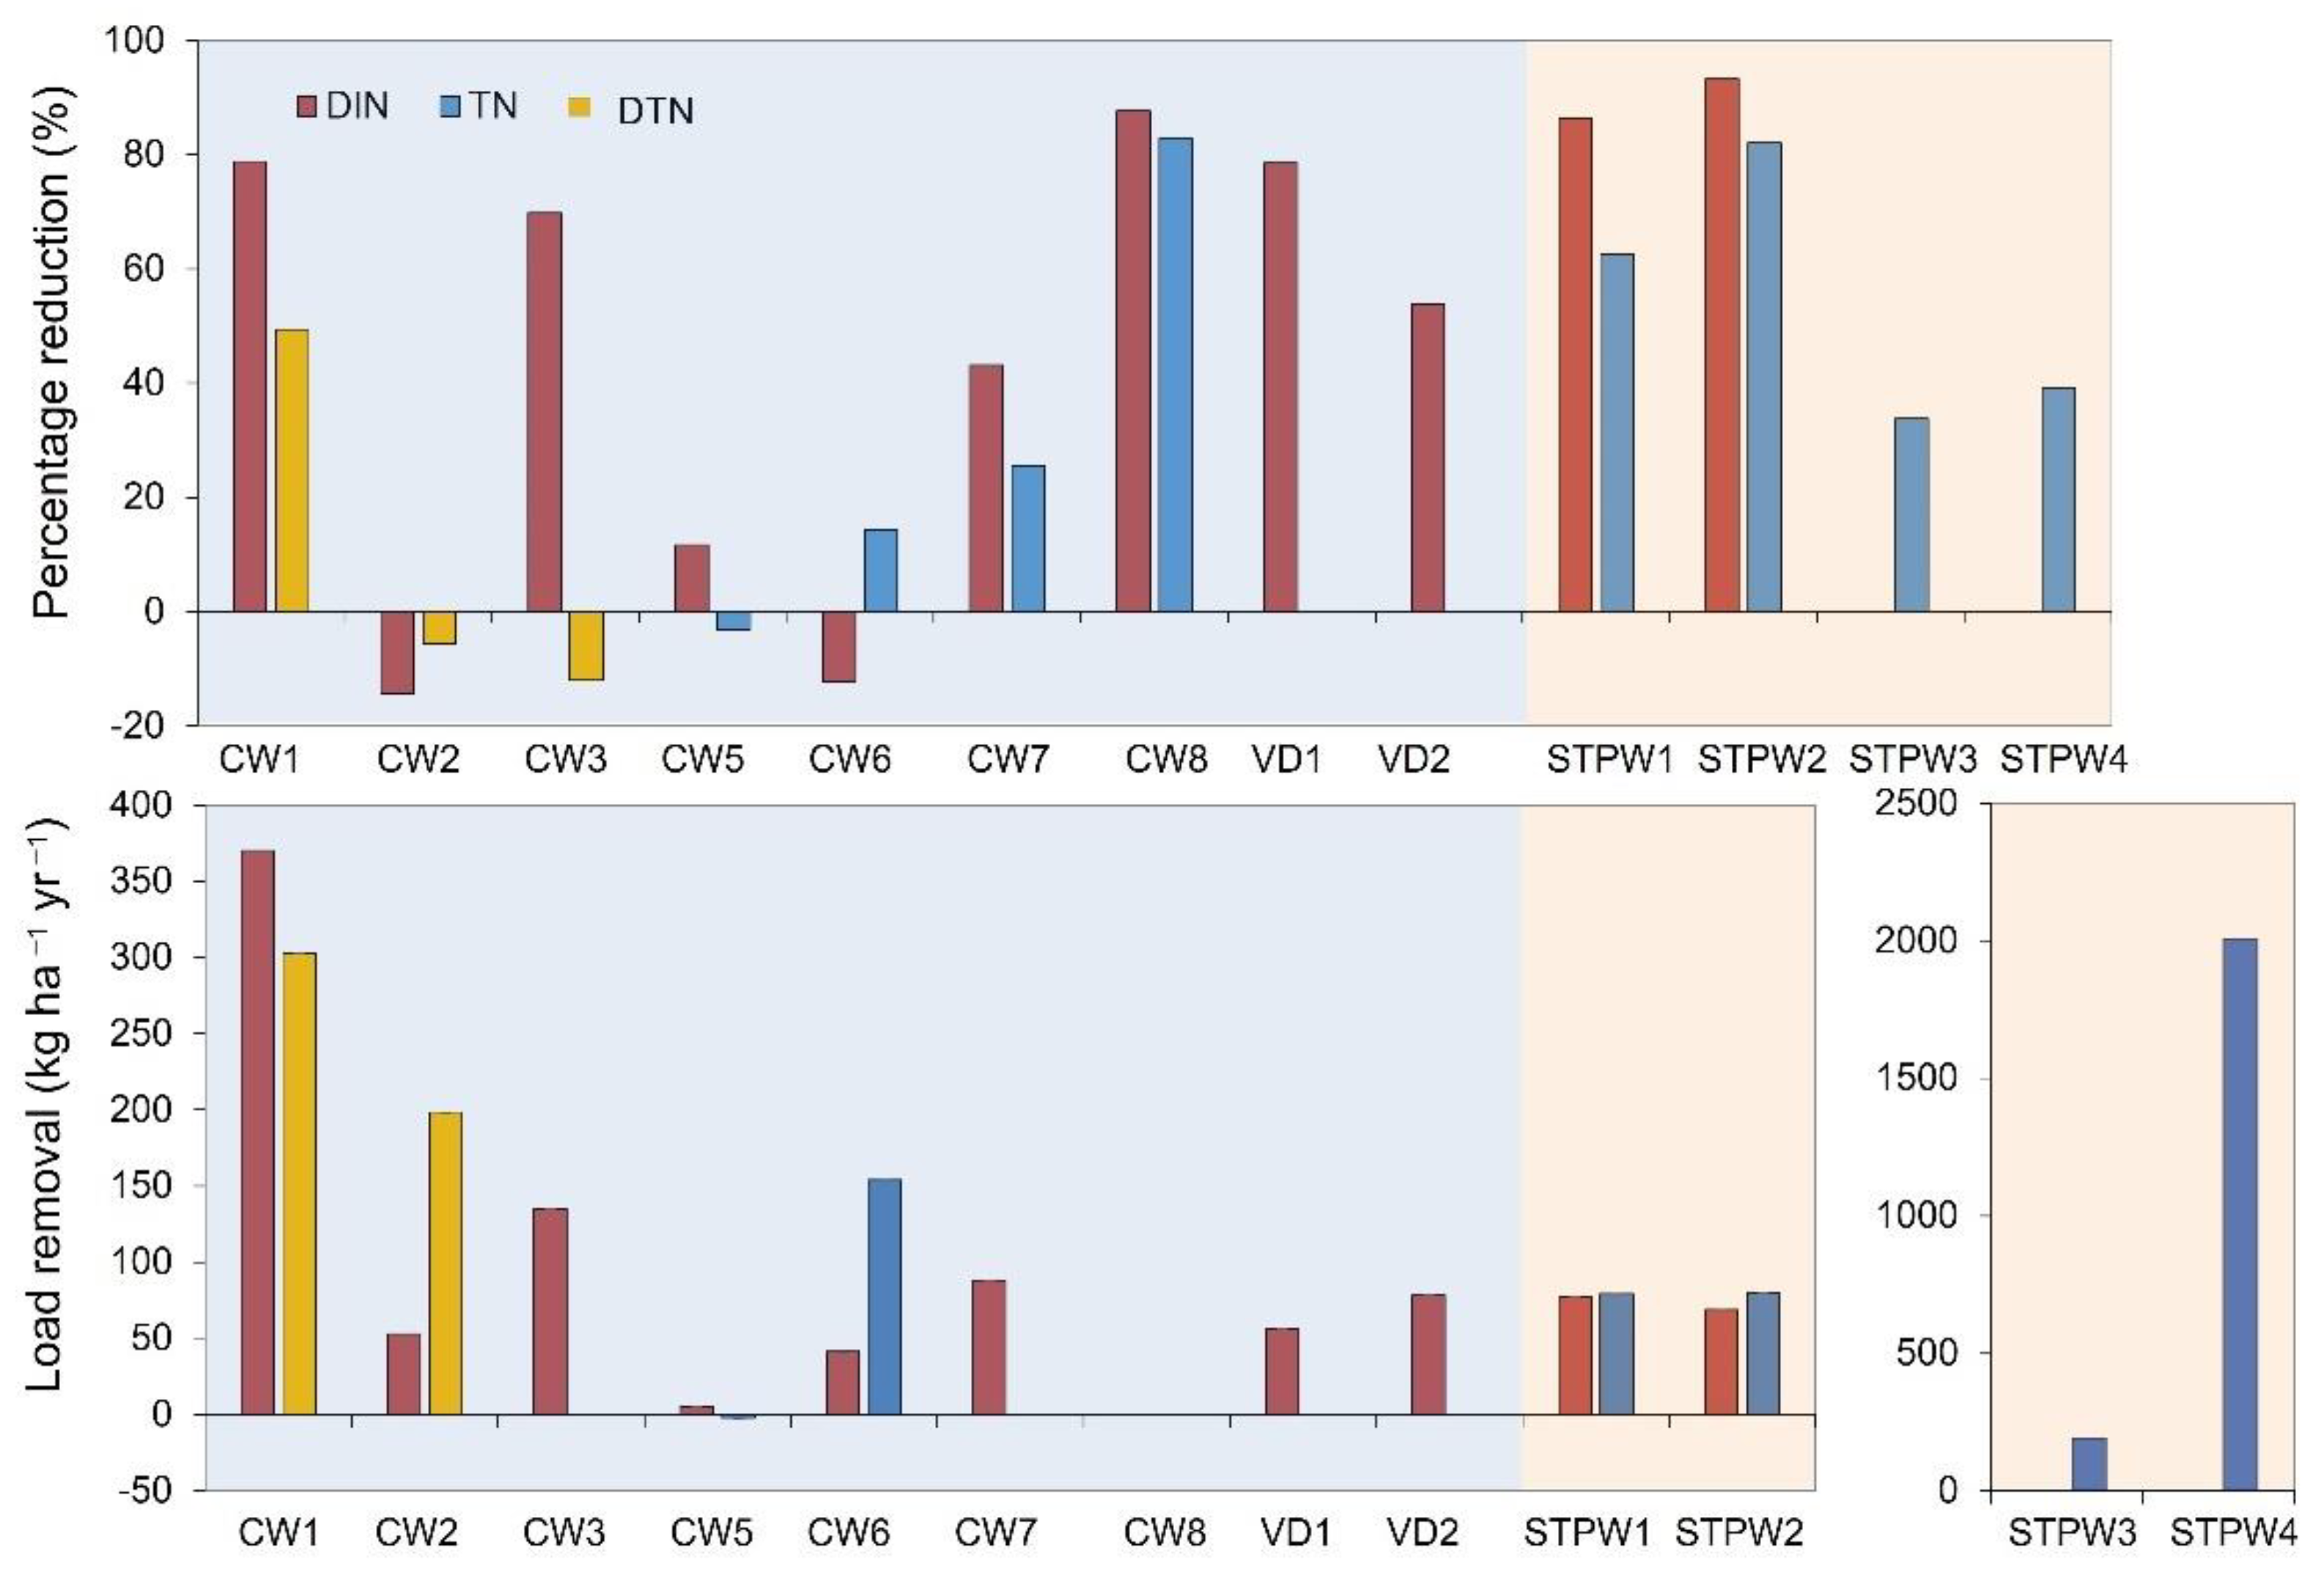
2.2. N Removal
2.3. Cost-Effectiveness
- (1)
- The total present value cost (TPVC) incurred in constructing and maintaining site over the evaluation period (20 years) is calculated by summing upfront costs incurred in year t = 0 and discounted future costs incurred in t = 1, 2, … as they arise over the remainder of the evaluation period.
- = TPVC for site
- = upfront costs of construction for site (t = 0)
- = one-off, annual, and periodic costs for site incurred in t = 1, 2, …
- = real discount rate
- T = evaluation period
- (2)
- TPVC (USD, Equation (1)) is converted into an annualised equivalent present value cost (APVC) in USD yr−1:
- CEj = cost-effectiveness for site j
- Nj = annual DIN or TN load removal for site j
3. Results
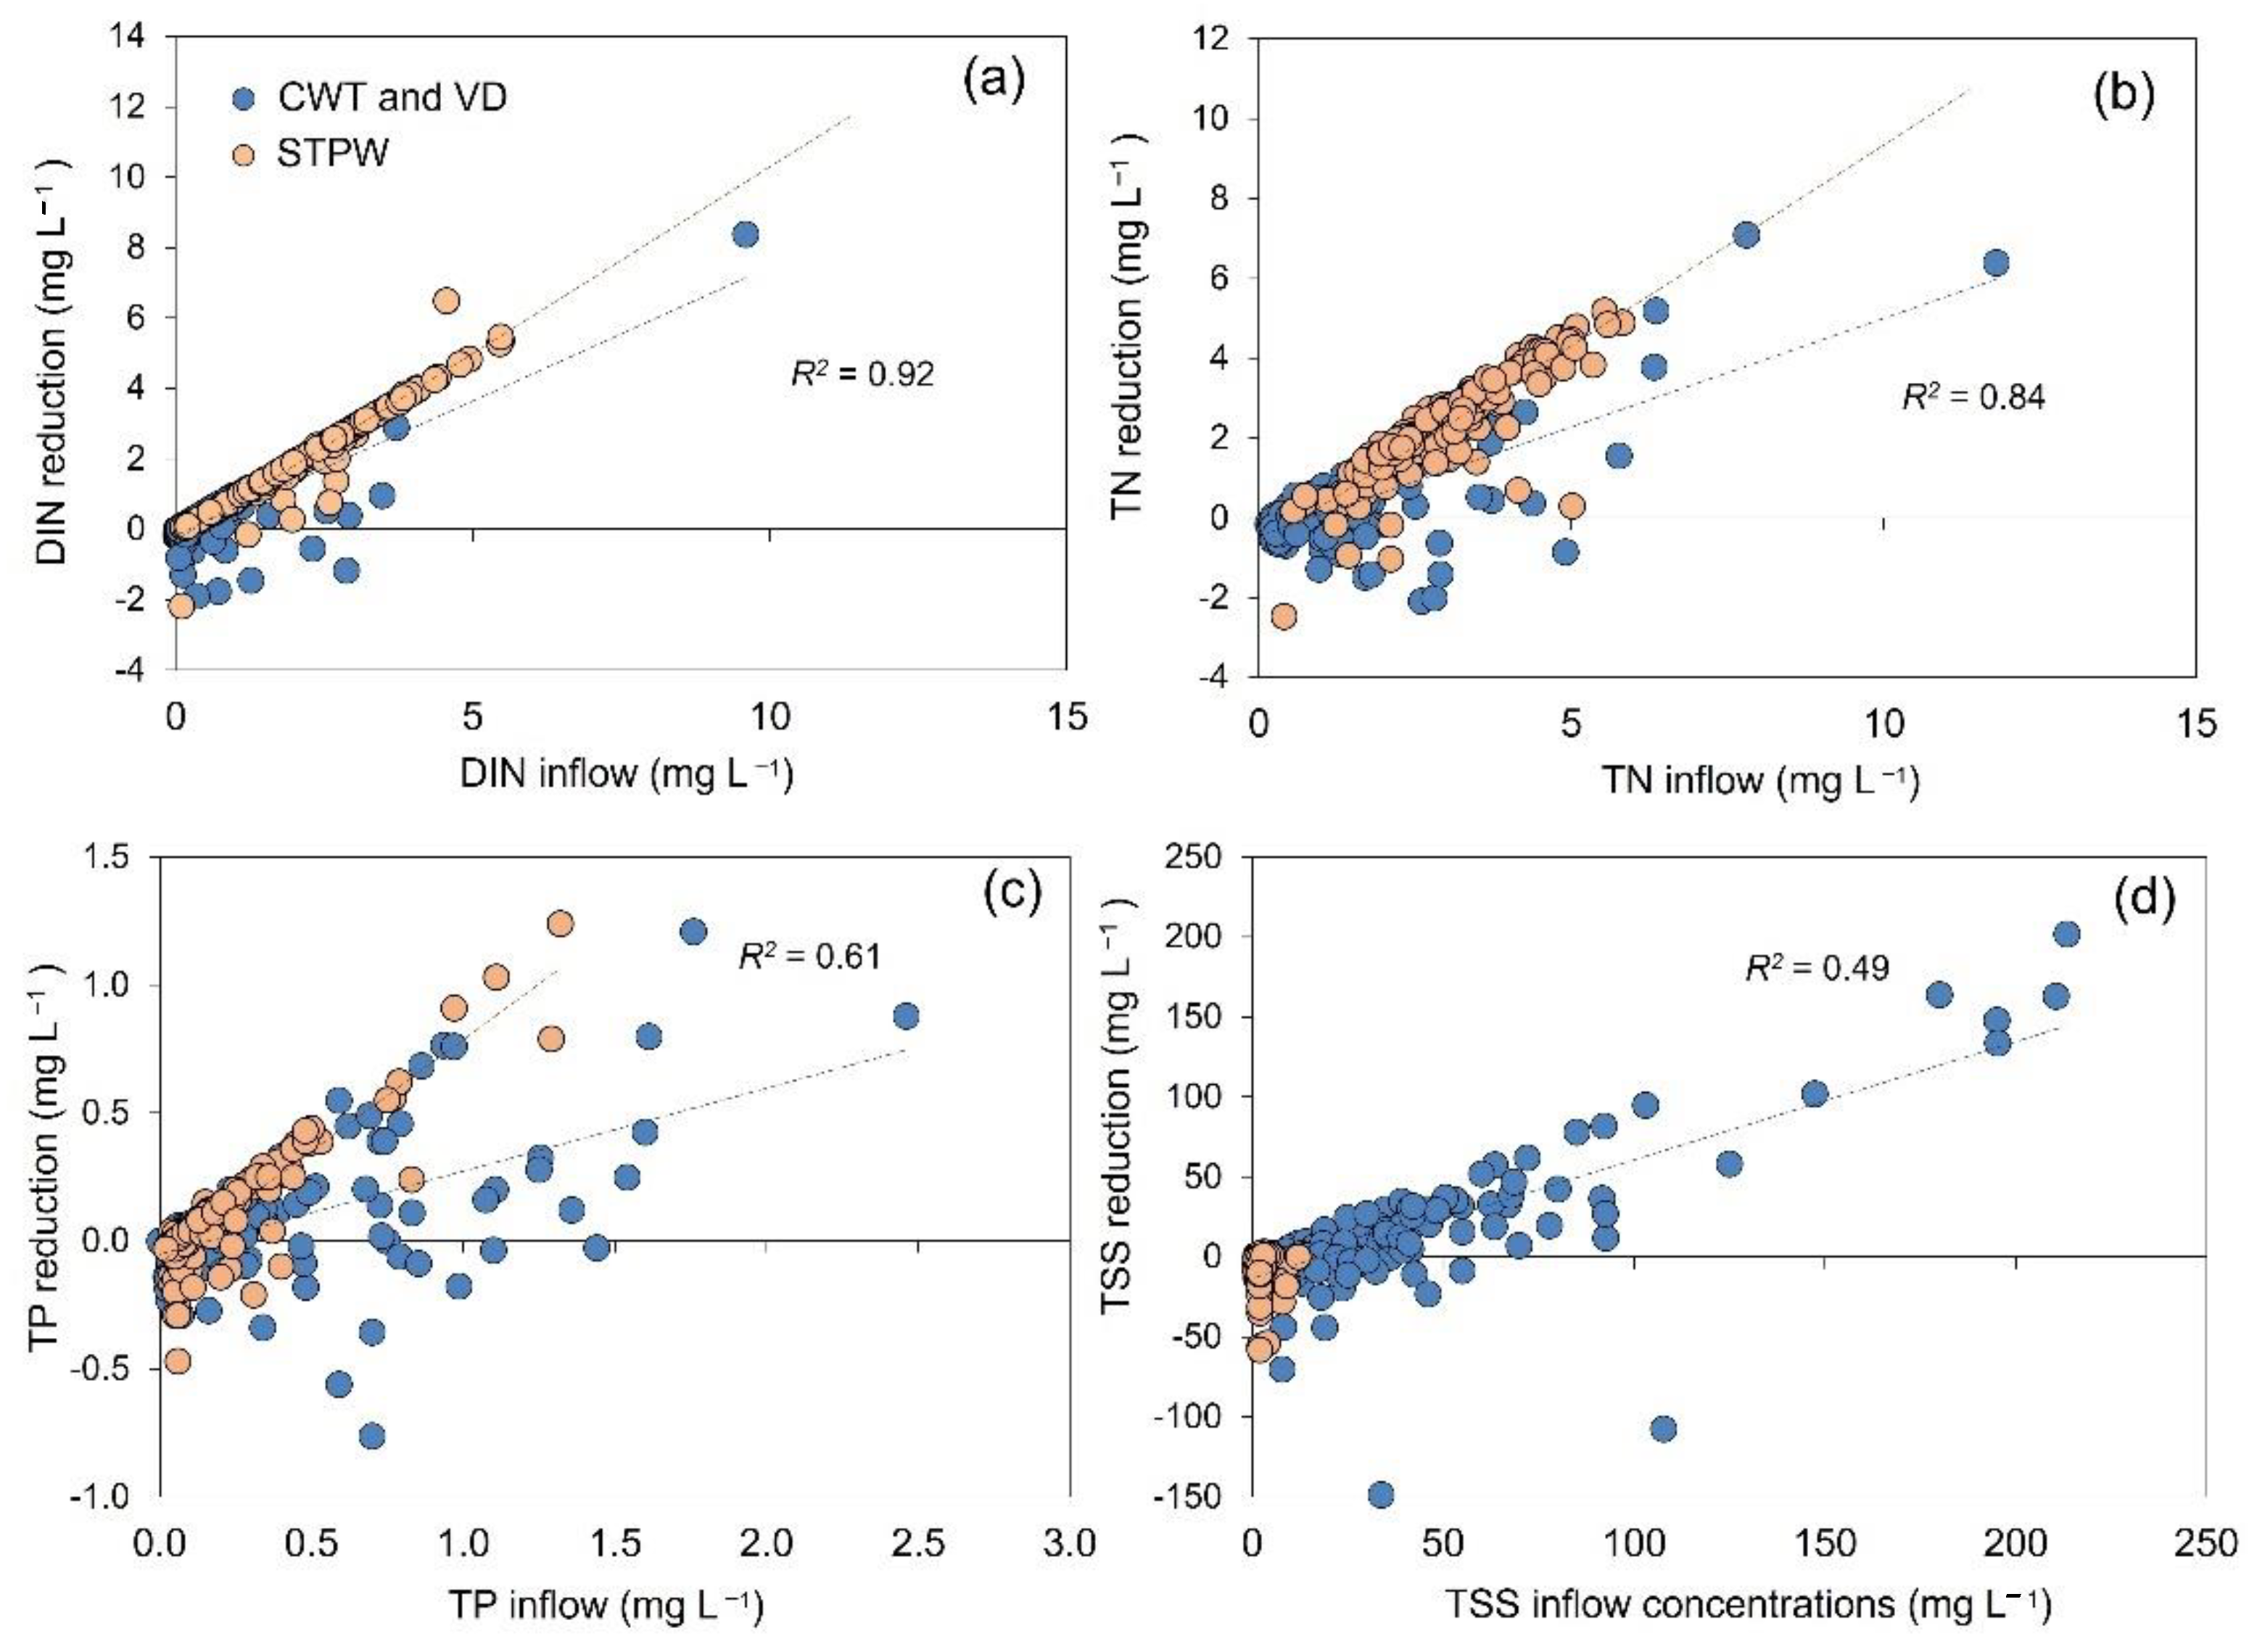
3.1. N Removal
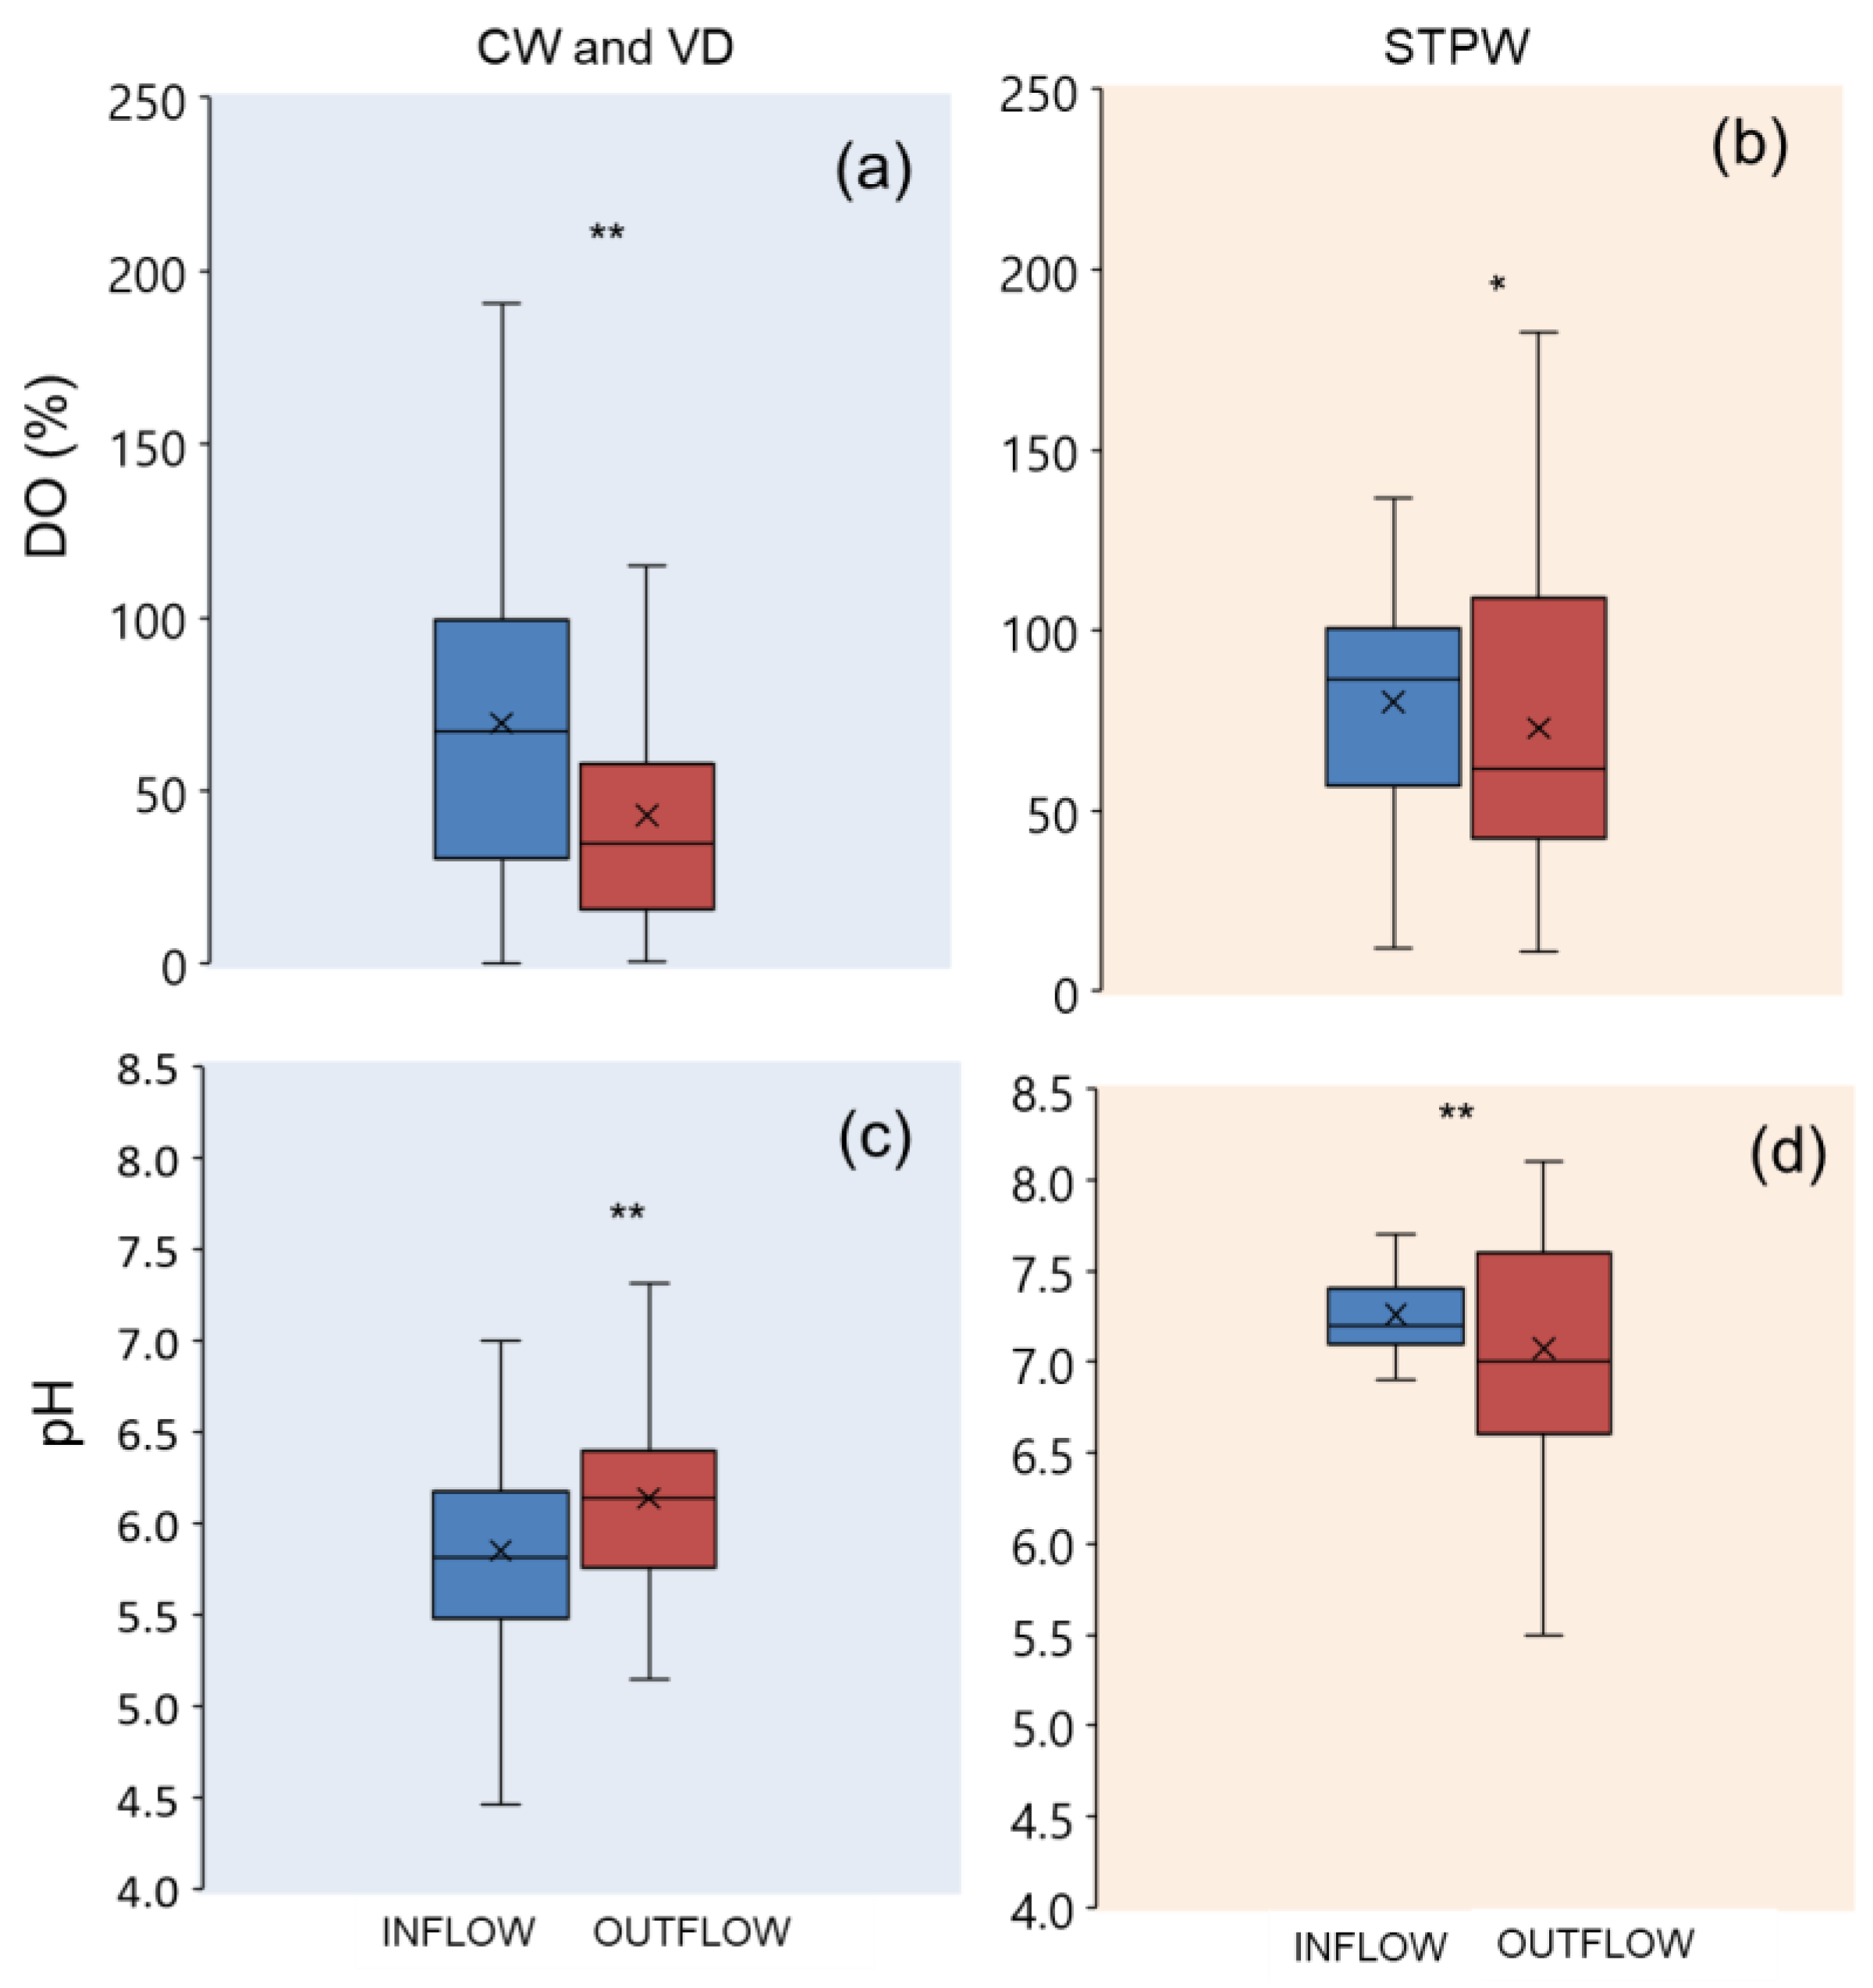
3.2. Factors Associated with N Removal
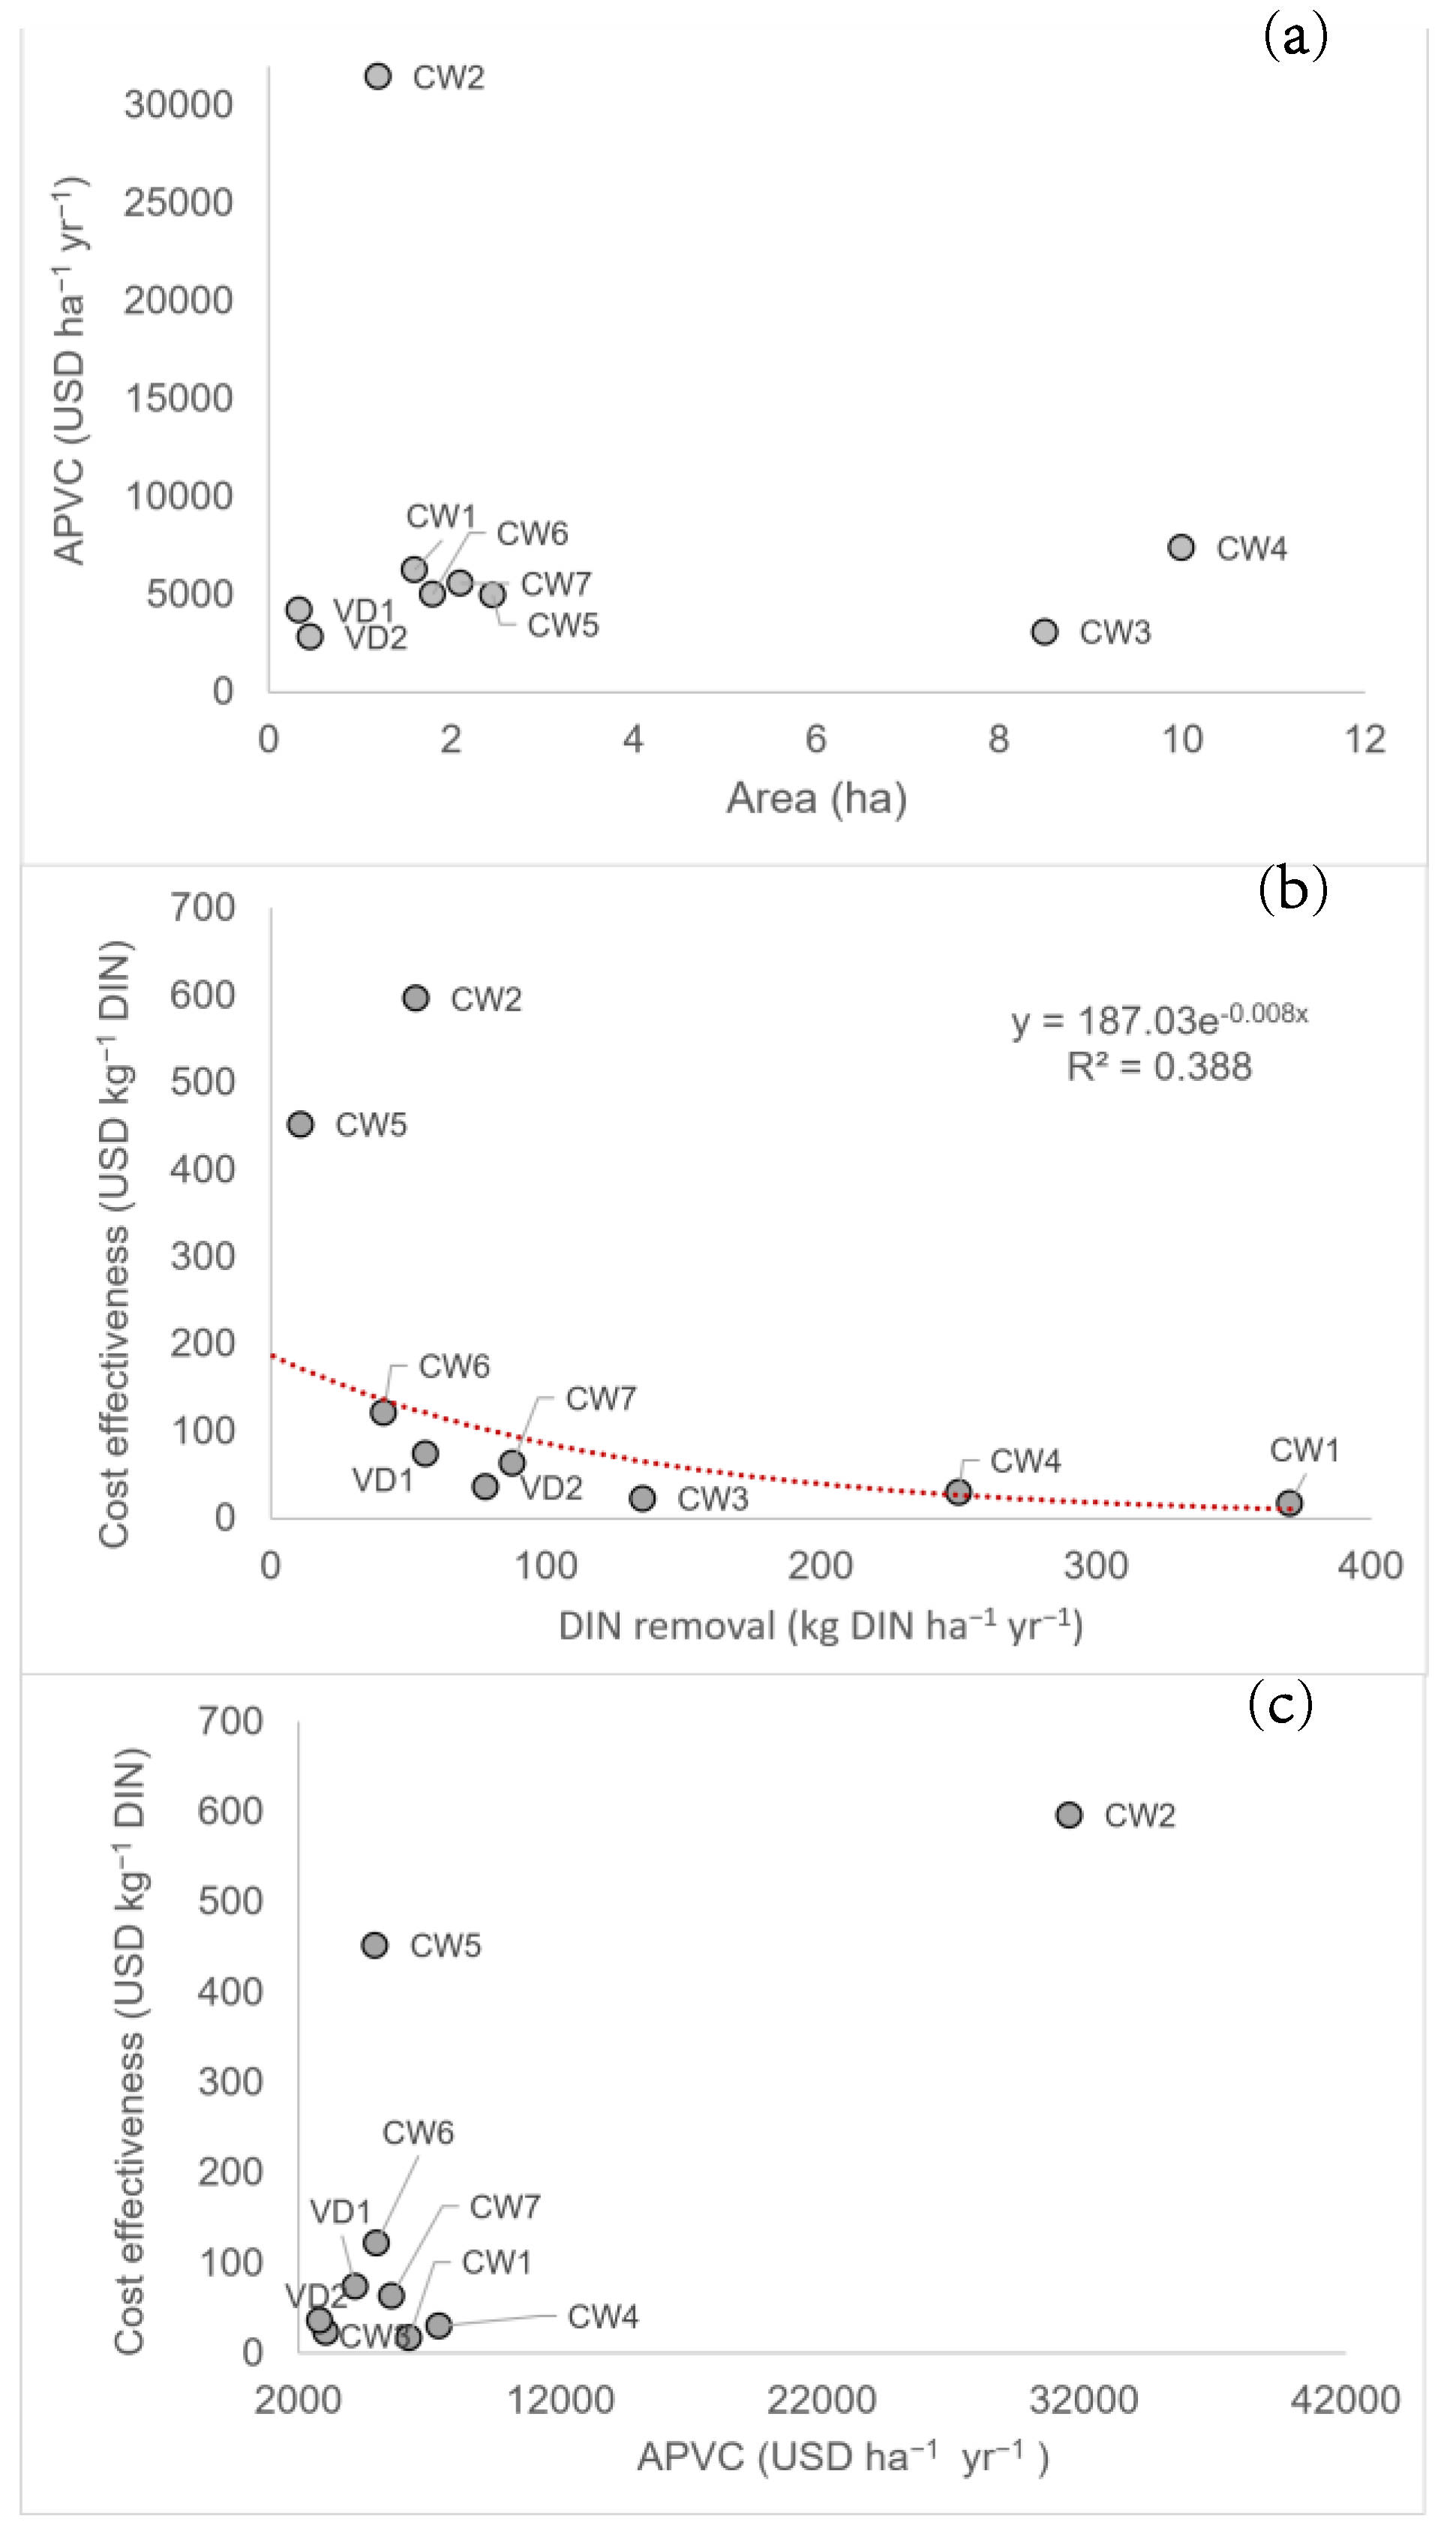
3.3. Cost-Effectiveness
4. Discussion
4.1. N Removal
4.2. Cost-Effectiveness
5. Conclusions
Supplementary Materials
Author Contributions
Funding
Data Availability Statement
Acknowledgments
Conflicts of Interest
References
- Rockström, J.; Steffen, W.; Noone, K.; Persson, Å.; Chapin, F.S.; Lambin, E.F.; Lenton, T.M.; Scheffer, M.; Folke, C.; Schellnhuber, H.J.; et al. A safe operation space for humanity. Nature 2009, 461, 472–475. [Google Scholar] [CrossRef]
- Galloway, J.N.; Cowling, E.B. Reactive nitrogen and the world: 200 years of change. AMBIO J. Hum. Environ. 2002, 31, 64–71. [Google Scholar] [CrossRef] [PubMed]
- Howarth, R.; Sharpley, A.; Walker, D. Sources of nutrient pollution to coastal waters in the United States: Implications for achieving coastal water quality goals. Estuaries 2002, 25, 656–676. [Google Scholar] [CrossRef]
- Galloway, J.; Aber, J.; Erisman, J.; Seitzinger, S.; Howarth, R.; Cowlilng, E.; Cosby, B. The Nitrogen Cascade. Bioscience 2003, 53, 341. [Google Scholar] [CrossRef]
- Land, M.; Granéli, W.; Grimvall, A.; Hoffmann, C.C.; Mitsch, W.J.; Tonderski, K.S.; Verhoeven, J.T.A. How effective are created or restored freshwater wetlands for nitrogen and phosphorus removal? A systematic review. Environ. Evid. 2016, 5, 9. [Google Scholar] [CrossRef] [Green Version]
- Mitsch, W.J.; Gosselink, J. Wetlands, 5th ed.; Wiley: Hoboken, NJ, USA, 2015. [Google Scholar]
- Vymazal, J. Constructed wetlands for wastewater treatment. Water 2010, 2, 530–549. [Google Scholar] [CrossRef] [Green Version]
- Adame, M.F.; Vilas, M.P.; Franklin, H.; Garzon-Garcia, A.; Hamilton, D.; Ronan, M.; Griffiths, M. A conceptual model of nitrogen dynamics for the Great Barrier Reef catchments. Mar. Pollut. Bull. 2021, 173, 112909. [Google Scholar] [CrossRef]
- Hansen, A.T.; Dolph, C.L.; Foufoula-Georgiou, E.; Finlay, J.C. Contribution of wetlands to nitrate removal at the watershed scale. Nat. Geosci. 2018, 11, 127–132. [Google Scholar] [CrossRef]
- Zhang, D.Q.; Jinadasa, K.B.S.N.; Gersberg, R.M.; Liu, Y.; Tan, S.K.; Ng, W.J. Application of constructed wetlands for wastewater treatment in tropical and subtropical regions (2000–2013). J. Environ. Sci. 2015, 30, 30–46. [Google Scholar] [CrossRef]
- Jones, H.P.; Hole, D.G.; Zavaleta, E.S. Harnessing nature to help people adapt to climate change. Nat. Clim. Chang. 2012, 2, 504–509. [Google Scholar] [CrossRef]
- State of Queensland Australian Government. Reef 2050: Water Quality Improvement Plan (2017–2022); State of Queensland: Brisbane, Australia, 2018. Available online: https://www.reefplan.qld.gov.au/__data/assets/pdf_file/0017/46115/reef-2050-water-quality-improvement-plan-2017-22.pdf (accessed on 16 November 2021).
- Pearce, D.; Atkinson, G.; Mourato, S. Cost-Benefit Analysis and the Environment: Recent Developments; OECD: Paris, France, 2006. [Google Scholar]
- Boardman, A.; Greenberg, D.; Vining, A.; Weimer, D. Cost-Benefit Analysis: Concepts and Practice, 5th ed.; Cambridge University Press: Cambridge, UK, 2018. [Google Scholar]
- Smart, J.; Hasan, S.; Curwen, G.; McMahon, J.; Volders, A.; Saint Ange, C.; Fleming, C.M.; Buckwell, A.; Burford, M.; Tan, P.; et al. Exploring Trading in Water Quality Credits as a Cost-Effective Approach for Managing Water Quality in the Great Barrier Reef; Report to the National Environmental Science Program; Reef and Rainforest Research Centre Limited: Cairns, Australia, 2020. [Google Scholar]
- Gachango, F.G.; Pedersen, S.M.; Kjaergaard, C. Cost-Effectiveness Analysis of Surface Flow Constructed Wetlands (SFCW) for Nutrient Reduction in Drainage Discharge from Agricultural Fields in Denmark. Environ. Manag. 2015, 56, 1478–1486. [Google Scholar] [CrossRef] [PubMed]
- Kavehei, E.; Roberts, M.E.; Cadier, C.; Griffiths, M.; Argent, S.; Hamilton, D.P.; Lu, J.; Bayley, M.; Adame, M.F. Nitrogen processing by treatment wetlands in a tropical catchment dominated by agricultural landuse. Mar. Pollut. Bull. 2021, 172, 112800. [Google Scholar] [CrossRef] [PubMed]
- Star, M.; Rolfe, J.; McCosker, K.; Smith, R.; Ellis, R.; Waters, D.; Waterhouse, J. Targeting for pollutant reductions in the Great Barrier Reef river catchments. Environ. Sci. Policy 2018, 89, 365–377. [Google Scholar] [CrossRef]
- Rust, S.; Star, M. The cost effectiveness of remediating erosion gullies: A case study in the Fitzroy. Australas. J. Environ. Manag. 2018, 25, 233–247. [Google Scholar] [CrossRef]
- Waltham, N.; Wegscheidl, C.; Volders, A.; Smart, J.C.R.; Hasan, S.; Ledee, E.; Waterhouse, J. Land use conversion to improve water quality in high DIN risk, low-lying sugarcane areas of the Great Barrier Reef catchments. Mar. Pollut. Bull. 2021, 167, 112373. [Google Scholar] [CrossRef] [PubMed]
- Lombard-Latune, R.; Pelus, L.; Fina, N.; L’Etang, F.; Le Guennec, B.; Molle, P. Resilience and reliability of compact vertical-flow treatment wetlands designed for tropical climates. Sci. Total Environ. 2018, 642, 208–215. [Google Scholar] [CrossRef] [PubMed]
- Reddy, K.R.; DeLaune, R.D. Biogeochemistry of Wetlands; CRC Press, Taylor and Francis Group: Boca Raton, FL, USA, 2008. [Google Scholar]
- Pang, S.; Zhang, S.; Lv, X.Y.; Han, B.; Liu, K.; Qiu, C.; Wang, C.; Wang, P.; Toland, H.; He, Z. Characterization of bacterial community in biofilm and sediments of wetlands dominated by aquatic macrophytes. Ecol. Eng. 2016, 97, 242–250. [Google Scholar] [CrossRef]
- Nascimento, J.R.; Easson, C.G.; de Jurelevicius, D.A.; Lopez, J.V.; Bidone, E.D.; Sabadini-Santos, E. Microbial community shift under exposure of dredged sediments from a eutrophic bay. Environ. Monit. Assess. 2020, 192, 1–16. [Google Scholar] [CrossRef]
- Persson, J.; Somes, N.L.G.; Wong, T.H.F. Hydraulics efficiency of constructed wetlands and ponds. Water Sci. Technol. 1999, 40, 291–300. [Google Scholar] [CrossRef]
- Kadlec, R.; Wallace, S.; Knight, R.L. Treatment Wetlands; CRC Press, Taylor and Francis Group: Boca Raton, FL, USA, 1995. [Google Scholar]
- Davies, P.L.; Eyre, B.D. Estuarine modification of nutrient and sediment exports to the Great Barrier Reef Marine Park from the Daintree and Annan River catchments. Mar. Pollut. Bull. 2005, 51, 174–185. [Google Scholar] [CrossRef]
- Rasiah, V.; Armour, J.D.; Yamamoto, T.; Mahendrarajah, S.; Heiner, D.H. Nitrate dynamics in shallow groundwater and the potential for transport to off-site water bodies. Water. Air. Soil Pollut. 2003, 147, 183–202. [Google Scholar] [CrossRef]
- Alluvium Consulting Australia. Costs of Achieving the Water Quality Targets for the Great Barrier Reef; Alluvium Consulting Australia: Brisbane, Australia, 2016. [Google Scholar]
- Rolfe, J.; Windle, J. Benchmarking Costs of Improving Agricultural Water Management in GBR Catchments; Report to the National Environmental Science Programme; Reef and Rainforest Research Centre Limited: Cairns, Australia, 2016. [Google Scholar]
- Pfumayaramba, T.; Weigscheidl, C.; Nothard, B. A Preliminary Cost-Effectiveness Analysis of Denitrifying Bioreactors in the Lower Burdekin; State of Queensland: Brisbane, Australia, 2020. Available online: https://www.publications.qld.gov.au/dataset/treatment-system-technologies-to-improve-water-quality/resource/a1a78b8c-27c7-48a2-903e-9acb293b2534 (accessed on 16 November 2021).
- Kulkarni, R.; Mills, A.; Crouch, K.; Lowe, S.; Walker, S. More than sewage: Adding value to the Maleny Community. Water e-J. 2018, 3, 1–16. [Google Scholar]
- Jensen, A.K.; Uggeldahl, K.C.; Jacobsen, B.H.; Jensen, J.D.; Hasler, B. Including aesthetic and recreational values in cost-effectiveness analyses of land use change based nitrogen abatement measures in Denmark. J. Environ. Manag. 2019, 240, 384–393. [Google Scholar] [CrossRef] [PubMed]


| Climate/Region | Size (ha) | w:c (%) | Vegetation Cover (%) | Characteristics | |
|---|---|---|---|---|---|
| Humid-tropical/Wet Tropics | CW1 n = 25 2019–2021 | 1.6 | 11 | >50 | Converted drain in sugarcane farm. Groundwater dominated, with a very high length: width ratio. |
| CW2 n = 45 2019–2021 | 1.2 | 3 | <25 | A square-shaped wetland in a banana farm. It has a sediment basin at the inlet with a low length: width ratio. Macrophytes includes Nymphaea sp. on the edges. | |
| CW3 n = 45 2020–2021 | 8.5 | 2 | >50 | Large sinous landscape wetland with two inlet points draining sugarcane farms. | |
| CW4 | 10 | n.a. | >50 | Sugarcane paddock converted to wetland; water level regulated by multiple manually operatedoutlet gates. | |
| CW5 n = 8 2011–2013 | 2.5 | 9 | <25 | System draining a banana farm. Designed with a retention time of two days, very high length: width ratio. Most reeds and sedges planted did not survive and it became dominated by invasive grasses Urochloa mutica and Hymenachne amplexicaulis. | |
| Semi humid-tropical/Dry Tropics, Mackay-Whitsundays | CW6 n = 15 2018–2020 | 1.8 | 0.5 | >50 | Square shaped (low length: width) system draining sugarcane. It has two internal berms to increase residence time, a sediment basin, and an outlet wall. Two inlet points. Densely vegetated mostly by Typha spp. |
| CW7 n = 32 2017–2020 | 2.1 | 0.4 | 25–50 | Treatment train system draining sugarcane with multiple ponds and a high length:width ratio. Vegetation community includes Schoenoplectus sp., Lomandra sp., and U. mutica. | |
| CW8 n = 9 2017–2019 | 1.3 | 3 | 25–50 | Treatment train draining sugarcane with with multiple ponds and a high length: width ratio. Vegetation community includes U. mutica and Typha sp. | |
| Humid-tropical/Wet Tropics | VD1 n = 5 2021 | 0.3 | n.a. | 25–50 | 400 m-long widened drain in sugarcane farm with stagnant water during sampling and high length: width ratio. |
| VD2 n = 5 2021 | 0.5 | n.a. | >50 | 460 m-long, partly widened drain in a sugarcane farm with patches of dense U. mutica constant water flow and high length: width ratio. | |
| Subtropical/Southeast Queensland | STP1 n = 96 2020–2021 | 7.3 | n.a. | >50 | Surface flow wetland part of a sewage treatment plant; three parallel cells with similar hydraulic loading rate. |
| STP2 n = 348 2018–2020 | 7.5 | n.a. | >50 | Part of an irrigated forest and treatment system of a sewage treatment plant. | |
| STP3 n = 23 2015–2017 | 0.2 | n.a. | >50 | Surface flow wetland with two parallel cells, part of a sewage treatment plant. | |
| STP4 n = 17 2015–2016 | 0.4 | n.a. | >50 | Surface flow wetland with two parallel cells, part of a sewage treatment plant. |
| Inflow (mg L−1) | Outflow | |||||
|---|---|---|---|---|---|---|
| NH4+-N | NO3−-N | DIN | TN or TDN | DO (%) | pH | |
| CW1 | 0.20 ± 0.03 | 0.53 ± 0.09 | 0.72 ± 0.08 | TDN: 0.93 ± 0.09 | 66.3 ± 7.3 | 6.0 ± 0.1 |
| CW2 | 0.06 ± 0.02 | 0.09 ± 0.02 | 0.15 ± 0.02 | TDN: 0.48± 0.04 | 42.1 ± 5.6 | 6.1 ± 0.1 |
| CW3 | 0.03 ± 0.00 | 0.52 ± 0.06 | 0.54 ± 0.06 | TDN: 0.62 ± 0.06 | 24.4 ± 3.1 | 6.2 ± 0.0 |
| CW4 | n.a. | n.a. | n.a. | n.a. | n.a. | n.a. |
| CW5 | 0.48 ± 0.12 | 0.97 ± 0.25 * | 1.44 ± 0.31 | 2.53 ± 0.43 | n.a. | 7.3 ± 0.1 |
| CW6 | 0.10 ± 0.06 | 0.16 ± 0.03 | 0.21 ± 0.07 | 1.52 ± 0.24 | n.a. | 7.7 ± 0.2 |
| CW7 | 0.14 ± 0.04 | 0.79 ± 0.28 | 0.97 ± 0.33 | 2.86 ± 0.38 | n.a. | n.a. |
| CW8 | 0.06 ± 0.01 | 0.27 ± 0.23 | 0.87 ± 0.60 | 1.56 ± 0.40 | n.a. | n.a. |
| VD1 | 0.12 ± 0.02 | n.a. | 0.13 ± 0.02 | n.a. | n.a. | n.a. |
| VD2 | 0.07 ± 0.02 | n.a. | 0.09 ± 0.02 | n.a. | n.a. | n.a. |
| STPW1 | 0.57 ± 0.12 | 1.29 ± 0.11 | 1.86± 0.16 | 2.46 ± 0.16 | 110 ± 1.4 | 7.5 ± 0.1 |
| STPW2 | 0.06 ± 0.00 | n.a. | 2.17 ± 0.23 | 2.81 ± 0.27 | 47.8 ± 6.0 | 6.8 ± 0.1 |
| STPW3 | 7.44 ± 0.53 | 0.59 ± 0.11 | 7.90 ± 0.6 | 13.88 ± 0.74 | 115 ± 23 | 7.8 ± 0.1 |
| STPW4 | 19.12 ± 1.42 | 0.99 ± 0.14 | 18.73 ± 1.4 | 31.21 ± 1.56 | 88.1 ± 22.0 | 7.7 ± 0.0 |
| APVC USD ha−1 yr−1 | DIN Removed kg ha−1 yr−1 | TN Removed kg ha−1 yr−1 | CE USD kg DIN−1 | CE USD kg TN−1 | |
|---|---|---|---|---|---|
| CW1 | 6225 (8527) | 370 | 303 | 17 (23) | 21 (28) |
| CW3 | 3064 (4197) | 135 | n.a. | 23 (31) | n.a. |
| CW4 | 7370 (10,096) | 250 | n.a. | 30 (40) | n.a. |
| VD2 | 2809 (3848) | 78 | n.a. | 36 (49) | n.a. |
| CW7 | 5558 (7614) | 88 | n.a. | 63 (87) | n.a. |
| VD1 | 4164 (5704) | 56 | n.a. | 74 (101_ | n.a. |
| CW6 | 4996 (6844) | 41 | 154 | 121 (166) | 33 (45) |
| CW5 | 4941 (6769) | 11 | 13 | 452 (619) | 368 (504) |
| CW8 | 5813(7963) | n.a. | n.a. | n.a. | n.a. |
| CW2 | 31,445 (43,076) | 53 | 198 | 596 (817) | 159 (217) |
| STPW4 | 162,773 (222,976) | n.a. | 2007 | n.a. | 81 (111) |
| STPW2 | 68,938 (94,436) | 135 | 158 | 510 (699) | 437 (599) |
| STPW1 | 57,343 (78,551) | 77 | 79 | 741 (1015) | 722 (990) |
| STPW3 | 143,740 (196,904) | n.a. | 193 | n.a. | 746 (1023) |
Publisher’s Note: MDPI stays neutral with regard to jurisdictional claims in published maps and institutional affiliations. |
© 2021 by the authors. Licensee MDPI, Basel, Switzerland. This article is an open access article distributed under the terms and conditions of the Creative Commons Attribution (CC BY) license (https://creativecommons.org/licenses/by/4.0/).
Share and Cite
Kavehei, E.; Hasan, S.; Wegscheidl, C.; Griffiths, M.; Smart, J.C.R.; Bueno, C.; Owen, L.; Akrami, K.; Shepherd, M.; Lowe, S.; et al. Cost-Effectiveness of Treatment Wetlands for Nitrogen Removal in Tropical and Subtropical Australia. Water 2021, 13, 3309. https://doi.org/10.3390/w13223309
Kavehei E, Hasan S, Wegscheidl C, Griffiths M, Smart JCR, Bueno C, Owen L, Akrami K, Shepherd M, Lowe S, et al. Cost-Effectiveness of Treatment Wetlands for Nitrogen Removal in Tropical and Subtropical Australia. Water. 2021; 13(22):3309. https://doi.org/10.3390/w13223309
Chicago/Turabian StyleKavehei, Emad, Syezlin Hasan, Carla Wegscheidl, Matthew Griffiths, James C. R. Smart, Carlos Bueno, Liz Owen, Kambez Akrami, Mel Shepherd, Scott Lowe, and et al. 2021. "Cost-Effectiveness of Treatment Wetlands for Nitrogen Removal in Tropical and Subtropical Australia" Water 13, no. 22: 3309. https://doi.org/10.3390/w13223309
APA StyleKavehei, E., Hasan, S., Wegscheidl, C., Griffiths, M., Smart, J. C. R., Bueno, C., Owen, L., Akrami, K., Shepherd, M., Lowe, S., & Adame, M. F. (2021). Cost-Effectiveness of Treatment Wetlands for Nitrogen Removal in Tropical and Subtropical Australia. Water, 13(22), 3309. https://doi.org/10.3390/w13223309