Article

Study on the Spatial and Temporal Characteristics of Mesoscale Drought in China under Future Climate Change Scenarios

1
School of Water Conservancy & Civil Engineering, Northeast Agricultural University, Harbin 150030, China
2
Yellow River Engineering Consulting Co., Ltd., Zhengzhou 450003, China
*
Author to whom correspondence should be addressed.
Water 2021, 13(19), 2761; https://doi.org/10.3390/w13192761
Submission received: 6 August 2021 / Revised: 22 September 2021 / Accepted: 28 September 2021 / Published: 6 October 2021
(This article belongs to the Section Water and Climate Change)

Abstract

:
In this study, precipitation, and temperature data from HadGEM2-ES under Representative Concentration Pathways (RCPs) 4.5 and 8.5 were used to evaluate drought in China in the 21st century. The K-means clustering algorithm was used to analyze the regional characteristics of the dry hazard index (DHI) in China, and the impact of climate change on the variation trend and periodicity of regional drought in China was explored. The results show that the temperature and potential evapotranspiration (PET) of all clusters have an increasing trend under the two RCPs, and the precipitation of most clusters shows a significantly increasing trend. The drought index calculated by the standardized precipitation-evapotranspiration index (SPEI) is higher than those calculated by the standardized precipitation index (SPI) and standardized effective precipitation evapotranspiration index (SP*ETI). The variation trends of drought intensity and frequency in China are not significant in the 21st century; however, the local variation trends are significant. The droughts in most parts of the Xinjiang Province, northern Tibet and western Qinghai Province show significantly increasing trends. According to the DHI analyses and the variations in the drought area ratio, with increases in greenhouse gas concentrations, the droughts in central and western China will become more severe, and drought will spread to the eastern areas of China. In the case that both precipitation and temperature may increase in the future, the increase in evapotranspiration caused by temperature rise will greatly affect drought dynamics. The main drought periodicity in China in the 21st century is 1~3.6 years. Drought is affected by climate change but not significantly.

1. Introduction

Drought is a long-term sustainable natural phenomenon with a wide spatial distribution [1], changing the flow characteristics of the underlying surface and affecting hydrological process. The latest studies show that with the further development of global warming, drought will be more severe in the future [2,3,4,5,6]. Therefore, there is an urgent need to build a reliable information system to predict the occurrence and distribution of drought, which may help to prevent and mitigate the associated disasters, and play an important role in hydrological forecast [7]. Generally, precipitation, temperature, and evaporation data can be used to calculate drought indices and predict drought trends.
China is a country with frequent and severe drought disasters [8]. In recent decades, China has suffered several long-term extreme droughts, which caused huge economic losses and ecological damage [9,10,11]. From 2009 to 2010, severe drought in southwestern China affected 61.3 million people, with the area of crop failures reaching 1.1 million hectares. Moreover, global warming is likely to worsen China’s drought situation. Therefore, the analysis and prediction of drought development trends are conducive to forecast the changes of various elements in the hydrological process and reduce the impact of drought on the overall development of the country.
In recent years, climate projections have been widely used to assess drought caused by climate change in the 21st century [1,6,12,13,14,15,16,17,18]. There are also many studies on the impact of climate change on drought in China. The probability of warm years is projected to significantly increase, and the occurrence probability of hot drought events (SPEI < −1.0) will increase to nearly 100% by the year 2050, even though the annual precipitation is projected to increase across China in the future [5]. Yao et al. [6] analyzed regional drought change in China based on RCMs (regional climate models). In addition, temperature anomalies are expected to play an important role in drought occurrences by greatly amplifying evaporative demand and thereby increasing overall drought intensity and impact [4,19,20,21].
A variety of drought indices, including the Palmer drought severity index (PDSI) [22], standardized precipitation index (SPI) [23] have been proposed to analyze the cause and degree of drought. The calculation of PDSI requires long-term observation data, so it is not suitable for large-scale research. To solve this problem, McKee et al. [23] proposed the SPI, which can be used for multiscale time scale analysis and can be used to meet a variety of water monitoring needs. The SPI only considers rainfall and has some limitations in reflecting the characteristics of drought. Vicente-Serrano et al. [24,25,26] proposed the SPEI based on the SPI. Since it was proposed in 2010, the SPEI has been widely used in different research areas [27,28]. Maccioni et al. [29] developed a new standardized effective precipitation evapotranspiration index (SP*ETI), which not only considers evapotranspiration but also takes into account effective precipitation. In addition, there are many complex drought indices, such as the objective blend of drought indicators (OBDI) [30], aggregated drought index (ADI) [31], joint drought index (JDI) [32], and multivariate standardized drought index (MSDI) [33].
Selection of the drought index depends not only on the factors influencing the drought, but also on the difficulty of obtaining the data reflecting those factors. As mentioned above, the calculation of drought indices, including the OBDI, ADI, and JDI, is relatively complex, and the function distribution has not been recognized. Therefore, a variety of drought indices, including, the SPI, SPEI, and SP*ETI, are proposed to analyze drought characteristics of China in this paper, some of which have been widely used in China. Previous studies have confirmed that the two indices could capture the real drought events well, while the SPEI is often better than the SPI in capturing drought conditions, especially in humid areas [34,35,36]. For the observed data for China over the past 50 years, the drought evaluation effect of the SPEI is better than that of the SPI. However, for the drought forecast in the next 100 years, the advantages and disadvantages of various indices have not been analyzed. Therefore, the focus of this paper is to use the SPI, SPEI, and SP*ETI to analyze the drought situation in China, and to compare the resultant evaluation data.
The drought area generally presents obvious regional distribution characteristics. It has been widely studied to partition the drought area to achieve a comprehensive evaluation of regional drought characteristics. A variety of partition methods have been proposed according to the precipitation [6,37,38,39], drought hazard [40], vegetation type [41,42] and terrain characteristics [5,39]. By comparing these partition methods, it can be found that most of the studies are based on an individual characteristic index, which does not easily provide a comprehensive reflection of the drought characteristics of the whole country. The partition rules of drought areas have not been clear and have been mostly based on experience. To comprehensively evaluate the drought characteristics, Daneshvar et al. [43] proposed the drought hazard index (DHI) based on the above four indices, without giving a specific partition method for the drought characteristic area. Therefore, a partition method based on the distribution features of the DHI is proposed to comprehensively assess drought characteristics in China.
Research on the change in drought characteristics in China has mainly analyzed the temporal and spatial changes in the drought intensity, frequency, and area [5,6,44,45,46,47,48]. Wang et al. [44] analyzed the spatial distribution characteristics of the drought frequency and intensity in Southwest China. Huang et al. [46] analyzed the spatial distribution characteristics of the drought frequency and duration in South China. Yao et al. [6] partitioned drought regions in China and analyzed the changes in the drought frequency, intensity, and duration in each region. Although the drought partition method, based on individual drought characteristics, was applied in the above research and drought analysis of each partition, a single drought index could only correspond to a situation and it was still difficult to comprehensively reflect the drought changes.
Above all, the impact of regional climate change on drought in China has been extensively studied, and many valuable results have been obtained, although there are still some deficiencies in the following aspects. (1) In the study of regional drought in China, for the observed data for China over the past 50 years, the drought evaluation effect of SPEI is better than that of SPI. However, for the drought forecast in the next 100 years, the advantages and disadvantages of various indices have not been analyzed. (2) The partition rules of drought areas have not been clear and have been mostly based on an individual method or experience. (3) Studies of the temporal variation in drought have mostly focused on the variation trend, but there is little research on the comprehensive considerations of the drought trend, frequency, area, and periodicity.
To analyze the impact of climate change on regional drought in China, the following three aspects of the research are undertaken. First, the applicability of RCMs is analyzed. Second, a partition method based on distribution features of DHI is proposed to comprehensively assess drought characteristics in China, with a comprehensive consideration of drought trends, frequency, area, and periodicity. Finally, the constructed predicting model of mesoscale drought in China is used to analyze the spatial and temporal characteristics of the study area, based on DHI partitions.

2. Materials and Methods

2.1. Sources of Observed Data and Study Area

The observed data are based on the daily value dataset of surface climate data in China (Version 3.0) provided by the China meteorological data sharing service network (https://www.resdc.cn/data.aspx?DATAID=263, accessed on 1 June 2020). The location of each station is shown in Figure 1. Since there are few observation stations in the South China Sea, mainland China is selected as the study area and is surrounded by the green boundary shown in Figure 1. 0.25° × 0.25° grid data, with a period from 1960 to 2005, are obtained by the inverse distance weight (IDW) method.

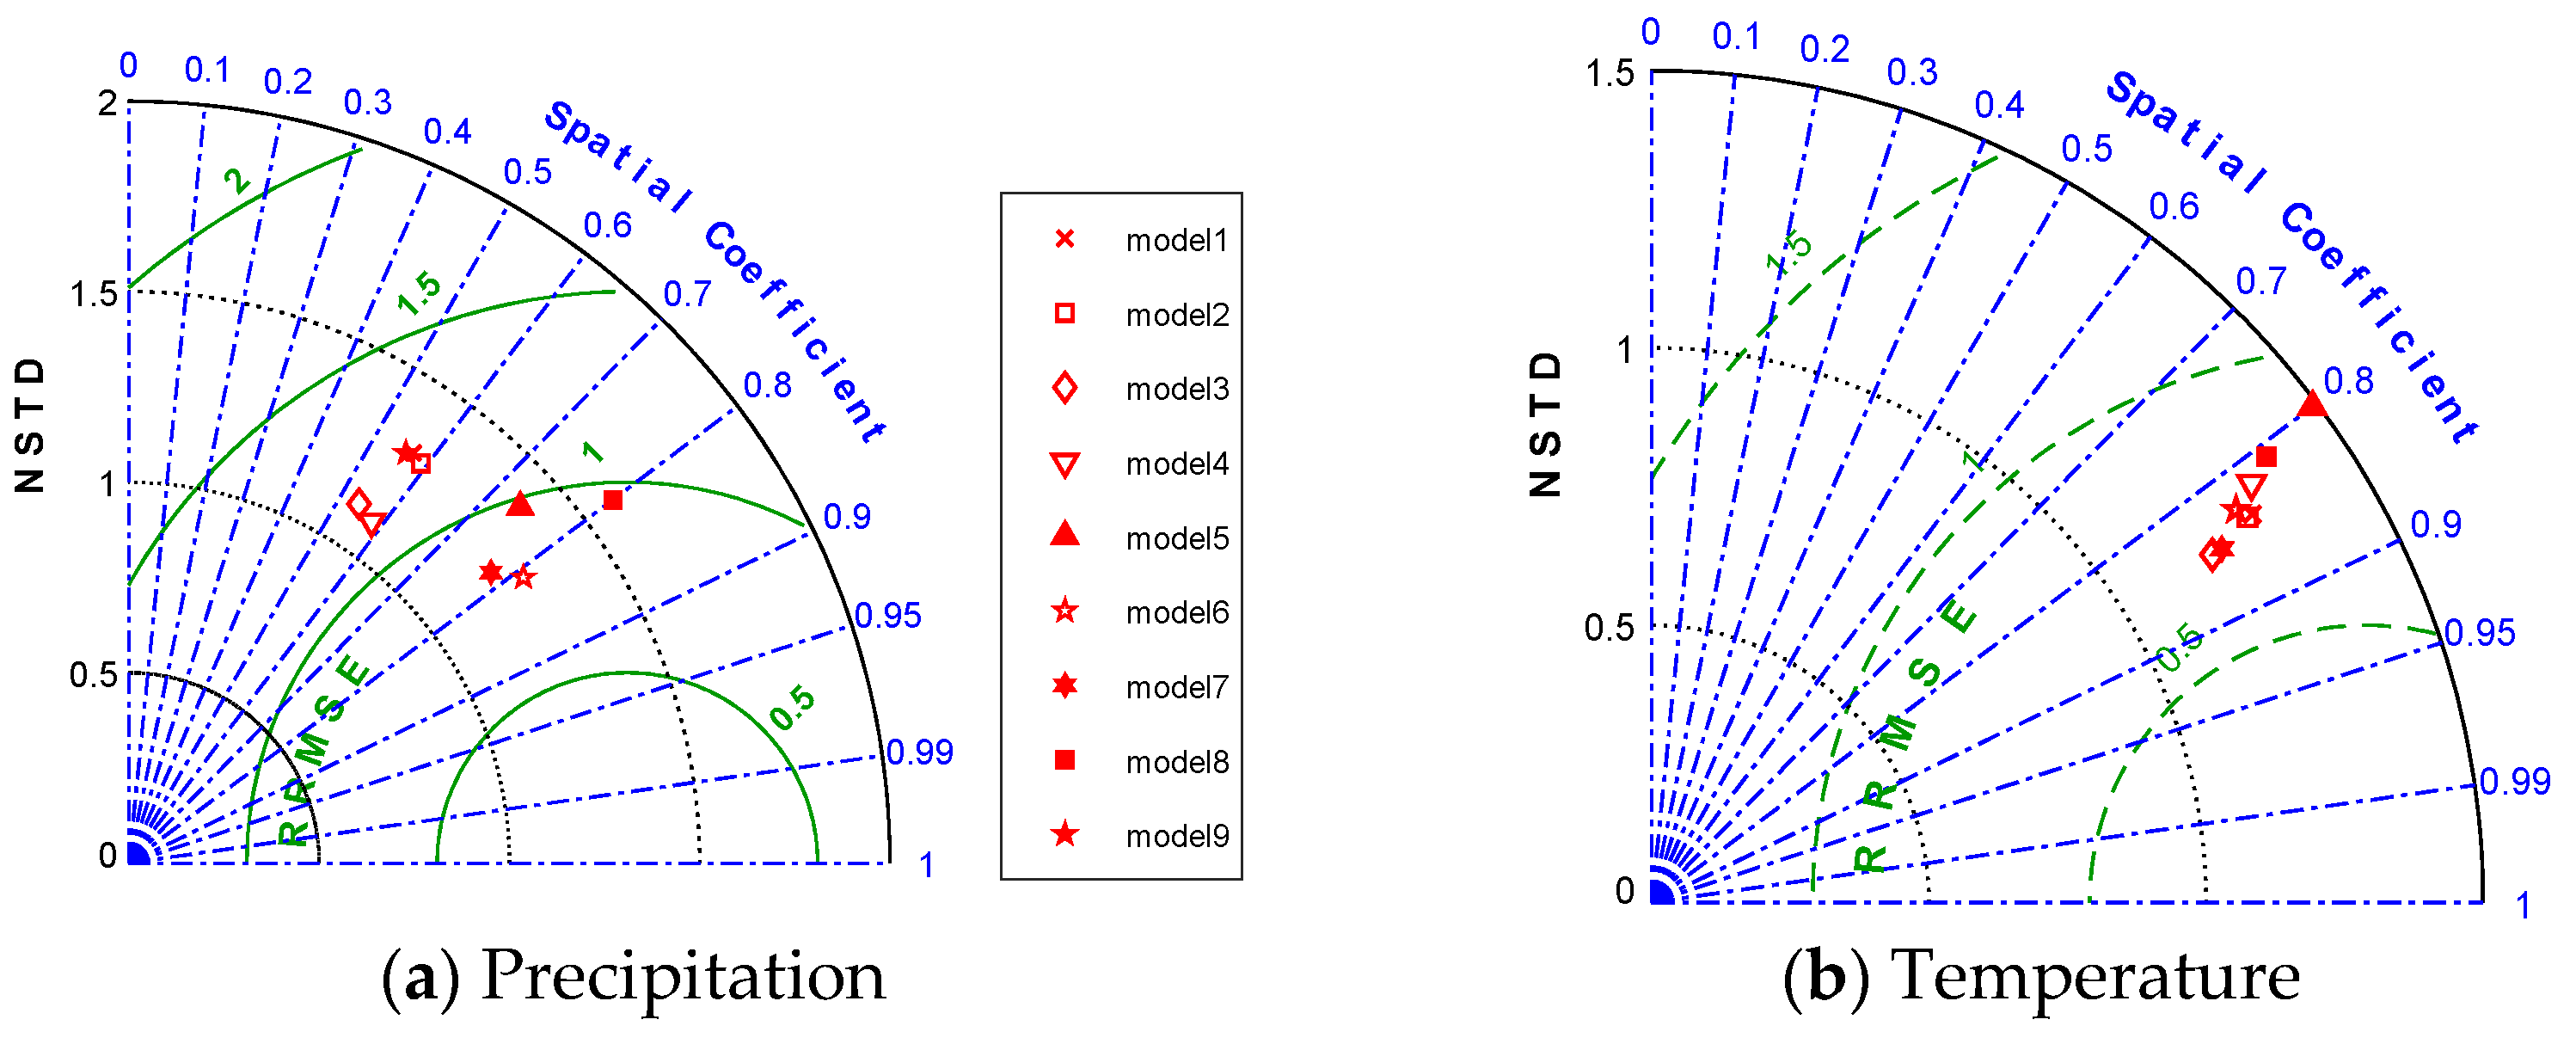
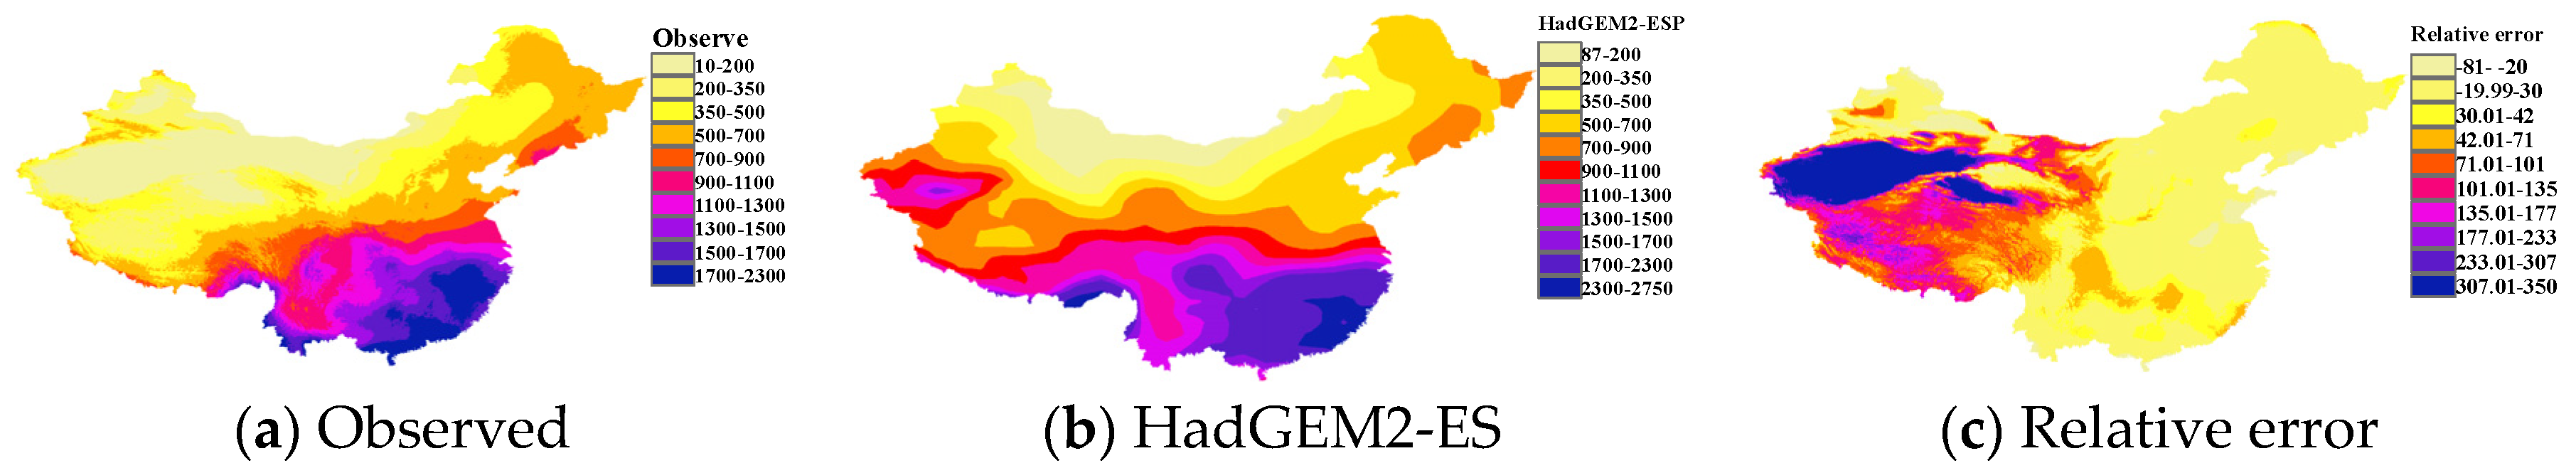
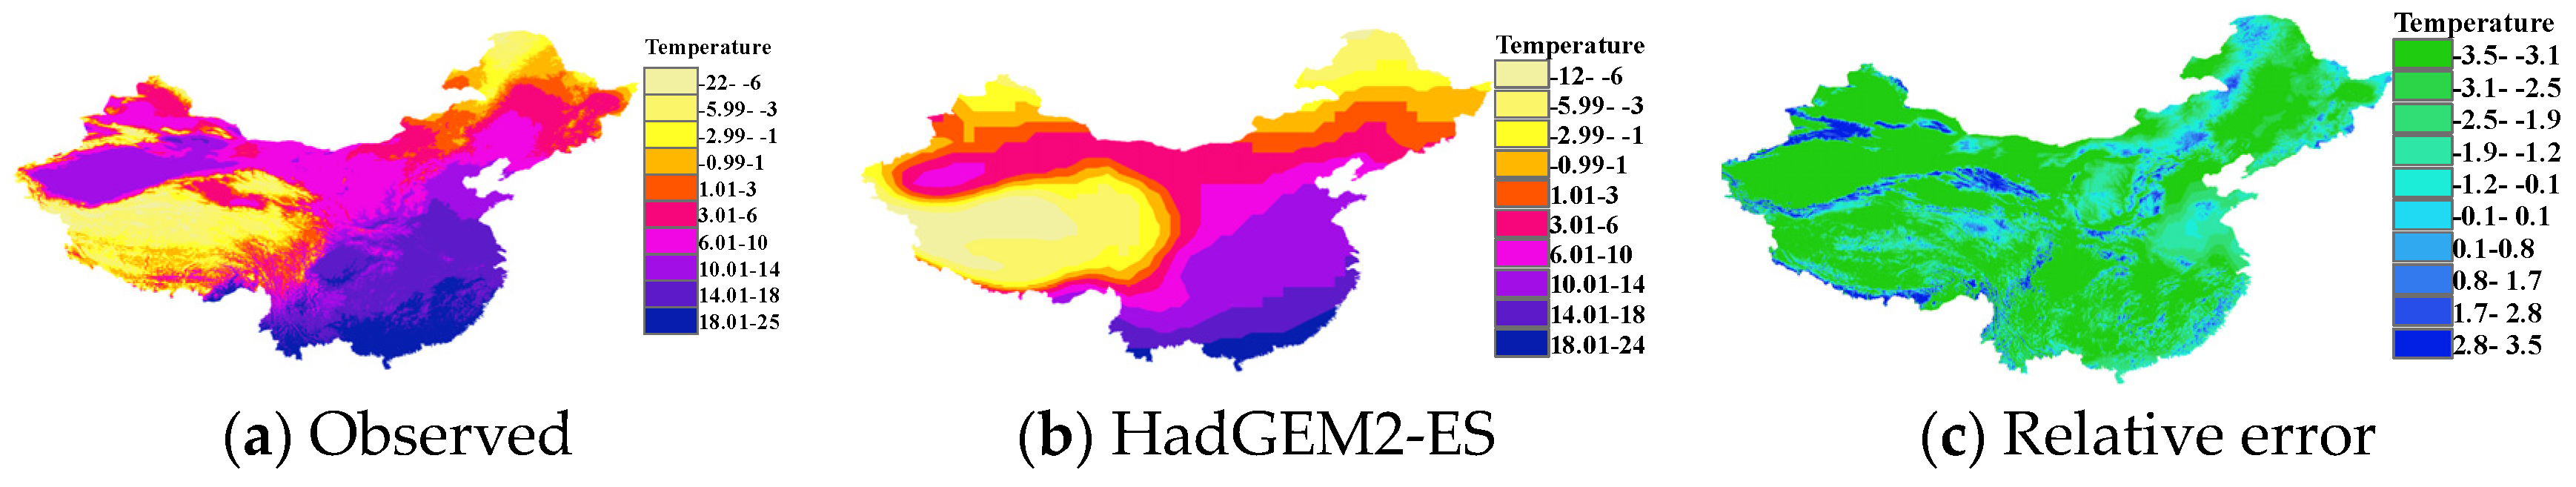
2.2. Selection of RCMs for Future Projected Precipitation Data

In this paper, an RCM based on the GCM (global climate model) model is adopted; in the GCM, there are several prediction models [49,50], so the forecast of climate change is uncertain [51]. There are many models to predict future climate change, so it is necessary to determine the proper RCMs for describing the regional climate change in China. According to the research results on the applicability of RCM [49,50,52], 25 models were selected as the preliminary RCMs. Considering tremendous computation, it is difficult to evaluate the applicability of each RCM. Based on the evaluation results of 25 preliminary RCMs in previous studies and the performance of the RCMs (see Section 3.2) tested by the comparison of the measured and simulated values, the RCMs which can describe the regional climate change in China is finally selected.
Sperber et al. [50] used the GCM to study summer precipitation in Asia and found that the simulation results of models CNRM-CM5, NCAR-CCSM4, NorESM1-M, GFDL-CM3, and GFDL-cm2.1 had little deviation from the actual rainfall. McSweeney et al. [52] used the HadGEM2-ES, CCSM4, CNRM-CM5, MPI-ESM-LR, MPI-ESM-MR, GFDL-ESM2G, GFDL-ESM2M, and GFDL-CM3 models to establish a satisfactory model of special climate conditions in South Asia. Jiang et al. [53] found that the CSIRO-Mk3.6.0, BNU-ESM, MIROC5, NorESM1-M, HadGEM2-AO, and GFDL-ESM2M models were effective in simulating the average wind speed. Based on the spatial distribution characteristics of annual average precipitation in Central Asia simulated by Wu et al. [54], the low values of CanESM2, CNRM-CM5, and MRI-CGCM3 are relatively close to the actual low values. According to the applicability of the RCMs and the evaluation of the accuracy of various RCMs in the above literature, the RCMs to be optimized are shown in Table 1. The data in Table 1 was obtained from the website as follows (https://climate-scenarios.canada.ca/?page=gridded-data, accessed on 1 June 2020). The IDW method is used in all the models to obtain the 0.25° × 0.25° grid data.

2.3. Drought Indices

For most parts of China, annual precipitation is distributed unevenly in time, with more monthly monsoon rainfall and less rainfall in other periods, so a time scale of 12 months is used. The three indices calculated on a time scale of 12 months can be represented as SPI12, SPEI12 and SP*ETI12. Many studies use a time scale of 12 months to reflect the characteristics of long-term drought [5,17,18,55].
SPEI and SP*ETI can be estimated using the following equations:
First, precipitation is selected as the statistic to calculate the SPEI and SP*ETI.
D ( i ) = P ( i ) P E T ( i )
where i represents the series number of the i th time segment; D ( i ) is water shortage content on i th; P is the precipitation; and PET is the evapotranspiration, which can be calculated by the Thornthwaite method [56].
D ( i ) = P ( i ) E P ( i )
EP is the effective precipitation and can be calculated by the Soil Conservation Service (SCS) formula [57].
D is aggregated at a different time scale (n) as:
D = j = i n + 1 j = i D j
The three-parameter log-logistic distribution [24] is selected as the optimum fitting distribution. The probability density function f(x) and cumulative distribution function F(x) are listed below:
f ( x ) = β α ( x γ α ) β 1 [ 1 + ( x γ α ) ] 2
F ( x ) = [ 1 + ( α x γ ) β ] 1
where α, β, and γ are scale, shape, and location parameters, respectively.
Finally, the SPEI is calculated by transforming F to the standard normal distribution as shown in Equation (5).
SPEI = ϕ 1 ( F )
The detailed calculation for Equation (6) refers to the research of Vicente-Serrano et al. [24], and the selection of the fitting distribution refers to the research of McKee et al. [23].
The next process of drought analysis is to determine the key parameters. The L-moment approach is adopted, in which Bayesian information criteria (BIC) are used to determine the optical fitting distribution.

2.4. Regionalization of Droughts

Generally, the regional characteristics of droughts are described to divide the drought area. The severity of a drought depends on the duration, intensity, frequency, and extent of specific drought episodes [43]. In this study, the DHI [43] is used to comprehensively reflect the characteristics of drought. Cluster analysis is used to analyze the distribution characteristics of the DHI in China; then, the regionalization of droughts is conducted. The calculation of DHI requires four sub-indicators [29,43], which can be shown as follows:
(1)
The number of drought events observed in a particular period (FRQ);
(2)
The number of drought events with durations greater than 24 months (FRQ24);
(3)
The maximum observed severity across the observed episodes (Smax);
(4)
The maximum duration in months across the drought episodes (Dmax).
D H I = w 1 × s c o r e ( D max ) + w 2 × s c o r e ( S max ) + w 3 × s c o r e ( F R Q 24 ) + w 4 × s c o r e ( F R Q )
where w1, w2, w3, and w4 are the relevant weights that are estimated using an analytical hierarchical process (AHP) [29,58], and the four relevant weights in this research are 0.25, and score represents the score of the rating district of the study area. The detailed calculation methods are as follows. First, the start time, end time of drought incidents, and drought intensity are selected according to drought indices. Second, FRQ (the time length is a year), FRQ (24), Smax and Dmax are calculated. Third, the range of the subindicator weight series data of each grid in the study area is analyzed. The entire interval is divided equally into four segments, and the score is given according to the position of the data to be evaluated in the subindicator interval. Last, the detailed evaluation method provided previous research [29,43].

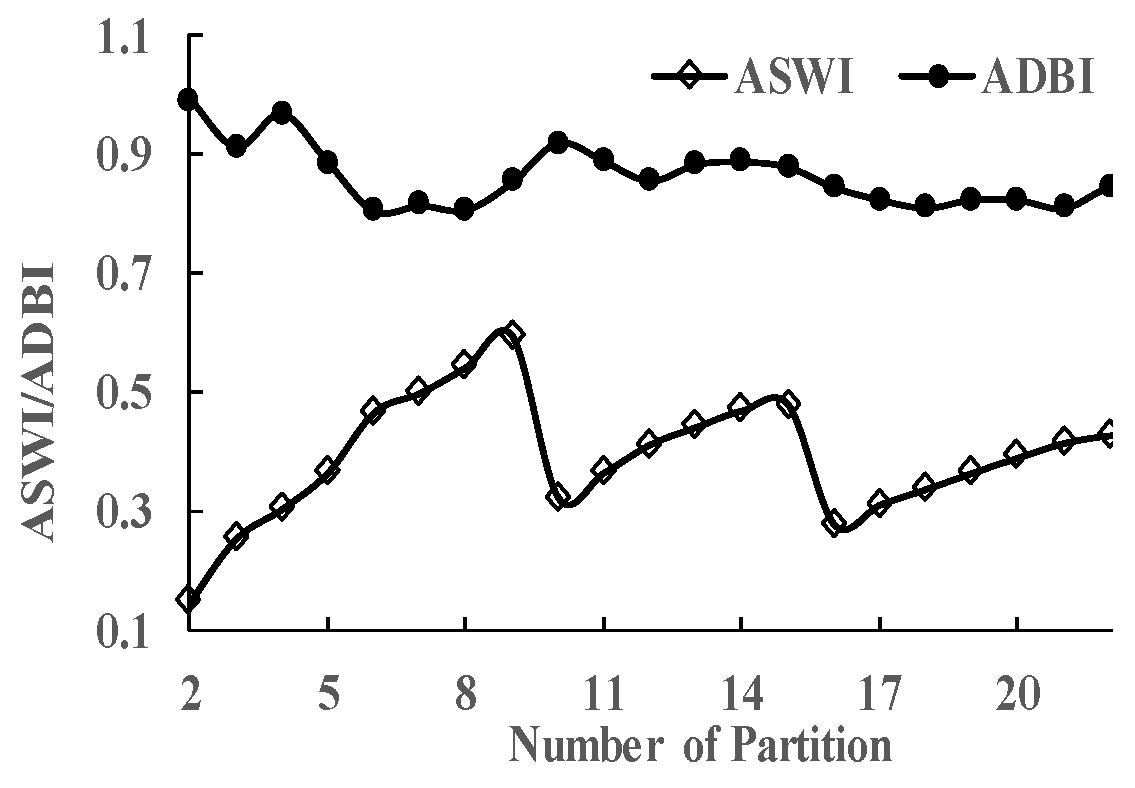
2.5. Cluster Analysis

The goal of cluster analysis is to classify the collected data on the basis of similarity; cluster analysis is widely used in many fields. There are many methods of cluster analysis for drought regionalization, such as the region of influence method [59], entropy-based method [60], hierarchical clustering, fuzzy clustering and K-means clustering [61,62]. After studying and comparing these methods, it is found that machine learning algorithms are realized simply and easily [61,63]. Because of the simplicity and efficiency of the K-means clustering algorithm, it has become the most widely used clustering algorithm. However, it can only be applied to continuous data, and the number of categories must be manually specified before a clustering operation. Sometimes, the local optimum cannot be avoided and local optimum is not as good as the global optimum, and the convergence speed is relatively slow in large-scale data. Therefore, the K-means clustering algorithm [64] is used to regionalize the drought area. After determining the method of drought regionalization, appropriate cluster validity indices are used to determine the number of clusters, i.e., the number of partitions. There are many clustering validity indices, such as the Dunn index [65], average silhouette width index [66] and Davies and Bouldin index (DBI) [67]. In this study, the average silhouette width index (ASWI) and the DBI are used to determine the number of clusters. Details of these indices can be found in Goyal and Gupta [63].
The objective function that the k-means algorithm attempts to minimize can be shown as Equation (8).
J = J = 1 K i = 1 M Y i C j 2
where, Y i C j 2 is the squared Euclidean distance between the ith data point and jth cluster center in multidimensional space of data attributes. M is the total number of data points and K is the number of clusters. Initially, the coordinates of K-cluster centers are guessed randomly, and each point is assigned to the nearest cluster center. Cluster centers are updated by averaging the coordinates in particular clusters and reassignment is made to obtain new clusters. This process is repeated until convergence is reached. Since the final result is very sensitive to the initially used cluster center, the algorithm is repeated again and again with different initial random cluster centers for obtaining the best results.

2.6. Trend and Periodicity Analysis

The modified Mann–Kendall test is adopted in this study [68,69,70]. In this study, Fourier transform is used to analyze the periodic variation in drought; the specific theory can be seen in the research of Moreira et al. [71].
Above all, the detailed methodology of this study can be summarized as follows. First, the SPI, SPEI, and SP*ETI are selected to evaluate the drought characteristics in China. Second, based on the above four indices, the drought hazard index is used to obtain characteristic clusters in the study area, and the applicability of RCMs is analyzed. Finally, the comprehensive impact of climate change on spatial and temporal characteristics of drought in China is constructed.

3. Results

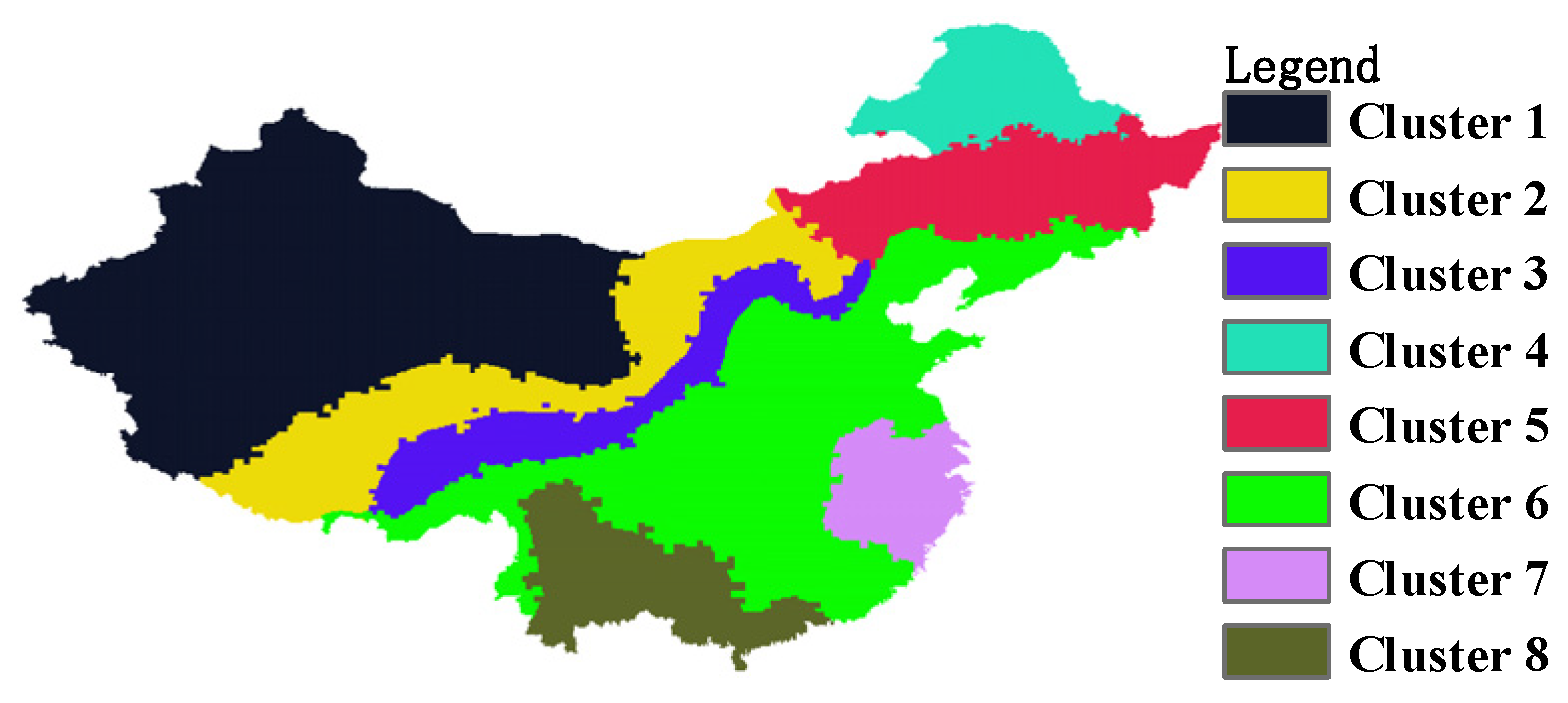
3.1. Identification of Drought Clusters

Drought characteristics, such as the average severity, duration, and interval are obtained using the run approach method. According to the run approach method, the duration of drought is defined as the time period when the drought indices (SPI12, SPET12 and SP*ET12) are less than −0.5. The cumulative sum of the difference between the absolute value of SPI and the critical value of 0.5 in the drought duration is defined as the drought intensity. The values of w1, w2, w3, and w4 are all set to 0.25 according to published data [29,43]. Based on the drought index, and DHI is calculated, as shown in Figure 2. K-means clustering is utilized to identify clusters in the study area. Lower values of DBI and higher values of ASWI correspond to well-separated clusters in which the DHI values are close. In contrast, the DHI values in clusters vary widely. According to historical DHI values, the average DHI is obtained (Figure 2). The variations in DBI and ASWI corresponding to the average DHI with the partition number of drought clusters is shown in Figure 3. There are two optimal drought clusters in Figure 3, which clearly cannot describe the hydrological and meteorological characteristics of the regional climate in China. The spatial distribution differences of regional climate data in China are relatively large. Considering the differences in climate change in China, Chen and Sun optimally divided China into six drought clusters [5]. From Figure 3, the number of suboptimal drought clusters is 8 and 9. Since the clusters obtained by the two partition methods are similar and the ninth cluster is relatively small (in the partition of 9 clusters), eight clusters are used in this paper (Figure 4).

3.2. Performance Evaluation of RCMs for Drought Simulation

Based on the observed and simulated values of rainfall and temperature, the performance of various RCMs was examined using the Taylor diagram method (Figure 5). The values of SC and RRMSE of model 6 are better than those of model 7, so model 6 (i.e., HadGEM2-ES) is selected preferentially for further analysis. To test the performance of the HadGEM2-ES model, the measured and simulated values of annual average precipitation (Figure 6) and temperature (Figure 7) are obtained by the IDW method and compared. The linear deviation correction method [72] is used for data processing. The variation processes of monthly precipitation and temperature in the clusters from January 1959 to December 2005 are shown in Figures S1 and S2, respectively. The calculated and observed values of precipitation and temperature in the clusters of the HadGEM2-ES model fit well.
To analyze the impact of simulated precipitation and temperature of HadGEM2-ES on reflecting drought, with the drought clusters in Figure 4, the variations in SPI12, SPEI12, and SP*ETI12 with time are shown in Figures S3–S5, respectively. As shown in Figures S3–S5, HadGEM2-ES can reflect the actual drought characteristics of most clusters in the study area.
From 2006 to 2100, the temperatures of the cluster areas under RCP 4.5 and RCP 8.5 are shown in Figure S6. The temporal variations in the cluster averages of precipitation and potential evapotranspiration under RCP 4.5 and RCP 8.5 are shown in Figures S7 and S8. Temperature and PET under both RCPs obviously increase (Table 2). Except for Cluster 4 and Cluster 5, precipitation in other areas shows an obvious increasing trend. In addition, under RCP 4.5, the Sen’s slope of PET is higher than that of precipitation only in Cluster 1, Cluster 4 and Cluster 5. Under RCP 8.5, the Sen’s slope of PET is commonly higher than that of precipitation except in Cluster 2 and Cluster 3.

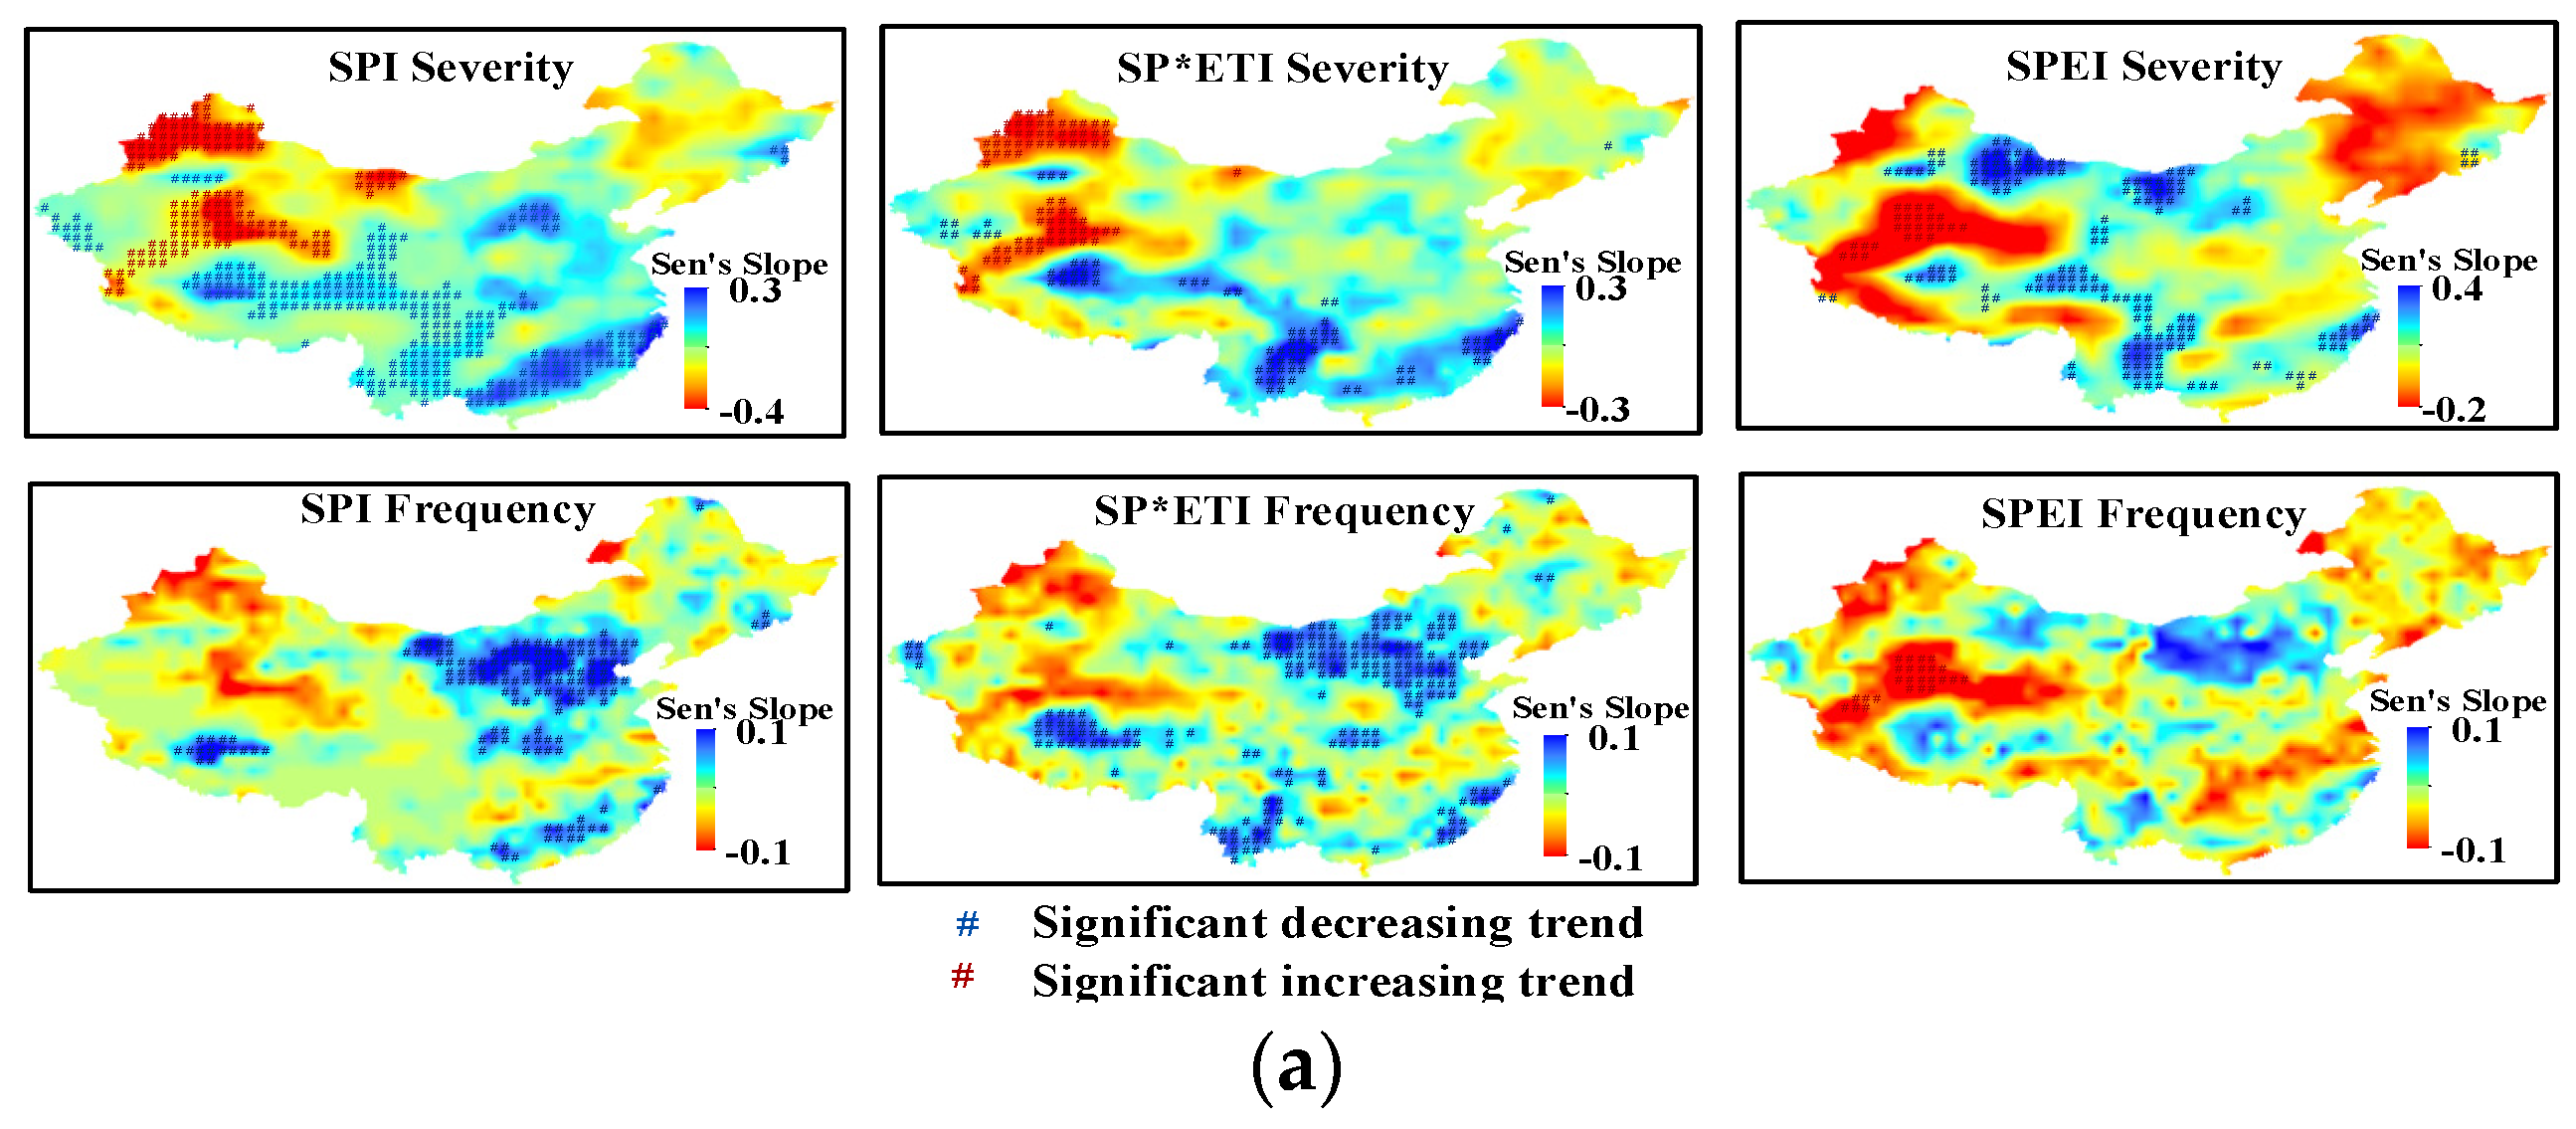
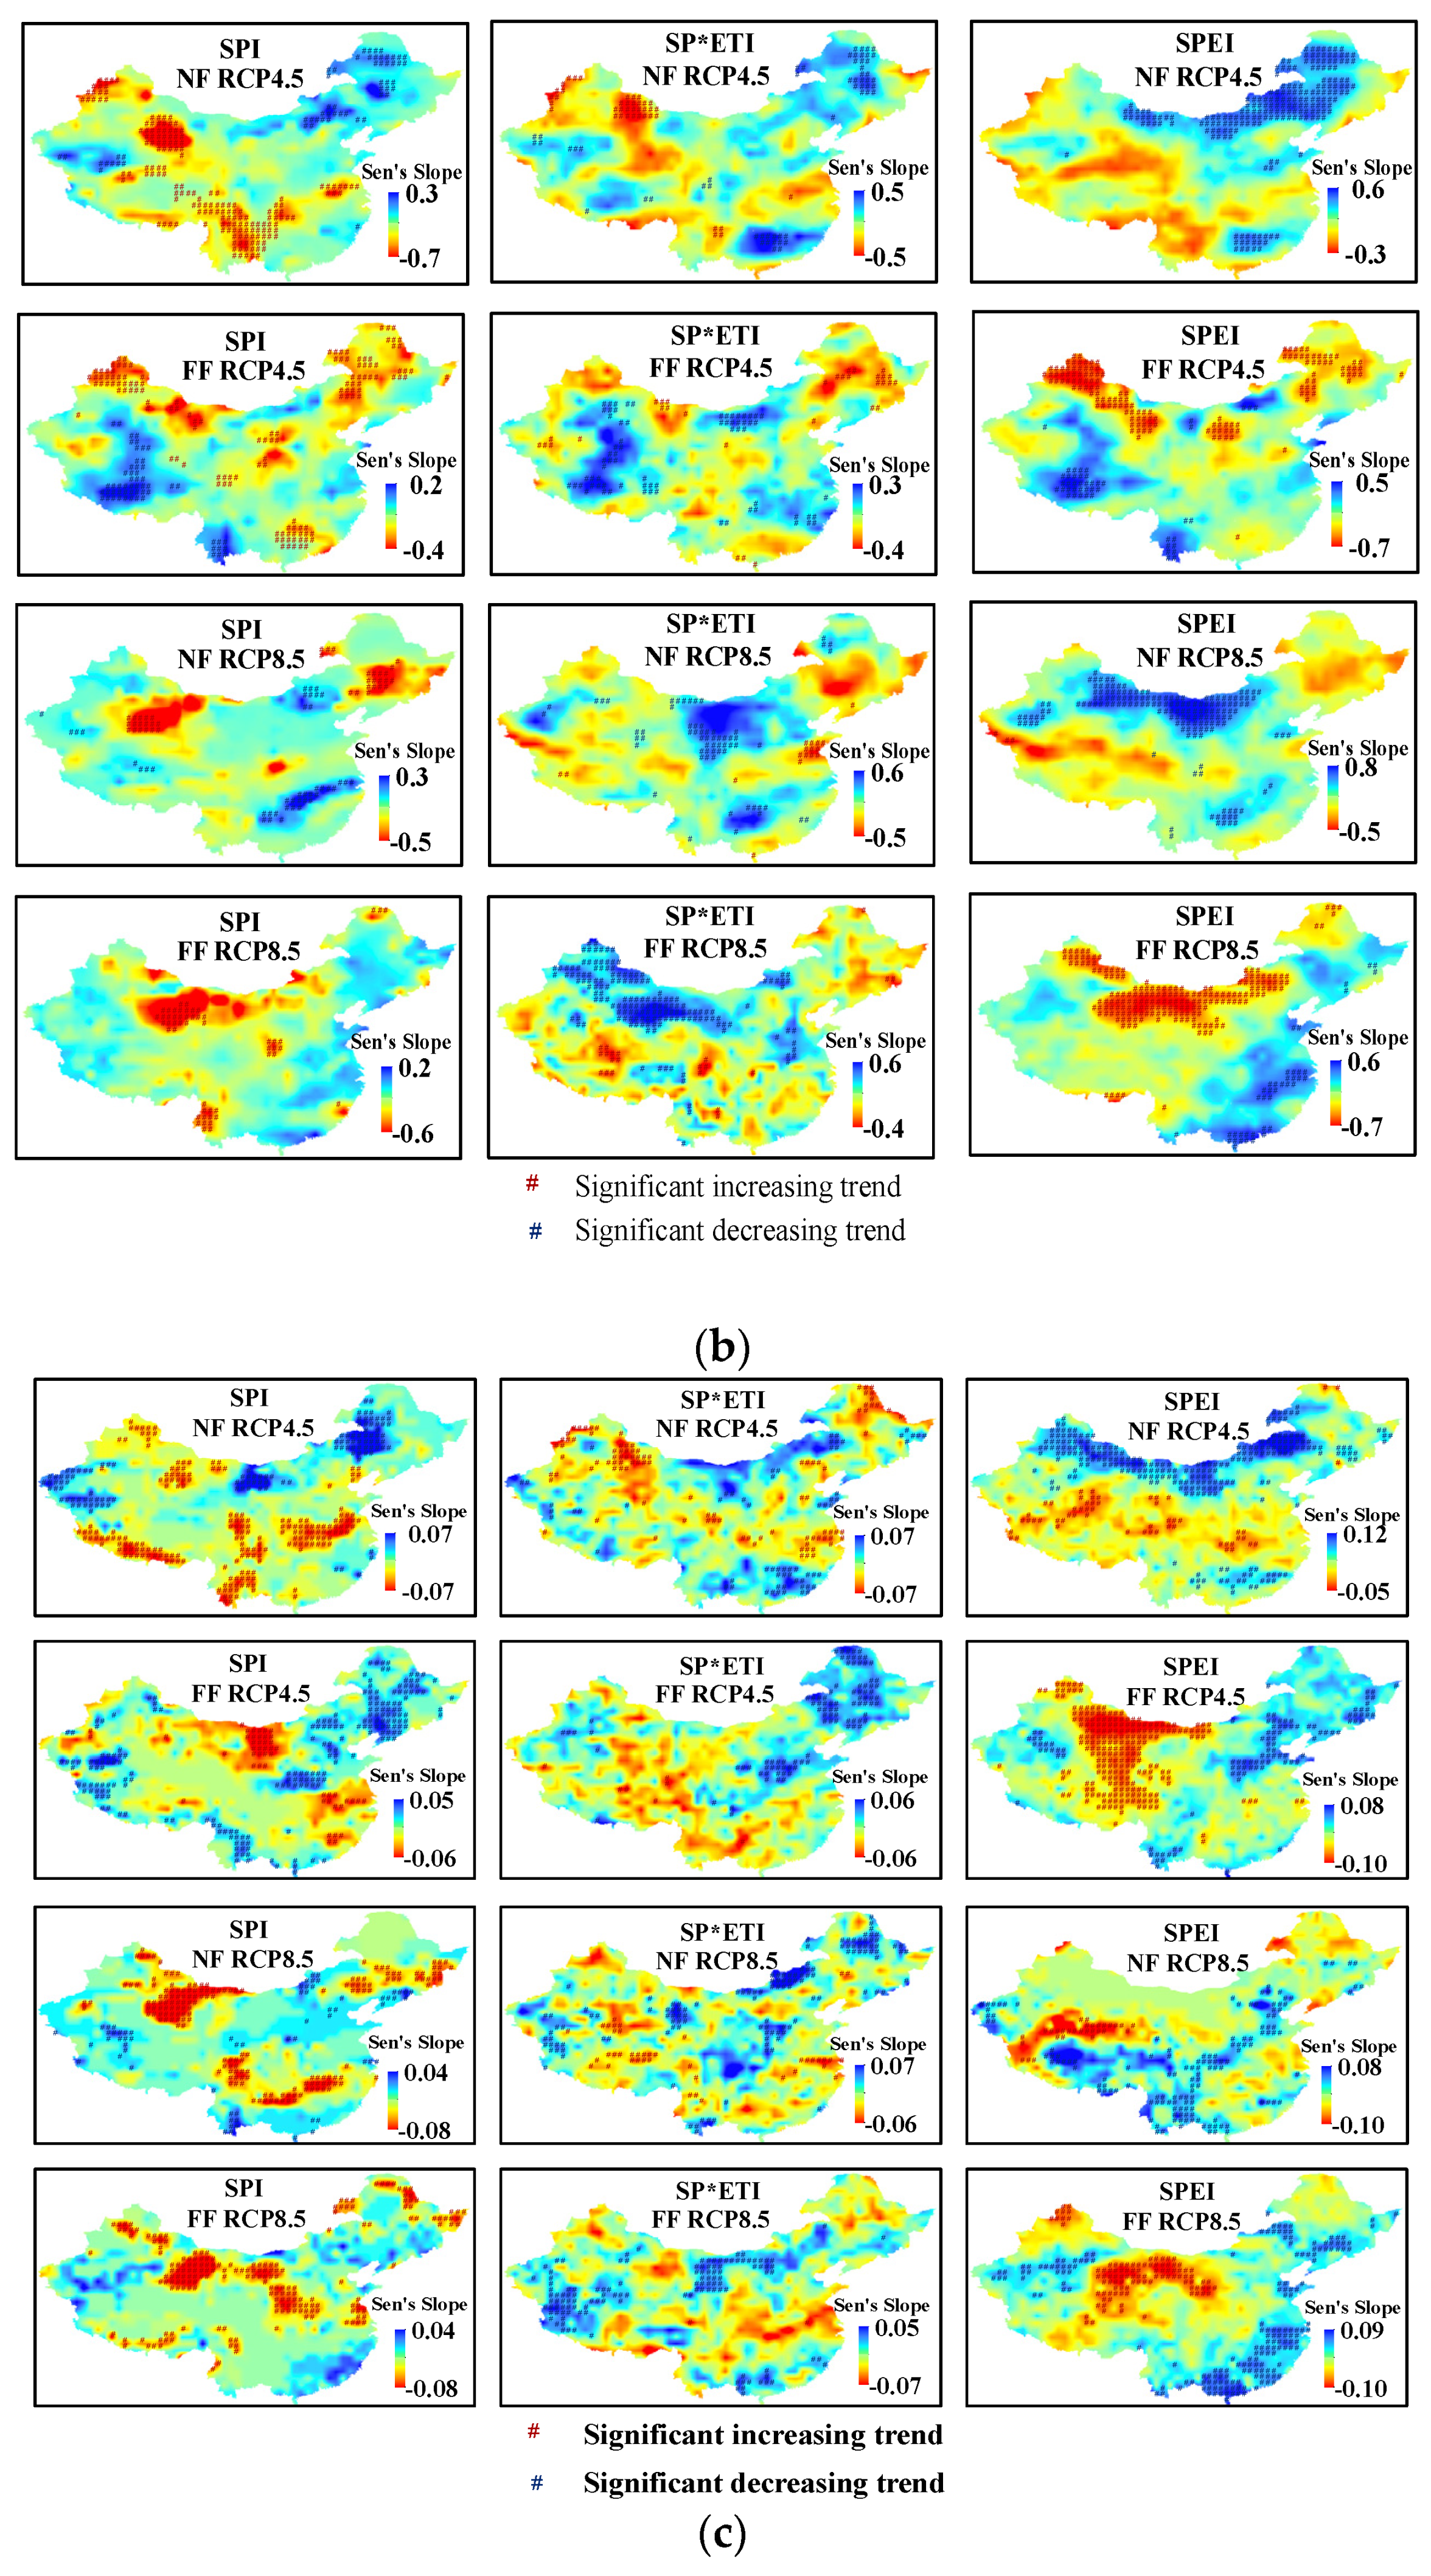
3.3. Trend Analyses of Drought Severity and Frequency

The time span from 1960 to 2100 is divided into three periods: the historical period (Hist, 1960–2005), the near-future period (NF, 2021–2050), and the far future period (FF, 2071–2100), unit of frequency is times/year. Mann–Kendall and Sen’s slope tests were used to evaluate drought severity and the variation trend of drought frequency over the above three periods, as shown in Figure 8. All drought indicators over Hist show a similar pattern. The average values of the Sen’s slope of clusters corresponding to Figure 8a–c are shown in Table 3.
The variation trend of drought severity and the frequency of the clusters in China over the 21st century can be summed as follows. The drought severity and frequency of most areas of Cluster 1 show an increasing trend over the historical period. According to the SPI and SP*ETI, drought severity shows an increasing trend under RCP 4.5. Drought severity will decrease over NF and increase over FF under RCP 4.5, based on the SPEI analysis results. Under RCP 8.5, both the SPI and SPEI drought indicators show that the drought severity of Cluster 1 shows a decreasing trend.
For Cluster 2, based on the analysis results of the SPEI and SP*ETI, the drought severity decreased under RCP 4.5. Over NF and FF, the drought severity and frequency of Cluster 1 and Cluster 2 increase significantly in Northern Xinjiang Province, Northwestern Gansu Province, and western Inner Mongolia.
For Cluster 3, drought severity and frequency show a decreasing trend over Hist. However, drought frequency increased over NF and FF based on the analysis results of the SPEI and SP*ETI. Under RCP 4.5, drought severity does not show obvious variation trends over NF and FF.
The drought severity and frequency of Cluster 4 and Cluster 5 in northeastern China show an increasing trend over Hist. According to the SPI and SPEI, drought severity over NF and FF shows an increasing trend.
The drought severity and frequency values of Cluster 6, Cluster 7, and Cluster 8, located in central and southern China, show a decreasing trend over Hist. According to the SPI drought indicator, the drought severity and frequency of the 3 clusters will have an increasing trend over NF and FF. However, the drought severity and frequency of the three clusters will decrease over NF and FF based on the analysis results of the SP*ETI and SPI (Table 3).
Generally, the variation trend of drought severity and frequency in China in the 21st century is not obvious, but the local variation trends are much more significant. Drought in most parts of Xinjiang Province(73°40′ E–96°23′ E, 34°22′ N–49°10′ N), Northern Tibet(78°25′ E–99°6′ E, 26°43′N–36°31′ N), and Western Qinghai Province(89°24′ E–103°4′ E, 31°24′ N–39°4′ N) show a significantly increasing trend. Drought in the North China Plain and China’s southeastern coast shows a decreasing trend.

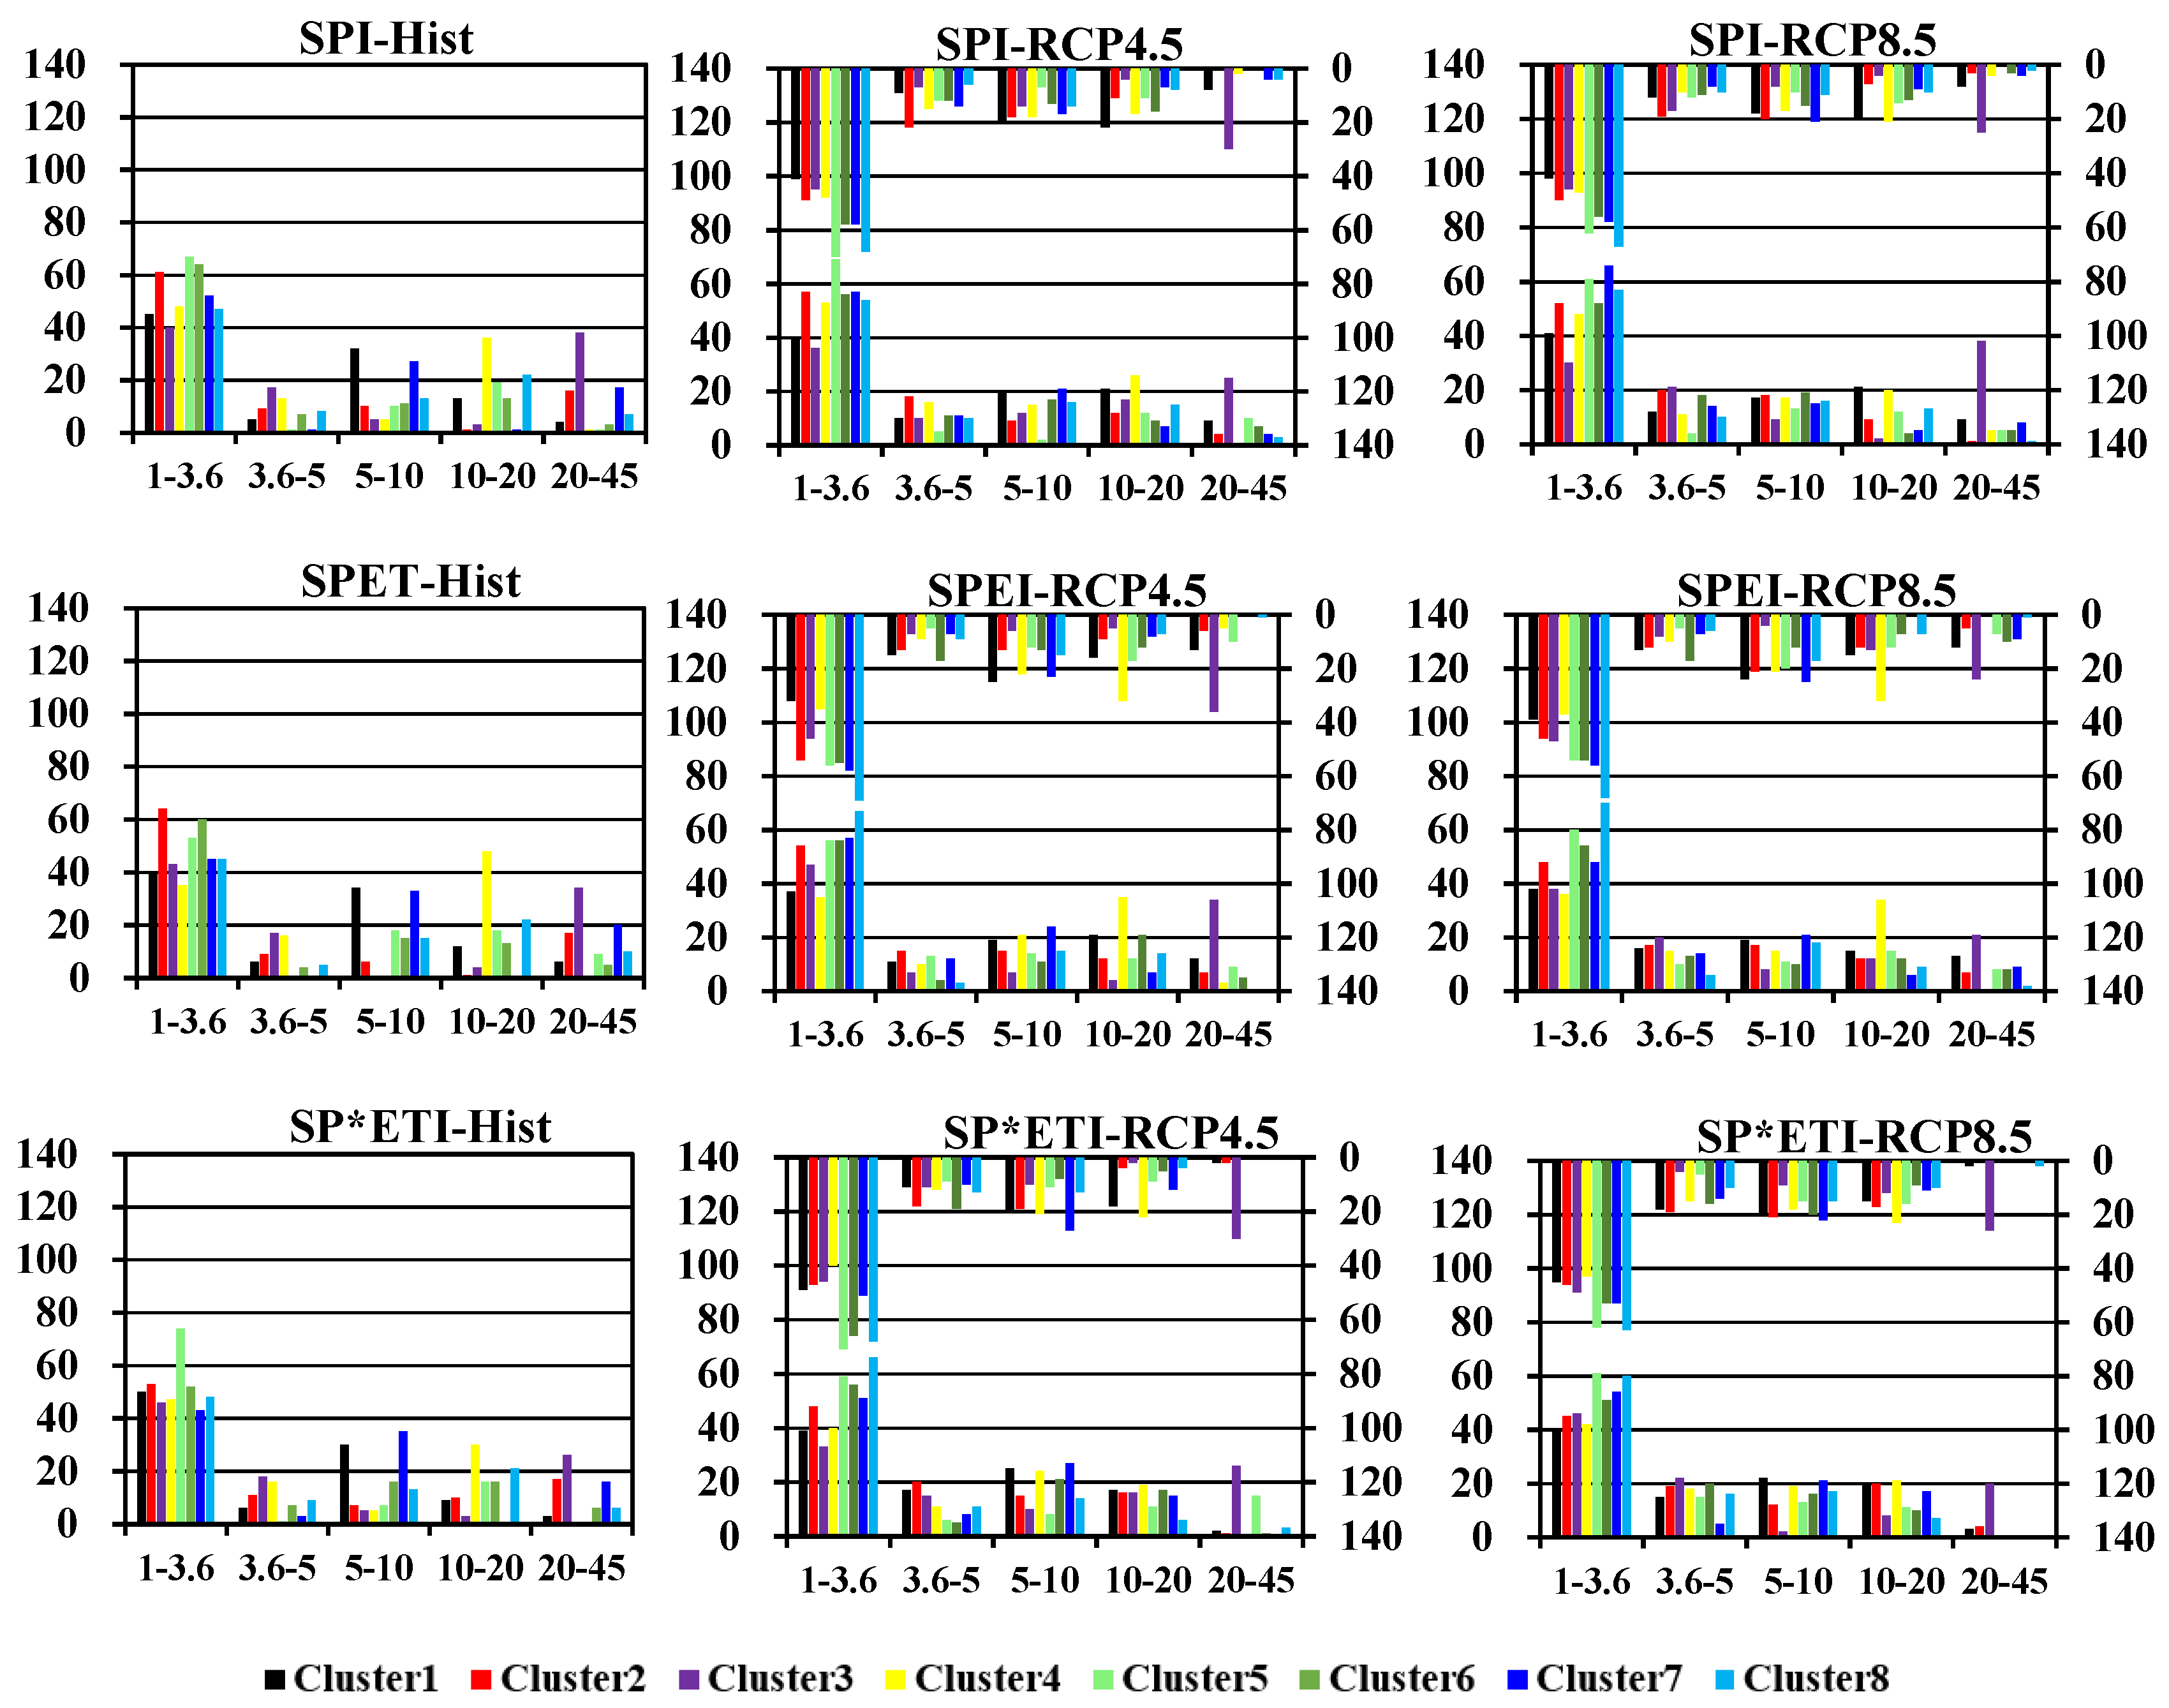
3.4. The Variation in the Drought Area Ratio

The variations in drought area with time under different conditions are shown in Figure 9. The calculated results of the modified Mann–Kendall test are shown in Table 4. Compared with the varying curves with the drought indicators of the SPI, SPEI and SP*ETI, the drought area ratio calculated with the SPI is typically lower than that calculated with the SPEI and SP*ETI, indicating that the drought hazard is more serious when the effective precipitation and potential evaporation are considered. The drought area ratio based on the evaluation results of the SPEI is usually greater than that of the SPI and SP*ETI, which indicates that potential evaporation related to temperature has a significant impact on drought severity. As shown in Figure 9b,c, the drought areas of all clusters over NF show an increasing trend, which can be proven by the positive values of the modified Mann–Kendall test in Table 4. According to the negative values of the Mann–Kendall test for Cluster 1, Cluster 2, and Cluster 6 shown in Table 4, the drought areas in these clusters over FF show a decreasing trend.
Generally, drought areas will first increase and then decrease in most parts of China over the period from 2006 to 2100; the most remarkable area is Cluster 1.

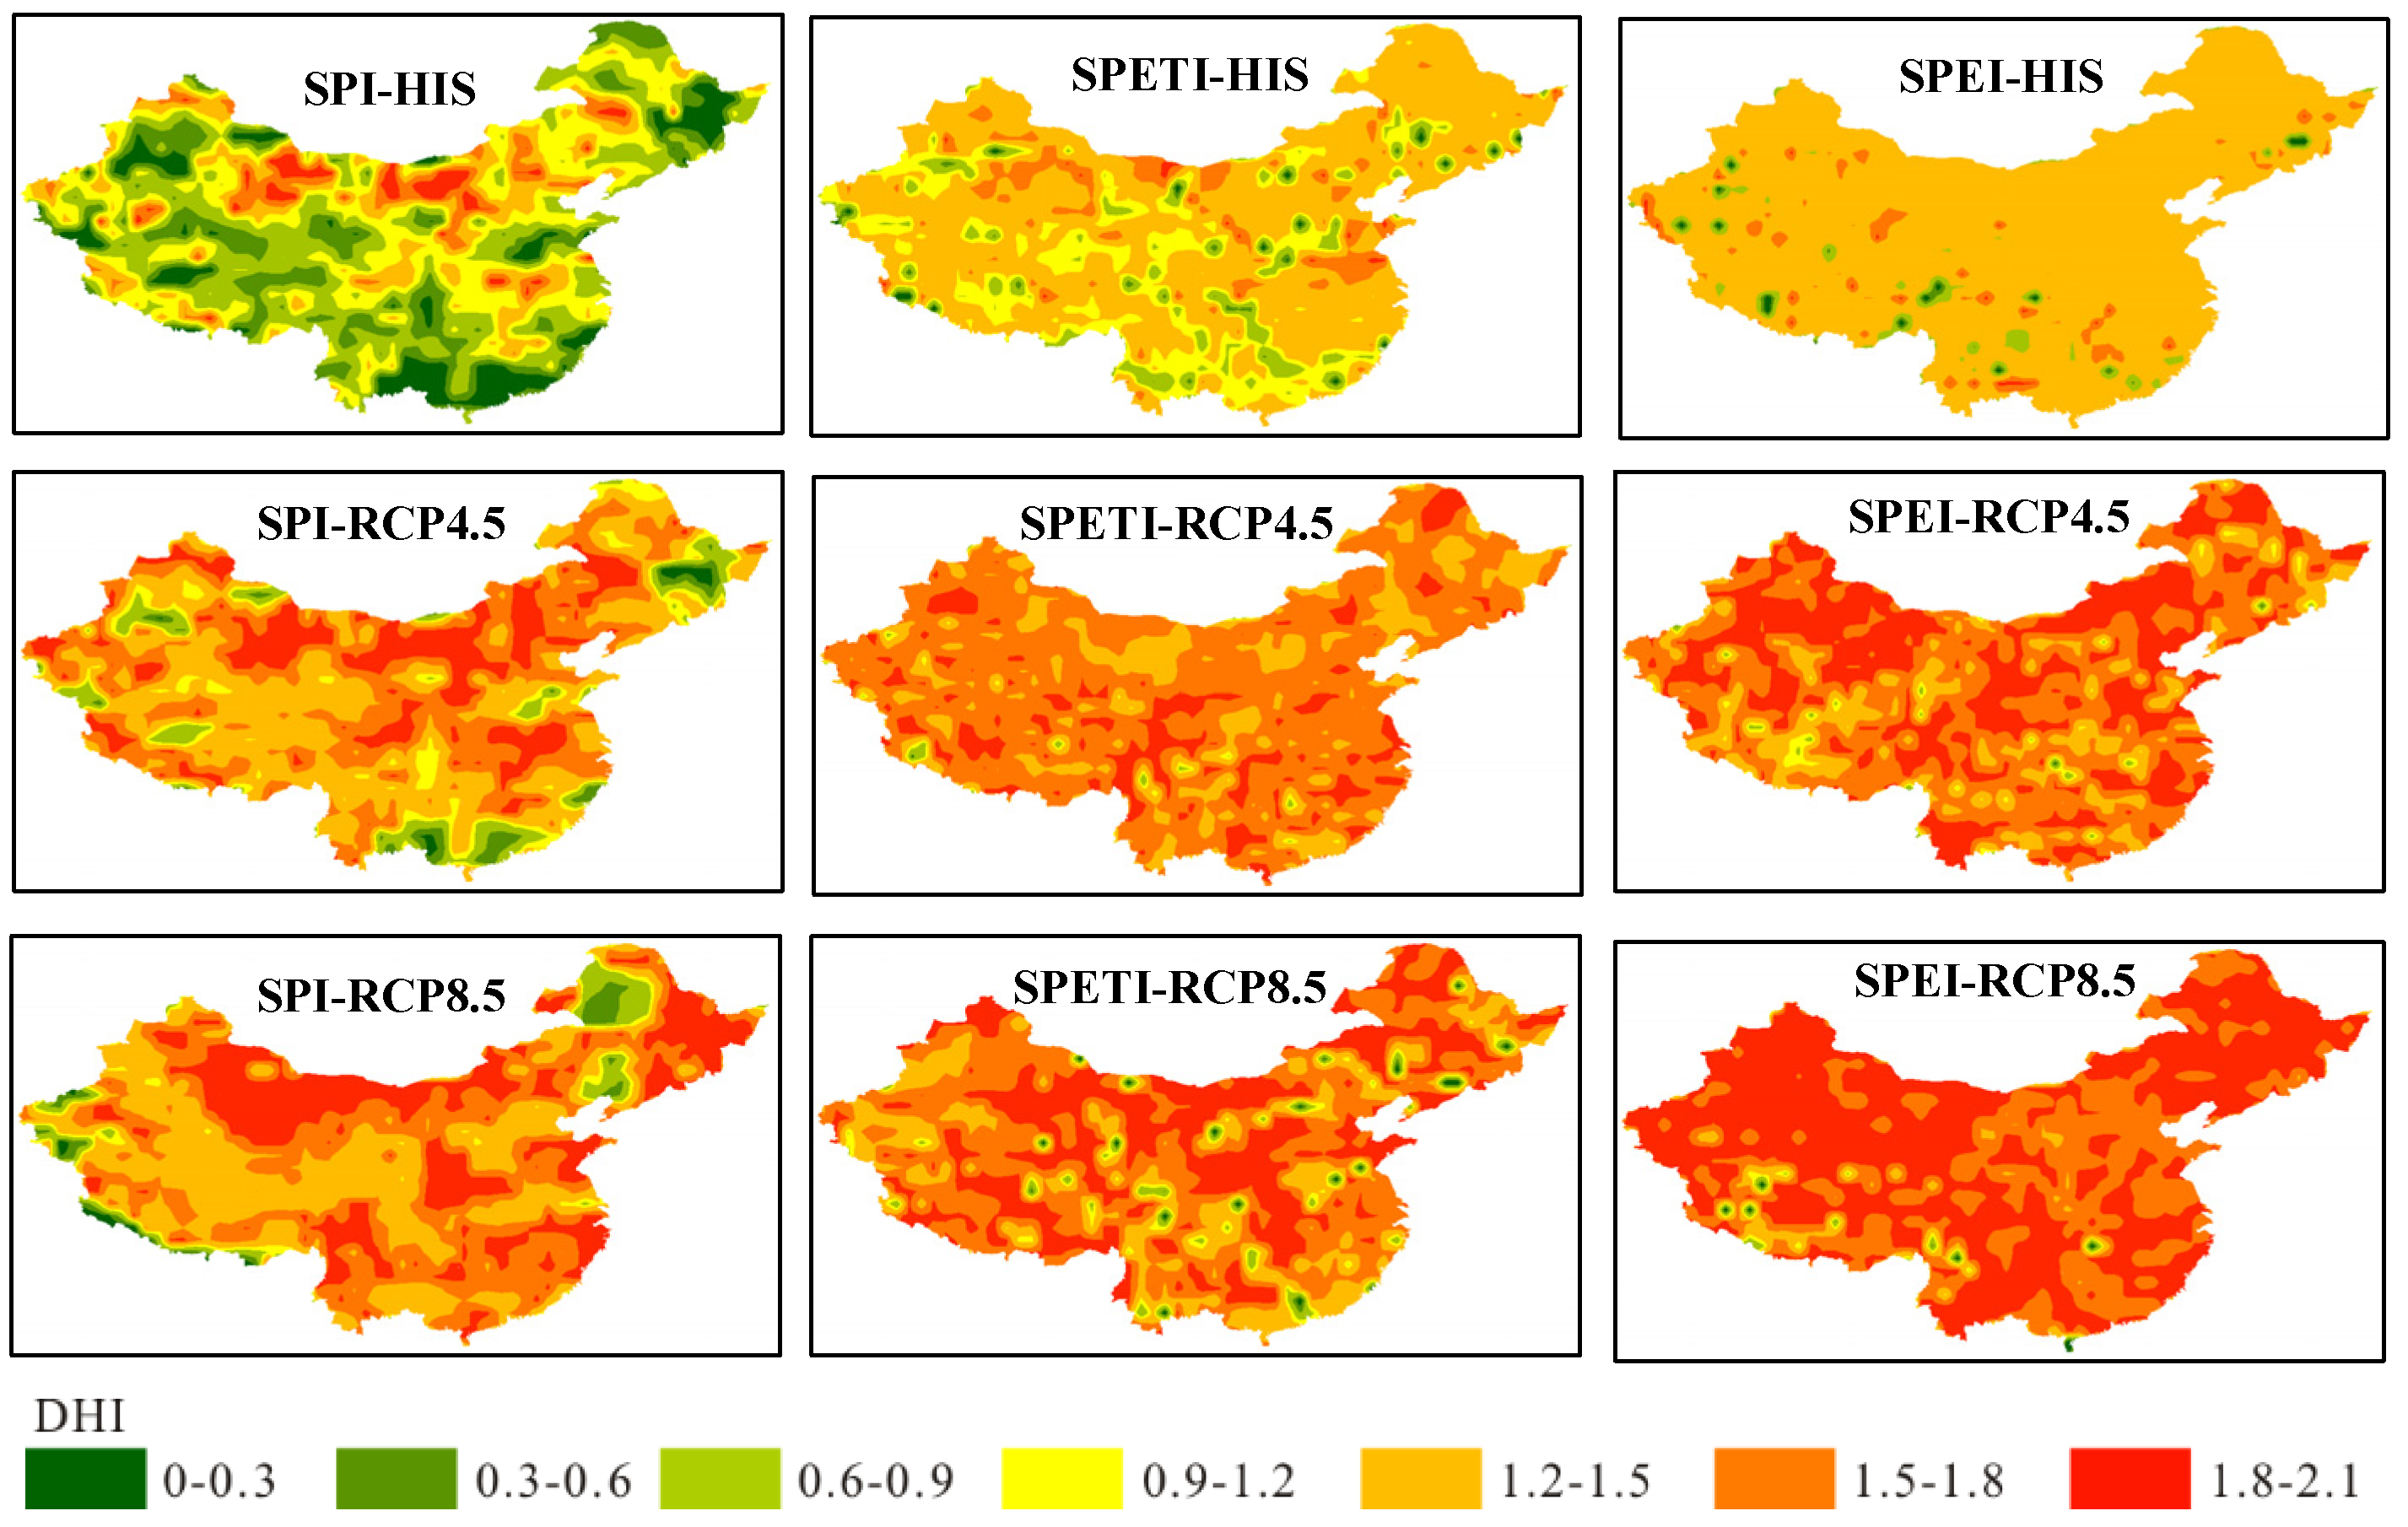
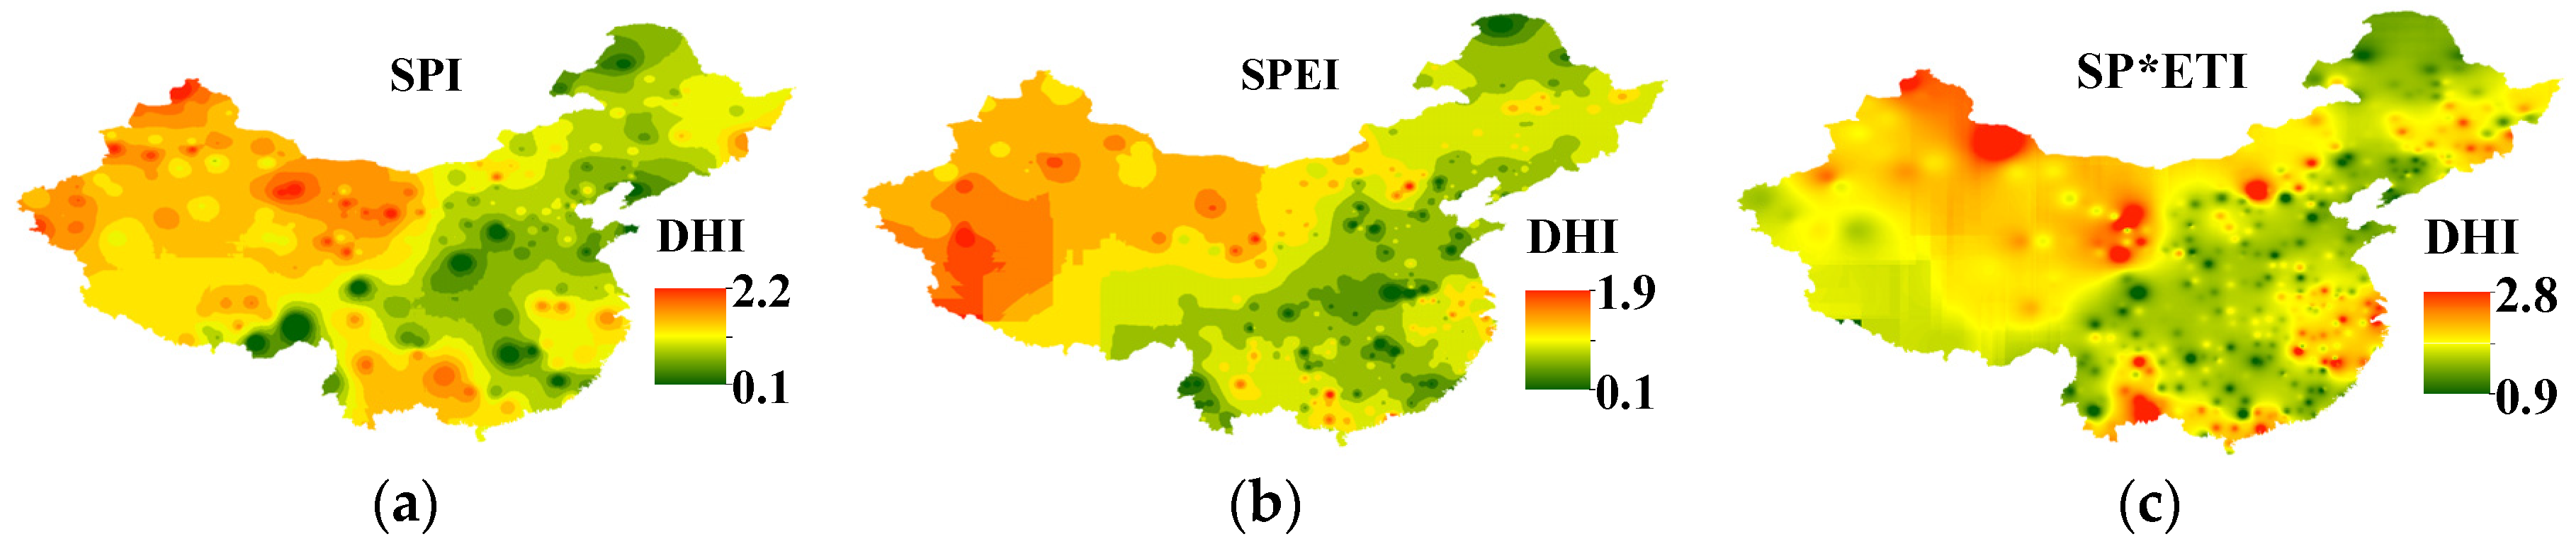
3.5. Analyses of the DHI Variations

To study the temporal and spatial characteristics of drought from 1960 to 2100, the DHI distribution over Hist (1960–2005) and TF (2006–2100) is shown in Figure 10. As shown in Figure 10, the DHI over TF is greater than that over Hist, which indicates that drought in most of China will have an increasing trend. The DHI distribution under RCP 4.5 indicates that drought in the central and western areas of China, especially in northern Xinjiang Province, northwestern Gansu Province, and western Inner Mongolia, shows an increasing trend in the future. The DHI distribution under RCP 8.5 indicates that drought will spread to East China as the drought severity increases in the central and western areas of China. The DHI value calculated by the SPEI is greater than those calculated by the SPI and SP*ETI, which suggests that a predicted drought is more severe when considering potential evaporation (Figure 10 and Table 5). This finding shows that a higher emission concentration will aggravate drought, and the effect on temperature will be more obvious. Considering the potential evapotranspiration related to temperature, with a rise in temperatures, the predicted drought would be more severe, and the drought hazard would be greater.

3.6. Periodicity Analyses

Periodograms of the SPI, SP*ETI and SPEI series were calculated to examine the hidden cycles of drought in different clusters for each grid point across China. To analyze the change in periodicity over time, three time periods, including historic (1951–2005), future period 1 (2021–2050) and future period 2 (2071–2100), were used. As shown in Figure 11, the percentage of the total area with a periodicity of 1~3.6 years is more than 35%, and the percentage of the total area with other grouped periodicity values is mostly less than 20%. In addition, the area percentages of some regions (Cluster 1–Cluster 6) over different periods are similar, which indicates that the periodicity of these clusters does not change with time. In Cluster 7 and Cluster 8, the percentage of the cluster area with periodicities of 1–3.6 years, 3.6–5 years, and 5–10 years increases to a certain extent. These areas are close to the Pacific Ocean and may be influenced by the El Niño phenomenon. The grouped periodicities of the clusters under RCP 4.5 and RCP 8.5 are similar, indicating that carbon emission concentrations have a certain influence on drought periodicity. Generally, climate variation has a certain influence on drought periodicity, while the influence of climate variation on other areas is not substantial.

4. Discussion

4.1. Spatial and Temporal Characteristics of Drought in China

Studies have shown that the intensity, frequency and periodicity of drought in areas of China have changed significantly due to changes in climate factors, such as precipitation, temperature and wind speed [1,5,6,48,73]. Using various CMIP5 models to predict future precipitation, it is concluded that the annual precipitation in most areas of China will increase in the 21st century [6,16,74,75]. Some scholars believe that an increase in precipitation will lead to a decrease in drought. For example, according to the research of Lin et al. [76], the increase in precipitation would decrease the drought in Northwest China. The research results of Zarch et al. [16] indicate that changes in climate will alter the areal extents of aridity zones in the future. Moreover, based on the research of predecessors and the work in this study, the predicted precipitation under RCP 8.5 is greater than that under other RCPs [77,78]. Temperature anomalies are also considered to play an important role in drought occurrences, greatly amplifying the evaporative demand and thereby increasing the overall drought intensity and impact [4,19,20,21]. Although precipitation will increase in the future, increasing temperatures will also promote evaporation and lead to more severe droughts. For example, the droughts in most parts of the Xinjiang Province, northern Tibet, and western Qinghai Province show significantly increasing trends.

4.2. Impact of Selection of the Drought Index on Drought Characteristics

It is necessary to be cautious in the selection of drought indicators. For example, the research of Oguntunde et al. [79] suggests that the drought evaluation results of SPI and SPEI are similar in the short term, but will diverge in the long term. According to the results of Ma et al. [73], Sobol’s global sensitivity principle reveals that the frequency of drought events induced by PET is greater than the precipitation deficit in the eastern monsoon, but the frequency of drought events dominated by precipitation is higher than that of PET in the northwest arid region. SPEI evaluates a drought as much more severe than the same drought evaluated by SPI and SP*ETI. The research results of this study show that the temperature in China will increase in the future, and evaporation will continue to be aggravated. Therefore, drought caused by increasing temperatures must be considered, and the drought indicators combining precipitation and evaporation should be optimized.
Some limitations of the current study should be acknowledged. In the calculation process of SPEI, potential evaporation based on temperature is used instead of evaporation, which increases the prediction of actual evaporation and aggravates the drought. The selection of the calculation method of PET might affect the evaluation results of drought. According to the research of Zhou et al. [80], PET can be estimated by a set of models. The set consists of four temperature-decisive models (Hamon, Hargreaves–Samani, Oudin, Thornthwaite), two radiation-decisive models (Energy-Only and Priestley– Taylor) and two synthesis models (Penman and Penman–Monteith). The research results show that both P-M and Thornthwaite [56] are suitable for assessing drought conditions on the national scale, but the drought assessed by the Thornthwaite method is worse than that by the Penman–Monteith method in 1990–2017 when warming is faster than previously in the arid region. It is impossible to accurately obtain the actual regional evaporation and analyze whether the calculated value is close to the actual value. Thus, we can only determine that the calculated evaporation by a certain method is relatively close to the average value. The Penman–Monteith method accounts for changes in energy, humidity, and wind speed. Due to the limitations of the data availability for the CMIP5 simulations, the Thornthwaite equation instead of the Penman–Monteith method is used to calculate evapotranspiration in this study. Some early studies [21] have indicated that the role of temperature is exaggerated for droughts over North China when using the Thornthwaite equation, compared to the Penman–Monteith method; however, there is almost no difference for South China. Therefore, we believe that using the Thornthwaite equation in this study provides robust results, although the increase in droughts in response to anthropogenic warming may be somewhat overestimated for North China.

4.3. The Impact of Carbon Emission on Drought

Previous Intergovernmental Panel on Climate Change (IPCC) assessment reports have performed assessments of rising temperature and possible risks in the climate system under various emission scenarios. Some research results and this study found that the precipitation of RCP8.5 is greater than that of the other RCPs. In this study, the analysis of GCM simulated data shows that the high carbon emission leads to the more obvious increasing trend of temperature and PET and to the increase in precipitation of most clusters (Table 2, Figures S6–S8). Some previous studies suggest that high carbon emissions would increase the severity of regional droughts. According to previous research, with the comparison of two scenarios, the severity of different drought hazards, including the drought frequency, duration, and trends, is higher under RCP 8.5 than RCP 4.5. The research of [47], indicates that the occurrence probability of hot drought events (SPEI less than −1.0) will increase to nearly 100% by the year 2050, even though the future annual precipitation is projected to increase under the RCP 4.5 scenario, and these conditions would become even worse under the RCP 8.5 scenario. In addition, for the Pearl River Basin, drought events lasting 1–2 months would be decreased by 7.7%, those lasting 3–4 months would be increased by 4.3%, and those lasting more than five months would be increased by 3.4% under RCP 4.5, respectively.
In the present study, carbon emissions are shown to affect the drought intensity and frequency in China, which varies greatly in different regions. For example, the drought intensity and frequency in eastern Xinjiang Province, the western part of Inner Mongolia, and northern Qinghai Province show significantly increasing trends. However, under RCP 8.5, the drought intensity and frequency of most regions of Cluster 4 and Cluster 5 show significantly decreasing trends in the short term. The drought frequency shows a significantly decreasing trend, while the drought intensity shows a significantly increasing trend in the long term. Therefore, in the analysis of carbon emission, attention should be paid to its spatial and temporal characteristics. The cluster with high carbon emissions may not aggravate drought conditions, and some areas may even show decreasing trends of drought.

4.4. Periodicity Analysis

Few studies have examined the drought periodicity in China, and most of them have focused on drought frequency analyses. The research of Ma et al. [73] suggests that the frequency of drought events in China is consistent with the global change trend. The drought frequency gradually declines from 1961 to 1980 and increases from 1981 to 2017. The analysis of periodicity shows that the main periodicity of drought in areas in China is 1–3.6 years, and the percentage of coastal areas with this periodicity will increase. Wang et al. [81] found that sea-level cycles of 3 and 5 years in the Pearl River Estuary are related, and Feng and Li [82] suggested that enhanced rainfall is associated with the decaying phase of EP El Niño events in southern China, whereas reduced rainfall occurs when CP El Niño events arise in the spring following maturity.

4.5. Uncertainties Analysis

It is well known that there are many uncertainties in the assessment of climate change impacts. The uncertainties in GCM projections result from errors in the model structure, scenarios, and initial conditions. Uncertainty due to the GCM structure would make different models produce different climate projections for the same emission scenarios; model predictions can also vary significantly over time.
The Third national assessment report of China on climate change indicates that one of the reasons for uncertainty is the lack of information. Due to few observation stations in western China (especially in the Qinghai-Tibet Plateau Region) and the lack of hydrology meteorological observation information, climate evaluation results of GCM simulations lack accuracy. As shown in Figure 6 and Figure 7, the fewer data that are available, the more uncertainty there is in the simulation results. A similar problem also arises in the research of [83]. The largest errors appear in western China, based on the validation with the China-CMIP5 dataset during the period from 1976 to 2005.
Because it is difficult to estimate carbon emissions in the future, many scenarios have been set up in previous studies to consider possible circumstances. Studies, such as [84] assume an instantaneous removal of all anthropogenic CO2; [85] prescribes a 1% per year decrease in atmospheric CO2 concentrations from quadrupled preindustrial CO2 levels, while [86] prescribes a decline in CO2 concentrations that reflects atmospheric CO2 in the RCPs.
The uncertainty of temperature and precipitation data leads to the uncertainty of drought assessment in GCM projections. Selection of the drought index, grid-scale, and data correction method also affect the accuracy of a drought assessment. In the future, a better understanding of the hydrological cycle may lead to better and less uncertain projections, thus resulting in better future climatic predictions that may reduce uncertainty in drought analysis.

5. Conclusions

Based on precipitation and temperature data of HadGEM2-ES under RCP 4.5 and RCP 8.5, the variations in drought during the 21st century in China are predicted. The impact of climate change on the variation trend and periodicity of regional drought in each cluster of China is explored. The main conclusions in this study are drawn as follows:
(1)
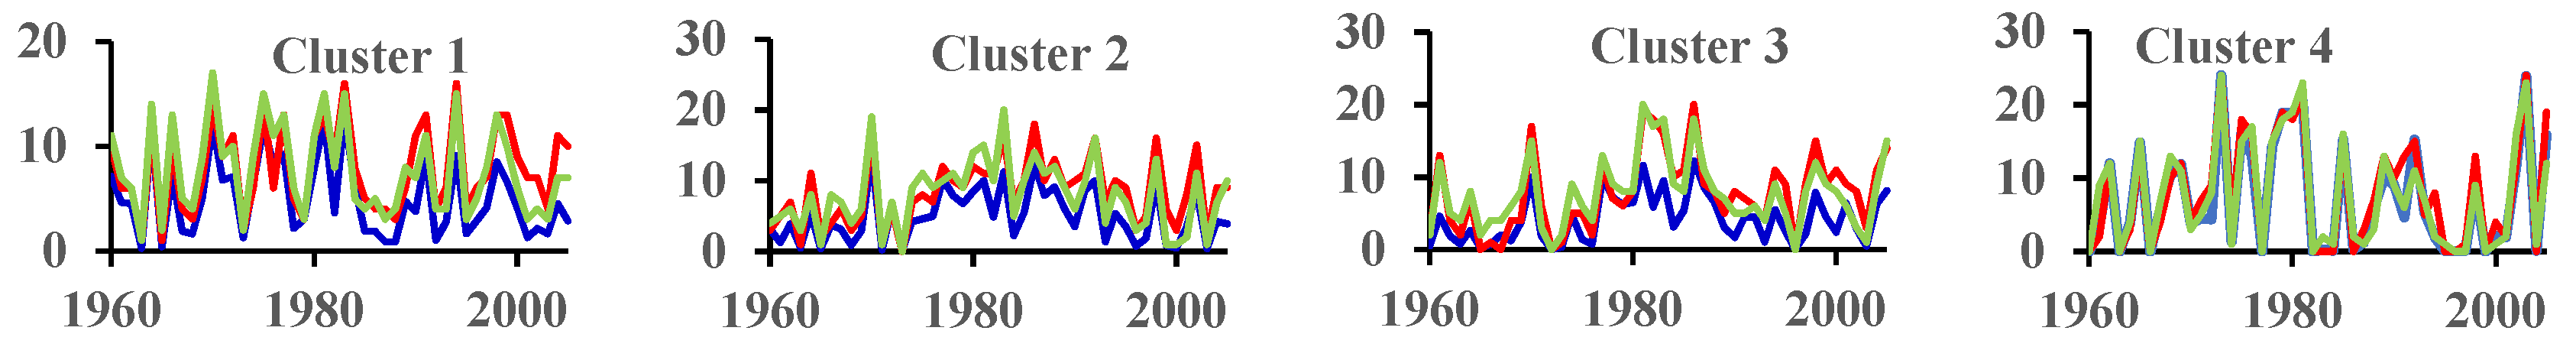
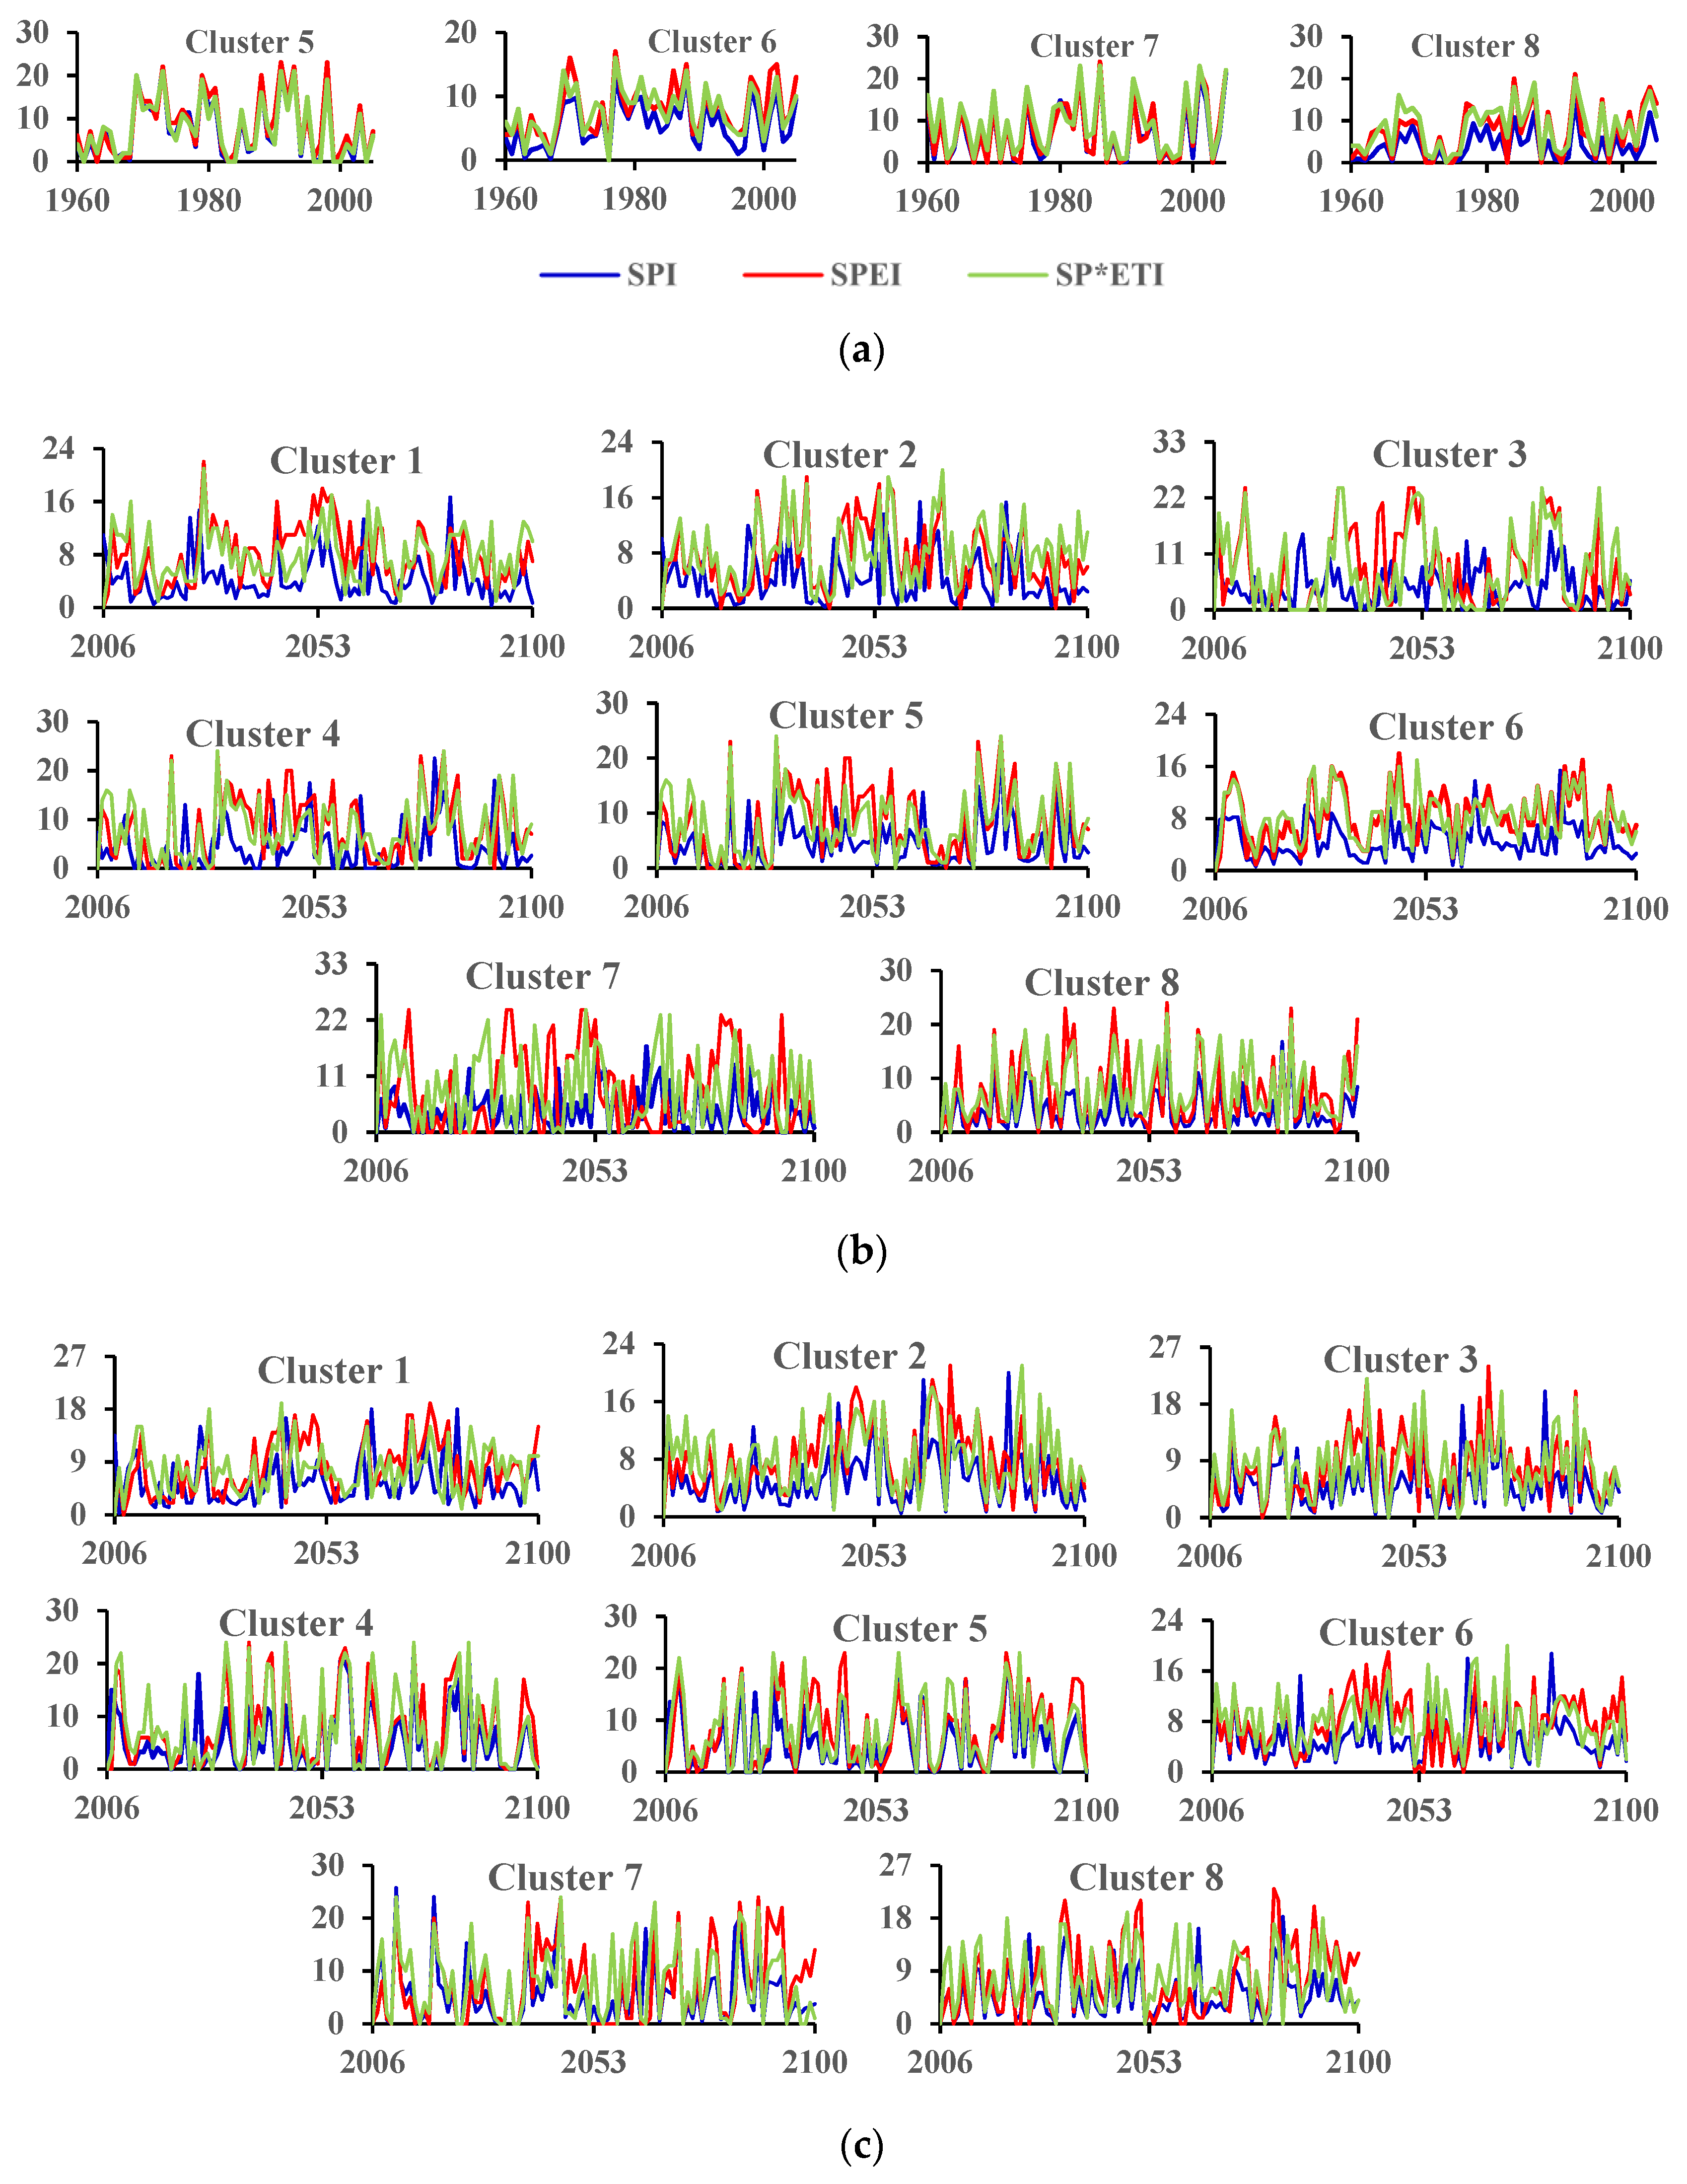
Three drought indices (SPI, SP*ETI, and SPEI) in the historical period are close, diverging in the future period.
(2)
Droughts in China over different periods have regional characteristics. All drought indices show similar variation trends. Droughts in most parts of Xinjiang Province, northern Tibet, and western Qinghai Province show a significantly increasing trend.
(3)
The effect of climate change on the drought cycle is not significant. With the increase in greenhouse gas concentrations, drought in central and western China will become more severe, and it will spread to the eastern areas in China. A higher emission concentration will lead to an increase in the potential evaporation rate, and the corresponding evapotranspiration will lead to a higher drought hazard.
(4)
in the study of drought changes in the future, more consideration should be given to comprehensively reflecting the regional drought characteristics by using various drought indices related to temperature and evapotranspiration.
The limitations of this study are as follows: (1) potential evapotranspiration based on temperature is used instead of the actual evapotranspiration data; (2) selection of the PET calculation formula and uncertainty regarding the drought assessment affect the GCM projections. Further efforts are needed to be made to explore and study methods that can more accurately calculate actual evapotranspiration and simulate future climate change to assess droughts more accurately.

Supplementary Materials

The following are available online at https://www.mdpi.com/article/10.3390/w13192761/s1, Figure S1: Comparison of cluster averages of observed precipitation and precipitation ofHadGEM2-ES for various clusters. The blue line indicates observed data and the red line denotes HadGEM2-ES data, Figure S2: Comparison of cluster averages of observed temperature and temperature of HadGEM2-ES for various clusters. The blue line indicates observed data and the red line denotes HadGEM2-ES data, Figure S3: Comparison of cluster averages of observed SPI12 and SPI12 of HadGEM2-ES for various clusters. The blue line indicates observed data and the red line denotes HadGEM2-ES data, Figure S4: Comparison of cluster averages of observed SPEI12 and SPEI12 of HadGEM2-ES for various clusters. The blue line indicates observed data and the red line denotes HadGEM2-ES data, Figure S5: Comparison of cluster averages of observed SP*ETI12 and SP*ETI12 of HadGEM2-ES for various clusters. The blue line indicates observed data and the red line denotes HadGEM2-ES data, Figure S6: Comparison of cluster averages of temperature values of RCP 4.5 and RCP 8.5. The blue line indicates temperature values of RCP 4.5 and the red line denotes temperature values of RCP 8.5, Figure S7: Temporal variation in the cluster averages of precipitation (Prec; mm) and potential evapotranspiration (PET; mm) under RCP 4.5. The blue line indicates precipitation data and the red line denotes potential evapotranspiration data, Figure S8: Temporal variation in the cluster averages of precipitation (Prec; mm) and potential evapotranspiration (PET; mm) under RCP 8.5. The blue line indicates potential evapotranspiration data and the red line denotes precipitation data.

Author Contributions

X.G.: Supervision, Writing—review & editing, Resources. S.D.: Conceptualization, Methodology, Validation, Formal analysis, Writing—original draft. F.L.: Writing—review & editing, Project administration. Y.D.: Writing—review & editing. All authors have read and agreed to the published version of the manuscript.

Funding

This research was funded by “Young Talents” Project of Northeast Agricultural University [18QC29], the National Natural Science Foundation of China [41701102] and “Young Talents” Project of Northeast Agricultural University [20QC13], Natural Science Foundation of Heilongjiang Province of China: E2017009.

Institutional Review Board Statement

Not applicable.

Informed Consent Statement

Not applicable.

Data Availability Statement

Data used in this study can be requested to the corresponding author via email.

Acknowledgments

This study is supported by “Young Talents” Project of Northeast Agricultural University [18QC29], the National Natural Science Foundation of China [41701102] and “Young Talents” Project of Northeast Agricultural University (No. 20QC13). Also, we appreciate the anonymous reviewer. To our knowledge, no conflicts of interest are present.

Conflicts of Interest

The authors declare no conflict of interest.

References

  1. Xu, K.; Yang, D.; Yang, H.; Li, Z.; Qin, Y.; Shen, Y. Spatio-temporal variation of drought in China during 1961–2012: A climatic perspective. J. Hydrology 2015, 526, 253–264. [Google Scholar] [CrossRef]
  2. Nicholson, E.S. Climatic and environmental change in Africa during the last two centuries. Clim. Chang. 2001, 17, 123–144. [Google Scholar] [CrossRef] [Green Version]
  3. Shanahan, T.M.; Overpeck, J.T.; Anchukaitis, K.J.; Beck, J.W.; Cole, J.E.; Dettman, D.L.; Peck, J.A.; Scholz, C.A.; King, J.W. Atlantic forcing of persistent drought in West Africa. Science 2009, 324, 377–380. [Google Scholar] [CrossRef] [PubMed] [Green Version]
  4. Dai, A.; Trenberth, K.E.; Qian, T. A global dataset of Palmer drought severity index for 1870–2002: Relationship with soil moisture and effects of surface warming. J. Hydrometeorol. 2004, 5, 1117–1130. [Google Scholar] [CrossRef]
  5. Chen, H.; Sun, J. Anthropogenic warming has caused hot droughts more frequently in China. J. Hydrol. 2017, 544, 306–318. [Google Scholar] [CrossRef]
  6. Yao, N.; Li, L.C.; Feng, P.Y.; Feng, H.; Liu, D.L.; Liu, Y.; Jiang, K.T.; Hu, X.T.; Li, Y. Projections of drought characteristics in China based on a standardized precipitation and evapotranspiration index and multiple GCMs. Sci. Total. Environ. 2020, 704, 135245. [Google Scholar] [CrossRef]
  7. Dogan, S.; Berktay, A.; Singh, V.P. Comparison of multi-monthly rainfall-based drought severity indices, with application to semi-arid Konya closed basin, Turkey. J. Hydrol. 2012, 470–471, 255–268. [Google Scholar] [CrossRef]
  8. Zhang, D.E.; Liu, C. The distribution of drought and flood in China in recent 500 years. Meteorol. Mon. 1993, 19, 41–45. [Google Scholar]
  9. Yang, J.; Gong, D.; Wang, W.; Hu, M.; Mao, R. Extreme drought event of 2009/2010 over southwestern China. Meteorol. Atmos. Phys. 2012, 115, 173–184. [Google Scholar] [CrossRef]
  10. Sun, J. Record-breaking SST over mid-North Atlantic and extreme high temperature over the Jianghuai–Jiangnan region of China in 2013. Chin. Sci. Bull. 2014, 59, 3465–3470. [Google Scholar] [CrossRef]
  11. Wang, H.; He, S. The north China/ Northeastern Asia severe summer drought in 2014. J. Clim. 2015, 28, 6667–6681. [Google Scholar] [CrossRef]
  12. Nastos, P.T.; Politi, N.; Kapsomenakis, J. Spatial and temporal variability of the Aridity Index in Greece. Atmos. Res. 2013, 119, 140–152. [Google Scholar] [CrossRef]
  13. Zhang, L.; Zhou, T. Drought over East Asia: A Review. J. Clim. 2015, 28, 3375–3399. [Google Scholar] [CrossRef]
  14. Thilakarathne, M.; Sridhar, V. Characterization of future drought conditions in the Lower Mekong River Basin. Weather Clim. Extrem. 2017, 17, 47–58. [Google Scholar] [CrossRef]
  15. Masud, M.B.; Khaliq, M.N.; Wheater, H.S. Future changes to drought characteristics over the Canadian Prairie Provinces based on NARCCAP multi-RCM ensemble. Clim. Dyn. 2016, 48, 2685–2705. [Google Scholar] [CrossRef]
  16. Zarch, M.A.A.; Sivakumar, B.; Malekinezhad, H.; Sharma, A. Future aridity under conditions of global climate change. J. Hydrol. 2017, 554, 451–469. [Google Scholar] [CrossRef]
  17. Oguntunde, P.G.; Abiodun, B.J.; Lischeid, G. Impacts of climate change on hydro-meteorological drought over the Volta Basin, West Africa. Glob. Planet. Chang. 2017, 155, 121–132. [Google Scholar] [CrossRef]
  18. Gupta, V.; Jain, M.K. Investigation of multi-model spatiotemporal mesoscale drought projections over India under climate change scenario. J. Hydrol. 2018, 567, 489–509. [Google Scholar] [CrossRef]
  19. Dai, A. Increasing drought under global warming in observations and models. Nat. Clim. Chang. 2012, 3, 52–58. [Google Scholar] [CrossRef]
  20. Aghakouchak, A.; Cheng, L.; Mazdiyasni, O.; Farahmand, A. Global warming and changes in risk of concurrent climate extremes: Insights from the 2014 California drought. Geophys. Res. Lett. 2014, 41, 8847–8852. [Google Scholar] [CrossRef] [Green Version]
  21. Chen, H.; Sun, J. Changes in drought characteristics over China using the standardized precipitation evapotranspiration index. J. Clim. 2015, 28, 5430–5447. [Google Scholar] [CrossRef]
  22. Palmer, W.C. (Ed.) Meteorological Drought; US Department of Commerce; Weather Bureau: Washington, DC, USA, 1965.
  23. McKee, T.B.; Doesken, N.J.; Kleist, J. The relationship of drought frequency and duration to time scales. In Proceedings of the Eighth Conference on Applied Climatology, Anaheim, CA, USA, 17–22 January 1993; pp. 179–183. [Google Scholar]
  24. Vicente-Serrano, S.M.; Begueria, S.; Lopez-Moreno, J.I. A multiscalar drought index sensitive to global warming: The standardized precipitation evapotranspiration index. J. Clim. 2010, 23, 1696–1718. [Google Scholar] [CrossRef] [Green Version]
  25. Vicente-Serrano, S.M.; Beguería, S.; López-Moreno, J.I.; Angulo, M.; El Kenawy, A. A New Global 0.5° Gridded Dataset (1901–2006) of a Multiscalar Drought Index: Comparison with Current Drought Index Datasets Based on the Palmer Drought Severity Index. J. Hydrometeorol. 2010, 11, 1033–1043. [Google Scholar] [CrossRef] [Green Version]
  26. Vicente-Serrano, S.M.; Lasanta, T.; Gracia, C. Aridification determines changes in forest growth in Pinus halepensis forests under semiarid Mediterranean climate conditions. For. Ecol. Manag. 2010, 150, 614–628. [Google Scholar] [CrossRef]
  27. Beguería, S.; Vicente-Serrano, S.M.; Reig, F.; Latorre, B. Standardized precipitation evapotranspiration index (SPEI) revisited: Parameter fitting, evapotranspiration models, tools, datasets and drought monitoring. Int. J. Climatol. 2014, 34, 3001–3023. [Google Scholar] [CrossRef] [Green Version]
  28. Wang, L.; Yu, H.; Yang, M.; Yang, R.; Gao, R.; Wang, Y. A drought index: The standardized precipitation evapotranspiration runoff index. J. Hydrol. 2019, 571, 651–668. [Google Scholar] [CrossRef]
  29. Maccioni, P.; Kossida, M.; Brocca, L.; Moramarco, T. Assessment of the drought hazard in the Tiber River Basin in Central Italy and a comparison of new and commonly used meteorological indicators. J. Hydrol. Eng. 2015, 20, 05014029. [Google Scholar] [CrossRef]
  30. Svoboda, M.; LeComte, D.; Hayes, M.; Heim, R.; Gleason, K.; Angel, J.; Rippey, B.; Tinker, R.; Palecki, M.; Stooksbury, D.; et al. The drought monitor. Bull. Amer. Meteor. Soc. 2002, 83, 1181–1190. [Google Scholar] [CrossRef] [Green Version]
  31. Keyantash, J.A.; Dracup, J.A. An aggregate drought index: Assessing drought severity based on fluctuations in the hydrologic cycle and surface water storage. Water Resour. Res. 2004, 40, W09304. [Google Scholar] [CrossRef] [Green Version]
  32. Kao, S.; Govindaraju, R.S. A copula-based joint deficit index for droughts. J. Hydrol. 2010, 380, 121–134. [Google Scholar] [CrossRef]
  33. Hao, Z.C.; Aghakouchak, A. Multivariate Standardized Drought Index: A parametric multi-index model. Adv. Water Resour. 2013, 57, 12–18. [Google Scholar] [CrossRef] [Green Version]
  34. Li, L.C.; She, D.X.; Zheng, H.; Lin, P.R.; Yang, Z.L. Elucidating diverse drought characteristics from two meteorological drought indices (SPI and SPEI) in China. J. Hydrometeorol. 2020, 21, 1513–1530. [Google Scholar] [CrossRef]
  35. Zhang, L.; Xu, Y.L.; Meng, C.C.; Li, X.H.; Liu, H.; Wang, C.G. Comparison of statistical and dynamic downscaling techniques in generating high-resolution temperatures in China from CMIP5 GSMs. J. Appl. Meteorol. Climatol. 2020, 59, 207–235. [Google Scholar] [CrossRef]
  36. Zhang, L.X.; Zhou, T.J.; Chen, X.L.; Wu, P.L.; Christidis, N.; Lott, F.C. The late spring drought of 2018 in South China. Bull. Am. Meteorol. Soc. 2020, 101, S59–S64. [Google Scholar] [CrossRef] [Green Version]
  37. Piao, S.L.; Fang, J.Y.; Liu, H.Y.; Zhu, B. NDVI-indicated decline in desertification in China in the past two decades. Geophys. Res. Lett. 2005, 32, L06402. [Google Scholar] [CrossRef]
  38. Jia, B.H.; Wang, Y.Y.; Xie, Z.H. Responses of the terrestrial carbon cycle to drought over China: Modeling sensitivities of the interactive nitrogen and dynamic vegetation. Ecol. Model. 2018, 368, 52–68. [Google Scholar] [CrossRef]
  39. Shi, F.Z.; Wu, X.C.; Li, X.Y.; Wang, P.; Yang, X.F.; Li, Y.Q.; Jiang, X.F.; Pei, T.T.; Bai, Y.; Hao, B.Y.; et al. Seasonal divergent tree growth trends and growth variability along drought gradient over Northeastern China. Forests 2019, 10, 39. [Google Scholar] [CrossRef] [Green Version]
  40. Zhao, J.Q.; Zhang, Q.; Zhu, X.D.; Shen, Z.X.; Yu, H.Q. Drought risk assessment in China: Evaluation framework and influencing factors. Geogr. Sustain. 2020, 1, 220–228. [Google Scholar] [CrossRef]
  41. Fang, W.; Huang, S.Z.; Huang, Q.; Huang, G.H.; Wang, H.; Leng, G.Y.; Wang, L.; Li, P.; Ma, L. Bivariate probabilistic quantification of drought impacts on terrestrial vegetation dynamics in mainland China. J. Hydrol. 2019, 577, 123980. [Google Scholar] [CrossRef]
  42. Ding, Y.B.; Xu, J.T.; Wang, X.W.; Cai, H.J.; Zhou, Z.Q.; Sun, Y.N.; Shi, H.Y. Propagation of meteorological to hydrological drought for different climate regions in China. J. Environ. Manag. 2021, 283, 111980. [Google Scholar] [CrossRef] [PubMed]
  43. Daneshvar, M.R.M.; Bagherzadeh, A.; Khosravi, M. Assessment of drought hazard impact on wheat cultivation using standardized precipitation index in Iran. Arab. J. Geosci. 2013, 6, 4463–4473. [Google Scholar] [CrossRef]
  44. Wang, M.T.; Wang, X.; Huang, W.H.; Zhang, Y.F.; Ma, J. Temporal and spatial distribution of seasonal drought in Southwest of China on relative moisture index. Trans. Chin. Soc. Agric. Eng. 2012, 28, 85–92. [Google Scholar]
  45. Zhou, Y.L.; Liu, L.; Zhou, P.; Jin, J.L.; Li, J.Q.; Wu, C.G. Identification of drought and frequency analysis of drought characteristics based on palmer drought severity index model. Trans. Chin. Soc. Agric. Eng. 2014, 30, 174–184. [Google Scholar]
  46. Huang, W.H.; Sui, Y.; Yang, X.G.; Dai, S.W.; Qu, H.H.; Li, M.S. Spatio-temporal characteristics of crop drought in southern China based on drought index of continuous days without available precipitation. Trans. Chin. Soc. Agric. Eng. 2014, 30, 125–135. [Google Scholar]
  47. Chen, S.D.; Zhang, L.P.; Tang, R.X.; Yang, K.; Huang, Y.Q. Analysis on temporal and spatial variation of drought in Henan Province based on SPEI and TVDI. Trans. Chin. Soc. Agric. Eng. 2017, 33, 126–132. [Google Scholar]
  48. Zeng, Z.; Wu, W.; Li, Z.; Zhou, Y.; Guo, Y.; Huang, H. Agricultural drought risk assessment in southwest China. Water 2019, 11, 1064. [Google Scholar] [CrossRef] [Green Version]
  49. Taylor, K.E.; Stouffer, R.J.; Meehl, G.A. An Overview of CMIP5 and the Experiment Design. Bull. Am. Meteorol. Soc. 2012, 93, 485–498. [Google Scholar] [CrossRef] [Green Version]
  50. Sperber, K.R.; Annamalai, H.; Kang, I.S.; Kitoh, A.; Moise, A.; Turner, A.; Wang, B.; Zhou, T. The Asian summer monsoon: An intercomparison of CMIP5 vs. CMIP3 simulations of the late 20th century. Clim. Dyn. 2013, 41, 2711–2744. [Google Scholar] [CrossRef]
  51. Woldemeskel, F.M.; Sharma, A.; Sivakumar, B.; Mehrotra, R. A framework to quantify GCM uncertainties for use in impact assessment studies. J. Hydrol. 2014, 519, 1453–1465. [Google Scholar] [CrossRef]
  52. McSweeney, C.F.; Jones, R.G.; Lee, R.W.; Rowell, D.P. Selecting CMIP5 GCMs for downscaling over multiple regions. Clim. Dyn. 2015, 44, 3237–3260. [Google Scholar] [CrossRef] [Green Version]
  53. Jiang, Y.; Xu, X.; Liu, H.; Wang, W.; Dong, X. Projection of surface wind by CMIP5 and CMIP3 in China in the 21st century. J. Meteorol. Environ. 2018, 34, 56–63. [Google Scholar]
  54. Wu, H. Projection of the spatial and temporal variation characteristics of surface air temperature over central Asia in the next 50 years in the Beijing Climate Center Climate System Model V1.1. Acta Meteorol. Sin. 2013, 71, 261–274. [Google Scholar]
  55. Stagge, J.H.; Tallaksen, L.M.; Gudmundsson, L.; Loo, A.F.V.; Stahl, K. Candidate Distributions for Climatological Drought Indices (SPI and SPEI). Int. J. Climatol. 2015, 35, 4027–4040. [Google Scholar] [CrossRef]
  56. Thornthwaite, C.W. An approach toward a rational classification of climate. Geogr. Rev. 1948, 38, 55–94. [Google Scholar] [CrossRef]
  57. USDA. Technical Release No.21: Irrigation Water Requirement; USDA: Washington, DC, USA, 1970.
  58. Saaty, T.L. A scaling method for priorities on hierarchical structures. J. Math. Psychol. 1977, 15, 234–281. [Google Scholar] [CrossRef]
  59. Burn, D.H. Evaluation of regional flood frequency analysis with a region of influence approach. Water Resour. Res. 1990, 26, 2257–2265. [Google Scholar] [CrossRef]
  60. Ridolfi, E.; Rianna, M.; Trani, G.; Alfonso, L.; Di Baldassarre, G.; Napolitano, F.; Russo, F. A new methodology to define homogeneous regions through an entropy based clustering method. Adv. Water Resour. 2016, 96, 237–250. [Google Scholar] [CrossRef]
  61. Rao, A.R.; Srinivas, V.V. Regionalization of watersheds by fuzzy cluster analysis. J. Hydrol. 2006, 318, 57–79. [Google Scholar] [CrossRef]
  62. Rao, A.R.; Srinivas, V.V. Regionalization of watersheds by hybrid-cluster analysis. J. Hydrol. 2006, 318, 37–56. [Google Scholar] [CrossRef]
  63. Goyal, M.K.; Gupta, V. Identification of homogeneous rainfall regimes in northeast region of India using fuzzy cluster analysis. Water Resour. Manag. 2014, 28, 4491–4511. [Google Scholar] [CrossRef]
  64. Macqueen, J.B. Some methods for classification and analysis of multivariate observations. In Proceedings of the Fifth Berkeley Symposium on Mathematical Statistics and Probability, Los Angeles, CA, USA, 21 June–18 July 1965. [Google Scholar]
  65. Dunn, J.C. Well-Separated Clusters and Optimal Fuzzy Partitions. J. Cybern. 1974, 4, 95–104. [Google Scholar] [CrossRef]
  66. Rousseeuw, P.J. Silhouettes: A graphical aid to the interpretation and validation of cluster analysis. J. Comput. Appl. Math. 1987, 20, 53–65. [Google Scholar] [CrossRef] [Green Version]
  67. Davies, D.L.; Bouldin, D.W. A Cluster Separation Measure. IEEE Trans. Pattern Anal. Mach. Intell. 1979, PAMI-1, 224–227. [Google Scholar] [CrossRef]
  68. Razavi, S.; Vogel, R. Prewhitening of Hydroclimatic Time Series and Implications for Inferred Change and Variability Across Time Scales. J. Hydrol. 2018, 557, 109–115. [Google Scholar] [CrossRef]
  69. Gocic, M.; Trajkovic, S. Analysis of changes in meteorological variables using Mann-Kendall and Sen’s slope estimator statistical tests in Serbia. Glob. Planet. Chang. 2013, 100, 172–182. [Google Scholar] [CrossRef]
  70. Hamed, K.H. Trend detection in hydrologic data: The Mann–Kendall trend test under the scaling hypothesis. J. Hydrol. 2008, 349, 350–363. [Google Scholar] [CrossRef]
  71. Moreira, E.E.; Martins, D.; Pereira, L.S. Assessing drought cycles in SPI time series using a Fourier analysis. Nat. Hazards Earth Syst. Sci. 2015, 15, 571–585. [Google Scholar] [CrossRef] [Green Version]
  72. Lenderink, G.; Buishand, A.; Deursen, W.V. Estimates of future discharges of the river Rhine using two scenario methodologies: Direct versus delta approach. Hydrol. Earth Syst. Sci. 2007, 11, 1145–1159. [Google Scholar] [CrossRef]
  73. Ma, B.; Zhang, B.; Jia, L.; Huang, H. Conditional distribution selection for SPEI-daily and its revealed meteorological drought characteristics in China from 1961 to 2017. Atmos. Res. 2020, 246, 105108. [Google Scholar] [CrossRef]
  74. Yang, W.; Long, D.; Bai, P. Impacts of future land cover and climate changes on runoff in the mostly afforested river basin in North China. J. Hydrol. 2019, 570, 201–219. [Google Scholar] [CrossRef]
  75. Chen, H. Projected change in extreme rainfall events in China by the end of the 21st century using CMIP5 models. Chin. Sci. Bull. 2013, 58, 1462–1472. [Google Scholar] [CrossRef] [Green Version]
  76. Lin, L.; Gettelman, A.; Feng, S.; Fu, Q. Simulated climatology and evolution of aridity in the 21st century. J. Geophys. Res.-Atmos. 2015, 120, 5795–5815. [Google Scholar] [CrossRef]
  77. Lv, Y.; Guo, J.; Yim, S.H.-L.; Yun, Y.; Yin, J.; Liu, L.; Zhang, Y.; Yang, Y.; Yan, Y.; Chen, D. Towards understanding multi-model precipitation predictions from CMIP5 based on China hourly merged precipitation analysis data. Atmos. Res. 2020, 231, 104671. [Google Scholar] [CrossRef]
  78. Zhang, Y.; You, Q.; Chen, C.; Ge, J. Impacts of climate change on streamflows under RCP scenarios: A case study in Xin River Basin, China. Atmos. Res. 2016, 178–179, 521–534. [Google Scholar] [CrossRef]
  79. Oguntunde, P.G.; Lischeid, G.; Abiodun, B.J. Impacts of climate variability and change on drought characteristics in the Niger River Basin, West Africa. Stoch. Environ. Res. Risk Assess. 2018, 32, 1017–1034. [Google Scholar] [CrossRef]
  80. Zhou, J.; Wang, Y.; Su, B.; Wang, A.; Tao, H.; Zhai, J.; Kundzewicz, Z.W.; Jiang, T. Choice of potential evapotranspiration formulas influences drought assessment: A case study in China. Atmos. Res. 2020, 242, 104979. [Google Scholar] [CrossRef]
  81. Wang, L.; Li, Q.; Mao, X.Z.; Bi, H.; Yin, P. Interannual sea level variability in the Pearl River Estuary and its response to El Nio–Southern Oscillation. Glob. Planet. Chang. 2018, 162, 163–174. [Google Scholar] [CrossRef]
  82. Feng, J.; Li, J. Influence of El Niño Modoki on spring rainfall over south China. J. Geophys. Res. 2011, 116, D13102. [Google Scholar] [CrossRef]
  83. Yue, T.; Zhao, N.; Fan, Z.; Li, J.; Chen, C.; Lu, Y.; Wang, C.; Xu, B.; Wilson, J. CMIP5 downscaling and its uncertainty in China. Glob. Planet. Chang. 2016, 146, 30–37. [Google Scholar] [CrossRef]
  84. Cao, L.; Calderia, K. Atmospheric carbon dioxide removal: Long-term consequences and commitment. Environ. Res. Lett. 2010, 5, 024011. [Google Scholar] [CrossRef]
  85. Boucher, O.; Halloran, P.; Burke, E.J.; Doutriaux-Boucher, M.; Jones, C.D.; Lowe, J.; Ringer, M.A.; Robertson, E.; Wu, P. Reversibility in an earth system model in response to co2 concentration changes. Environ. Res. Lett. 2012, 7, 024013. [Google Scholar] [CrossRef]
  86. MacDougall, A.H. Reversing climate warming by artificial atmospheric carbon-dioxide removal: Can a holocene-like climate be restored? Geophys. Res. Lett. 2013, 40, 5480–5485. [Google Scholar] [CrossRef]
Figure 1. Study area. Black dots represent weather stations and the green solid line represents China boundary.
Water 13 02761 g001
Figure 2. Historical distribution of DHI. (a) DHI calculated by SPI, (b) DHI calculated by SPEI, (c) DHI calculated by SP*ETI.
Water 13 02761 g002
Figure 3. The variations in DBI and ASWI with clusters for K-means.
Water 13 02761 g003
Figure 4. Drought clusters. The color of the squares in the legend represents the serial number of clusters.
Water 13 02761 g004
Figure 5. Taylor diagram to examine the performance of various RCMs for the simulation of (a) precipitation and (b) temperature.
Water 13 02761 g005
Figure 6. Spatial distribution of annual average precipitation (mm) at each grid point.
Water 13 02761 g006
Figure 7. Spatial distribution of annual average temperature (°C) at each grid point.
Water 13 02761 g007
Figure 8. (a). Mann–Kendall and Sen’s slope test results of the drought severity and frequency of historical droughts for the SPI, SP*ETI, and SPEI drought indicators. Blue triangles represent a significant decreasing trend and red triangles represent a significant increasing trend. (b). Mann–Kendall and Sen’s slope test results of the drought severity of NF and FF for the SPI, SP*ETI, and SPEI drought indicators. Blue triangles represent a significant decreasing trend and red triangles represent a significant increasing trend. (c). Mann–Kendall and Sen’s slope test results of the drought frequency of NF and FF for the SPI, SP*ETI, and SPEI drought indicators. Blue triangles represent a significant decreasing trend and red triangles represent a significant increasing trend.
Water 13 02761 g008aWater 13 02761 g008b
Figure 9. (a) The variations in drought area for different clusters with time over Hist. Blue line represents SPI data, and the red line represents SPEI data, and the green line represents SP*ETI data. (b) The variations in drought area for different clusters with time under RCP 4.5. (c) The variations in drought area for different clusters with time under RCP 8.5.
Water 13 02761 g009aWater 13 02761 g009b
Figure 10. The distribution of the drought hazard index for different clusters.
Water 13 02761 g010
Figure 11. Average area percentages in clusters with different periodicities. The grouped bars on the lower X-axis represent the dominant average periodicities in the first half of the century (from 2021 to 2050), and the corresponding percentages of areas can be read on the left Y-axis (unit: %). The grouped bars on the upper X-axis represent the dominant average periodicities in the second half of the century (from 2071 to 2100), and the corresponding area percentages can be read on the right Y-axis (unit: %).
Water 13 02761 g011
Table 1. The RCMs to be optimized.
Model No.InstituteDriving Model
model1Max Planck Institute for Meteorology(Germany)MPI-ESM-MR
model2Max Planck Institute for Meteorology(Germany)MPI-ESM-LR
model3NOAA Geophysical Fluid Dynamics Laboratory (USA)GFDL-ESM2M
model4NOAA Geophysical Fluid Dynamics Laboratory (USA)GFDL-CM3
model5Centre National de Recherches Météorologiques and Centre Européen de Recherche et Formation Avancée en Calcul Scientifique (France)CNRM-CM5
model6UK Met Office Hadley Centre (UK)HadGEM2-ES
model7UK Met Office Hadley Centre (UK)HadGEM2-AO
model8University of Tokyo, National Institute for Environmental Studies, and Japan Agency for Marine-Earth Science and Technology(Japan)MIROC5
model9National Centre for Atmospheric Research(USA)CCSM4
Table 2. Results of the modified Mann–Kendall and Sen’s slope test for the given precipitation, PET and temperature. Values of 1 and 0 represent a significantly increasing trend and no significant trend, respectively. The significance level is 0.05. Unit of values of Sen’s slope for precipitation, potential evaporation and temperature is mm/year, mm/year, °C/year, respectively.
Sen’s Slope
Precipitation Potential EvapotranspirationTemperature
RCP 4.5RCP 8.5RCP 4.5RCP 8.5RCP 4.5RCP 8.5
Cluster 10.8831.421.0232.4910.0380.079
Cluster 21.5812.2330.8871.8440.0330.068
Cluster 31.6992.0060.9431.8930.0340.069
Cluster 40.7141.5091.4662.8330.0430.088
Cluster 50.6361.4941.7573.3070.0410.083
Cluster 62.7783.4162.2415.5150.0360.072
Cluster 73.9562.6112.8319.0920.0330.074
Cluster 82.853.0372.5556.9440.0340.067
Modified Mann–Kendall’s test
Cluster 1111111
Cluster 2111111
Cluster 3111111
Cluster 4011111
Cluster 5011111
Cluster 6111111
Cluster 7111111
Cluster 8111111
Table 3. Average values of Sen’s slope of the average annual severity and frequency of different clusters for Hist, NF, and FF (unit: 1‰). Positive values, “0” and negative values represent a significantly increasing trend, non-significant trend, and a significantly decreasing trend, respectively.
Cluster 1Cluster 2Cluster 3Cluster 4
SevFreqSevFreqSevFreqSevFreq
SPIHist−14−353124−8−2
RCP4.5NF−16−2−9−2−12−390
RCP4.5FF−14−2−1−4−16−2−300
RCP8.5NF−14−4−2−2−6−3−9−4
RCP8.5FF−28−3−27−3−26−4−19−4
SP*ETIHist−14−34494−5−2
RCP4.5NF−9−1929039−2
RCP4.5FF−12−13−2−15−1−295
RCP8.5NF11−132−128−1212
RCP8.5FF37014025−14−2
SPEIHist−12−126634810
RCP4.5NF236376292838
RCP4.5FF−27−65−5−24−4−623
RCP8.5NF71−265150332−4
RCP8.5FF−35−2−46−5−29−3−44−1
Cluster 5Cluster 6Cluster 7Cluster 8
SevFreqSevFreqSevFreqSevFreq
SPIHist−60103180111
RCP4.5NF81−10−4−10−2−21−4
RCP4.5FF−200−16−2−6−5−2−1
RCP8.5NF−23−5−7−34−5−9−3
RCP8.5FF−11−2−15−3−5−2−17−2
SP*ETIHist−4082170193
RCP4.5NF242101−10−3−23
RCP4.5FF−324−14110−1−24−4
RCP8.5NF−26117022−420−1
RCP8.5FF5020−28−2160
SPEIHist33234281325
RCP4.5NF7411373282−55
RCP4.5FF−393−180−1−3−10
RCP8.5NF14060179−1653
RCP8.5FF1151846510249
Table 4. The results of the modified Mann–Kendall test of the drought area ratio of clusters. The indicators “+”, “0”, and “-” represent a significantly increasing trend, no significant trend, and a significantly decreasing trend, respectively. N represents NF (2021–2050), F represents FF (2071–2100), and T represents Total Future (TF, 2006–2100).
Cluster 1Cluster 2Cluster 3Cluster 4Cluster 5Cluster 6Cluster 7Cluster 8
RCPNFTNFTNFTNFTNFTNFTNFTNFT
SPI4.50-00-00-00000000-00-0000
SPI8.500++-00000-00000000+0++0
SPEI4.5+-00-00-0+00+000-00-0000
SPEI8.5+0++-0+000000+0+++++++++
SP*ETI4.5000000000000000000000+00
SP*ETI8.50+00000000-0000000000000
Table 5. Drought hazard indices for the different clusters.
Cluster 1Cluster 2Cluster 3Cluster 4Cluster 5Cluster 6Cluster 7Cluster 8
SPIHist1.411.291.101.021.151.011.231.37
RCP4.51.511.551.611.421.381.481.471.13
RCP8.51.551.521.531.231.621.611.701.64
SPETHist1.541.401.301.171.301.171.301.30
RCP4.51.741.651.771.721.731.691.751.69
RCP8.51.871.751.791.861.911.791.871.78
SP*ETIHist1.611.561.551.451.551.481.621.58
RCP4.51.641.681.671.651.631.651.761.64
RCP8.51.691.691.631.751.651.621.641.78
Publisher’s Note: MDPI stays neutral with regard to jurisdictional claims in published maps and institutional affiliations.

