
Using Dual Isotopes of Nitrate to Identify the Source of Nitrogen Pollution in the Songhua River Basin, Northeast China
by
 , and
, and
Kuangmin Ye
1,2, 
Fansheng Meng
1,*,
Lingsong Zhang
1,
Yeyao Wang
3,
Hao Xue
1 and
Daoping Zhang
1 1
Chinese Research Academy of Environmental Sciences, Beijing 100012, China
2
Shenzhen Academy of Environmental Sciences, Shenzhen 518002, China
3
China National Environmental Monitoring Centre, Beijing 100012, China
*
Author to whom correspondence should be addressed.
Water 2021, 13(19), 2721; https://doi.org/10.3390/w13192721
Submission received: 18 August 2021
/
Revised: 22 September 2021
/
Accepted: 28 September 2021
/
Published: 1 October 2021
Abstract
:Nitrogen pollution is a severe problem in the Songhua River Basin (SHR) in China. Samples were collected from 36 sections of the SHR during the high, low, and flat seasons of the river, and the main sources of nitrogen in the water were qualitatively analyzed with isotope data for nitrogen and oxygen of nitrate. The contribution rates of each major pollution source were quantitatively analyzed using the Iso Source mass balance model. The results from these experiments indicate that the values for δ15N-NO3 and δ18O-NO3 in the flat flow season range from 1.52‰ to 14.55‰ and −14.26‰ to 2.03‰, respectively. The values for δ15N-NO3 and δ18O-NO3 in the low flow season range from 6.66‰ to 15.46‰ and −5.82‰ to 65.70‰, respectively. In the low flow season, nitrogen comes from the input of domestic and manure sewage (53%) and soil organic N (45%). The values of δ15N-NO3 and δ18O-NO3 in the high flow season range from 2.07‰ to 14.24‰ and −3.99‰ to 8.03‰, respectively. In the high flow season, nitrogen comes from soil organic nitrogen (41%), domestic and manure sewage (32%), and nitrogen fertilizer (27%), which are the main sources of nitrogen pollution in the SHR. The conclusions from the qualitative and quantitative analysis of nitrogen sources in the SHR can provide a scientific basis for the source control and treatment of nitrogen pollution.
1. Introduction
The Songhua River Basin (SHR), one of the seven river basins in China, is located in Northeast China, which is an important commodity grain base and industrial base in China. Agriculture and industry play a major role in the basin, and agricultural cultivation, industrial production, and urban development have important effects on the river nitrogen concentrations. China attaches great importance to water pollution in the SHR, and carries out effective large-scale pollution prevention and control in the SHR. In recent years, the water quality in the SHR has been improved [1,2]. However, with the continuous development of economy and society, the environmental pressure on water in the SHR is still increasing, and the carrying capacity is decreasing [3]. Water quality is greatly affected by the low flow season, and the concentration of nitrogen and phosphorus pollutants in the water is higher than standard guidelines [4,5,6,7].
The isotope tracer technique is one of the most commonly used methods in the study of pollutant tracing [8]. Methodologies based on the use of isotopes in a full spectrum of hydrological problems encountered in water resource assessment, development, and management activities are already scientifically established and are an integral part of many water resource investigations and environmental studies [9]. Yue et al. used stable isotope techniques to study the source and transfer of nitrogen in the low and high flow seasons in the Liaohe River in China, and determined that the range of nitrate nitrogen isotopes in the high flow season exhibit a larger range than in the low flow season. The main sources of nitrate pollution during the high flow season include human and animal excrement, internal nitrification, industrial sewage, and random wastewater input. The nitrate sources during the low flow season are industrial and domestic sewage [10,11]. Li et al. accurately analyzed the source, migration, and transformation of nitrate in the Xijiang River Basin using the nitrate isotope tracer technique and Bayesian stable isotope analysis model [12]. Ma et al. analyzed the nitrogen pollution source in the Ashi River during the low flow season by combining stable nitrogen isotope technique, hydrochemical analysis, and geographic information technology [13]. IsoSource isotope model is based on the source analytical model and the principle of mass conservation of stable isotopes. It can be used to quantify different nitrate pollution sources [14,15].
In recent years, nitrogen has become one of the main environmental pollutants in the SHR; it affects the assessment of water quality in the SHR. Analyzing the main source is very important for nitrogen pollution control in the SHR. In this study, the isotope tracer technique was used to analyze the main source of nitrogen pollution in the SHR, and the IsoSource mass balance model was used to calculate the pollution contribution rate of the major pollutants in each water stage [16]. Based on the source analysis of the low, high, and flat seasons, the main sources of nitrogen in the SHR were comprehensively evaluated, providing scientific and technological support for nitrogen pollution control in the SHR. It can also provide reference for nitrogen source apportionment in other watersheds.
2. Materials and Methods
2.1. Study Area
The SHR is located in Northeast China. It has distinct water periods, in which November–April is the low flow season (period of ice sealing); May and September–October are the flat flow seasons; and June–August is the high flow season.
The SHR is divided into three main regions, including the Nen River, the Upper Reach SHR, and the main stream of the SHR. The SHR study site location in China is shown in Figure 1a. Thirty-six research sections were selected along the main stream and heavily polluted tributaries of the SHR for sampling in different seasons. The distribution of the 36 research sections is shown in Figure 1b. The Upper Reach SHR has 15 research sections in the Jilin–Changchun region, as shown in Figure 1c. There are six research sections in the confluence area of three rivers, as shown in Figure 1d. In addition, there are 15 research sections in the Harbin–Jiamusi region of the main stream of the SHR, as shown in Figure 1e.
The research focuses on the tributaries of the Ashi River, Hulan River, Woken River, Mudan River, Yitong River, and Yinma River, especially the variation in characteristics and major sources of pollutants of the Yitong River Basin.
2.2. Analytical Procedures
The Environmental Stable Isotope Laboratory of Chinese Academy of Agricultural Sciences was entrusted to determine the nitrate nitrogen isotope δ15N-NO3 and the nitrate oxygen isotope δ18O-NO3. The Laboratory has actively cooperated with seven stable isotope laboratories in Europe and participated in international comparison. The experimental results have been recognized and highly praised by international peers. The laboratory uses the reference materials of IAEA and USGS to calibrate the relevant results, and uses the international standard determination method to determine the stable isotopes of C, H, O, N, and S, so as to ensure the accuracy of the results.
Nitrogen isotope fractionation produced by various metabolic activities results in different ratios of isotopes among different substances. Therefore, each nitrogen pollution source will have a specific range of δ15N-NO3 and δ18O-NO3 [17,18,19]. Comparing the measured values of δ15N-NO3 and δ18O-NO3 at each sampling site with the fixed values of δ15N-NO3 and δ18O-NO3 from each pollution source can qualitatively identify the main source of N in water. The range of δ15N-NO3 values are shown in Table 1, and the range of δ18O-NO3 values are shown in Table 2. Compared with using just δ15N-NO3 for source analysis, adding δ18O-NO3 as an auxiliary means can improve the accuracy of source analysis [20,21].
Two oxygen atoms in NO3− formed by nitrification are derived from H2O in the environment, and the other oxygen comes from atmospheric O2. According to the data from International Atomic Energy Agency (IAEA), the δ18Oair in the northeast region of China is about 23.9‰, and the 18O-H2O in the SHR is about −12.7‰ to −9.7‰, so the variation range of δ15N-NO3 generated by the nitrification reaction can be calculated as −0.5‰ to 1.5‰ [22,23]. At the same time, some studies have shown that denitrification will lead to the enrichment of both δ15N-NO3 and δ18O-NO3 in nitrate. If there is a linear enrichment ratio between δ15N-NO3 and δ18O-NO3 with a balance of 1.3:1 to 2.1:1, it indicates the possible existence of denitrification occurring in the water [24].
In order to quantitatively analyze the main sources of N pollution in the SHR, this research combined the IsoSource model with δ15N-NO3 and δ18O-NO3 to calculate the contribution rate of different pollution sources to N pollution [25,26]. The basic IsoSource model can calculate the contribution rate of nitrate in three pollution sources, which are expressed as [14,15]:
δ15Nm = f1 δ15 N1 + f2 δ15 N2 + f3 δ15 N3
δ18Om = f1 δ18 O1 + f2 δ18 O2 + f3 δ18 O3
1 = f1 + f2 + f3
In Equation, δ15Nm and δ18Om are the values of δ15N-NO3 and δ18O-NO3 at the sampling sites, respectively; δ15Ni (i = 1,2,3) and δ18Oi (i = 1,2,3) are the average values of δ15N-NO3 and δ18O-NO3 for the three pollution sources, and are the contribution rates of the three pollution sources [27]. In the SHR, soil organic nitrogen, domestic and manure sewage, and atmospheric deposition are the three main pollution sources in the low flow season. Soil organic nitrogen, nitrogen fertilizers, and domestic and manure sewage are the main three pollution sources during the flat and high flow season [2,5].

Table 1.
Range of δ15N-NO3 for different sources.
| Pollution Source | δ15N-NO3/‰ | Reference | |
|---|---|---|---|
| Range | Mean | ||
| NO3− deposition from atmosphere | −7.0 to 8.0 | 0.5 | [28,29] |
| NH4+-N of rain | −10.0 to 3.0 | −3.5 | [30] |
| Soil organic nitrogen | 2.0 to 9.0 | 5.5 | [30,31] |
| Sewage | 10.0 to 18.0 | 14.0 | [30,31,32] |
| Manure wastewater | 8.0 to 25.0 | 16.5 | [30,33] |
| Nitrogen fertilizer | −3.0 to 4.0 | 0.5 | [34,35,36,37] |
2.3. Measurement of Isotope Calculations
To comprehensively analyze the main source of nitrogen in the SHR, sampling was carried out according to the hydrological characteristics of the SHR. Samples were collected during the flat flow season in September 2018, during low flow season in March 2019, and during high flow season in August 2019. The δ15N-NO3 and δ18O-NO3 were measured by using the denitrifying bacteria method, implemented in the Environmental Stable Isotope Laboratory, Chinese Academy of Agricultural Sciences. The values of δ15N-NO3 and δ18O-NO3 are shown in Table 3.
3. Results and Discussion
3.1. Source Analysis of Nitrogen in Low Flow Season
3.1.1. Qualitative Source Analysis
During the low flow season of the SHR, the self-purification ability of the water was weak, because the water surface was frozen, the flow rate was slow, and the temperature was low. Thirty-five water samples were collected from the research sections during the low flow season; the δ15N and δ18O values of nitrate in the SHR during low flow season are shown in Figure 2.
- (1)
- The Nen River Basin includes NJ02 and NJ01. NJ02 had values of δ15N-NO3 and δ18O-NO3 of 10.08‰ and −0.63‰, respectively, and NJ01 had values of 10.06‰ and −1.79‰, respectively. The source of nitrogen at these two sites is sewage and manure wastewater.
- (2)
- The upper reach of the SHR from Jilin city to Songyuan city has eight research sections, and the values of δ15N-NO3 and δ18O-NO3 ranged from 7.34‰ to 11.27‰ and −2.35‰ to −0.67‰, respectively. Among them, the nitrogen source to ES01, upstream of Jilin city, is mainly soil organic nitrogen, while the nitrogen source to ES04 and ES17, downstream of Jilin city and Songyuan city, is mainly domestic and manure sewage.
- (3)
- The Yitong River Basin flows through Changchun city. The values of δ15N-NO3 and δ18O-NO3 in the eight sections in the Yitong River ranged from 11.59‰ to 15.46‰ and from −2.42‰ to 3.17‰, respectively. Domestic and manure sewage is the main source of nitrogen to this portion of the river basin.
- (4)
- There are 10 research sections in main stream of the Harbin region. The values for δ15N-NO3 and δ18O-NO3 ranged from 6.66‰ to 13.76‰ and 2.17‰ to 65.70‰, respectively. According to the isotopic values, domestic and manure sewage and soil organic nitrogen are the two main sources of nitrogen in this region. By comparing the values upstream and downstream of Harbin, the main source of nitrogen changes from soil organic nitrogen to domestic and manure sewage after the inflow of the Ashi River, which may be related to the sewage treatment plant along the Ashi River. In addition, according to the isotopic analysis, the main source of nitrogen in the Hulan River is atmospheric deposition.
- (5)
- There are seven research sections in the main stream of Yilan city to Jiamusi city region, where the δ15N-NO3 and δ18O-NO3 values ranged from 7.68‰ to 10.19‰ and −5.82‰ to −1.92‰, respectively. Soil organic nitrogen and domestic and manure sewage are the main nitrogen sources in this region. Nitrogen in the Mudan River mainly comes from soil organic nitrogen, and nitrogen in the Woken River and upstream of the Jiamusi section mainly comes from domestic and manure sewage, which may be related to the urban domestic sewage input of Yilan city and Jiamusi city.
The main sources of nitrogen pollution during the low flow season include domestic and manure sewage, soil organic nitrogen, and atmospheric deposition.
3.1.2. Contribution Rates
According to the qualitative source analysis focused on the Ashi River, Yitong River, and the main stream of Harbin region, these regions are all greatly influenced by human activities. The contribution rates of the three major pollution sources during the low flow season are shown in Figure 3.
During the low flow season, domestic and manure sewage is the main source of nitrogen pollution in the Ashi River, Yitong River, Woken River, and the urban downstream section of the main stream. Comparing upstream and downstream of the city, the contribution rate of domestic and manure sewage increases after flowing through the city during the low flow season, for example, as for GL17 (51%). In the Yitong River, the contribution of domestic and manure sewage to sections ES07 and ES08 reached 100% and 98%, respectively. The contribution of domestic and manure sewage to ES06 reached 66%, which is nearly twice as high as for ES05 (38%). Water pollution in the Yitong River greatly impacts the upper reach of the SHR. The contribution rate of domestic and manure sewage was high in the main stream of Harbin region, with a peak value in section GL05 (92%), which was related to the discharge of the main sewage treatment plant in Harbin city. The discharge of domestic and manure sewage is the controlling factor of nitrogen pollution in the Yitong River, Ashi River, and the urban section during the low flow season.
During the low flow season, input of soil organic nitrogen is the main source of nitrogen pollution upstream of the upper reach of the SHR, the main stream of the nonurban river section, and the Mudan River. For example, soil organic nitrogen contributed 77% to ES01, 79% to GL13, and 78% to GL15. Atmospheric deposition contributed 2% of nitrogen pollution, mainly in GL07 (65%).
According to the quantitative analysis, the main source of nitrogen pollution in the SHR during the low flow season is domestic and manure sewage, with an average contribution rate of 53%. The urban section of the main stream, the Ashi River, and the Yitong River are the areas with a high contribution rate of domestic and manure sewage. The point source pollution input from cities such as Changchun and Harbin influence the nitrogen concentration during the low flow season. Compared with the high flow season and flat flow season, the contribution rate of domestic and manure sewage is higher during the low flow season and causes severe pollution. In the nonurban region, soil organic nitrogen was the main nitrogen source, with an average contribution rate of 45%. The low temperature, low flow rate, and low self-purification ability are the main internal reasons for heavy nitrogen pollution during the low flow season, and urban point source pollution is the most important external factor. More attention should be paid to the control of urban point source discharge to the SHR to reduce nitrogen pollution during the low flow season. There is no contribution of nitrogen fertilizer to nitrogen pollution during the low flow season, as the surface water is frozen and there are no agricultural activities, preventing surface runoff and resulting in the significant reduction of agricultural nonpoint sources.
3.2. Source Analysis of N in the High Flow Season
3.2.1. Qualitative Source Analysis
During the sampling period in August 2019, the SHR was affected by severe flooding, among which the Yitong River and the upper reach of the SHR were the most serious. The water level exceeded the river limits, and roads and farmland along the river were flooded. The water level of the Nen River, the main stream of the SHR, and its tributaries also exceeded the warning water level. The δ15N and δ18O values of nitrate in the SHR during high flow season are shown in Figure 4.
- (1)
- The δ15N-NO3 and δ18O-NO3 values for NJ02 in the Nen River region were 3.70‰ and −1.90‰, and the values for NJ01 were 2.41‰ and −3.83‰, respectively. Nitrogen in the two sections of the Nen River during the high flow season is mainly from nitrogen fertilizer and soil organic nitrogen input.
- (2)
- The δ15N-NO3 and δ18O-NO3 values from Jilin city to the Songyuan city region of the upper reach of the SHR were 7.31‰ to 10.67‰ and −2.04‰ to 3.04‰, respectively. The nitrogen at ES01 is mainly from soil organic nitrogen, while the nitrogen in the downstream sections of Jilin city is mainly from domestic and manure sewage.
- (3)
- The δ15N-NO3 and δ18O-NO3 values for the eight sections of the Yitong River ranged from 4.61‰ to 14.24‰ and 1.64‰ to 8.03‰, respectively. Among them, the source of nitrogen of ES11 is soil organic nitrogen, as upstream of ES11 is the Xinlicheng Reservoir, which has little influence because of the water source area. The urban area of Changchun city and Kaoshan town are affected by domestic and manure sewage. In addition, nitrogen in the water of ES14 and ES15 is affected by denitrification, because the linear enrichment ratio between δ15N-NO3 and δ18O-NO3 of ES14 and ES15 is 1.54:1 and 1.77:1.
- (4)
- The δ15N-NO3 values for the eight main stream sections in the main stream of the Harbin region ranged from 2.07‰ to 9.33‰, and the δ18O-NO3 values ranged from −2.84‰ to 3.38‰. The source of nitrogen is affected by soil organic nitrogen, domestic and manure sewage, and nitrogen fertilizer.
- (5)
- The δ15N-NO3 and δ18O-NO3 values for the main stream from Yilan city to Jiamusi region ranged from 2.47‰ to 7.48‰ and −3.99‰ to 0.10‰, respectively, where the main source is soil organic nitrogen, followed by nitrogen fertilizer. The main source of nitrogen in the Mudan River is soil organic nitrogen, and the main source of nitrogen at GL14 is nitrogen fertilizer.
The main sources of nitrogen in the SHR during the high flow season include soil organic nitrogen, domestic and manure sewage, and nitrogen fertilizer. Compared with the source of nitrogen in the low flow season, in the high flow season nitrogen fertilizer replaced atmospheric deposition as one of the main sources, which was related to the increased use of nitrogen fertilizer during the agricultural farming period.
3.2.2. Contribution Rates
The contribution rates of the three major pollution sources in the high flow season of the SHR are shown in Figure 5.
Soil organic nitrogen was the main source in the nonurban sections during the high flow season. For example, the soil organic nitrogen contribution rate of ES01 upstream of Jilin city was 86%. In the intersection area of the Nen River and the Second SHR, the contribution rate of soil organic nitrogen was about 61%, with the peak value at NJ01 (100%). The contribution rate of soil organic nitrogen from Yilan to Jiamusi region was about 76%, and the peak values were at GL16 (100%) and GL17 (100%). These areas are less affected by human activities, and most are main stream areas with a high and fast water flow rate, where river bank soil organic nitrogen is more likely to enter into water.
The domestic and manure sewage contribution rate in the region downstream of Jilin city increased to about 64%. The peak value of domestic and manure sewage contribution rate was at ES02 (68%) and ES05 (67%).
The nitrogen source of the main stream in the region downstream of Harbin, the Ashi River, and Hulan River is mainly from nitrogen fertilizer and domestic and manure sewage. For example, the contribution rate of domestic and manure sewage at GL06 was 40%, and that of nitrogen fertilizer is 41%. The contribution of nitrogen fertilizer at GL07 and GL14 reached 64% and 68% respectively. The contribution rate of nitrogen fertilizer at GL04 was 57%, and that of domestic and manure sewage was 30%. The contribution rate of nitrogen fertilizer at GL10 was 52%, and that of domestic and manure sewage was 48%.
During the high flow season in the Yitong River, the source of nitrogen is relatively complex, and the contribution rate of the three pollution sources may be related to the complicated hydrological conditions of the high flow season. Taking ES13 as an example, the contribution rate of domestic and manure sewage is 34%, the contribution rate of nitrogen fertilizer is 19%, and the contribution rate of soil organic nitrogen is 47%. In contrast, the area of Kaoshan town of the Yitong River is mainly affected by domestic and manure sewage, such as ES15 (97%), and ES07 (70%). The middle and lower reaches of the Yitong River are affected by domestic and manure sewage and nitrogen fertilizer. The contribution rates of domestic and manure sewage and nitrogen fertilizer at ES08 are 55% and 45%, respectively. The contribution rate of domestic and manure sewage at ES10 is 55%, and the contribution rate of nitrogen fertilizer is 31%.
The contribution rates of all kinds of nitrogen pollution sources in the SHR during the high flow season are higher on average than during the low flow and flat flow seasons. The average contribution rates of soil organic nitrogen, domestic and manure sewage and nitrogen fertilizer during the high flow season are 41%, 32%, and 27%, respectively, which may be related to the heavy rainfall and high water levels in the SHR during high flow season. The contribution rate of domestic and manure sewage decreased compared with that of low flow season, which was closely related to the strong self-purification ability of water in high flow season. In addition, the contribution rate of nitrogen fertilizer during the high flow season is higher than that in the other two seasons. Therefore, it is necessary to control the use of fertilizer in high flow season.
3.3. Source Analysis of N in the Flat Flow Season
3.3.1. Qualitative Source Analysis
Sixteen water samples from the research sections were collected during the flat flow season (September 2018). The δ15N and δ18O values of nitrate in the SHR during high flat season are shown in Figure 6.
- (1)
- The values for δ15N-NO3 and δ18O-NO3 at the cross area of the Nen River, Second SHR, and the main stream of the SHR ranged from 5.20‰ to 9.33‰ and −7.48‰ to 1.32‰, respectively. The nitrogen at NJ01 and GL02 is mainly from soil organic nitrogen. The nitrogen at ES17 is mainly affected by domestic and manure sewage.
- (2)
- The values for δ15N-NO3 and δ18O-NO3 in the Yitong River sections ranged from 1.52‰ to 7.18‰ and −14.26‰ to −10.14‰, respectively. Nitrogen fertilizers and soil organic nitrogen are the main sources of nitrogen in the Yitong River during the flat flow season.
- (3)
- The δ15N-NO3 and δ18O-NO3 of the Harbin region of the main stream of the SHR ranged from 3.00‰ to 11.15‰ and −2.88‰ to −0.01‰. The nitrogen upstream of the city comes from soil organic nitrogen, the nitrogen at GL05 of the Ashi River comes from domestic and manure sewage, and the main source of nitrogen at GL07 of the Hulan River is nitrogen fertilizer and soil organic nitrogen.
- (4)
- The values of δ15N-NO3 and δ18O-NO3 in the region from Yilan city to Jiameri of the main stream ranged from 5.96‰ to 14.55‰ and −9.06‰ to 2.33‰, respectively. The Mudan River is mainly affected by soil organic nitrogen from the natural environment. The nitrogen source at GL14 is domestic and manure sewage, which may be related to the input of the urban point source in Yilan city.
The sources of nitrogen in the flat flow season include soil organic nitrogen, domestic and manure sewage, and nitrogen fertilizer, consistent with the main sources of nitrogen pollution in high flow season.
3.3.2. Contribution Rates
The contribution rates of three major nitrogen pollution sources during the flat flow season are shown in Figure 7. Soil organic nitrogen is the main source of nitrogen pollution in the Mudan River and Nen River during the flat flow season, contributing 100% of the nitrogen in all river sections.
The main tributaries of the Ashi River and the Woken River have a high contribution from domestic and manure sewage. The contribution rate of domestic and manure sewage in GL05 reached 96%, which may be caused by the location of the main sewage treatment plant in Harbin on the Ashi River. In Yilan city, the contribution rate of domestic and manure sewage in GL14 reached 98%, indicating that domestic sewage input from Yilan city is the controlling factor of nitrogen pollution in the Woken River.
However, the Yitong River, downstream of the main stream in Harbin, and the Hulan River are mainly affected by nitrogen fertilizers. In section ES15, the contribution rate of nitrogen fertilizer is 89%, which is closely related to the farming industry along the Yitong River. The contribution rate of nitrogen fertilizer in GL06 is 51%, and contribution rate of nitrogen fertilizer in GL07 is 76%. The developed agricultural land in Harbin and the high use of nitrogen fertilizers have an important impact on nitrogen pollution of the SHR during the flat flow season.
Nitrogen pollution in the SHR mainly comes from soil organic nitrogen during the flat flow season, with an average contribution rate of 60%, followed by domestic and manure sewage and nitrogen fertilizer, with average contribution rates of 21% and 19%, respectively. Compared with high flow season, the contribution rate of soil organic nitrogen is higher, but the contribution rate of nitrogen fertilizer and manure wastewater is reduced. The end of high flow and low flow seasons brings a large amount of soil substances into the water, and makes soil organic nitrogen the most important source of nitrogen. In addition, the contribution rate of domestic and manure sewage to the tributaries Ashi River and Woken River is higher in the flat flow season compared with the other two seasons, caused by point source pollution discharge. However, in the Yitong River and Hulan River, nitrogen pollution mainly comes from nitrogen fertilizer, related to the large area of farmland along the Hulan River and Yitong River.
4. Conclusions
The values for δ15N-NO3 and δ18O-NO3 in the research sections of the SHR during the flat flow season ranged from 1.52‰ to 14.55‰ and −14.26‰ to 2.03‰, respectively. Soil organic nitrogen is the primary source of nitrogen, with an average contribution rate of 60%, concentrated in the Nen River, Yinma River, and Mudan River Basins. The second highest nitrogen source is domestic and manure sewage, with an average contribution rate of 21%, and is concentrated in the Woken River, Ashi River, and the Zhaoyuan area. Finally, nitrogen fertilizer provides an average contribution rate of 19%, concentrated on the Yitong River and Hulan River Basin.
The values for δ15N-NO3 and δ18O-NO3 in the research sections of the SHR during the low flow season ranged from 6.66‰ to 15.46‰ and −5.82‰ to 65.70‰, respectively. The average contribution rate of domestic and manure sewage is 53%, which is the primary source of nitrogen in low flow season, and is concentrated in the urban river region, including the Yitong River and the main stream of the Harbin region. The average contribution rate of soil organic nitrogen is about 45%, which is mainly concentrated in the nonurban region and upstream region of the river. The average contribution rate of atmospheric nitrogen deposition in the Hulan River is 2%.
The values for δ15N-NO3 and δ18O-NO3 in the research sections of the SHR during the high flow season ranged from 2.07‰ to 14.24‰ and −3.99‰ to 8.03‰. Soil organic nitrogen is the primary source of nitrogen, with an average contribution rate of 41%. The average contribution rate of sewage and nitrogen fertilizer is 32% and 27%, respectively. The two pollution sources are mainly concentrated on the Yitong River, upstream of the Second SHR, the Ashi River, and the Hulan River. The source of nitrogen pollution is the most complex during high flow season, especially the much higher contribution rate of nitrogen fertilizer compared with the other two seasons. Understanding the source of nitrogen is necessary to improve prevention and the early warning responses to nitrogen pollution.
For the control of nitrogen in the SHR, it is necessary to control the point source input of urban production and domestic sewage in low flow season based on the nitrogen source analysis results. In high and flat flow season, the source of nitrogen is complex; the use of chemical fertilizer should be controlled primarily.
Author Contributions
K.Y. and F.M. conceived and designed the research; K.Y., L.Z., H.X. and D.Z. performed the research; K.Y. and D.Z. contributed to data analysis of this work; K.Y. and F.M. made the pictures and polished the paper; K.Y., F.M., L.Z., Y.W., H.X. and D.Z. wrote the paper. All authors have read and agreed to the published version of the manuscript.
Funding
This research was funded by National Major Science and Technology Program for Water Pollution Control and Treatment of China, grant number (2017ZX07302-002, 2015ZX07201-008).
Institutional Review Board Statement
Not applicable.
Informed Consent Statement
Not applicable.
Acknowledgments
We thank Tara Penner for editing the English text of a draft of this manuscript.
Conflicts of Interest
The authors declare no conflict of interest.
References
- Jiang, M.C.; Wang, Y.Y.; Yang, Q.; Meng, F.S.; Yao, Z.P.; Cheng, P.X. Assessment of surface water quality using a growing hierarchical self-organizing map: A case study of the Songhua River Basin, northeastern China, from 2011 to 2015. Environ. Monit. Assess. 2018, 190, 260. [Google Scholar] [CrossRef]
- Zhang, L.S.; Wang, Y.Y.; Meng, F.S.; Liu, T.L.; Zhou, Y.X. Water quality assessment of ammonia to aquatic life in Songhua River. Res. Environ. Sci. 2012, 25, 1344–1350. (In Chinese) [Google Scholar]
- Zheng, Q.Y.; Liu, S.; Wan, L.H.; Li, Y.Q.; Qi, S.Q. Water environmental quality assessment and source apportionment in Harbin section of Songhua River. Res. Environ. Sci. 2018, 31, 507–513. (In Chinese) [Google Scholar]
- Meng, F.S.; Wang, Y.Y.; Zhang, L.S.; Cheng, P.X.; Xue, H.; Meng, D.B. Organic pollutant types and concentration changes of the water from Songhua River, China, in 1975–2013. Water Air Soil Pollut. 2016, 227, 214. [Google Scholar] [CrossRef]
- Zhang, L.S.; Wang, Y.Y.; Meng, F.S.; Liu, T.L.; Ma, G.W.; Zhou, Y.X.; Liu, Y. Characteristics of Ammonia-N Pollution in Songhua River. Environ. Sci. Technol. 2013, 10, 43–48. (In Chinese) [Google Scholar]
- Lin, L.Y.; Shi, Y.; Luo, H.J.; Zhang, Y.J.; Yu, Y.; Chen, Y.H. Study on the characteristics of water pollution change of Songhua River Basin in 2001–2015. Environ. Monit. Chin. 2016, 32, 58–62. (In Chinese) [Google Scholar]
- Li, F.Y.; Wang, J.Y.; Cao, T.T.; Cui, C.W. Analyzing the reason of NH3-N pollution in icebound of Harbin section of Songhua River. Chem. Eng. 2016, 30, 28–30. (In Chinese) [Google Scholar]
- Li, Y.Z.; Chen, H.Y.; Sun, W.C. Load estimation and source apportionment of nitrogen, phosphorus and COD in the basin of Lake Baiyang. China Environ. Sci. 2021, 41, 366–376. (In Chinese) [Google Scholar]
- Barbieri, M. Isotopes in Hydrology and Hydrogeology. Water 2019, 11, 291. [Google Scholar] [CrossRef] [Green Version]
- Yue, F.J.; Li, S.L.; Liu, C.Q.; Zhao, Z.Q.; Hu, J. Using dual isotopes to evaluate sources and transformation of nitrogen in the Liao River, northeast China. Appl. Geochem. 2013, 36, 1–9. [Google Scholar] [CrossRef]
- Yue, F.J.; Li, S.L.; Hu, J. The Contribution of Nitrate Sources in Liao Rivers, China, Based on Isotopic Fractionation and Bayesian Mixing Model. Procedia Earth Planet. Sci. 2015, 13, 16–20. [Google Scholar] [CrossRef] [Green Version]
- Li, C.; Li, S.L.; Yue, F.J.; Liu, J.; Zhong, J.; Yan, Z.F.; Zhang, R.C.; Wang, Z.J.; Xu, S. Identification of sources and transformations of nitrate in the Xijiang River using nitrate isotopes and Bayesian model. Sci. Total Environ. 2019, 646, 801–810. [Google Scholar] [CrossRef] [PubMed]
- Ma, G.W.; Wang, Y.Y.; Xiang, B.; Hu, Y.; Liu, Y.P.; Wang, T.M.; Yu, H.B. Nitrogen pollution characteristics and source analysis using nitrogen isotope in Ashi River water system during dry season. Environ. Pollut. Control 2014, 36, 6–11. (In Chinese) [Google Scholar]
- Phillips, D.L.; Koch, P.L. Incorporating concentration dependence in stable isotope mixing models. Oecologia 2002, 130, 114–125. [Google Scholar] [CrossRef] [PubMed]
- Phillips, D.L.; Newsome, S.D.; Gregg, J.W. Combining sources in stable isotope mixing models: Alternative methods. Oecologia 2005, 144, 520–527. [Google Scholar] [CrossRef] [PubMed]
- Fu, J.X.; Shan, J.J.; Yuan, Y.S.; Wu, R.; Fang, Z.; Sun, J.P. Study on nitrogen source of shenfu section of Hunhe River Basin based on δ15N and δ18O. J. Shenyang Jianzhu Univ. (Nat. Sci.) 2018, 34, 165–175. (In Chinese) [Google Scholar]
- Widory, D.; Kloppmann, W.; Chery, L.; Bonnin, J.; Rochdi, H.; Guinamant, J.L. Nitrate in groundwater: An isotopic multi-tracer approach. J. Contam. Hydrol. 2004, 72, 165–188. [Google Scholar] [CrossRef]
- Chen, W.Q.; Chen, W.C.; Rao, H.H.; Zhang, L.P.; Hong, H.S. An improved ion-exchange/diffusion method for 15N isotope tracing analysis of nitrate in surface waters from watersheds. J. Environ. Sci. 2010, 22, 784–788. [Google Scholar] [CrossRef] [Green Version]
- Meghdadi, A.; Javar, N. Quantification of spatial and seasonal variations in the proportional contribution of nitrate sources using a multi-isotope approach and Bayesian isotope mixing model. Environ. Pollut. 2018, 235, 207–222. [Google Scholar] [CrossRef]
- Zhen, S.C.; Zhu, W. Analysis of isotope tracing of domestic sewage sources in Taihu Lake—A case study of Meiliang Bay and Gonghu Bay. Ecol. Indic. 2016, 66, 113–120. [Google Scholar] [CrossRef]
- Chen, Z.X. Using Nitrogen and Oxygen Isotopic Compositions in Dissolved Nitrate to Identity Nitrate Sources in Taihu Lake and Chaohu Lake, China. Ph.D. Thesis, University of Science & Technology of China, Hefei, China, 2012. (In Chinese). [Google Scholar]
- Wang, J.; Ye, Y.; Wang, Y.Q.; Wang, D.Z.; Lv, G.A.; Guo, X.S. Using δ15N and δ18O values to identify sources of nitrate in the Dianbu River in the Chaohu Lake Basin. J. Hydraul. Eng. 2017, 48, 1195–1205. (In Chinese) [Google Scholar]
- Li, X.F.; Zhang, M.J.; Ma, Q.; Li, Y.J.; Wang, S.J.; Wang, B.L. Characteristics of stable isotopes in precipitation over northeast China and its water vapor sources. Environ. Sci. 2012, 33, 2924–2931. (In Chinese) [Google Scholar]
- Chen, Z.X.; Liu, G.; Liu, W.G.; Lam, M.H.W.; Liu, G.J.; Yin, X.B. Identification of nitrate sources in Taihu Lake and its major inflow rivers in China, using δ15N-NO3− and δ18O-NO3− values. Water Sci. Technol. 2012, 66, 536–542. [Google Scholar] [CrossRef] [PubMed]
- Meng, Z.L.; Yang, Y.G.; Qing, Z.D.; Jiao, W.T. Isotopic tracing for nitrate pollution process of water body in the lower reaches of Fenhe River. China Environ. Sci. 2017, 37, 1066–1072. (In Chinese) [Google Scholar]
- Wu, W.H.; He, X.J.; Wu, H.L.; Wang, X.Z.; Shen, J. Identification of sources of nitrate in the Yongan River with isotopic technology. J. Ecol. Rural Environ. 2016, 32, 802–807. (In Chinese) [Google Scholar]
- Kang, P.P.; Xu, S.G.; Yu, S.Q. Analysis of influence of underground reservoir on nitrogen distribution through tracing of isotope source. Water Resour. Prot. 2016, 32, 79–84. (In Chinese) [Google Scholar]
- Bu, H.M.; Song, X.F.; Zhang, Y.; Meng, W. Sources and fate of nitrate in the Haicheng River basin in Northeast China using stable isotopes of nitrate. Ecol. Eng. 2017, 98, 105–113. [Google Scholar] [CrossRef]
- Zhang, J.P.; Song, X.M. Research advances on tracking multiply sources of nitrate by using stable isotopes in water. Environ. Sci. Technol. 2014, 6, 71–75. (In Chinese) [Google Scholar]
- Hu, Y.; Wang, Y.Y.; Teng, Y.G.; Xiang, B.; Ma, G.W.; Fang, G.L. Source apportionment of non-point source nitrogen pollution in Ashi River Basin using δ15N Technique. J. Agro-Environ. Sci. 2015, 12, 2327–2335. (In Chinese) [Google Scholar]
- Yue, F.J.; Liu, C.Q.; Li, S.L.; Zhao, Z.Q.; Liu, X.L.; Ding, H.; Liu, B.J.; Zhong, J. Analysis of δ15N and δ18O to identify nitrate sources and transformations in Songhua River, Northeast China. J. Hydrol. 2014, 519, 329–339. [Google Scholar] [CrossRef]
- Zhang, Y.; Li, F.D.; Zhang, Q.Y.; Li, J.; Liu, Q. Tracing nitrate pollution sources and transformation in surface- and ground-waters using environmental isotopes. Sci. Total Environ. 2014, 490, 213–222. [Google Scholar] [CrossRef]
- Ma, Z.F.; Yang, Y.; Lian, X.Y.; Jiang, Y.H.; Xi, B.D.; Peng, X.; Yan, K. Identification of nitrate sources in groundwater using a stable isotope and 3DEEM in a landfill in Northeast China. Sci. Total Environ. 2016, 563–564, 593–599. [Google Scholar]
- Yang, B.S.; Wang, H.; Jiang, Y.K.; Dong, F.; He, X.H.; Lai, X.S. Combing δ15N and δ18O to identify the distribution and the potential sources of nitrate in human-impacted watersheds, Shandong, China. RSC Adv. 2018, 8, 23199–23205. [Google Scholar] [CrossRef] [Green Version]
- Minet, E.P.; Goodhue, R.; Meier-Augenstein, W.; Kalinb, R.M.; Fenton, O.; Richards, K.G.; Coxon, C.E. Combining stable isotopes with contamination indicators: A method for improved investigation of nitrate sources and dynamics in aquifers with mixed nitrogen inputs. Water Res. 2017, 124, 85–96. [Google Scholar] [CrossRef] [PubMed] [Green Version]
- Yang, Z.; Chen, J.F.; Li, H.L.; Jin, H.Y.; Gao, S.Q.; Ji, Z.Q.; Zhu, Y.; Ran, L.H.; Zhang, J.J.; Liao, Y.B.; et al. Sources of nitrate in Xiangshan Bay (China),as identified using nitrogen and oxygen isotopes. Estuar. Coast. Shelf Sci. 2018, 207, 109–118. [Google Scholar] [CrossRef]
- Ding, J.T.; Xi, B.D.; Gao, R.T.; He, L.S.; Liu, H.L.; Dai, X.L.; Yu, Y.J. Identifying diffused nitrate sources in a stream in an agricultural field using a dual isotopic approach. Sci. Total Environ. 2014, 484, 10–18. [Google Scholar] [CrossRef]
- Lentz, R.D.; Lehrsch, G. Temporal changes in δ18O and δ15N of nitrate nitrogen and H2O in shallow groundwater: Transit time and nitrate-source implications for an irrigated tract in southern Idaho. Agric. Water Manag. 2019, 212, 126–135. [Google Scholar] [CrossRef]
- Archana, A.; Thibodeau, B.; Geeraert, N.; Xu, M.N.; Kao, S.J.; Baker, D.M. Nitrogen sources and cycling revealed by dual isotopes of nitrate in a complex urbanized environment. Water Res. 2018, 142, 459–470. [Google Scholar] [CrossRef]
- Saccon, P.; Leis, A.; Marca, A.; Kaiser, J.; Campisi, L.; Böttcher, M.E.; Savarino, J.; Escher, P.; Eisenhauer, A.; Erbland, J. Multi-isotope approach for the identification and characterisation of nitrate pollution sources in the Marano lagoon (Italy) and parts of its catchment area. Appl. Geochem. 2013, 34, 75–89. [Google Scholar] [CrossRef] [Green Version]
Figure 1.
Sampling sections diagram. (a) Location of the SHR in China. (b) General sampling sections of the SHR. (c) Sampling sections the Jilin–Changchun river reach. (d) Sampling sections of in the confluence area of three rivers. (e) Sampling sections of the Harbin–Jiamusi river reach.
Figure 1.
Sampling sections diagram. (a) Location of the SHR in China. (b) General sampling sections of the SHR. (c) Sampling sections the Jilin–Changchun river reach. (d) Sampling sections of in the confluence area of three rivers. (e) Sampling sections of the Harbin–Jiamusi river reach.

Figure 2.
The relationship between δ15N and δ18O values of nitrate in the SHR during low flow season.
Figure 2.
The relationship between δ15N and δ18O values of nitrate in the SHR during low flow season.
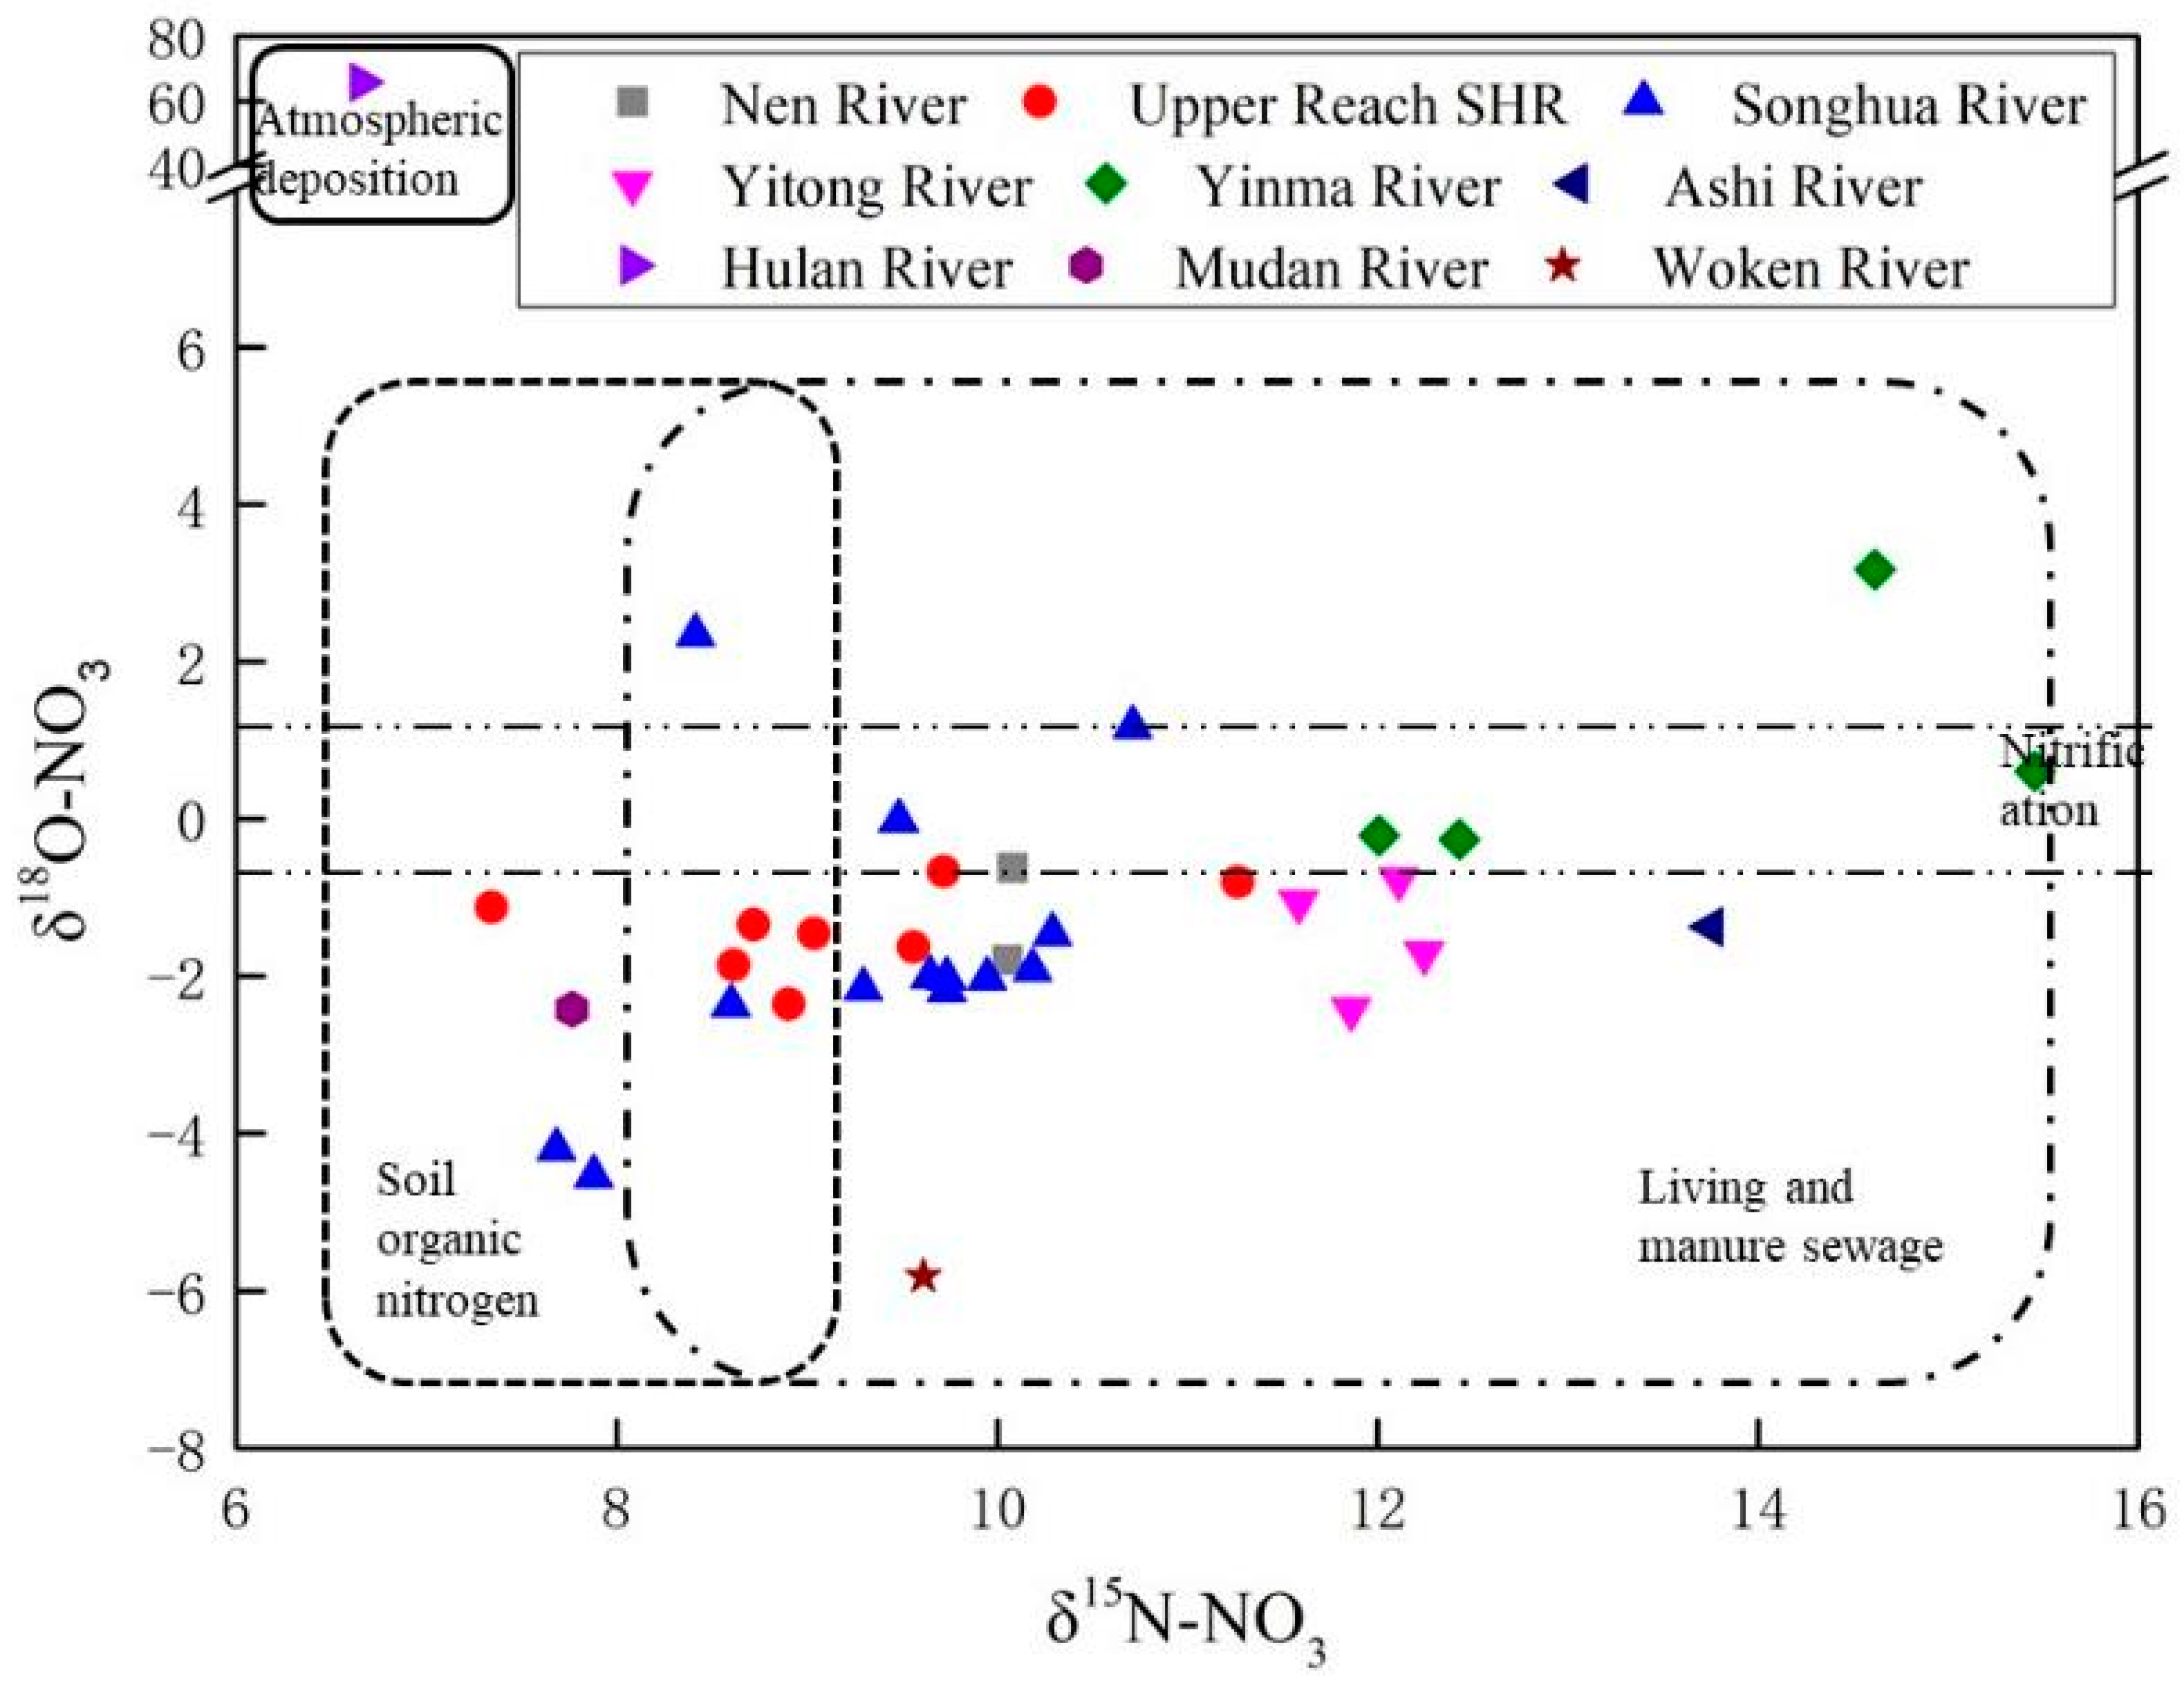
Figure 3.
The contribution rate of nitrogen to the SHR during low flow season.
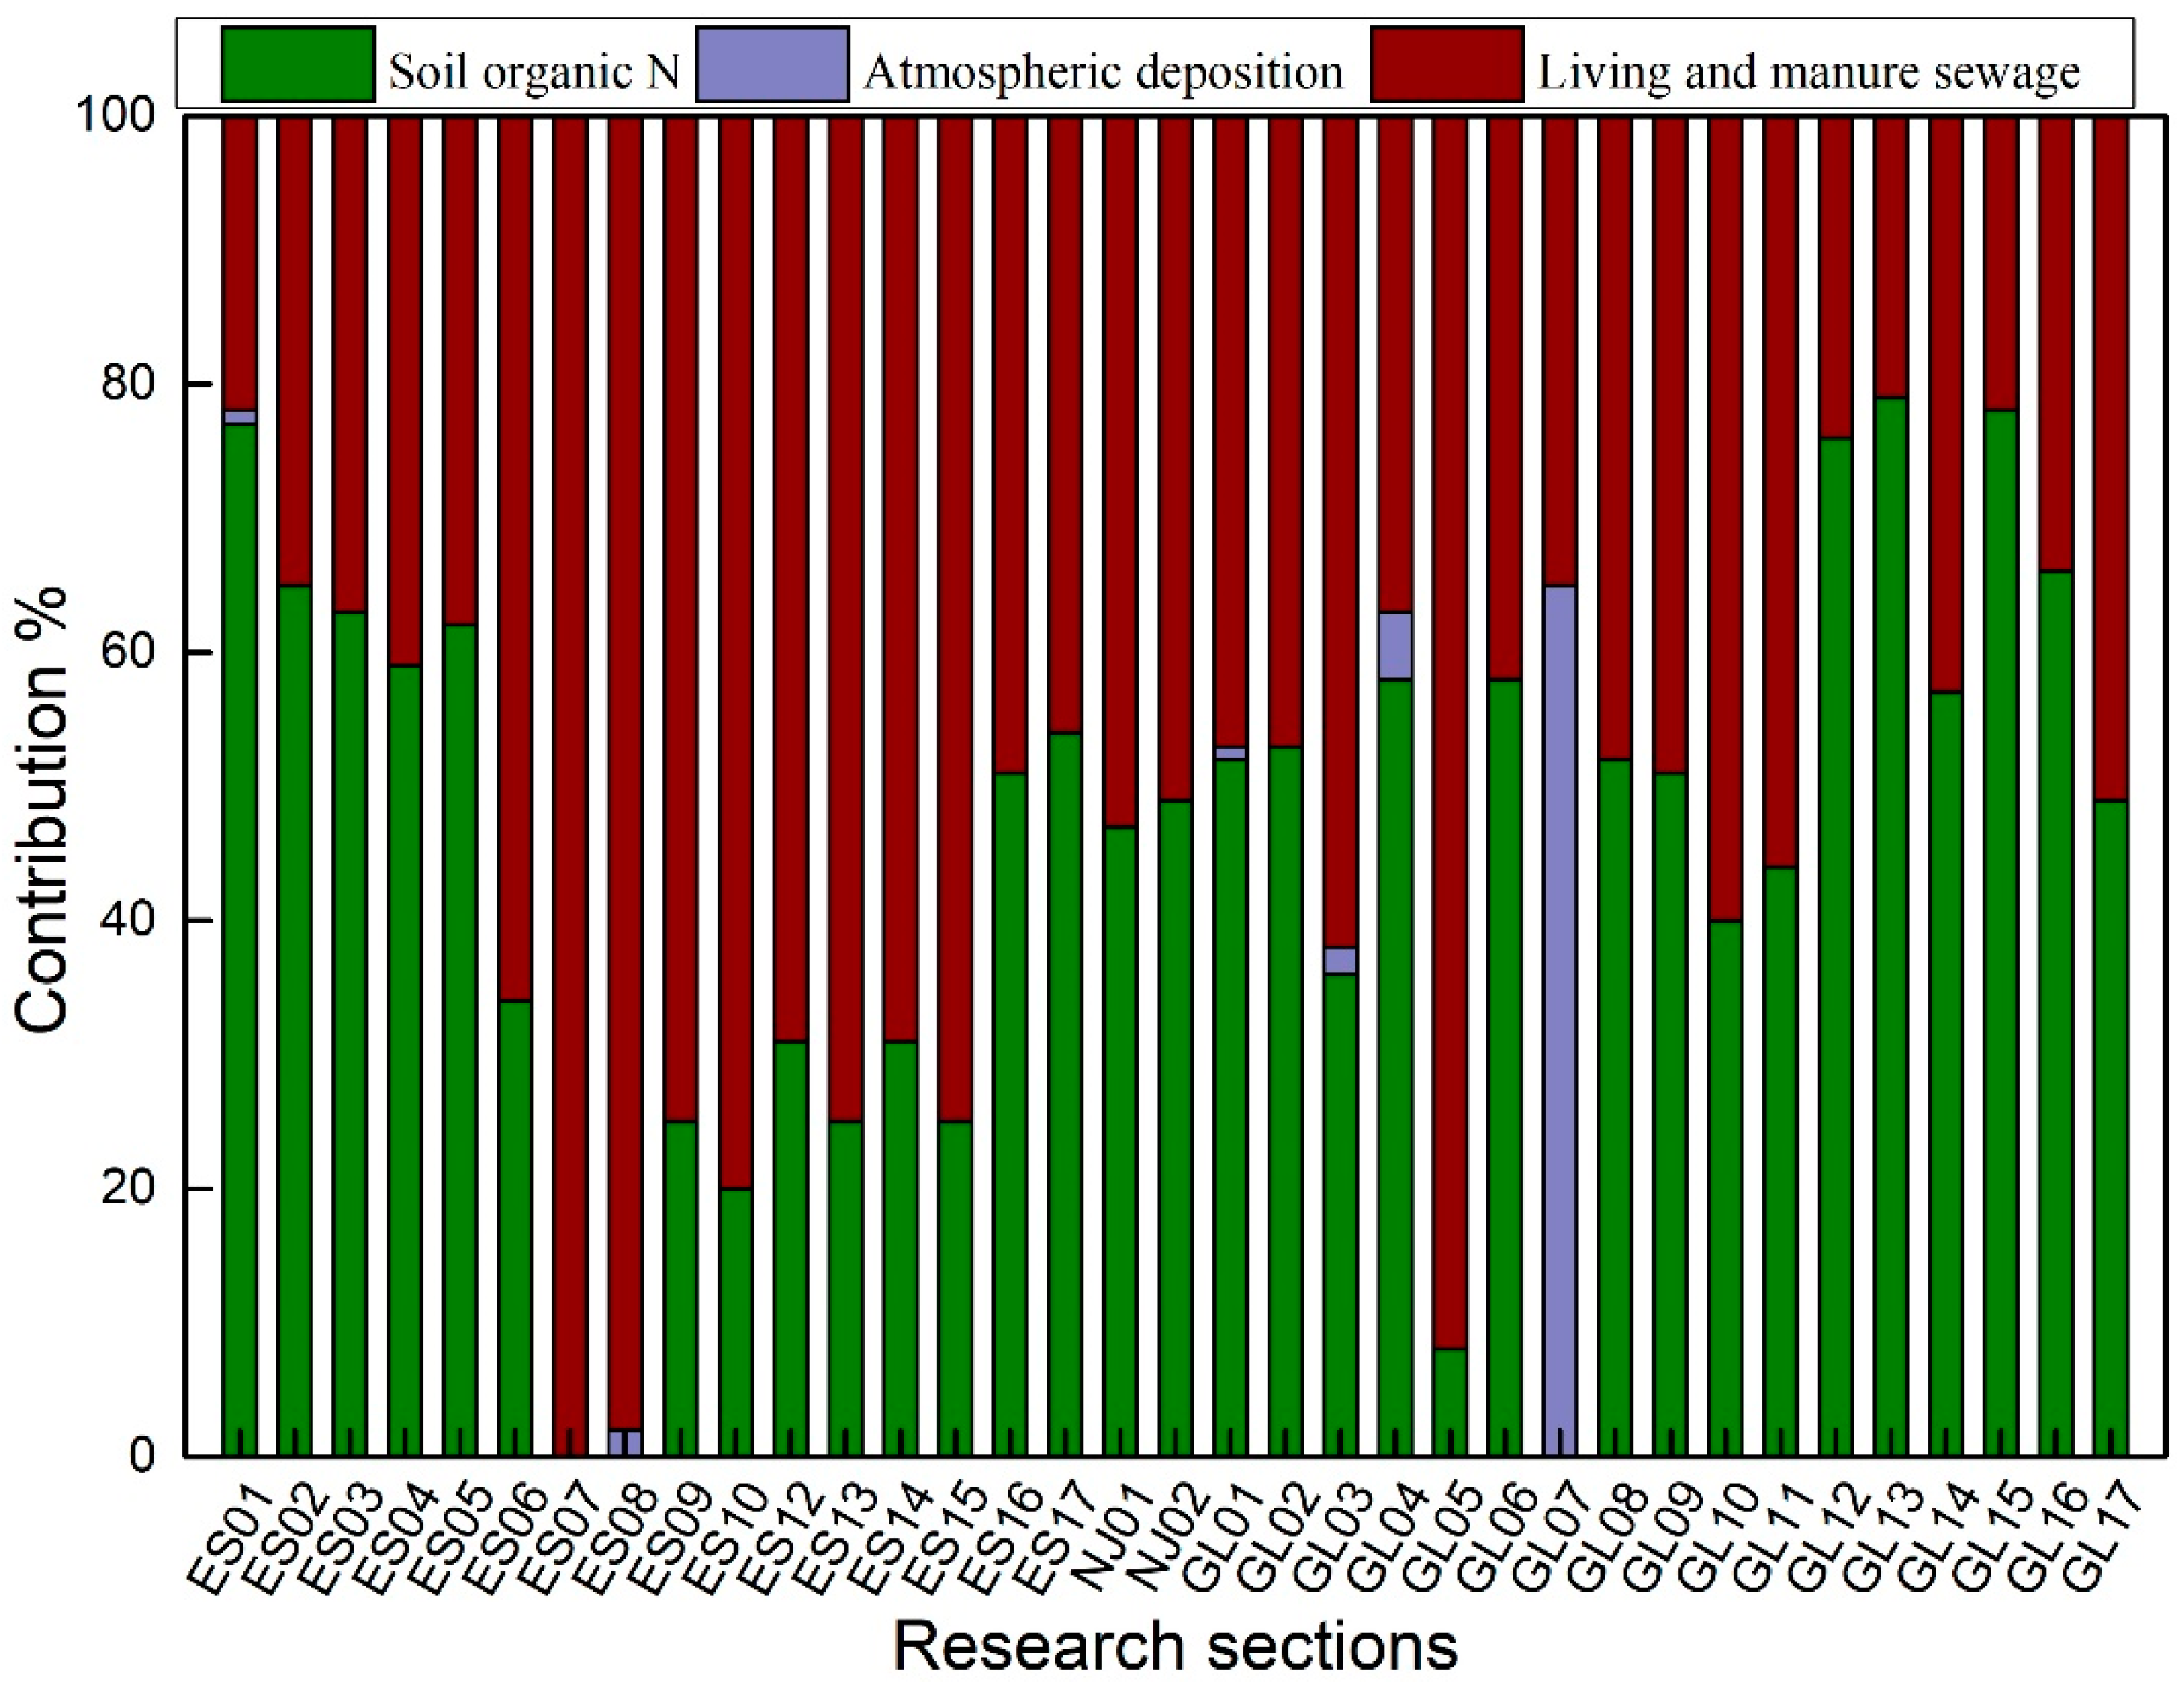
Figure 4.
The relationship between δ15N and δ18O values of nitrate in the SHR during high flow season.
Figure 4.
The relationship between δ15N and δ18O values of nitrate in the SHR during high flow season.
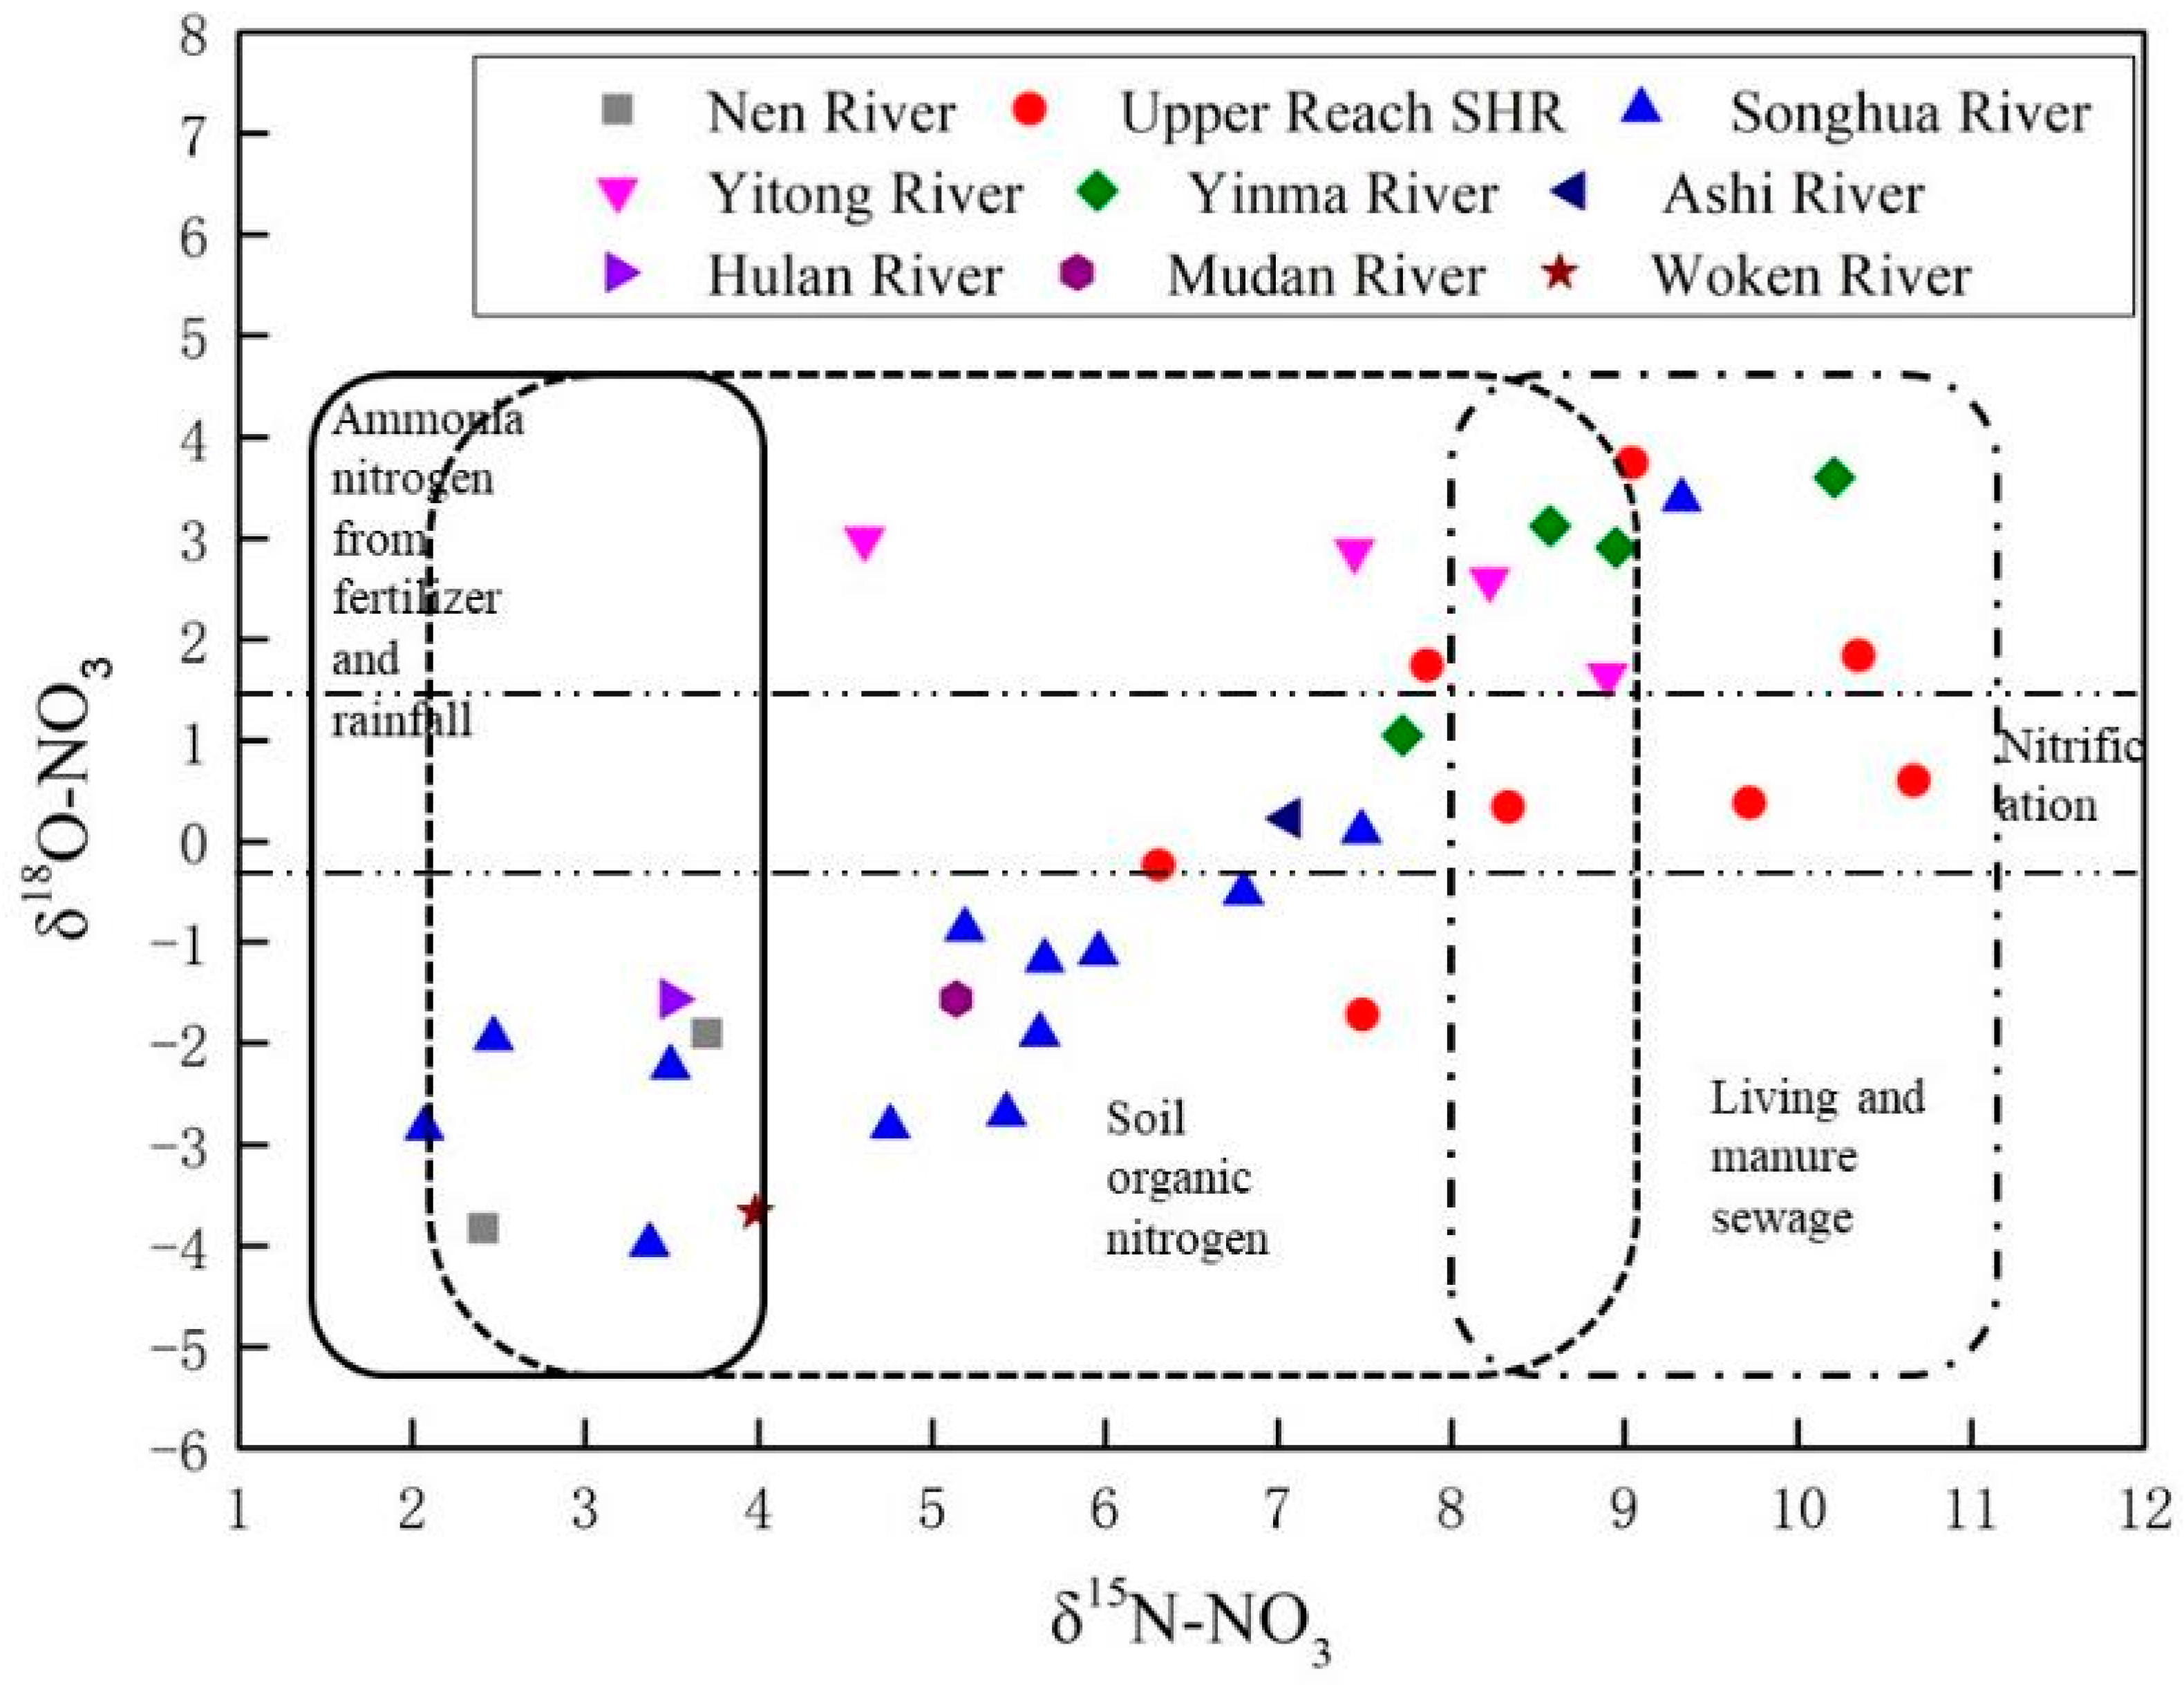
Figure 5.
The contribution rate of nitrogen in the SHR during high flow season.

Figure 6.
The relationship between δ15N and δ18O values of nitrate in the SHR during flat flow season.
Figure 6.
The relationship between δ15N and δ18O values of nitrate in the SHR during flat flow season.
Figure 7.
The contribution rate of nitrogen in the SHR during flat flow season.
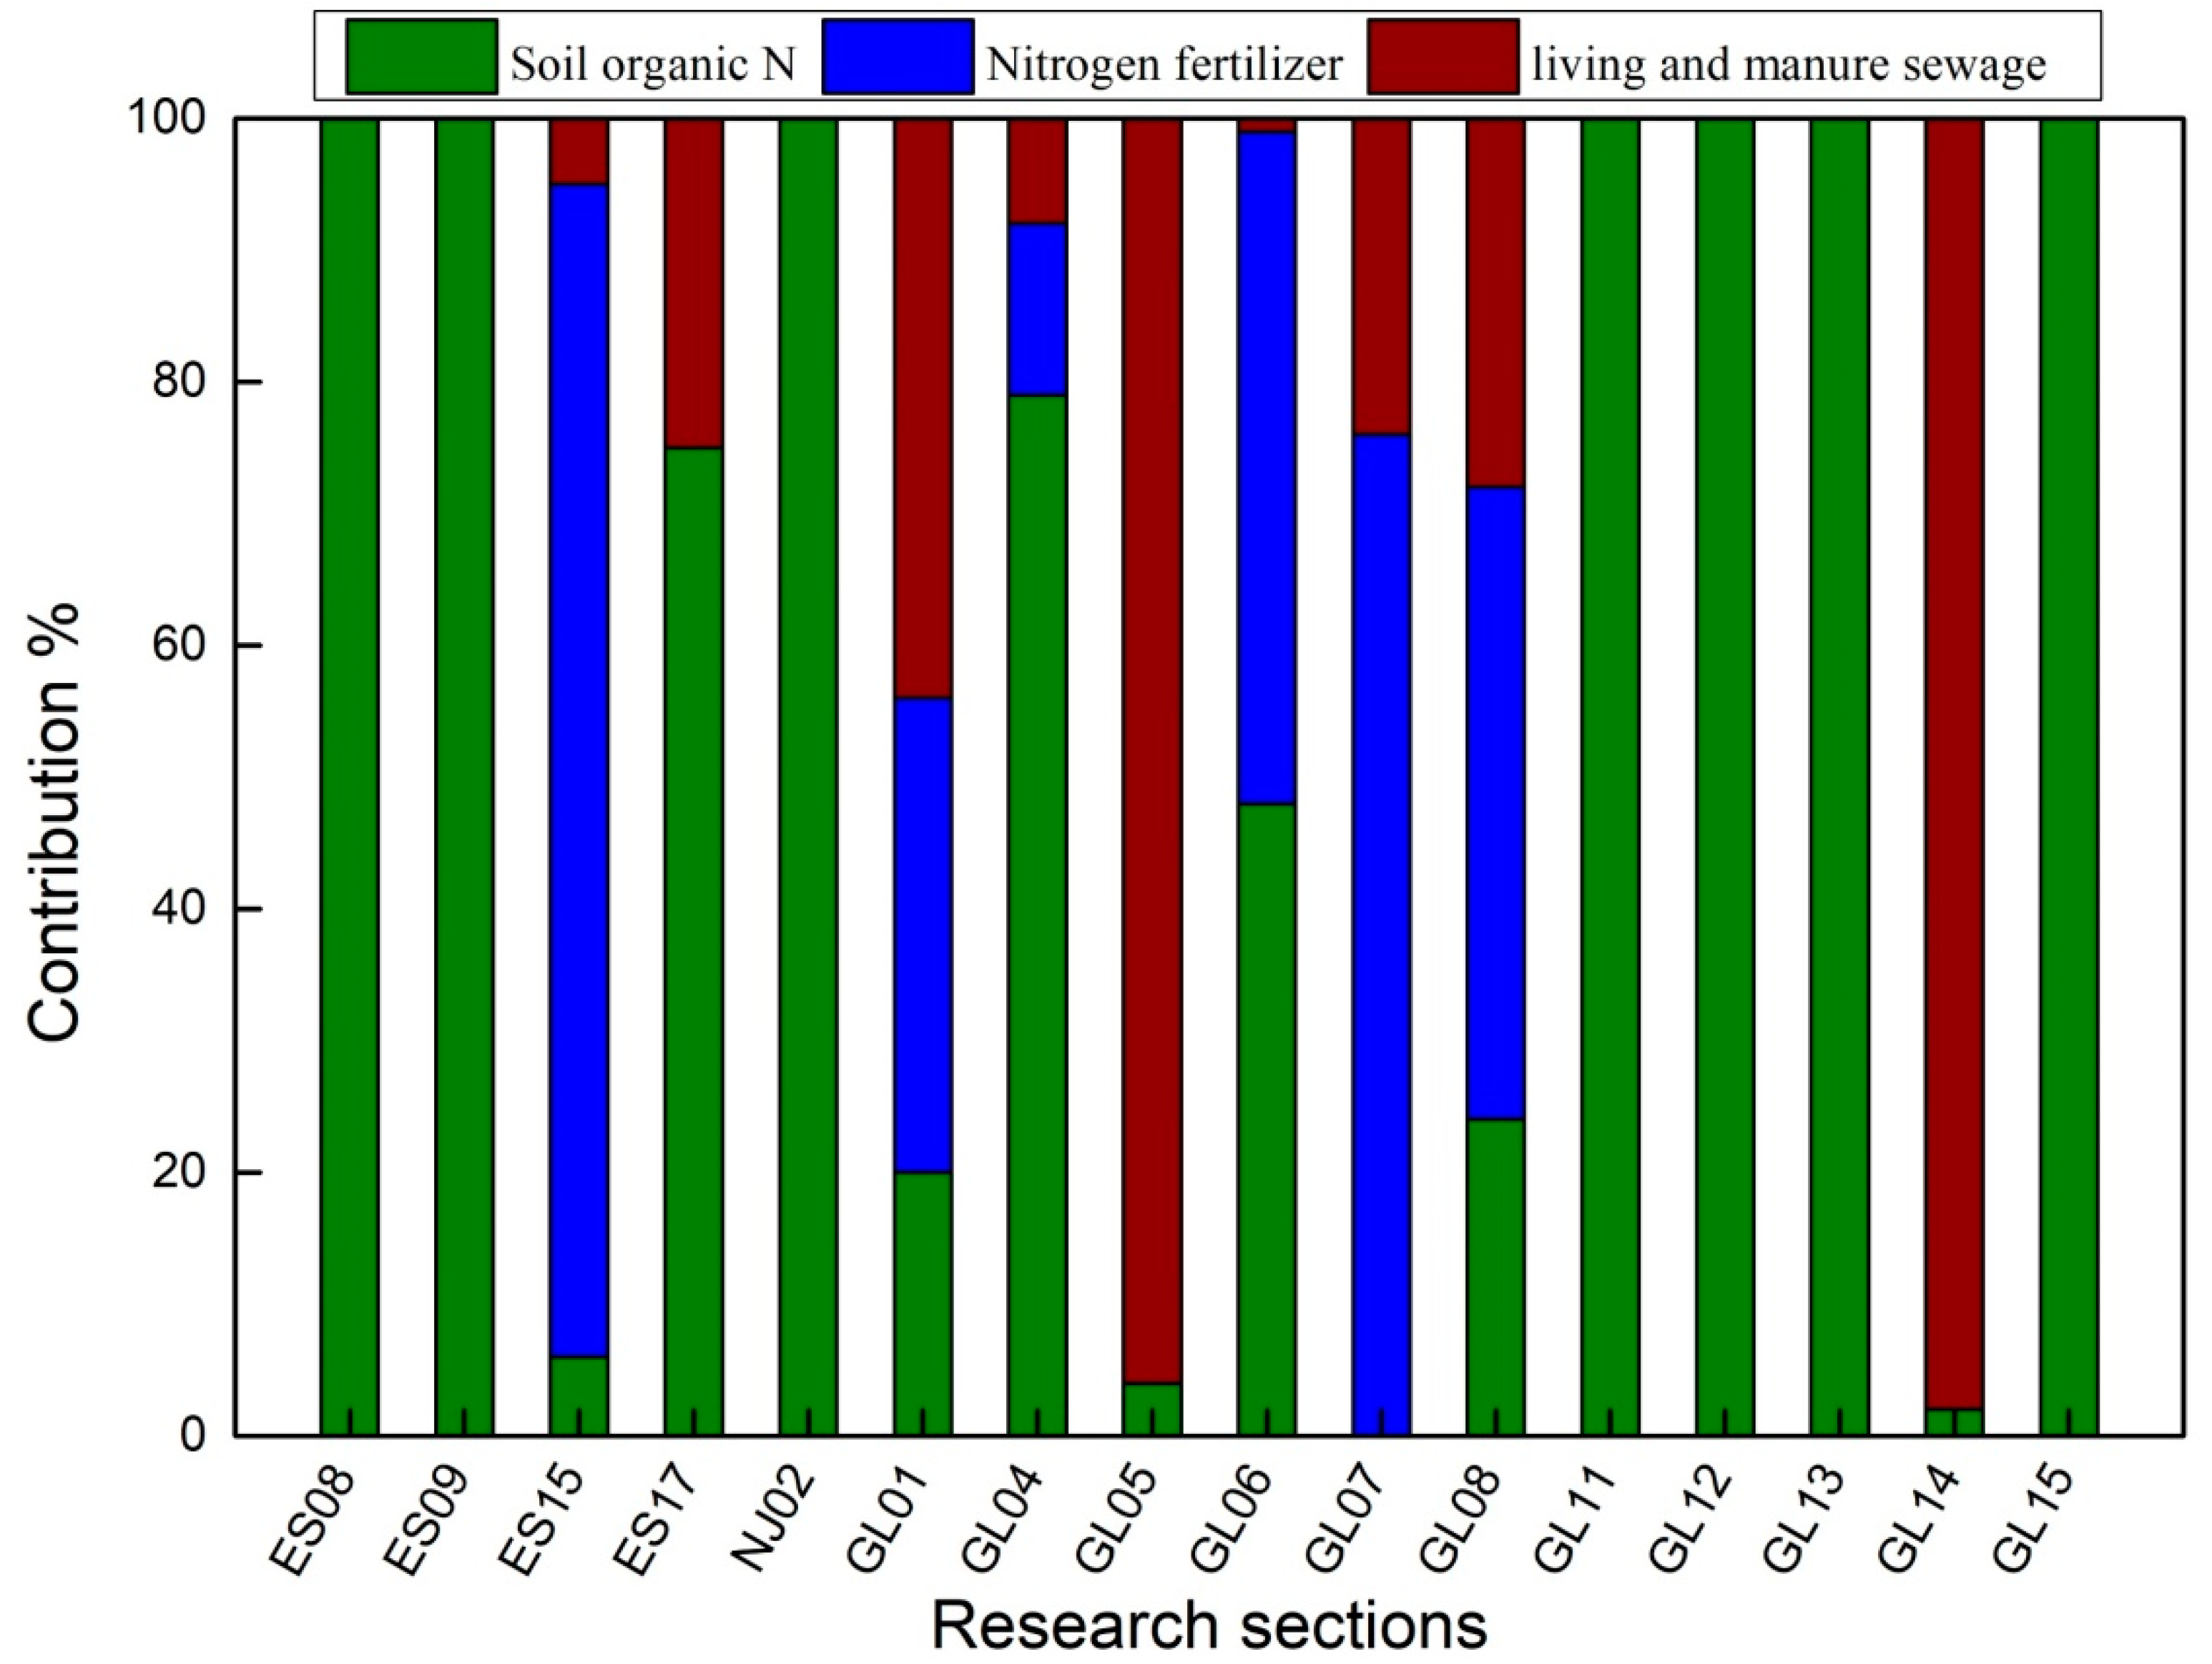
Table 3.
Values of δ15N-NO3 and δ18O-NO3 in different seasons.
| Number | High Flow Season | Low Flow Season | Flat Flow Season | ||||||
|---|---|---|---|---|---|---|---|---|---|
| NO3−-N | δ15N-NO3 | δ18O-NO3 | NO3−-N | δ15N-NO3 | δ18O-NO3 | NO3−-N | δ15N-NO3 | δ18O-NO3 | |
| ES01 | 1.70 | 7.49 | −1.72 | 2.23 | 7.34 | −1.13 | ND | ND | ND |
| ES02 | 3.15 | 10.67 | 0.60 | 2.32 | 8.62 | −1.86 | ND | ND | ND |
| ES03 | 3.05 | 9.72 | 0.38 | 2.78 | 8.72 | −1.35 | ND | ND | ND |
| ES04 | 3.17 | 8.33 | 0.34 | 4.84 | 9.04 | −1.46 | ND | ND | ND |
| ES05 | 2.81 | 10.35 | 1.84 | 3.01 | 8.91 | −2.35 | ND | ND | ND |
| ES06 | 0.54 | 9.04 | 3.74 | 2.59 | 11.27 | −0.81 | ND | ND | ND |
| ES07 | 3.22 | 7.72 | 1.05 | 30.0 | 15.46 | 0.60 | ND | ND | ND |
| ES08 | 2.34 | 10.21 | 3.60 | 1.34 | 14.62 | 3.17 | 0.01 | 7.18 | −10.14 |
| ES09 | 0.57 | 8.95 | 2.91 | 1.89 | 12.01 | −0.20 | 1.77 | 4.14 | −14.26 |
| ES10 | 0.84 | 8.57 | 3.12 | 3.23 | 12.43 | −0.26 | ND | ND | ND |
| ES11 | 2.54 | 8.22 | 2.59 | ND | ND | ND | ND | ND | ND |
| ES12 | 2.68 | 8.90 | 1.64 | 47.7 | 11.86 | −2.42 | ND | ND | ND |
| ES13 | 3.66 | 7.44 | 2.87 | 48.9 | 12.25 | −1.71 | ND | ND | ND |
| ES14 | 2.78 | 4.61 | 2.99 | 51.3 | 11.59 | −1.07 | ND | ND | ND |
| ES15 | 0.20 | 14.24 | 8.03 | 2.39 | 12.11 | −0.77 | 1.50 | 1.52 | −13.82 |
| ES16 | 1.44 | 7.86 | 1.74 | 2.13 | 9.72 | −0.67 | ND | ND | ND |
| ES17 | 0.89 | 6.31 | −0.24 | 2.16 | 9.56 | −1.63 | 0.01 | 9.33 | −5.05 |
| NJ04 | 0.69 | 3.70 | −1.90 | 0.61 | 10.08 | −0.63 | ND | ND | ND |
| NJ05 | 0.46 | 2.41 | −3.83 | 2.16 | 10.06 | −1.79 | 0.27 | 5.20 | −7.48 |
| GL01 | 0.09 | 3.49 | −2.23 | 0.88 | 9.48 | −0.01 | 0.17 | 7.49 | 1.32 |
| GL02 | 0.48 | 2.07 | −2.84 | 1.13 | 9.73 | −2.18 | ND | ND | ND |
| GL03 | 1.30 | 5.96 | −1.11 | 0.44 | 10.71 | 1.18 | ND | ND | ND |
| GL04 | 1.32 | 5.19 | −0.87 | 1.74 | 8.42 | 2.34 | 0.12 | 5.54 | −2.07 |
| GL05 | 1.74 | 7.06 | 0.23 | 5.02 | 13.76 | −1.38 | 1.09 | 11.15 | −2.88 |
| GL06 | 1.50 | 6.80 | −0.51 | 1.95 | 9.30 | −2.17 | 0.30 | 3.00 | −2.22 |
| GL07 | 0.60 | 3.50 | −1.56 | 0.11 | 6.66 | 65.70 | 0.42 | 3.90 | −0.74 |
| GL08 | 0.92 | 5.62 | −1.91 | 2.04 | 9.65 | −2.01 | 0.39 | 5.48 | −0.01 |
| GL09 | 1.94 | 5.65 | −1.18 | 1.85 | 9.73 | −2.03 | ND | ND | ND |
| GL10 | 6.27 | 9.33 | 3.38 | 1.96 | 10.29 | −1.47 | ND | ND | ND |
| GL11 | 2.03 | 7.48 | 0.10 | 1.94 | 10.19 | −1.92 | 0.01 | 6.47 | −7.97 |
| GL12 | 2.38 | 5.14 | −1.56 | 2.53 | 7.77 | −2.42 | 0.03 | 5.96 | −5.64 |
| GL13 | 1.24 | 4.76 | −2.82 | 1.92 | 7.68 | −4.20 | 0.04 | 6.33 | −8.23 |
| GL14 | 0.81 | 3.98 | −3.67 | 0.81 | 9.61 | −5.82 | 0.10 | 14.55 | 2.03 |
| GL15 | 0.83 | 2.47 | −1.95 | 2.03 | 7.88 | −4.55 | 0.05 | 6.28 | −9.06 |
| GL16 | 0.06 | 3.37 | −3.99 | 1.96 | 8.60 | −2.38 | ND | ND | ND |
| GL17 | 1.18 | 5.43 | −2.70 | 2.05 | 9.95 | −2.03 | ND | ND | ND |
| Mean | 1.71 ± 1.29 | 6.72 ± 2.71 | 0.13 ± 2.63 | 6.91 ± 4.96 | 10.14 ± 1.98 | −1.39 ± 1.68 | 0.39 ± 0.53 | 6.47 ± 3.05 | −5.39 ± 4.89 |
Publisher’s Note: MDPI stays neutral with regard to jurisdictional claims in published maps and institutional affiliations. |
© 2021 by the authors. Licensee MDPI, Basel, Switzerland. This article is an open access article distributed under the terms and conditions of the Creative Commons Attribution (CC BY) license (https://creativecommons.org/licenses/by/4.0/).
Share and Cite
MDPI and ACS Style
Ye, K.; Meng, F.; Zhang, L.; Wang, Y.; Xue, H.; Zhang, D. Using Dual Isotopes of Nitrate to Identify the Source of Nitrogen Pollution in the Songhua River Basin, Northeast China. Water 2021, 13, 2721. https://doi.org/10.3390/w13192721
AMA Style
Ye K, Meng F, Zhang L, Wang Y, Xue H, Zhang D. Using Dual Isotopes of Nitrate to Identify the Source of Nitrogen Pollution in the Songhua River Basin, Northeast China. Water. 2021; 13(19):2721. https://doi.org/10.3390/w13192721
Chicago/Turabian StyleYe, Kuangmin, Fansheng Meng, Lingsong Zhang, Yeyao Wang, Hao Xue, and Daoping Zhang. 2021. "Using Dual Isotopes of Nitrate to Identify the Source of Nitrogen Pollution in the Songhua River Basin, Northeast China" Water 13, no. 19: 2721. https://doi.org/10.3390/w13192721
Note that from the first issue of 2016, this journal uses article numbers instead of page numbers. See further details here.