
Iron-Loaded Pomegranate Peel as a Bio-Adsorbent for Phosphate Removal

 ,
,  ,
,  ,
,
Abstract
:
1. Introduction
2. Materials and Methods
2.1. The Stock Solution
2.2. Preparation and Activation of PP
2.3. Characterization of IL-PP
2.4. Batch Adsorption
3. Results and Discussion
3.1. Characterization Results
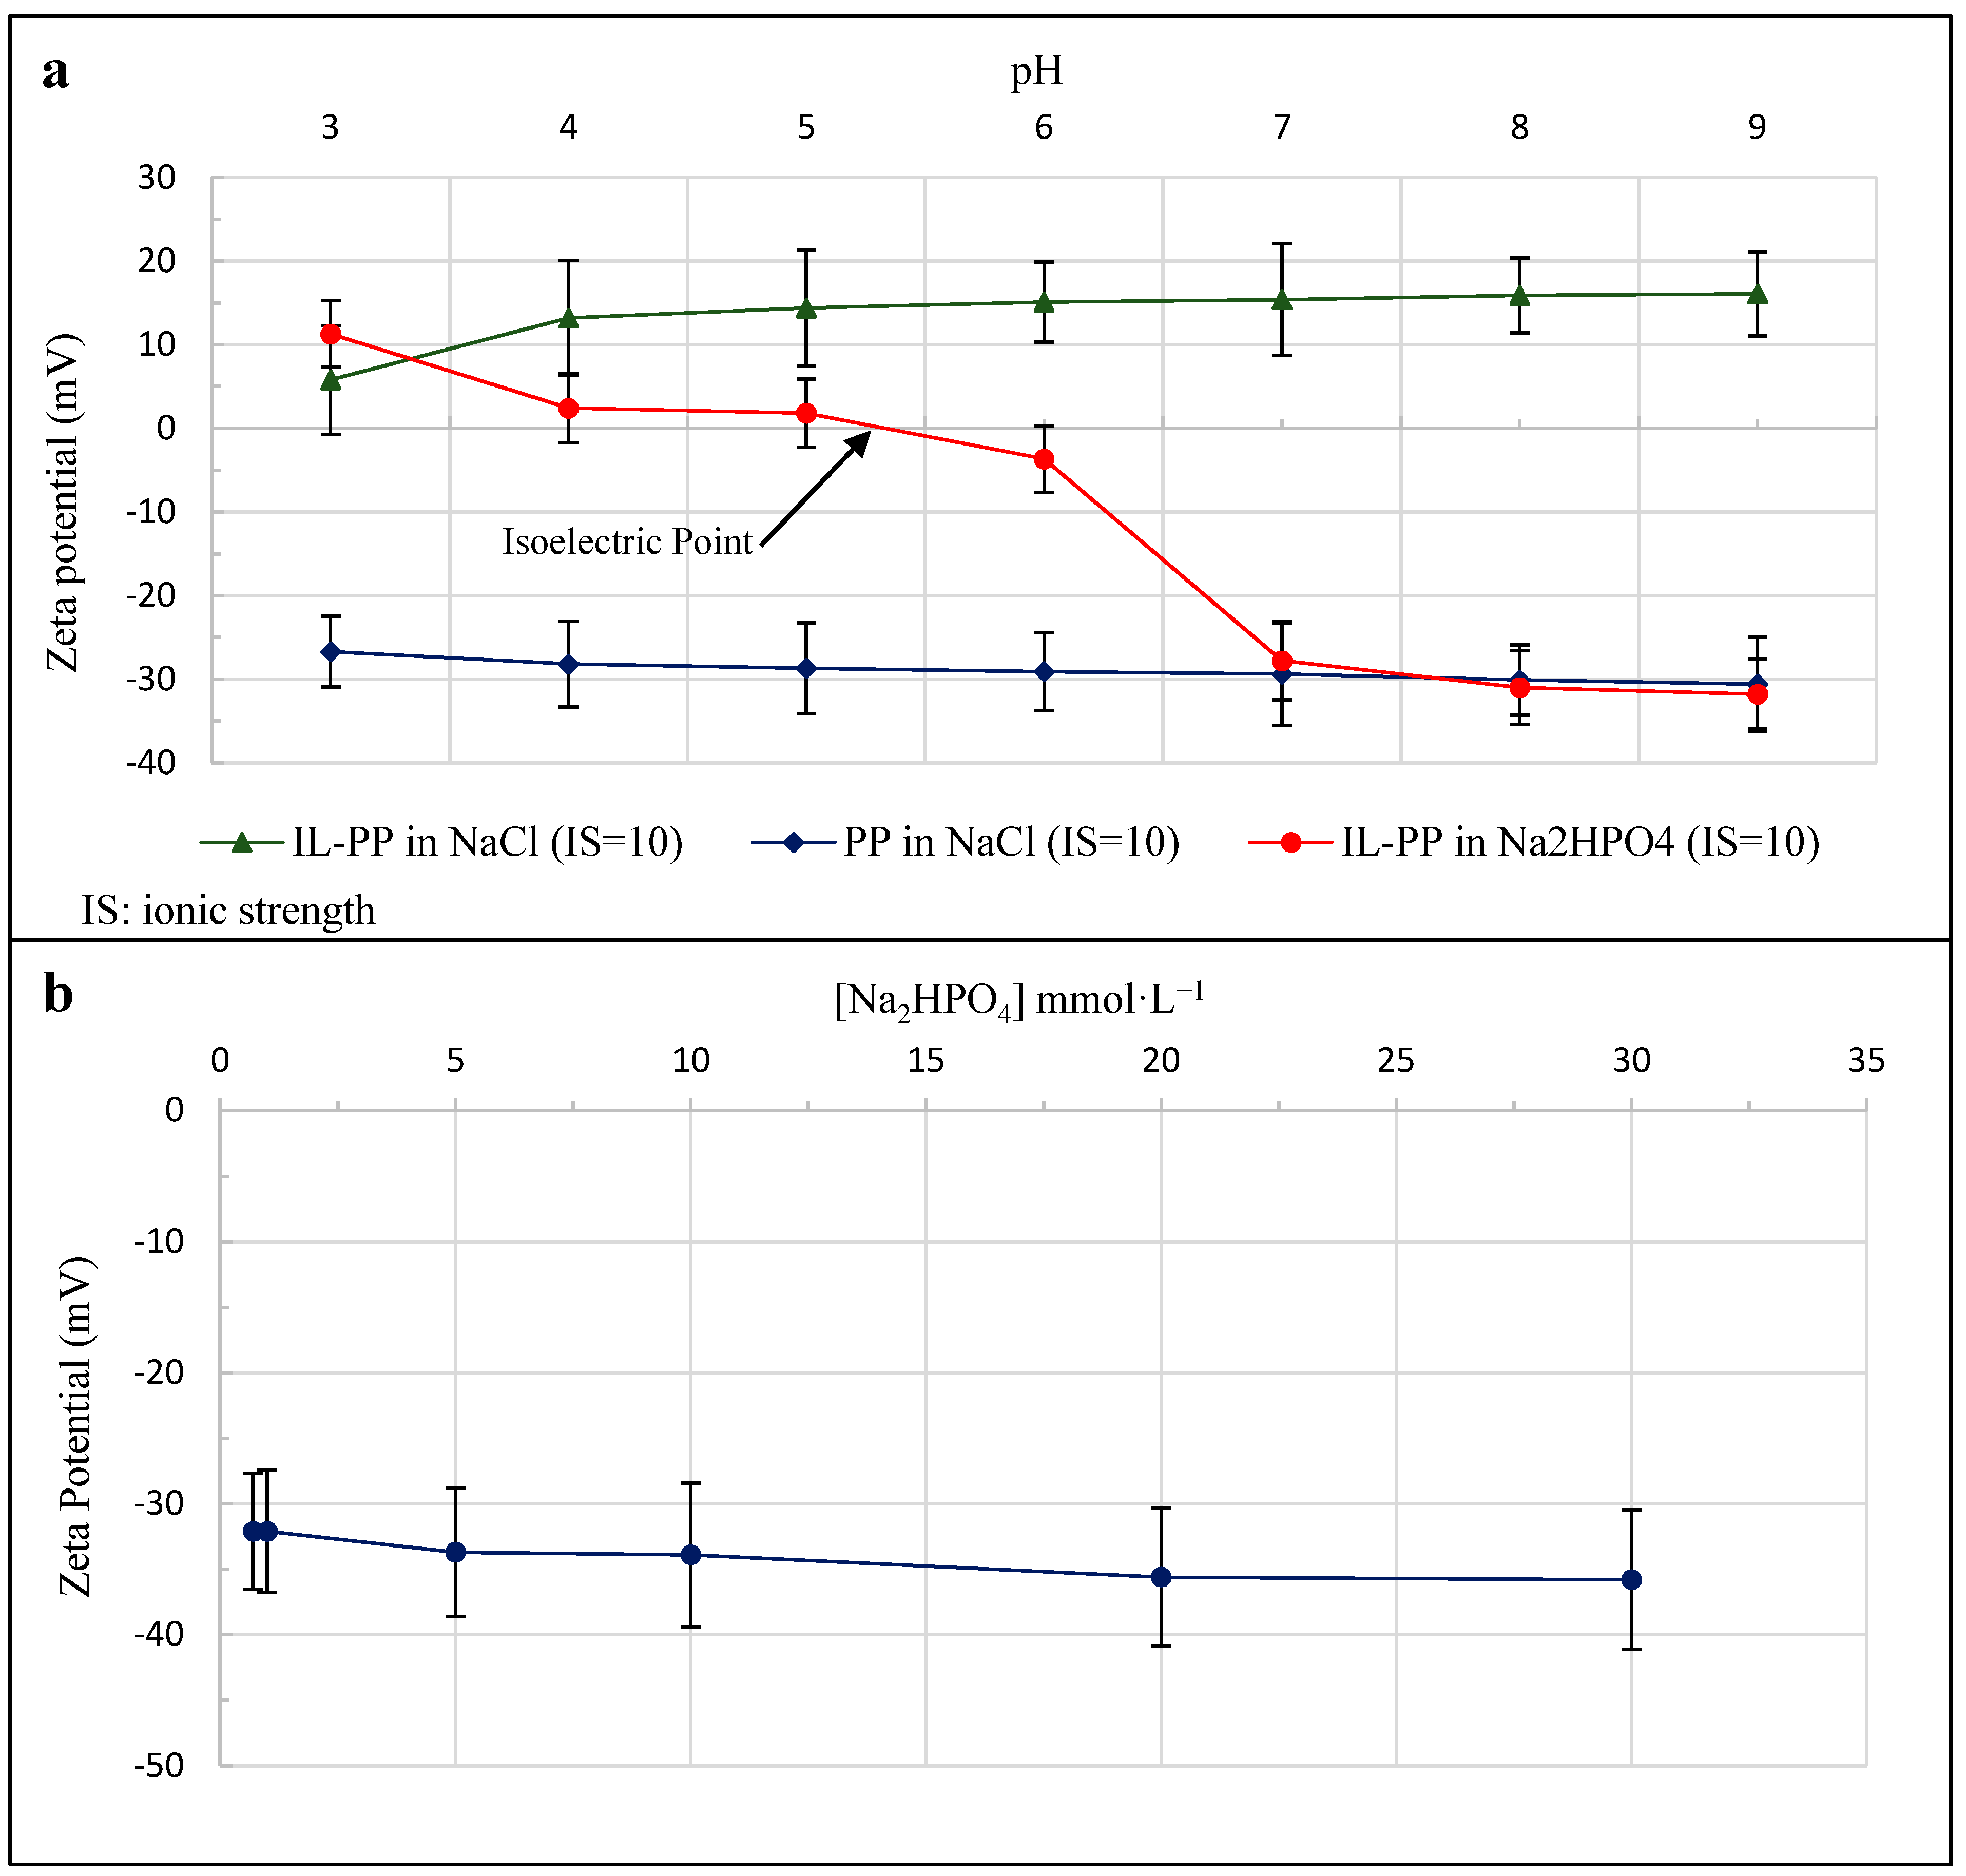
3.1.1. Zeta Potential
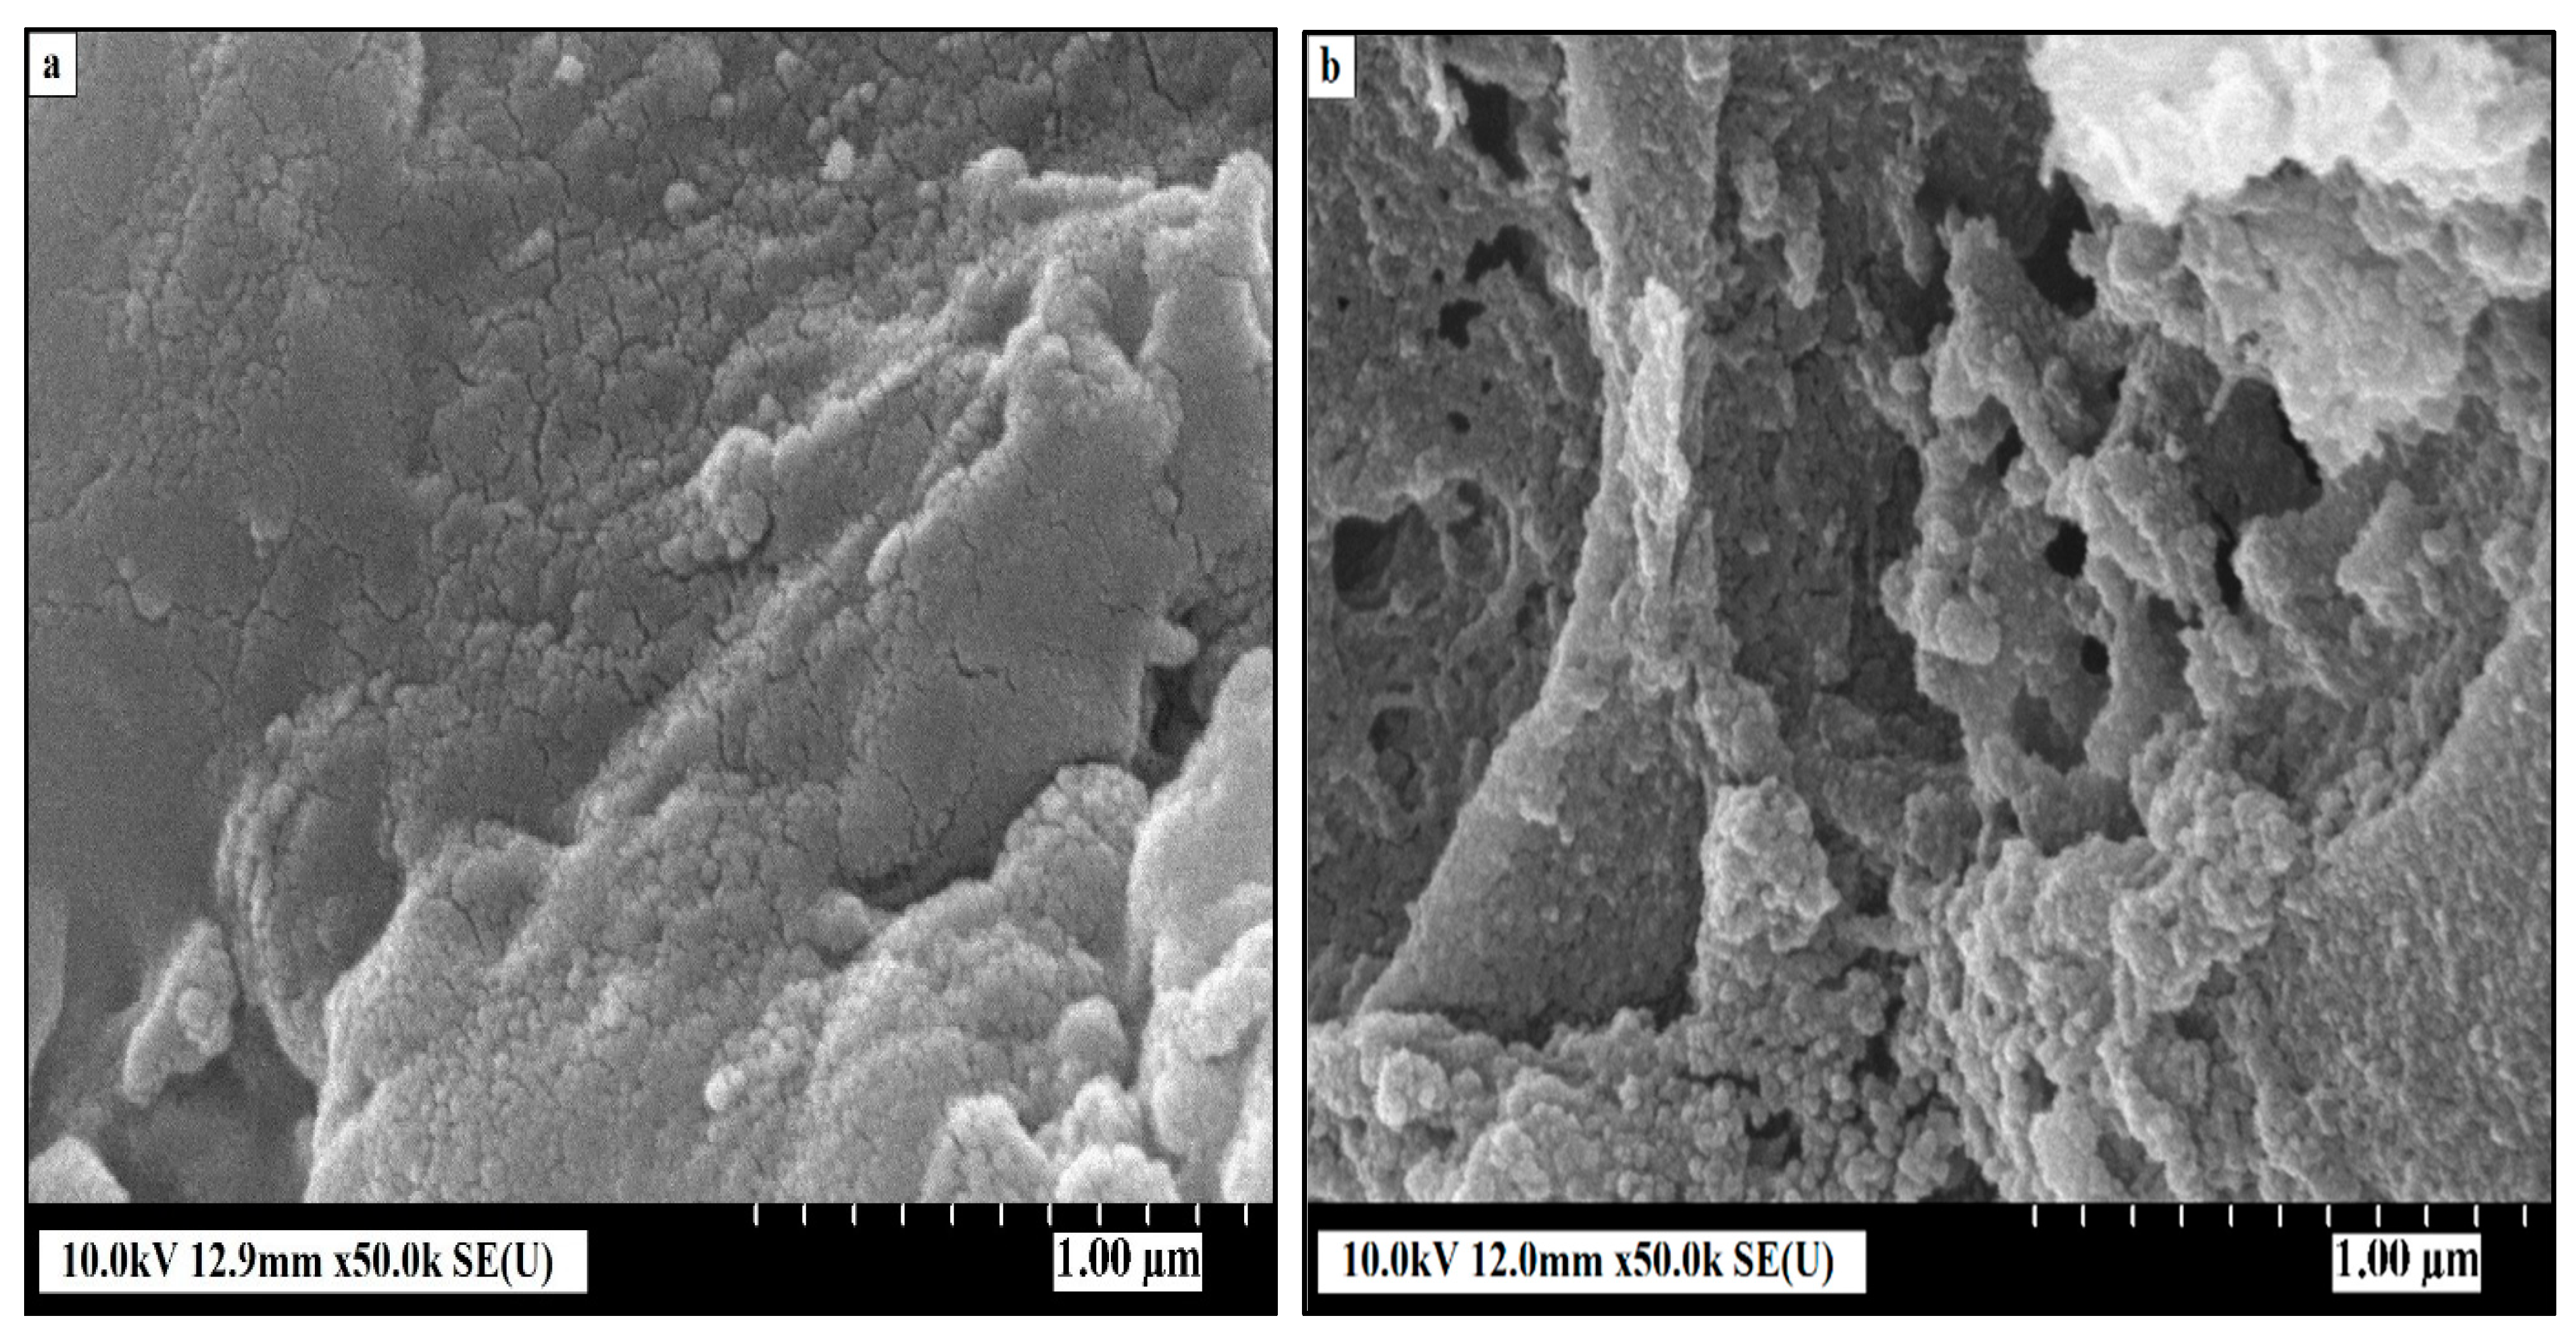
3.1.2. SEM Results
3.1.3. FTIR Analysis
3.2. Batch Adsorption Results
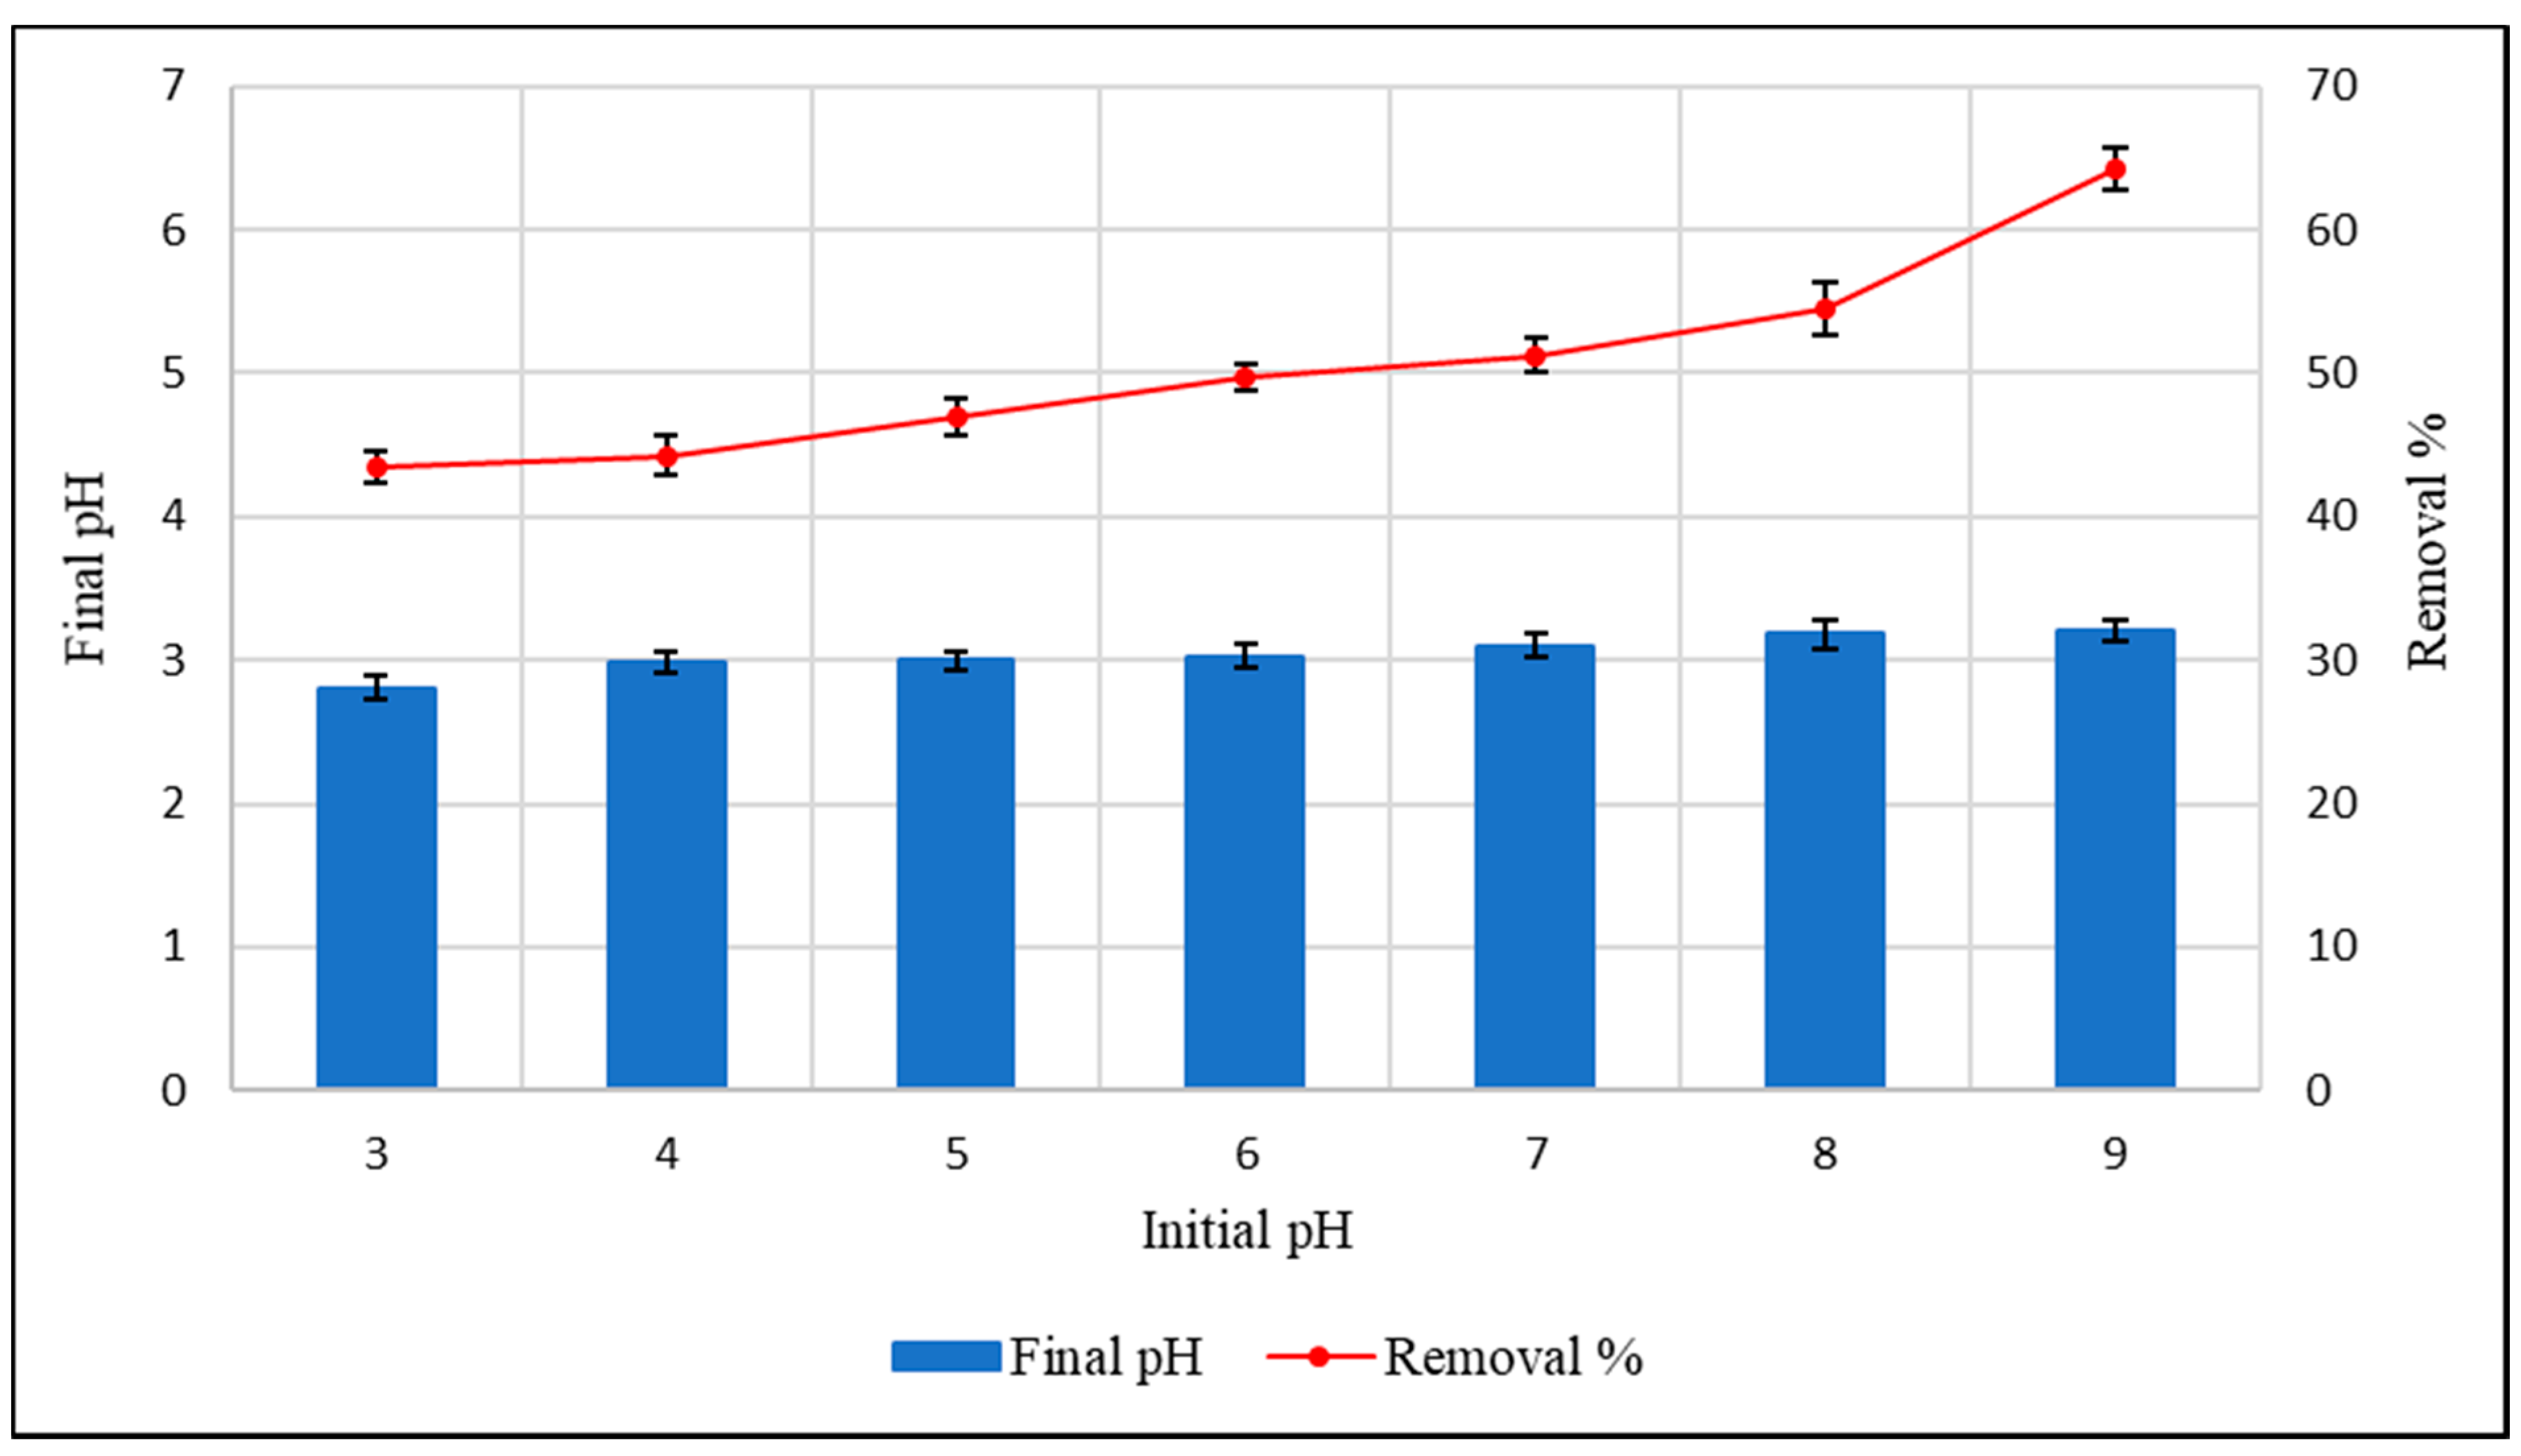
3.2.1. Effect of pH
3.2.2. Determination of the Equilibrium Time
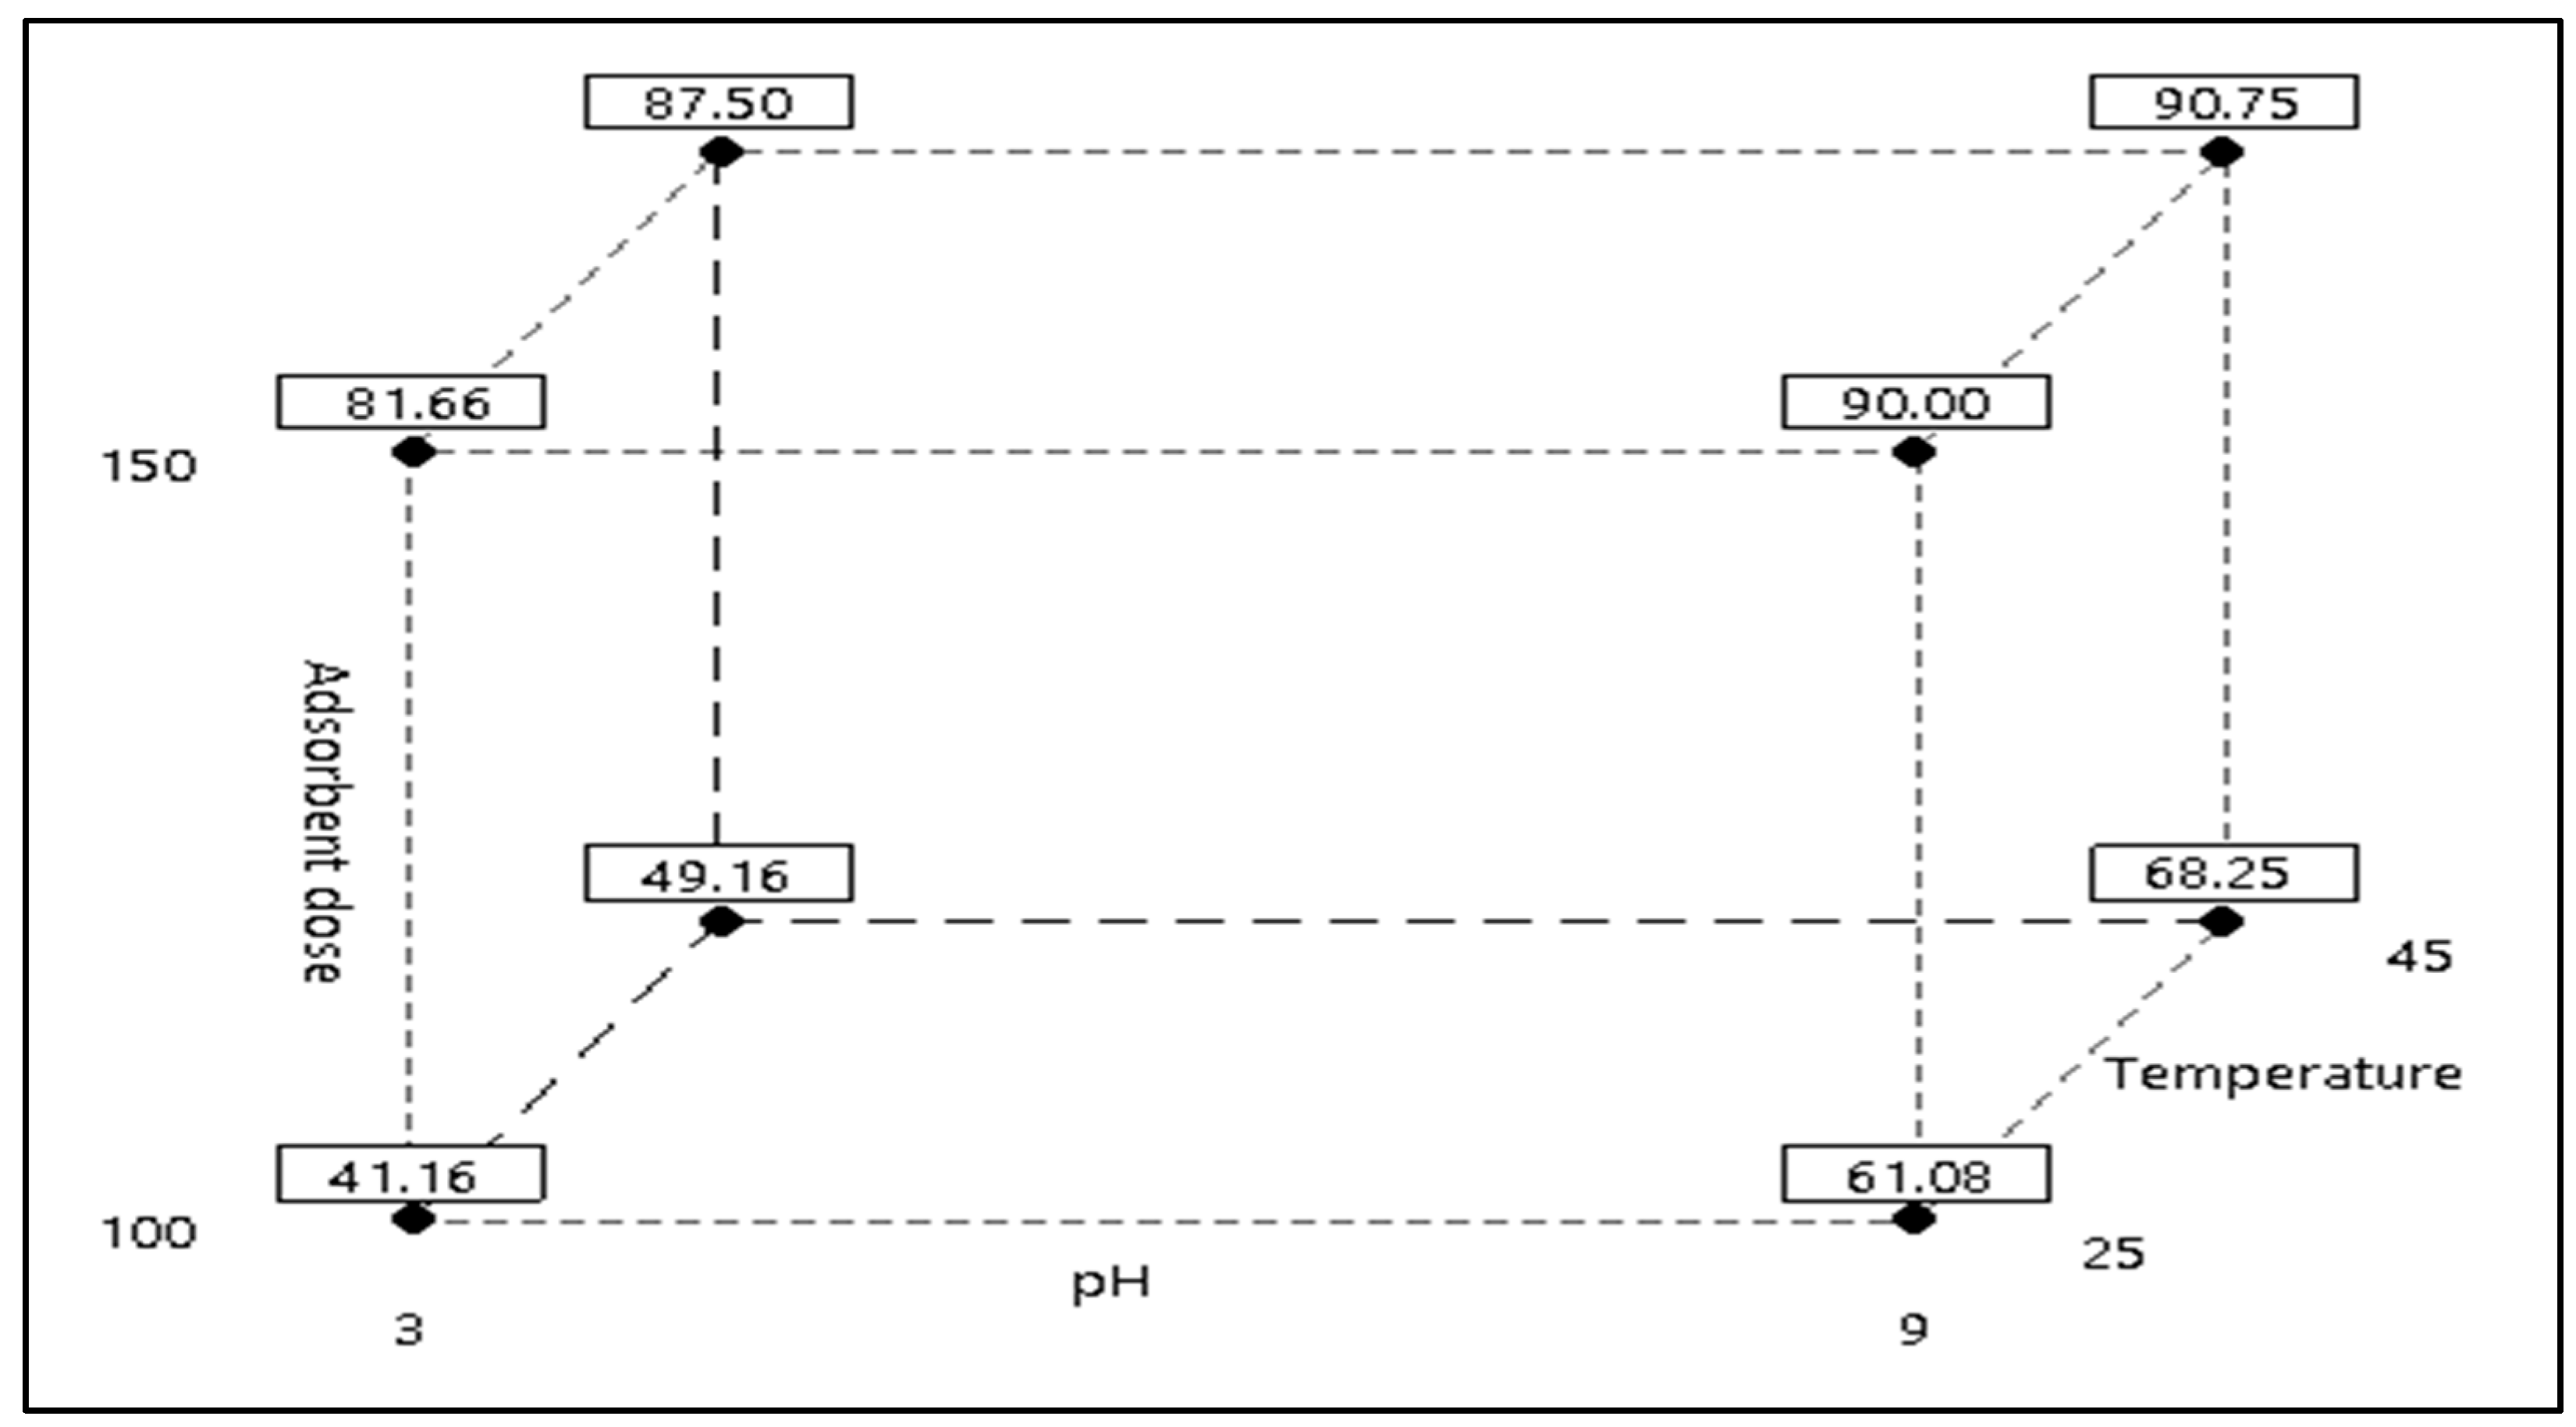
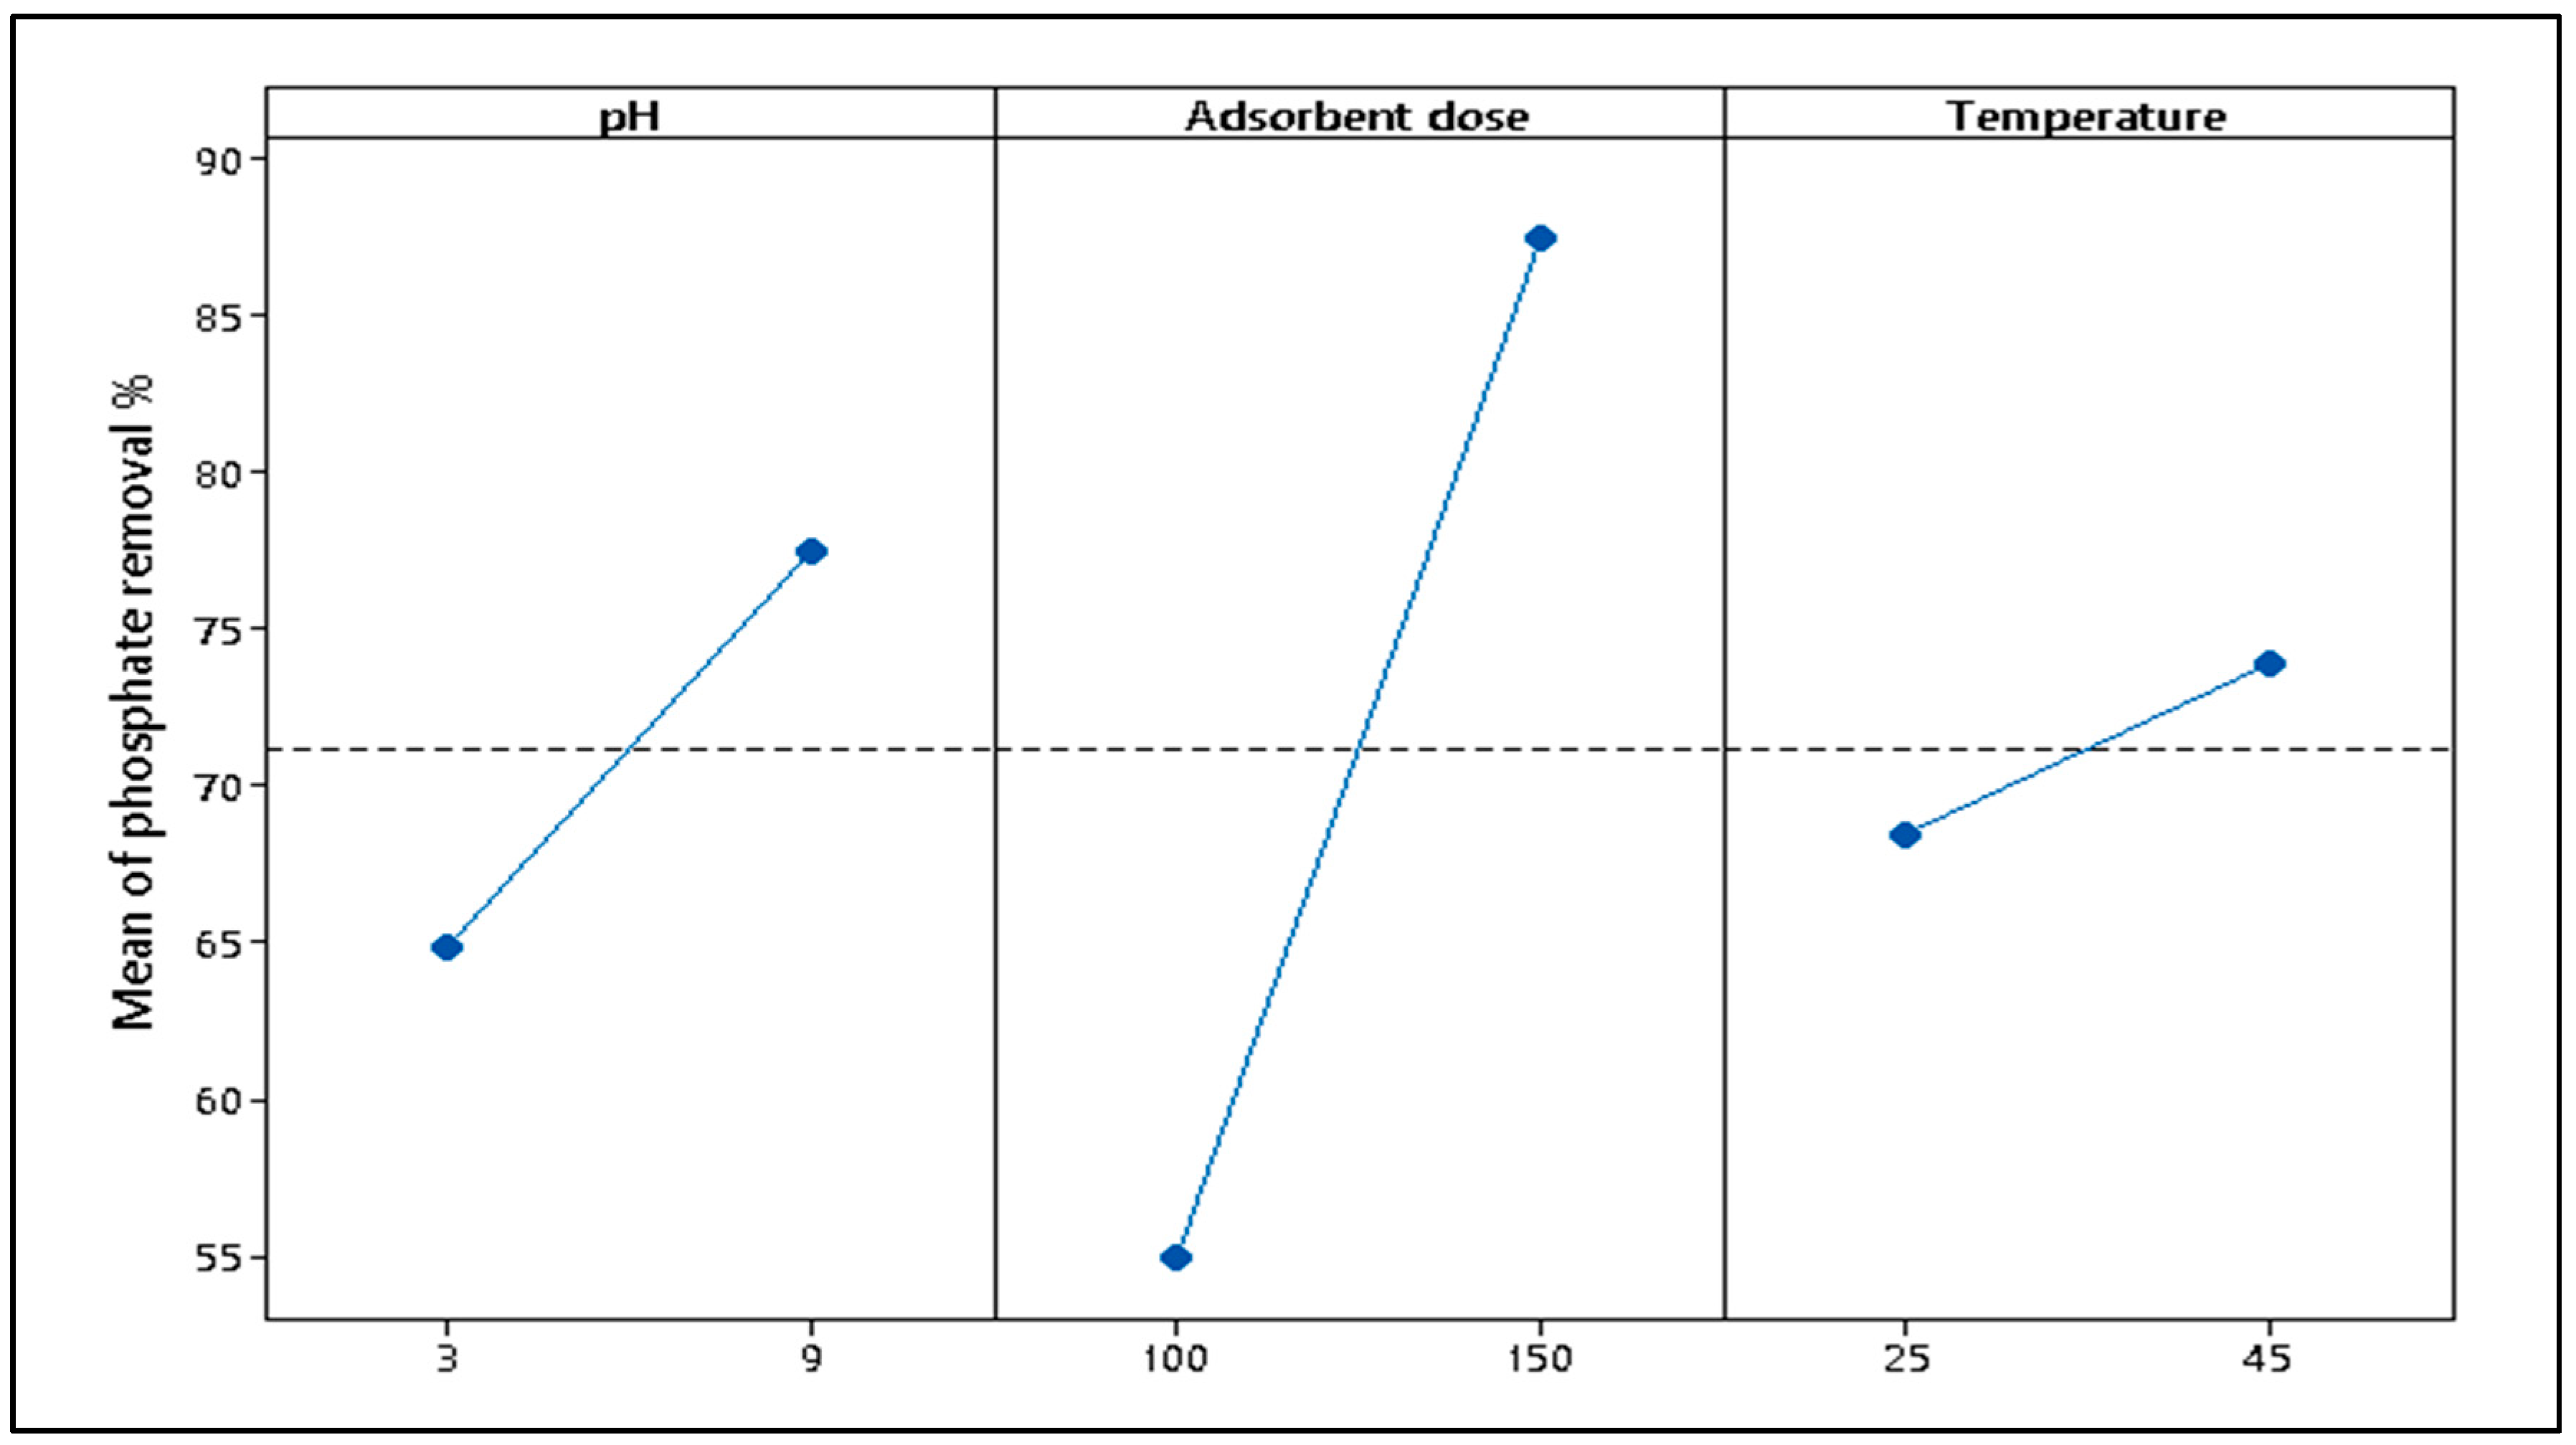
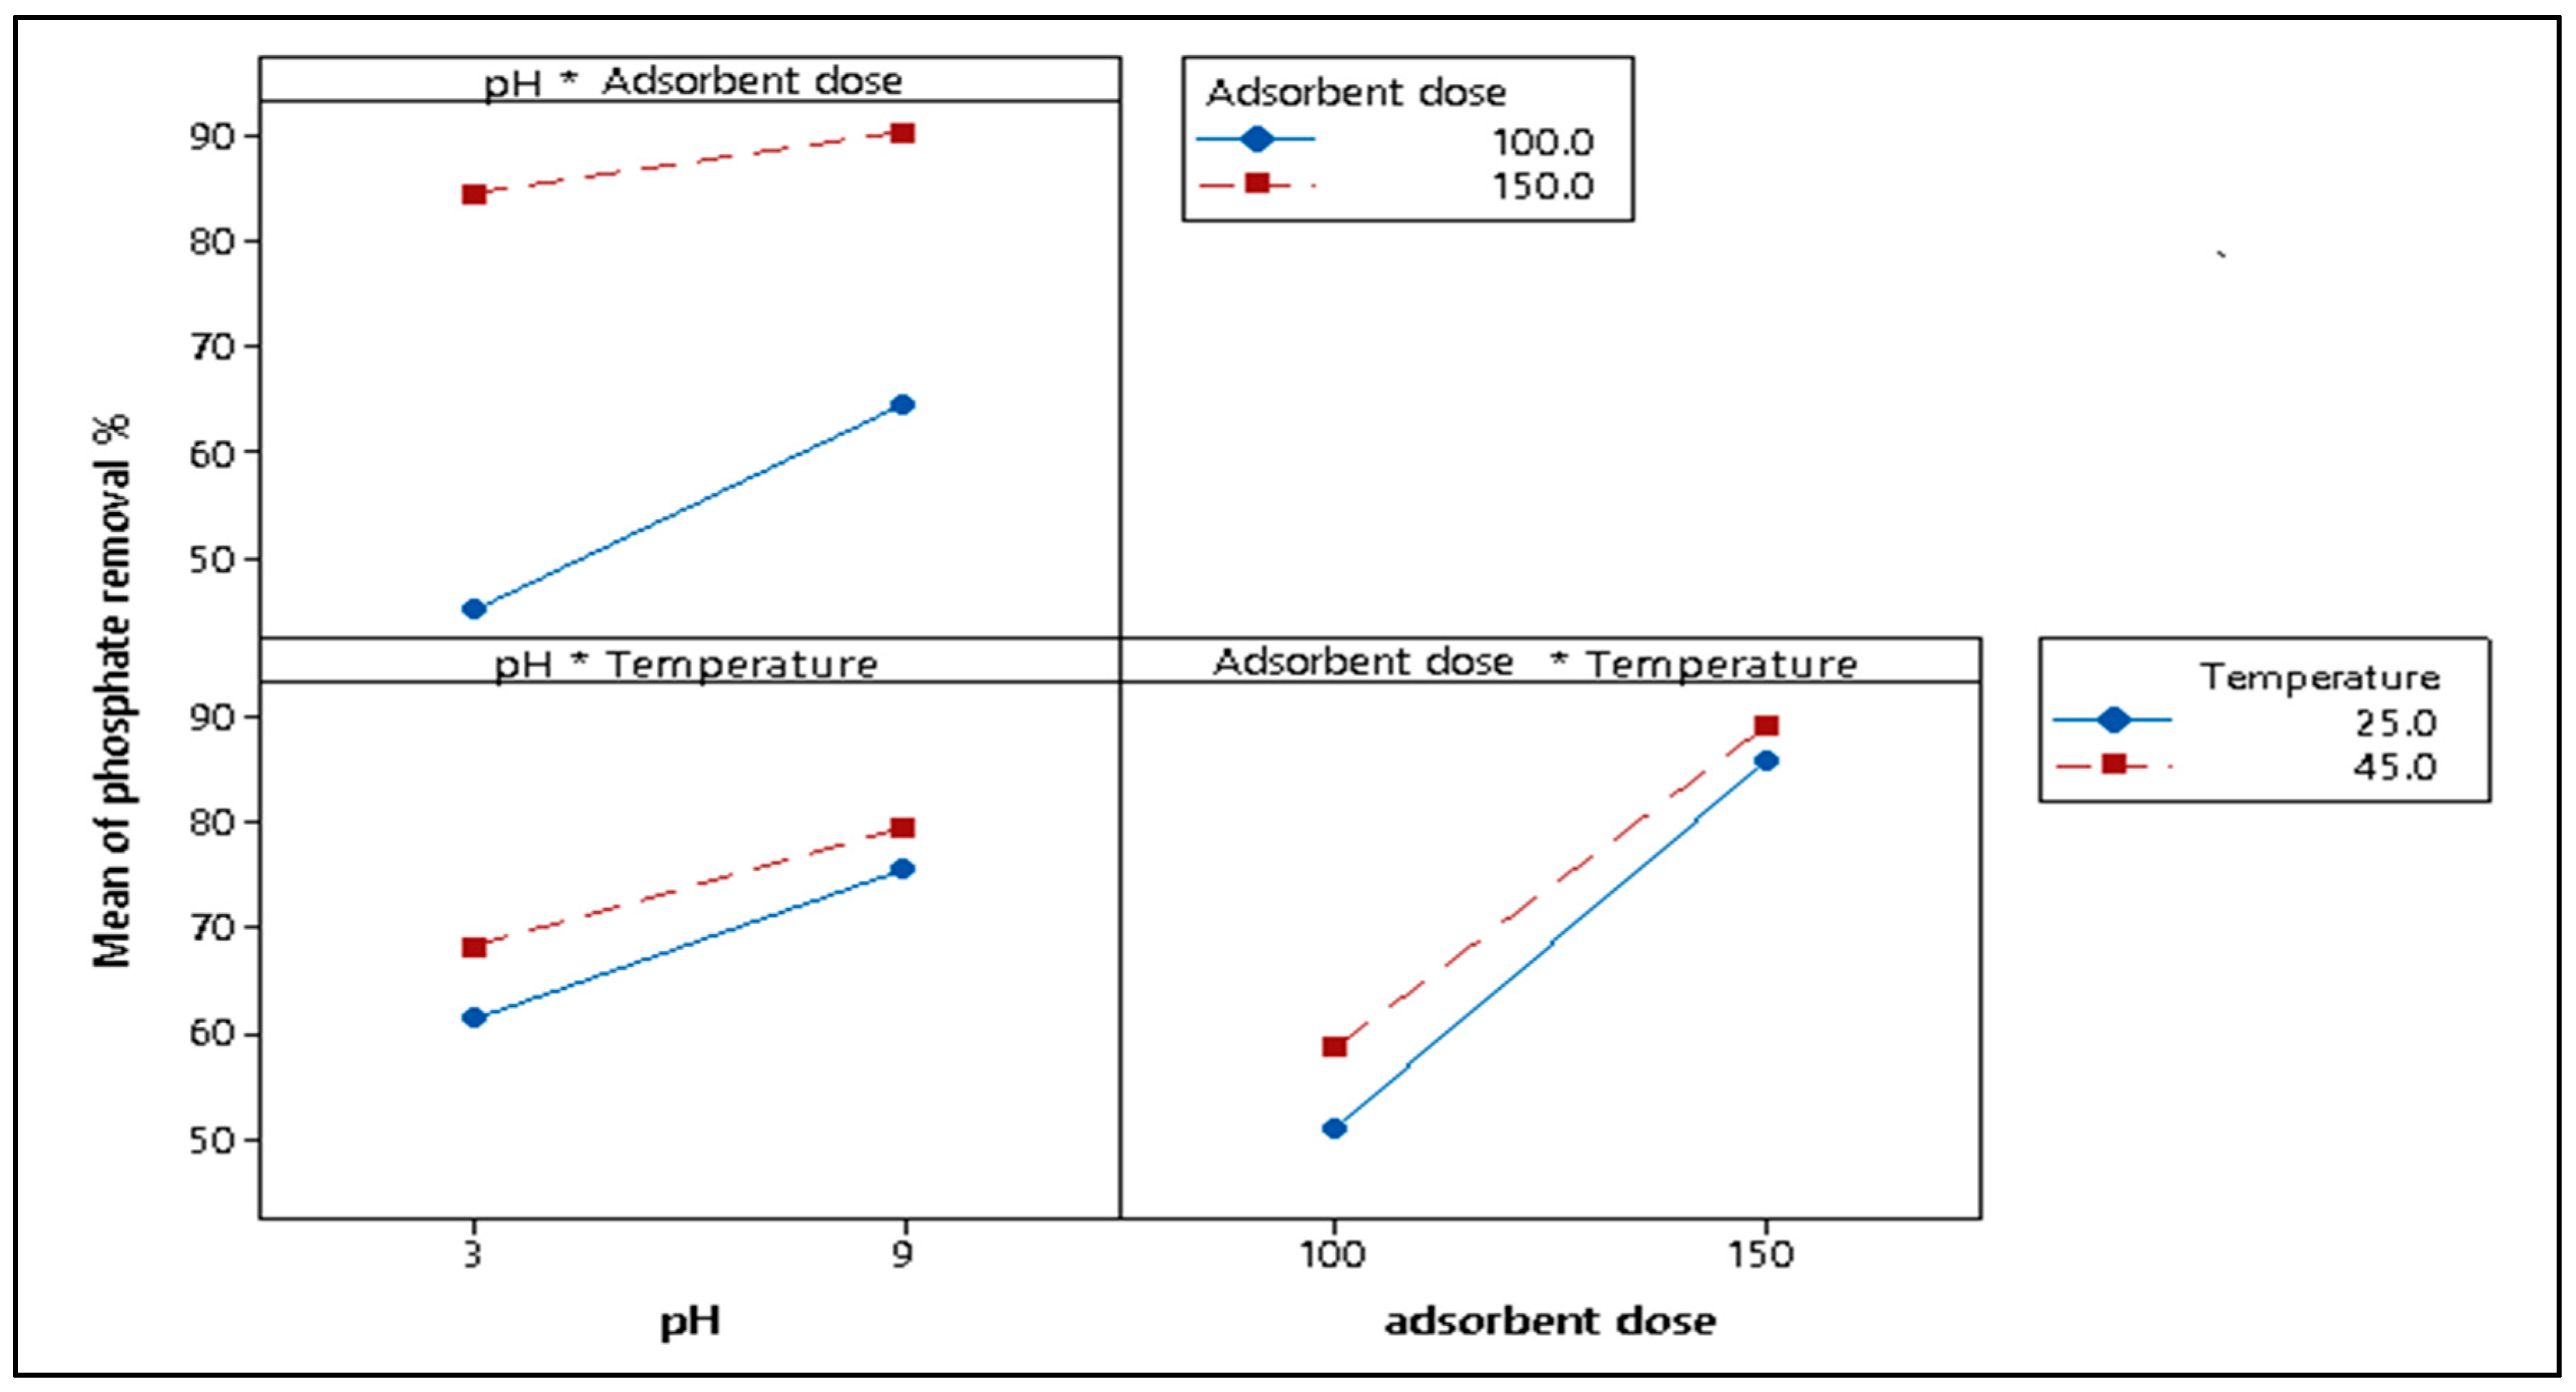
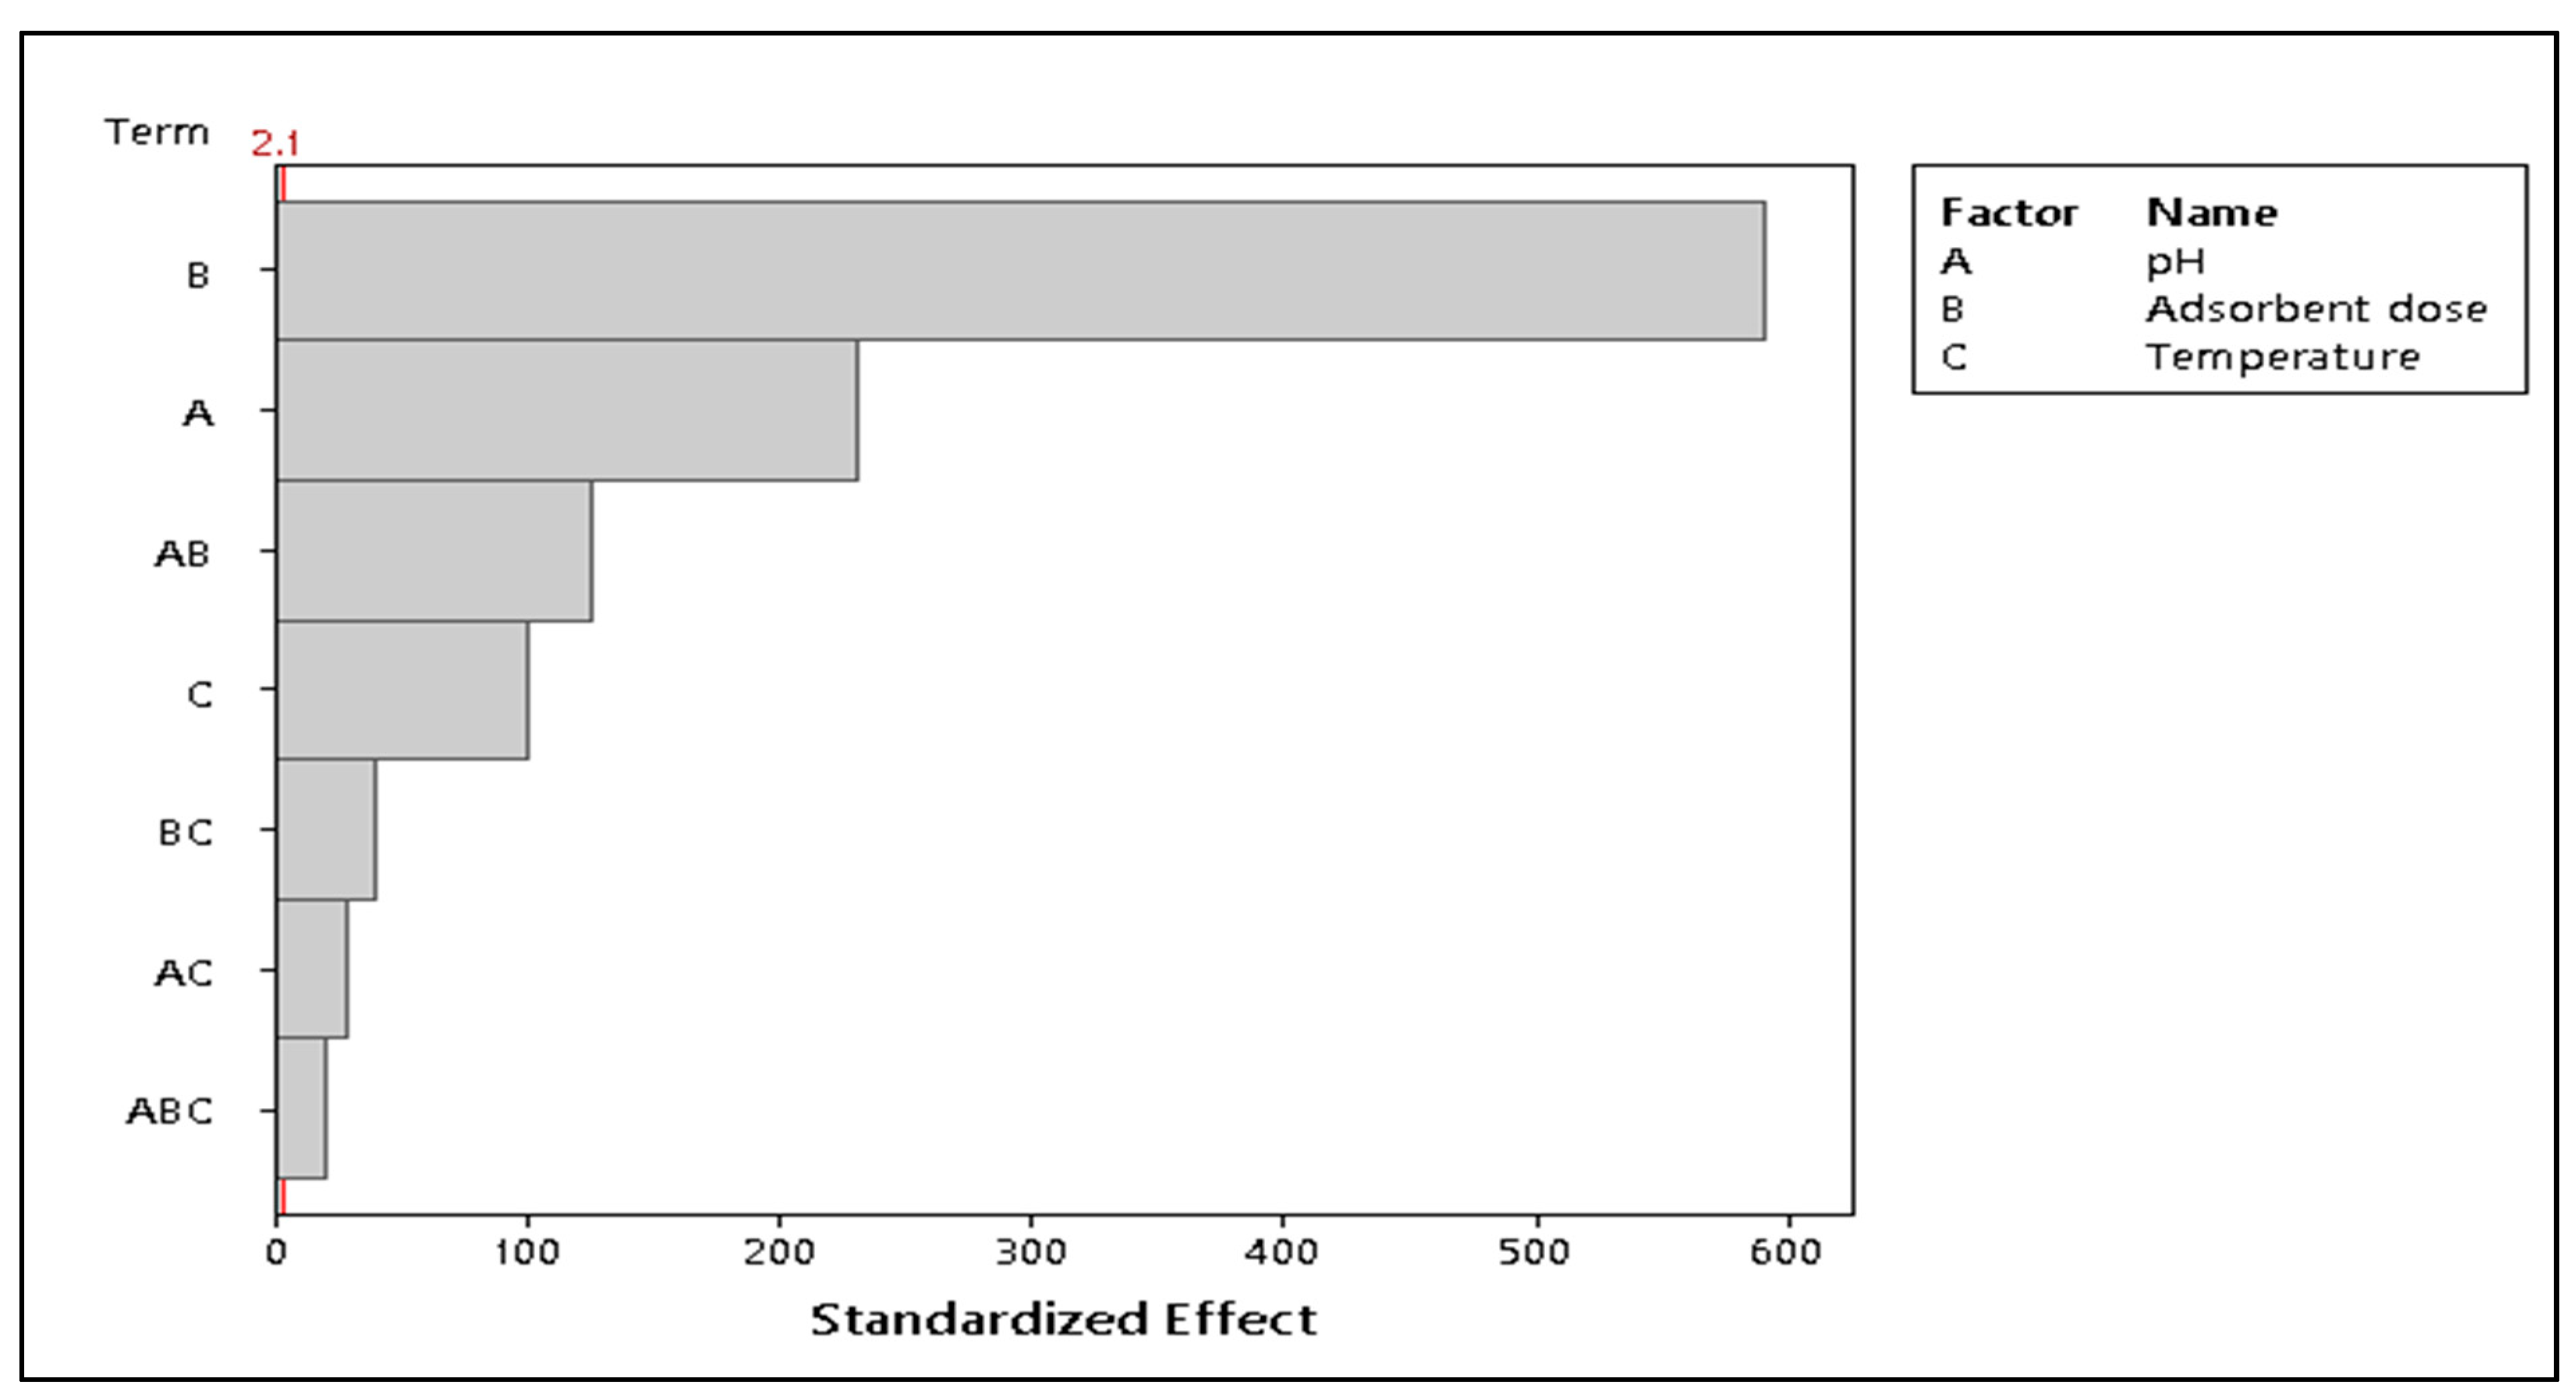
3.2.3. Factorial Design
3.3. Process Modeling
3.3.1. Kinetics
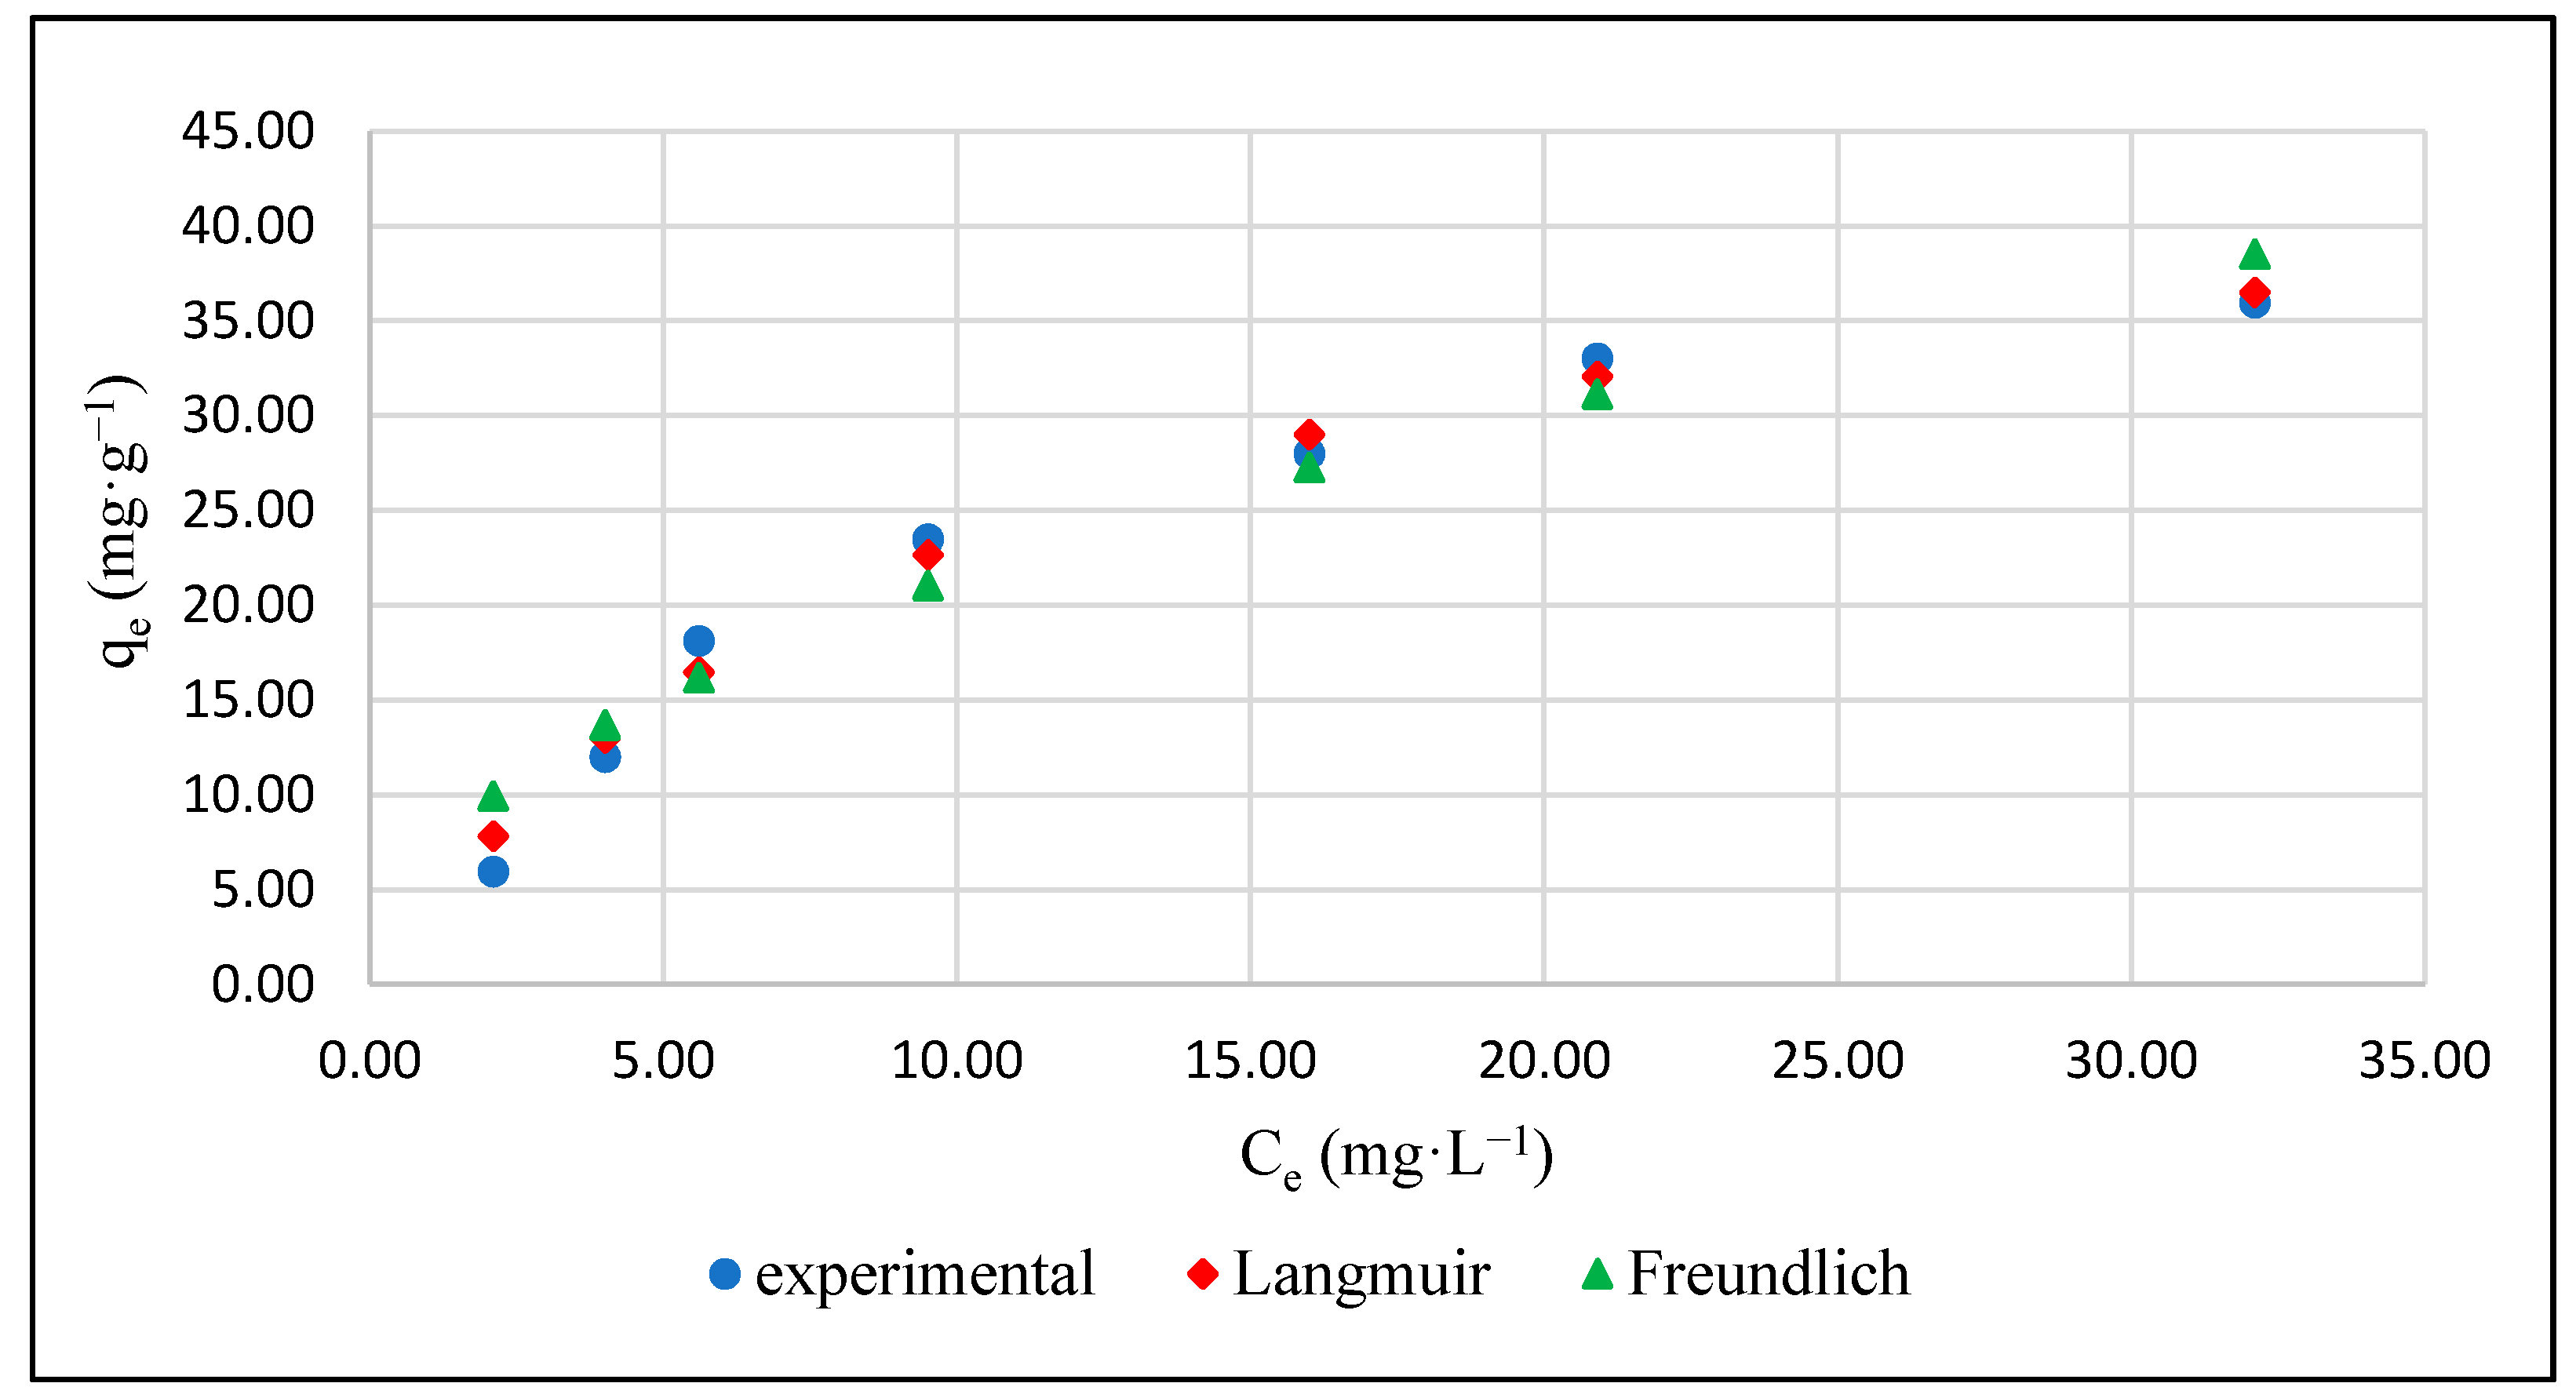
3.3.2. Isotherm
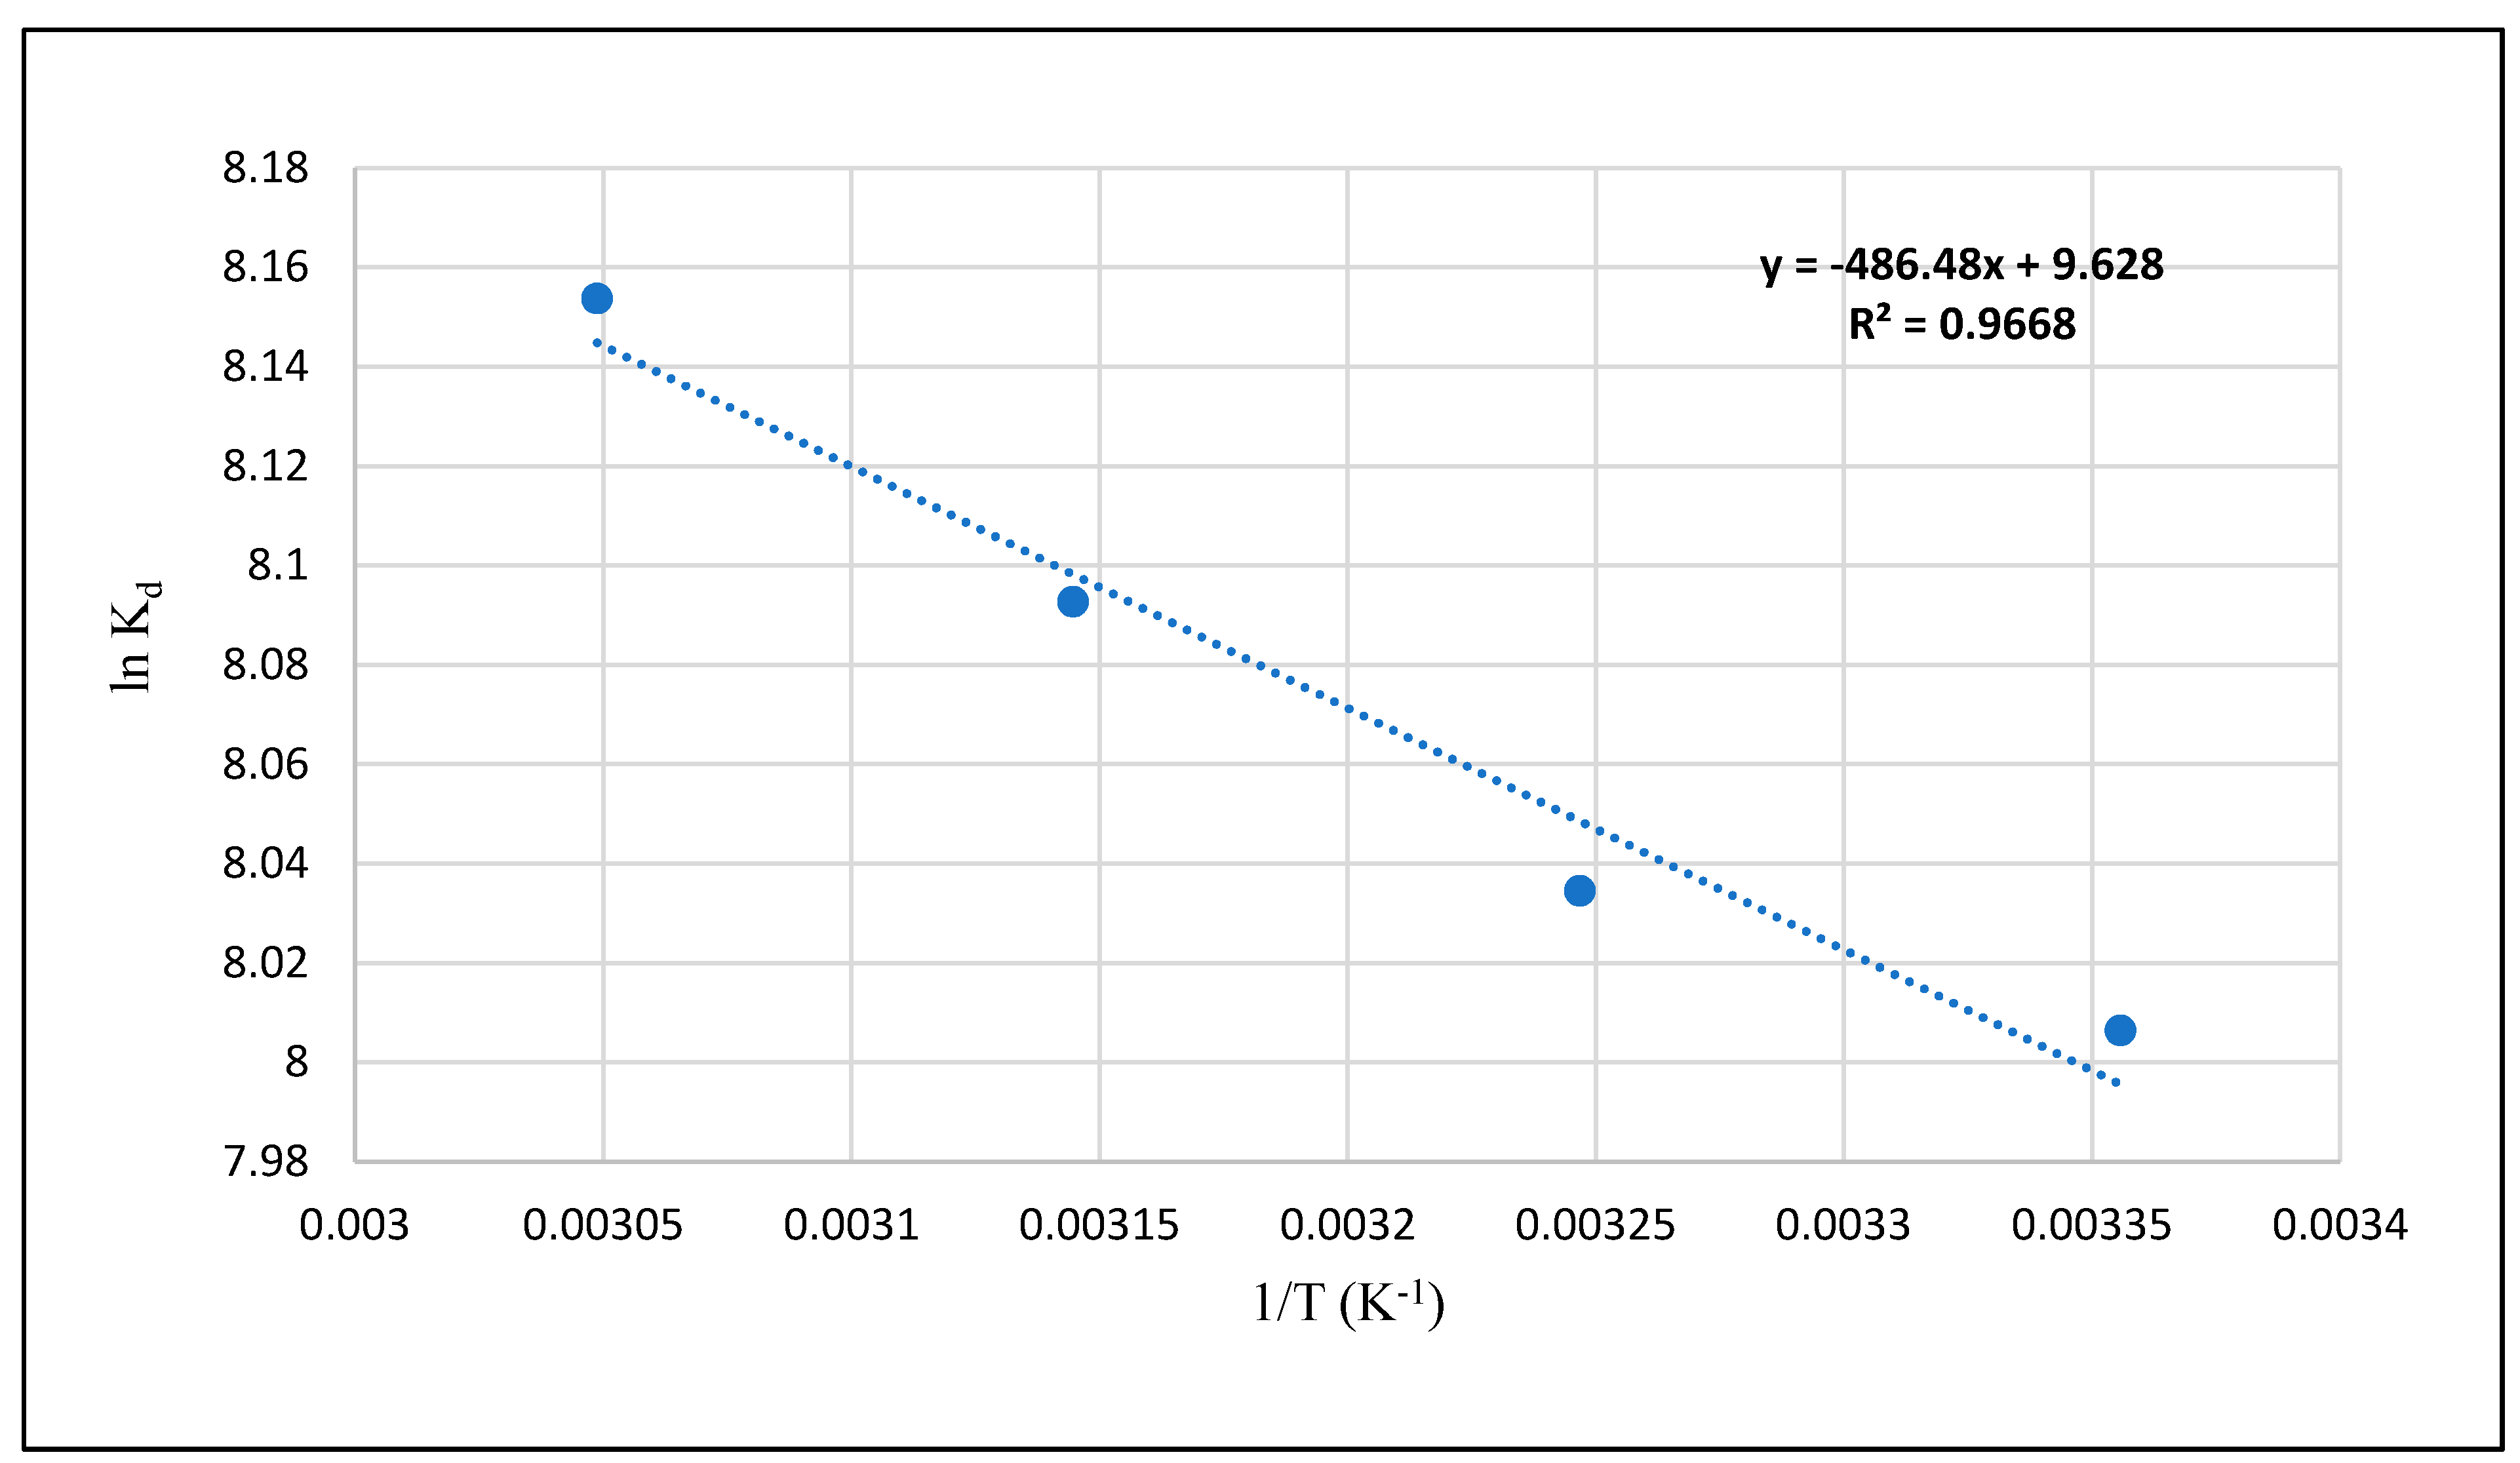
3.3.3. Thermodynamics
3.3.4. Comparison of IL-PP with Other Iron-Loaded Bio-Adsorbents
4. Conclusions
Author Contributions
Funding
Acknowledgments
Conflicts of Interest
References
- Bacelo, H.; Pintor, A.M.A.; Santos, S.C.R.; Boaventura, R.A.R.; Botelho, C.M.S. Performance and prospects of different adsorbents for phosphorus uptake and recovery from water. Chem. Eng. J. 2019, 381, 122566. [Google Scholar] [CrossRef]
- Mayer, B.K.; Baker, L.A.; Boyer, T.H.; Drechsel, P.; Gifford, M.; Hanjra, M.A.; Parameswaran, P.; Stoltzfus, J.; Westerhoff, P.; Rittmann, B.E. Total Value of Phosphorus Recovery. Environ. Sci. Technol. 2016, 50, 6606–6620. [Google Scholar] [CrossRef]
- Melia, P.M.; Cundy, A.B.; Sohi, S.P.; Hooda, P.S.; Busquets, R. Chemosphere Trends in the recovery of phosphorus in bioavailable forms from wastewater. Chemosphere 2017, 186, 381–395. [Google Scholar] [CrossRef] [Green Version]
- Cordell, D.; Rosemarin, A.; Schröder, J.J.; Smit, A.L. Towards global phosphorus security: A systems framework for phosphorus recovery and reuse options. Chemosphere 2011, 84, 747–758. [Google Scholar] [CrossRef] [PubMed]
- Bunce, J.T.; Ndam, E.; Ofiteru, I.D.; Moore, A.; Graham, D.W.; Graham, D.W. A Review of Phosphorus Removal Technologies and Their Applicability to Small-Scale Domestic Wastewater Treatment Systems. Front. Environ. Sci. 2018, 6, 1–15. [Google Scholar] [CrossRef] [Green Version]
- De-Bashan, L.E.; Bashan, Y. Recent advances in removing phosphorus from wastewater and its future use as fertilizer (1997–2003). Water Res. 2004, 38, 4222–4246. [Google Scholar] [CrossRef]
- Sengupta, S.; Nawaz, T.; Beaudry, J. Nitrogen and Phosphorus Recovery from Wastewater. Curr. Pollut. Rep. 2015, 1, 155–166. [Google Scholar] [CrossRef] [Green Version]
- Papargyropoulou, E.; Lozano, R.; Steinberger, J.K.; Wright, N.; Ujang, Z.B. The food waste hierarchy as a framework for the management of food surplus and food waste. J. Clean. Prod. 2014, 76, 106–115. [Google Scholar] [CrossRef]
- Hodúr, C.; Bellahsen, N.; Mikó, E.; Nagypál, V.; Šereš, Z.; Kertész, S. The adsorption of ammonium nitrogen from milking parlor wastewater using pomegranate peel powder for sustainable water, resources, and waste management. Sustainability 2020, 12, 4880. [Google Scholar] [CrossRef]
- Ravindran, R.; Jaiswal, A.K. Exploitation of Food Industry Waste for High-Value Products. Trends Biotechnol. 2015, 34, 58–69. [Google Scholar] [CrossRef] [Green Version]
- Arevalo-gallegos, A.; Ahmad, Z.; Asgher, M.; Parra-saldivar, R.; Iqbal, H.M.N. Sustainable material to produce value-added products with a zero waste approach—A review. Int. J. Biol. Macromol. 2017, 99, 308–318. [Google Scholar] [CrossRef]
- Nguyen, T.A.H.; Ngo, H.H.; Guo, W.; Nguyen, T.V. Phosphorous removal from aqueous solutions by agricultural by-products: A critical review. J. Water Sustain. 2012, 2, 193–207. [Google Scholar] [CrossRef]
- Sulyman, M.; Namiesnik, J.; Gierak, A. Low-cost adsorbents derived from agricultural by-products/wastes for enhancing contaminant uptakes from wastewater: A review. Pol. J. Environ. Stud. 2017, 26, 479–510. [Google Scholar] [CrossRef]
- De Gisi, S.; Lofrano, G.; Grassi, M.; Notarnicola, M. Characteristics and adsorption capacities of low-cost sorbents for wastewater treatment: A review. Sustain. Mater. Technol. 2016, 9, 10–40. [Google Scholar] [CrossRef] [Green Version]
- Yu, F.; Sun, L.; Zhou, Y.; Gao, B.; Gao, W.; Bao, C.; Feng, C. Biosorbents based on agricultural wastes for ionic liquid removal: An approach to agricultural wastes management. Chemosphere 2016, 165, 94–99. [Google Scholar] [CrossRef] [PubMed]
- Solangi, N.H.; Kumar, J.; Mazari, S.A.; Ahmed, S.; Fatima, N.; Mujawar, N.M. Development of fruit waste derived bio-adsorbents for wastewater treatment: A review. J. Hazard. Mater. 2021, 416, 125848. [Google Scholar] [CrossRef]
- Nguyen, T.A.H.; Ngo, H.H.; Guo, W.S.; Zhang, J.; Liang, S.; Lee, D.J.; Nguyen, P.D.; Bui, X.T. Modification of agricultural waste/by-products for enhanced phosphate removal and recovery: Potential and obstacles. Bioresour. Technol. 2014, 169, 750–762. [Google Scholar] [CrossRef]
- Kahramanoglu, I. Trends in Pomegranate Sector: Production, Postharvest Handling and Marketing. Int. J. Agric. For. Life Sci. 2019, 3, 239–246. [Google Scholar]
- Talekar, S.; Patti, A.F.; Vijayraghavan, R.; Arora, A. Complete Utilization of Waste Pomegranate Peels to Produce a Hydrocolloid, Punicalagin Rich Phenolics, and a Hard Carbon Electrode. ACS Sustain. Chem. Eng. 2018, 6, 16363–16374. [Google Scholar] [CrossRef]
- Hadrich, F.; Cherif, S.; Gargouri, Y.T.; Adel, S. Antioxidant and Lipase Inhibitory Activities and Essential Oil Composition of Pomegranate Peel Extracts. J. Oleo Sci. 2014, 63, 515–525. [Google Scholar] [CrossRef] [Green Version]
- Mahdavi, K.; Farhad, A. Application of response surface methodology for the optimization of supercritical fluid extraction of essential oil from pomegranate (Punica granatum L.) peel. J. Food Sci. Technol. 2016, 53, 3113–3121. [Google Scholar] [CrossRef] [Green Version]
- Ventura, J.; Alarcón-aguilar, F.; Roman-ramos, R.; Campos-sepulveda, E.; Reyes-vega, M.L.; Boone-villa, V.D.; Jasso-villagómez, E.I.; Aguilar, C.N. Quality and antioxidant properties of a reduced-sugar pomegranate juice jelly with an aqueous extract of pomegranate peels. Food Chem. 2013, 136, 109–115. [Google Scholar] [CrossRef]
- Grabeža, M.; Škrbićb, R.; Stojiljković, M.P.; Rudić-Grujića, V.; Aleksandra, A.; Snježana, P.; Vučić, V.; Mirjanić-Azariće, K.Š.B.; Menković, T.J.N.; Vasiljević, N. Beneficial effects of pomegranate peel extract on plasma lipid profile, fatty acids levels and blood pressure in patients with diabetes mellitus type-2: A randomized, double-blind, placebo-controlled study. J. Funct. Foods 2019, 64, 103692. [Google Scholar] [CrossRef]
- Demiray, E.; Karatay, S.E.; Dönmez, G. Efficient bioethanol production from pomegranate peels by newly isolated Kluyveromyces marxianus. Energy Sources Part A Recover. Util. Environ. Eff. 2019, 42, 1–10. [Google Scholar] [CrossRef]
- Jain, K.; Suryawanshi, P.; Chaudhari, A. Recovery of acerbic anaerobic digester for biogas production from pomegranate shells using organic loading approach. Indian J. Biochem. Biophys. 2020, 57, 86–94. [Google Scholar]
- Ben-Ali, S.; Jaouali, I.; Souissi-Najar, S.; Ouederni, A. Characterization and adsorption capacity of raw pomegranate peel biosorbent for copper removal. J. Clean. Prod. 2016, 142, 3809–3821. [Google Scholar] [CrossRef]
- Ibrahim, T.H.; Gulistan, A.S.; Khamis, M.I.; Ahmed, H.; Aidan, A. Produced water treatment using naturally abundant pomegranate peel. Desalin. Water Treat. 2015, 57, 1–9. [Google Scholar] [CrossRef]
- Turkmen, S.N.; Kipcak, A.S.; Tugrul, N.; Derun, E.M.; Piskin, S. The Adsorption of Zinc Metal in Waste Water Using ZnCl 2 Activated Pomegranate Peel. Int. J. Mater. Metall. Eng. 2015, 9, 477–480. [Google Scholar]
- Khawaja, M.; Shafaq, M.; Kazi, A.A.; Zia-ur-rehman, M.; MuhammadHamid, A. Adsorption studies of pomegranate peel activated charcoal for nickel (II) ion. J. Chil. Chem. Soc. 2015, 60, 2642–2645. [Google Scholar] [CrossRef] [Green Version]
- Alnawab, R.M.; Ridha, A.M. Use of the electrocoagulation with pomegranate peels and zizith’s leaves adsorption coupling technique for removal of methylene blue in a batch system. Int. J. Eng. Technol. 2018, 7, 3451–3458. [Google Scholar] [CrossRef]
- Güzel, F.; Aksoy, Ö.; Akkaya, G. Application of Pomegranate (Punica granatum) Pulp as a New Biosorbent for the Removal of a Model Basic Dye (Methylene Blue). World Appl. Sci. J. 2012, 20, 965–975. [Google Scholar] [CrossRef]
- Moghadam, M.R.; Nasirizadeh, N.; Dashti, Z.; Babanezhad, E. Removal of Fe (II) from aqueous solution using pomegranate peel carbon: Equilibrium and kinetic studies. Int. J. Ind. Chem. 2013, 4, 19. [Google Scholar] [CrossRef] [Green Version]
- Afsharnia, M.; Saeidi, M.; Zarei, A.; Narooie, M.R.; Biglari, H. Phenol Removal from Aqueous Environment by Adsorption onto Pomegranate Peel Carbon Mojtaba. Electron. Physician 2016, 8, 3248–3256. [Google Scholar] [CrossRef] [Green Version]
- Bellahsen, N.; Varga, G.; Halyag, N.; Kertész, S.; Tombácz, E.; Hodúr, C. Pomegranate peel as a new low-cost adsorbent for ammonium removal. Int. J. Environ. Sci. Technol. 2020, 18, 711–722. [Google Scholar] [CrossRef]
- Bhatnagar, A.; Minocha, A.K. Biosorption optimization of nickel removal from water using Punica granatum peel waste. Colloids Surf. B Biointerfaces 2010, 76, 544–548. [Google Scholar] [CrossRef]
- El-Ashtoukhy, E.S.Z.; Amin, N.K.; Abdelwahab, O. Removal of lead (II) and copper (II) from aqueous solution using pomegranate peel as a new adsorbent. Desalination 2008, 223, 162–173. [Google Scholar] [CrossRef]
- ElNemr, A. Potential of pomegranate husk carbon for Cr(VI) removal from wastewater: Kinetic and isotherm studies. J. Hazard. Mater. 2009, 161, 132–141. [Google Scholar] [CrossRef]
- Senthilkumar, T.; Chattopadhyay, S.K.; Miranda, L.R. Optimization of Activated Carbon Preparation from Pomegranate Peel (Punica granatum Peel) Using RSM. Chem. Eng. Commun. 2020, 17, 238–248. [Google Scholar] [CrossRef]
- Ahmad, M.A.; Puad, N.A.A.; Bello, O.S. Kinetic, equilibrium and thermodynamic studies of synthetic dye removal using pomegranate peel activated carbon prepared by microwave-induced KOH activation. Water Resour. Ind. 2014, 6, 18–35. [Google Scholar] [CrossRef] [Green Version]
- Rashtbari, Y.; Hazrati, S.; Afshin, S.; Fazlzadeh, M.; Vosoughi, M. Data on cephalexin removal using powdered activated carbon (PPAC) derived from pomegranate peel. Data Br. 2018, 20, 1434–1439. [Google Scholar] [CrossRef]
- Salmani, M.H.; Abedi, M.; Mozaffari, S.A.; Sadeghian, H.A. Modification of pomegranate waste with iron ions a green composite for removal of Pb from aqueous solution: Equilibrium, thermodynamic and kinetic studies. AMB Express 2017, 7, 225. [Google Scholar] [CrossRef] [Green Version]
- Abdulrazak, Z.N. Pomegranate peel as sorbent in the removal of Pb (II) from wastewater. J. Eng. Sustain. Dev. 2016, 20, 25–35. [Google Scholar]
- Nguyen, T.A.H.; Ngo, H.H.; Guo, W.S.; Zhang, J.; Liang, S.; Tung, K.L. Feasibility of iron loaded “okara” for biosorption of phosphorous in aqueous solutions. Bioresour. Technol. 2013, 150, 42–49. [Google Scholar] [CrossRef]
- Geyikçi, F.; Büyükgüngör, H. Factorial experimental design for adsorption silver ions from water onto montmorillonite. Acta Geodyn. Geomater. 2013, 10, 363–370. [Google Scholar] [CrossRef] [Green Version]
- Tran, H.N.; You, S.J.; Hosseini-Bandegharaei, A.; Chao, H.P. Mistakes and inconsistencies regarding adsorption of contaminants from aqueous solutions: A critical review. Water Res. 2017, 120, 88–116. [Google Scholar] [CrossRef]
- Tran, H.N.; Wang, Y.F.; You, S.J.; Chao, H.P. Insights into the mechanism of cationic dye adsorption on activated charcoal: The importance of Π–Π interactions. Process Saf. Environ. Prot. 2017, 107, 168–180. [Google Scholar] [CrossRef]
- Milonjić, S.K. A consideration of the correct calculation of thermodynamic parameters of adsorption. J. Serbian Chem. Soc. 2007, 72, 1363–1367. [Google Scholar] [CrossRef]
- Savaji, K.V.; Niitsoo, O.; Couzis, A. Influence of particle / solid surface zeta potential on particle adsorption kinetics. J. Colloid Interface Sci. 2014, 431, 165–175. [Google Scholar] [CrossRef]
- Nechifor, G.; Pascu, D.E.; Pascu, M.; Traistaru, G.A.; Bunaciu, A.A.; Aboul-Enein, H.Y. Study of adsorption kinetics and zeta potential of phosphate and nitrate ions on a cellulosic membrane. Rev. Roum. Chim. 2013, 58, 591–597. [Google Scholar]
- Hena, S.; Atikah, S.; Ahmad, H. Removal of phosphate ion from water using chemically modified biomass of sugarcane bagasse. Int. J. Eng. Sci. 2015, 4, 51–62. [Google Scholar]
- Pathak, P.D.; Mandavgane, S.A.; Kulkarni, B.D. Characterizing fruit and vegetable peels as bioadsorbents. Curr. Sci. 2016, 110, 2114–2115. [Google Scholar] [CrossRef]
- Li, M.; Liu, J.; Xu, Y.; Qian, G. Phosphate adsorption on metal oxides and metal hydroxides: A comparative review. Environ. Rev. 2016, 24, 319–332. [Google Scholar] [CrossRef]
- Lǚ, J.; Liu, H.; Liu, R.; Zhao, X.; Sun, L.; Qu, J. Adsorptive removal of phosphate by a nanostructured Fe—Al—Mn trimetal oxide adsorbent. Powder Technol. 2013, 233, 146–154. [Google Scholar] [CrossRef]
- Carvalho, W.S.; Martins, D.F.; Gomes, F.R.; Leite, I.R.; da Silva, L.G.; Ruggiero, R.; Richter, E.M. Phosphate adsorption on chemically modified sugarcane bagasse fibres. Biomass Bioenergy 2011, 35, 3913–3919. [Google Scholar] [CrossRef]
- Worch, E. Adsorption Technology in Water Treatment: Fundamentals, Processes, and Modeling; De Gruyter, Hubert & Co. GmbH & Co. KG: Berlin, Germany, 2012. [Google Scholar]
- Liu, R.; Chi, L.; Wang, X.; Sui, Y.; Wang, Y.; Arandiyan, H. Review of metal (hydr)oxide and other adsorptive materials for phosphate removal from water. J. Environ. Chem. Eng. 2018, 6, 5269–5286. [Google Scholar] [CrossRef]
- De Sousa, A.F.; Braga, T.P.; Gomes, E.C.C.; Valentini, A.; Longhinotti, E. Adsorption of phosphate using mesoporous spheres containing iron and aluminum oxide. Chem. Eng. J. 2012, 210, 143–149. [Google Scholar] [CrossRef]
- Zhang, B.; Chen, N.; Feng, C.; Zhang, Z. Adsorption for phosphate by crosslinked/non-crosslinked-chitosan-Fe(III) complex sorbents: Characteristic and mechanism. Chem. Eng. J. 2018, 353, 361–372. [Google Scholar] [CrossRef]
- Özbay, N.; Yarg, A.F.J.; Yarbay, R.Z.F.; Önal, E. Full Factorial Experimental Design Analysis of Reactive Dye Removal by Carbon Adsorption. J. Chem. 2013, 2013, 1–13. [Google Scholar] [CrossRef] [Green Version]
- Mekonnen, D.T.; Alemayehu, E.; Lennartz, B. Removal of phosphate ions from aqueous solutions by adsorption onto leftover coal. Water 2020, 12, 1381. [Google Scholar] [CrossRef]
- Hegazy, A.K.; Abdel-Ghani, N.T.; El-Chaghaby, G.A. Adsorption of phenol onto activated carbon from Rhazya stricta: Determination of the optimal experimental parameters using factorial design. Appl. Water Sci. 2013, 4, 273–281. [Google Scholar] [CrossRef] [Green Version]
- Mtaallah, S.; Marzouk, I.; Hamrouni, B. Factorial experimental design applied to adsorption of cadmium on activated alumina Salma Mtaallah, Ikhlass Marzouk and Béchir Hamrouni. J. Water Reuse Desalination 2018, 8, 76–85. [Google Scholar] [CrossRef]
- Regti, A.; el Kassimi, A.; Laamari, M.R.; el Haddad, M. Competitive adsorption and optimization of binary mixture of textile dyes: A factorial design analysis. J. Assoc. Arab Univ. Basic Appl. Sci. 2017, 24, 1–9. [Google Scholar] [CrossRef] [Green Version]
- Tan, K.L.; Hameed, B.H. Insight into the adsorption kinetics models for the removal of contaminants from aqueous solutions. J. Taiwan Inst. Chem. Eng. 2017, 74, 25–48. [Google Scholar] [CrossRef]
- Mezenner, N.Y.; Bensmaili, A. Kinetics and thermodynamic study of phosphate adsorption on iron hydroxide-eggshell waste. Chem. Eng. J. 2009, 147, 87–96. [Google Scholar] [CrossRef]
- Foo, K.Y.; Hameed, B.H. Insights into the modeling of adsorption isotherm systems. Chem. Eng. J. 2010, 156, 2–10. [Google Scholar] [CrossRef]
- Ayawei, N.; Ebelegi, A.N.; Wankasi, D. Modelling and Interpretation of Adsorption Isotherms. J. Chem. 2017, 2017, 1–11. [Google Scholar] [CrossRef]
- Rathod, M.; Mody, K.; Basha, S. Efficient removal of phosphate from aqueous solutions by red seaweed, Kappaphycus alverezii. J. Clean. Prod. 2014, 84, 484–493. [Google Scholar] [CrossRef]
- Doke, K.M.; Khan, E.M. Adsorption thermodynamics to clean up wastewater; critical review. Rev. Environ. Sci. Biotechnol. 2013, 12, 25–44. [Google Scholar] [CrossRef]
- Peng, F.; He, P.W.; Luo, Y.; Lu, X.; Liang, Y.; Fu, J. Adsorption of Phosphate by Biomass Char Deriving from Fast Pyrolysis of Biomass Waste. Clean—Soil Air Water 2012, 40, 493–498. [Google Scholar] [CrossRef]
- Benyoucef, S.; Amrani, M. Adsorption of phosphate ions onto low cost Aleppo pine adsorbent. Desalination 2011, 275, 231–236. [Google Scholar] [CrossRef]
- Liu, Y.; Liu, Y. Biosorption isotherms, kinetics and thermodynamics. Sep. Purif. Technol. 2008, 61, 229–242. [Google Scholar] [CrossRef]
- Loganathan, P.; Vigneswaran, S.; Kandasamy, J.; Nanthi, S. Critical Reviews in Environmental Science: Removal and recovery of phosphate from water using. Crit. Rev. Environ. Sci. Technol. 2013, 44, 37–41. [Google Scholar] [CrossRef]
- Biswas, B.K.; Inoue, K.; Ghimire, K.N.; Ohta, S.; Harada, H.; Ohto, K.; Kawakita, H. The adsorption of phosphate from an aquatic environment using metal-loaded orange waste. J. Colloid Interface Sci. 2007, 312, 214–223. [Google Scholar] [CrossRef] [PubMed]
- Eberhardt, T.L.; Min, S. Biosorbents prepared from wood particles treated with anionic polymer and iron salt: Effect of particle size on phosphate adsorption. Bioresour. Technol. 2008, 99, 626–630. [Google Scholar] [CrossRef] [PubMed]
- Shrestha, A.; Poudel, B.R.; Silwal, M.; Pokhrel, M.R.; Campus, T.M. Adsorptive removal of phosphate onto iron loaded litchi chinensis. J. Inst. Sci. Technol. 2018, 23, 81–87. [Google Scholar] [CrossRef]
- Krishnan, K.A.; Haridas, A. Removal of phosphate from aqueous solutions and sewage using natural and surface modified coir pith. J. Hazard. Mater. 2008, 152, 527–535. [Google Scholar] [CrossRef] [PubMed]


| Parameter | Coded Symbol | Low Level (−1) | High Level (+1) |
|---|---|---|---|
| pH | A | 3 | 9 |
| Adsorbent dose (mg) | B | 100 | 150 |
| Temperature (°C) | C | 25 | 45 |
| Adsorption Band (cm−1) | Assignment | ||
|---|---|---|---|
| PP | IL-PP | IL-PP after PO43− Adsorption | |
| 3323 | 3306 | 3327 | –OH and N–H |
| 2931 | 2918 | 2924 | C–H, –CH3, or –CH2 |
| 1719 | – | – | C=O and C–C |
| 1615 | 1617 | – | C=C, C=O, or N–H |
| – | – | 1601 | Fe-P |
| 1442 | – | – | –OH |
| 1320 | 1313 | 1318 | C–H, –CH3, or –CH2 |
| 1223 | – | – | O–H |
| 1031 | 1030 | – | C-O and C-O–C |
| 876 | – | – | O–H, C=O, and O–H |
| – | 801 | – | Fe–OH |
| 747 | – | – | C–N |
| Run | pH (A) | Adsorbent Dose (B) | Temperature (°C) | Removal Rate (%) | Standard Deviation |
|---|---|---|---|---|---|
| 1 | 1 | −1 | −1 | 61.08 | 2.74 |
| 2 | −1 | 1 | 1 | 87.5 | 1.32 |
| 3 | 1 | 1 | −1 | 90 | 2.5 |
| 4 | −1 | 1 | −1 | 81.66 | 2.93 |
| 5 | −1 | −1 | −1 | 41.16 | 3.35 |
| 6 | 1 | 1 | 1 | 90.75 | 1.75 |
| 7 | 1 | −1 | 1 | 68.25 | 2.61 |
| 8 | −1 | −1 | 1 | 49.16 | 2.56 |
| Term | Effect | Coef | SE Coef | T-Value | p-Value | VIF |
|---|---|---|---|---|---|---|
| Constant | 71.1979 | 0.0276 | 2583.39 | 0.000 | ||
| pH | 12.6458 | 6.3229 | 0.0276 | 229.42 | 0.000 | 1.00 |
| Adsorbent dose | 32.5625 | 16.2813 | 0.0276 | 229.42 | 0.000 | 1.00 |
| Temperature | 5.4375 | 2.7188 | 0.0276 | 590.76 | 0.000 | 1.00 |
| pH × Adsorbent dose | −6.8542 | −3.4271 | 0.0276 | −124.35 | 0.000 | 1.00 |
| pH × Temperature | −1.4792 | −0.7396 | 0.0276 | −26.84 | 0.000 | 1.00 |
| Adsorbent dose × Temperature | −2.1458 | −1.0729 | 0.0276 | −38.93 | 0.000 | 1.00 |
| pH × Adsorbent dose × Temperature | −1.0625 | −0.5312 | 0.0276 | −19.28 | 0.000 | 1.00 |
| S | 0.135015 | |||||
| R2 | 100.00% | |||||
| R2 (Adj) | 99.99% | |||||
| R2 (Pred) | 99.99% |
| Source | DF | Adj SS | Adj MS | F-Value | p-Value |
|---|---|---|---|---|---|
| Model | 7 | 7828.21 | 1118.32 | 61,347.57 | 0.000 |
| Linear | 3 | 7498.80 | 2499.60 | 137,120.90 | 0.000 |
| pH | 1 | 959.50 | 959.50 | 52,635.57 | 0.000 |
| Adsorbent dose | 1 | 6361.90 | 6361.90 | 348,995.57 | 0.000 |
| Temperature | 1 | 177.40 | 177.40 | 9731.57 | 0.000 |
| Two-way interactions | 3 | 322.63 | 107.54 | 5899.57 | 0.000 |
| pH × Adsorbent dose | 1 | 281.88 | 281.88 | 15,463.00 | 0.000 |
| pH × temperature | 1 | 13.13 | 13.13 | 720.14 | 0.000 |
| Adsorbent dose × temperature | 1 | 27.63 | 27.63 | 1515.57 | 0.000 |
| Three-way interaction | 1 | 6.77 | 6.77 | 371.57 | 0.000 |
| pH × adsorbent dose × temperature | 1 | 6.77 | 6.77 | 371.57 | 0.000 |
| Error | 16 | 0.29 | 0.02 | ||
| Total | 23 | 7828.50 |
| Kinetic Model | qe,cal (mg·g−1) | Parameters | R2 | χ2 | qe,exp (mg·g−1) |
|---|---|---|---|---|---|
| Pseudo-first-order | 11.44 | k1 = 1.01 (L·min−1) | 0.39 | 0.22 | 12 |
| Pseudo-second-order | 11.85 | k2 = 0.19 (g·mg−1·min−1) | 0.83 | 0.05 | |
| Elovich equation | 12.11 | α (×106) = 11.88 (mg·g−1·min−1) β = 1.72 (mg·g−1) | 0.97 | 0.007 | |
| Intraparticle diffusion | 12.22 | k3 = 0.28 (mg·g−1·min−1) C = 10.04 | 0.91 | 0.03 |
| Isotherm Model | Parameters | R2 | χ2 |
|---|---|---|---|
| Langmuir | KL = 0.09 (L·mg−1) qmax = 49.12 (mg·g−1) RL = 0.21 | 0.98 | 0.78 |
| Freundlich | KF = 6.88 1/n = 0.49 | 0.94 | 2.62 |
| Temperature (K) | ∆G (J·mol−1) | ∆H (J·mol−1) | ∆S (J·K−1·mol−1) |
|---|---|---|---|
| 298 | −19,836.35 | 4044.59 | 80.04 |
| 308 | −20,573.93 | ||
| 318 | −21,395.71 | ||
| 328 | −22,235.05 |
| Bio-Adsorbent | qmax (mg PO4-P/g) | Reference |
|---|---|---|
| Fe(III)-loaded orange waste gel | 42.72 | [74] |
| Fe(II)-loaded wood particles | 17.38 | [75] |
| Fe(II)-loaded sugarcane bagasse | 152 | [54] |
| Fe(III)-loaded okara (ILO) | 16.66 | [43] |
| Fe(III)-loaded litchi seed waste | 100 | [76] |
| Fe(III) impregnated coir pith | 70.92 | [77] |
| IL-PP | 49.12 | This study |
Publisher’s Note: MDPI stays neutral with regard to jurisdictional claims in published maps and institutional affiliations. |
© 2021 by the authors. Licensee MDPI, Basel, Switzerland. This article is an open access article distributed under the terms and conditions of the Creative Commons Attribution (CC BY) license (https://creativecommons.org/licenses/by/4.0/).
Share and Cite
Bellahsen, N.; Kakuk, B.; Beszédes, S.; Bagi, Z.; Halyag, N.; Gyulavári, T.; Kertész, S.; Amarti, A.E.; Tombácz, E.; Hodúr, C. Iron-Loaded Pomegranate Peel as a Bio-Adsorbent for Phosphate Removal. Water 2021, 13, 2709. https://doi.org/10.3390/w13192709
Bellahsen N, Kakuk B, Beszédes S, Bagi Z, Halyag N, Gyulavári T, Kertész S, Amarti AE, Tombácz E, Hodúr C. Iron-Loaded Pomegranate Peel as a Bio-Adsorbent for Phosphate Removal. Water. 2021; 13(19):2709. https://doi.org/10.3390/w13192709
Chicago/Turabian StyleBellahsen, Naoufal, Balázs Kakuk, Sándor Beszédes, Zoltán Bagi, Nóra Halyag, Tamás Gyulavári, Szabolcs Kertész, Ahmed El Amarti, Etelka Tombácz, and Cecilia Hodúr. 2021. "Iron-Loaded Pomegranate Peel as a Bio-Adsorbent for Phosphate Removal" Water 13, no. 19: 2709. https://doi.org/10.3390/w13192709
APA StyleBellahsen, N., Kakuk, B., Beszédes, S., Bagi, Z., Halyag, N., Gyulavári, T., Kertész, S., Amarti, A. E., Tombácz, E., & Hodúr, C. (2021). Iron-Loaded Pomegranate Peel as a Bio-Adsorbent for Phosphate Removal. Water, 13(19), 2709. https://doi.org/10.3390/w13192709