Article

Potential for Biomass Production and Remediation by Cultivation of the Marine Model Diatom Phaeodactylum tricornutum in Oil Field Produced Wastewater Media

by
Jeroen T. F. Gillard
1,*,
Alexander L. Hernandez
1,
Javier A. Contreras
1,
Isolde M. Francis
1 and
Luis Cabrales
2
1
Department of Biology, California State University, 9001 Stockdale Highway, Bakersfield, CA 93311, USA
2
Department of Physics and Engineering, California State University, 9001 Stockdale Highway, Bakersfield, CA 93311, USA
*
Author to whom correspondence should be addressed.
Water 2021, 13(19), 2700; https://doi.org/10.3390/w13192700
Submission received: 23 August 2021 / Revised: 27 September 2021 / Accepted: 27 September 2021 / Published: 29 September 2021

Abstract

:
While oilfield produced water (PW) is one of the largest, unclaimed wastewater streams of the oil industry, it could potentially be used as a cultivation medium for microalgae. Microalgae could help with the remediation of this water while also delivering biomass that can be transformed into valuable byproducts such as biofuels. The coupling of these two purposes is expected to cut production costs of biofuels while aiding environmental protection. In this study, we compared the cultivation capacity of the marine model diatom Phaeodactylum tricornutum in media at varying salinities and in media composed of PW from two oilfields in the Central Valley of California that differed drastically in the concentration of inorganic and organic constituents. Specifically, we measured the carrying capacity of these media, the maximum growth rates of P. tricornutum, its cellular lipid accumulation capacity, and its capacity to remediate the most polluted PW source. Our study shows that P. tricornutum can successfully adjust to the tested cultivation media through processes of short-term acclimation and long-term adaptation. Furthermore, the cultivation of P. tricornutum in the most heavily polluted PW source led to significant increases in cell yield and improved photosynthetic capacity during the stationary phase, which could be attributed chiefly to the higher levels of nitrate present in this PW source. Chemical water analyses also demonstrated the capability of P. tricornutum to remediate major nutrient content and potentially harmful elements like fluorine and copper. Because P. tricornutum is amenable to advanced genetic engineering, which could be taken advantage of to improve its cultivation resilience and productivity in an economic setting, we propose this study as a step towards essential follow-up studies that will identify the genetic regulation behind its growth in oilfield PW media and its remediation of the PW constituents.

1. Introduction

During oil extraction, water trapped with the oil in underground reservoirs is brought to the surface. This water is referred to as produced water (PW) and it is the largest waste stream of the oil industry. Disposal of PW poses environmental challenges due to the presence of organic and inorganic constituents that can contaminate the environment. To accommodate the risks, oil operators commonly dispose of the PW in evaporation ponds, re-inject it into subsurface reservoirs, or transport it to offsite storage facilities [1]. However, these practices do not achieve repurposing of the water for beneficial uses such as land irrigation or groundwater augmentation. Remediation of PW for such beneficial uses relies on costly physicochemical procedures like filtration, reverse osmosis, flotation, adsorption, oxidation, or electrodialysis [2,3]. An alternative to these procedures is bioremediation, the use of biological systems to achieve water purification. For example, natural or constructed wetlands have shown to remove nutrients and petroleum-derived toxic organic fractions [4,5]. While a wetland-based bioremediation can be highly effective, the rate of operation is relatively slow [6]. An alternative biological solution is remediation through microalgal cultivation [7,8]. In this case, microalgae either metabolically assimilate the water contaminants [9], or the contaminants adsorb to cell walls or binding sites inside the cell [10]. Because this method permits the concomitant production of biomass through photosynthetic carbon fixation, microalgal-based systems could improve the economic viability of PW bioremediation [11,12,13].
The development of economically viable microalgal cultivation systems is facilitated by several factors, like the ability of the microalgae to grow on unclaimed, cheap wastewater, their remediation efficiency of dissolved pollutants present in the wastewater, and their capacity to accumulate biomass that can be cost-effectively harvested and transformed into valuable products, for example biodiesel [12,14,15,16,17]. To achieve such feats, studies have focused on assessing the growth modes of algal-microbial communities or selected species combinations in various wastewater sources [8,18,19,20,21,22,23]. These studies have demonstrated that wastewater, including PW, can be a highly efficient cultivation medium for many species, sometimes achieving substantive improvements in water quality. However, it is also clear that the performance of these microalgal strains depends on the cultivation methods, the chemical constituents of the cultivation media, and the biotic and abiotic factors affecting the cell’s biological processes. For example, variations in temperature, irradiance, and water quality determines the quantity, quality, and accumulation speed of the biomass. Therefore, the algae-based industry will likely come to rely on development of genetically engineered strains with optimized traits tailored to the specific needs of customized cultivation systems [24,25,26]. This implies that model organisms, for which the science is most advanced, have great potential to generate the insights necessary for development of transformative technologies.
The marine microalgal organism called Phaeodactylum tricornutum, is the main model species within the prolific group of eukaryotic microalgae, called diatoms. Being the dominant members of phytoplankton communities in rivers, lakes, and oceans, diatoms fix up to 25% of atmospheric CO2 globally each year [27]. They are also considered one of the most promising candidates for the creation of economically viable next-generation biofuels, because they are superior lipid producers (which they synthesize as an energy store in times of nutrient shortage) and because of the advanced genomic resources that have been developed over the past two decennia [28,29,30]. In this sense, the biotechnological potential of the model diatom Phaeodactylum tricornutum greatly exceeds that of other species in the field: it has the most extensive knowledge base, and is amenable to the most advanced methods for genome editing [31,32]. This has facilitated, for example, the generation of improved lipid-producing strains [33,34,35,36]. Furthermore, P. tricornutum has been successfully grown in various wastewater sources, sometimes with concomitant removal of nutrients and improved lipid production [37,38,39,40].
Here, we characterized the batch cultivation of Phaeodactylum tricornutum in oil field PW cultivation media. Because the salinity level of PW varies widely based on the source rock of the oil formation from which it is derived [41,42], we initiated the study by comparing the growth of two P. tricornutum strains, CCAP1055/1 (Pt1) and CCAP1052/6 (Pt4) [43], at a broad range of salinities. The genome of Pt1 has been extensively studied and, therefore, this strain is most often used in current research. However, Pt1 is a marine strain isolated off the coast of the Irish Sea (Blackpool, UK) where the salinity is ca. 30 practical salinity units (psu) [44]. In contrast, Pt4 originates from a supralittoral rock pool on the Island of Segelskårin the Baltic Sea (Finland) where the water is brackish (approximately 6 psu) and the salinity fluctuates due to freshwater influxes [45], as well as by presumed evaporation cycles of rock pools in the supralittoral habitat. Following the identification of substantial genome-wide nucleotide polymorphisms, these strains were recently shown to be genetically diverged, likely due to long-term selective pressures specific to their origins of isolation [46]. Based on these considerations, we tested the hypothesis that Pt4 might exhibit a broader salinity tolerance, and would, therefore, be preferred for cultivation at the variable salinities of PW media. The strain that performed best at a wider range of salinities was then used for the assessment of growth and cellular lipid accumulation in media prepared with PW that was collected from two oilfields in the Southern San Joaquin Valley of central California. Finally, chemical analysis before and after cultivation in the most polluted PW source allowed evaluating the possible causes for P. tricornutum’s growth cessation in the stationary phase, as well as assessment of the PW remediation achieved by P. tricornutum cultivation.

2. Materials and Methods

2.1. Strain Maintenance and Cultivation

The P. tricornutum strains CCAP1055/1 (Pt1) and CCAP1052/6 (Pt4) were obtained from the Culture Collection of Algae and Protozoa (Argyll, Scotland, UK), and the Culture Collection of Algae at the University of Texas in Austin (USA), respectively. Stock cultures of both strains were maintained by weekly reinoculations of cultures in synthetic ESAW medium at normal salinity (31 psu) [47]. All procedures were conducted in an AirClean® 600 PCR Workstation equipped with HEPA filters (AirClean, Creedmoor, NC, USA). For cultivation, strains were incubated in a Percival E-41L2 incubator (Percival Scientific, Perry, IA, USA) at 18 °C with a 14 h:10 h light:dark cycle provided by top-mounted cool white fluorescent lamps (Philips, TL841) at a photon flux of 120–140 μmol m−2 s−1. Routine microscopic observations were made by investigation of cell suspensions in 12-multiwell plates at 400× magnification on an Leica DM-IL inverted microscope (Leica, Wetzlar, Germany) and at 1000× magnification using an Olympus CH30standard light microscope (Olympus, Shinjuku City, Japan).

2.2. Media Preparation

“East-side” PW (EaS-PW) was collected from an oilfield PW collection and treatment facility near Edison, California. PW from several small, independent oil leases in the Edison Oil Field is transported to the facility by pipeline and flows into gunite-lined ponds where crude oil is skimmed from the water. PW was collected at the final stage before it is pumped to another facility into unlined sumps and onto irrigation areas. “McFarland” PW (McF-PW) was collected from leases in the Dyer Creek oil field, located approximately 15 miles northeast of Bakersfield, California. The treatment of the water includes the separation of oil by heat treatment after which the remaining PW flows through a series of gravity separators. The water for this project was taken from the last separator before flowing into an unlined pond.
The PW from both oil field sources were stored in tempered, autoclaved polypropylene carboys after filtration with Whatman type 1 filters (11 µm pore size) to remove large insoluble fractions. This filtrate was then used without further modifications like autoclavation or ultrafiltration to allow that the outcomes of subsequent cultivation and chemical analyses (which could be altered by further processing of the PW) represent authentic field settings. Nonetheless, the PW sources were enriched with typical phytoplankton cultivation media enrichments to allow meaningful P. tricornutum growth, needed for PW remediation (see Section 3.4) and for allowing investigation of the impacts of PW constituents on P. tricornutum growth (see Section 3.3). Specifically, the cultivation media were enriched with “F/2” formulations for iron and the major nutrients (without silicate; [48]) and with the enriched artificial seawater (ESAW) enrichment for the trace metals [47]. The experimental condition called “McF/EaS-PW” was prepared by diluting the EaS-PW (at 12 PSU) with McF-PW until reaching a salinity of 5 psu, as measured with a salinity refractometer (RF20, Extech®, Nashua, NH. USA). Synthetic medium for preparation of the control media was made following the standard procedure by Berges et al. (2001) and the reported salinity was achieved by dilution of this synthetic base medium with HPLC grade purified water.

2.3. Salinity and PW Cultivation Experiments

Cultivation was done on an orbital shaker (ca. 200 rpm) in 125 mL Erlenmeyer flasks (Pyrex, No. 4980) with 30 mL cultivation medium. For the salinity experiment, cell inocula originated from stock cultures that had acclimated to the respective salinity medium during three consecutive batch cultivation cycles (trial 1). Cell inocula in the salinity experiment ‘trial 2’ had received three additional batch cultivation cycles during which cells continued to acclimate. The growth rate analysis experiment in response to salinity levels was initiated by a 40-fold dilution of the starter cultures. Afterwards, both strains were maintained in 0, 5 and 12 psu control media by weekly inoculations at a 40-fold dilution of the cell suspension. The PW experiments were initiated three months after the salinity experiments and the cell inocula that were used (for both the controls and PW treatments) originated from the acclimated strains that had been maintained in the ESAW media at 0, 5, or 12 psu. Experimental cultures for testing growth in the PW media (both ‘trial 1’ and ‘trial 2’) were initiated by inoculation with ca. 3 × 10⁴ cells mL−1 as estimated from microscopic cell counts.

2.4. Cellular Growth and Photophysiology Measurements

Cell density estimations were made by performing cell counts of culture aliquots using microscope counting slides (Quick-ReadTM, Globe Scientific Inc., Mahwah, NJ, USA) at 100× magnification using a standard light microscope (CH30, Olympus). Following the manufacturer’s recommendation, cell density estimates for each sample were based on two technical replicate counts that were performed in separate counting wells. During cell counting, qualitative observations of cell morphology and bacterial presence were made. Cellular fluorescence parameters were monitored using Pulsed-Amplitude-Modulation based fluorometry (AquaPen-C 100; Photon Systems Instruments, Drasov, Czech Republic) after 15 min dark incubation of 2 mL cell suspensions. This method yields the cells’ photosynthetic capacity (the quantum yield of Photosystem II) as Fv/Fm and the dark-adapted minimal fluorescence parameter (F0) as a reliable proxy for biomass during the exponential growth phase [49]. Maximum growth rates during batch cultivation were calculated by multiplication of the doubling time k with the natural logarithm of 2, where k was determined by regression of either F0 values or cell density values during the exponential growth phase according to the equation k = log2 (Nt/N0)/Δt [50]. For each condition, the phase of exponential cell proliferation was determined from the Log2-transformed growth curves.

2.5. Neutral Lipid Content Measurements

Intracellular neutral lipid content was estimated by the staining of cells with Nile Red (NR, Sigma-Aldrich). The NR stain forms a fluorescent complex with cytoplasmic oil bodies and quantification of this fluorescence is a proxy for neutral lipids in various unicellular organisms, including P. tricornutum [51]. Our method was developed by modification of the procedure from Sitepu et al. [52]. Briefly, 1.8 mL cell suspensions were sampled from each culture, pelleted by centrifugation to remove the supernatant cultivation medium (5000× g, 6 min), and resuspended in corresponding fresh medium that contained 10% (v/v) DMSO and 4 μg mL−1 Nile Red from a 0.5 mg mL−1 working stock (parent stock was made at 1 mg NR mL−1 acetone).
Because fluorescence-based cell assays are sensitive to cell density effects (i.e., a limitation of sensitivity at the low densities and a saturation and/or shading at high densities), the volume added for resuspension of the cell pellets was varied based on the cell counts in each culture at the time of sampling so that consistent cell densities were achieved that ranged between 5 × 10⁶ cell mL−1 and 30 × 106 cells mL−1. Immediately afterwards, the centrifuge tubes were mixed by inversion and three 200 μL aliquots were transferred to black, clear-bottom 96-well plates to serve as technical replicate reads for the calculation of an average value per sample. The plates were read in a fluorescence plate reader (Flx-800, BioTek Instruments, Winooski, UT, USA) using the bottom probes with appropriate filters for NR fluorescence detection (Ex: 525/30 nm; Em: 671/20 nm). Plates were scanned every minute for 30 min to identify the maximum fluorescence in each well. The background fluorescence, determined from a mock NR-stained medium sample (no cells), was subtracted from this value.

2.6. Chemical Analyses of McF-PW, EaS-PW, and Spent EaS-PW Medium

Water quality parameters for assessment of oil field PW were measured and reported by Zalco Laboratories Inc. (Bakersfield, CA). Methods used were: Alkalinity (“2320 Alkalinity” (2017), Standard Methods For the Examination of Water and Wastewater); Fluoride, Nitrate, Nitrite, Chloride, Sulfate (“EPA 300.0—Determination of inorganic anions by ion chromatography” (1993), U.S. Environmental Protection Agency); Sulfide, Total Nitrogen, Phosphate as PO43− (respectively: “4500-S.F.”, “4500-N.C.”, “4500-P.E.” (2017), Standard Methods For the Examination of Water and Wastewater); Total dissolved solids (“2540-C” (2018), Standard Methods For the Examination of Water and Wastewater); Electrical conductivity (“2510-B” (2017), Standard Methods For the Examination of Water and Wastewater); Magnesium, Potassium, Sodium, Calcium, Iron, Boron, Barium, Copper, Silicon as SiO2 (silica), Strontium (“EPA 200.7 Determination of Metals and Trace Elements in Water and Wastes by Inductively Coupled Plasma-Atomic Emission Spectrometry” (1994), U.S. Environmental Protection Agency); Petroleum Hydrocarbons (“SW-846 Hazardous Waste Test Method 8015B”, U.S. Environmental Protection Agency). The percentage relative change (RC) in analyte quantities before and after cultivation was calculated as:
RC = 100 × ( EaS _ PW   after   EaS _ PW   before )   ÷   EaS _ PW   before .
Because samples for chemical characterization were taken from the PW source before using them for media preparation, and thus did not include the reported medium enrichments, we calculated the RC based on the estimated analyte concentrations after enrichment. Supplementary Table S1 shows the calculations of these estimated concentrations based on the used enrichment formulations. Characterization of the spent EaS-PW cultivation medium was done after removal of the P. tricornutum biomass by vacuum filtration on Grade A Borosilicate Glass Microfiber filters (Sterlitech, Auburn, AL, USA). These filters have a with a nominal pore size of 1.6 µm, thereby allowing retention of P. tricornutum cells while allowing passage of possible bacterial cells into the filtrate.

2.7. Statistical Analyses

Statistical analysis was performed using Prism 9.0.0 (GraphPad Software). Normality of data was tested with the D’Agostino-Pearson “omnibus K2” normality test. Based on this, two-way ANOVA tests were performed on raw values (cell yields) or Log2-transformed values (NR fluorescence, and growth rates) to satisfy the assumptions of the statistical model. Model factors in the salinity experiments were ‘Strain’ (Pt1, and Pt4) and ‘Salinity’ (5, 10, 15, 25, 31 psu), and in the PW experiments were ‘Treatment’ (PW, and control) and ‘Salinity’ (0, 5, 12 psu). Post hoc multiple comparisons of the dependent variable were made between groups as mentioned, and with Bonferroni’s correction for calculation of adjusted p-values.

3. Results

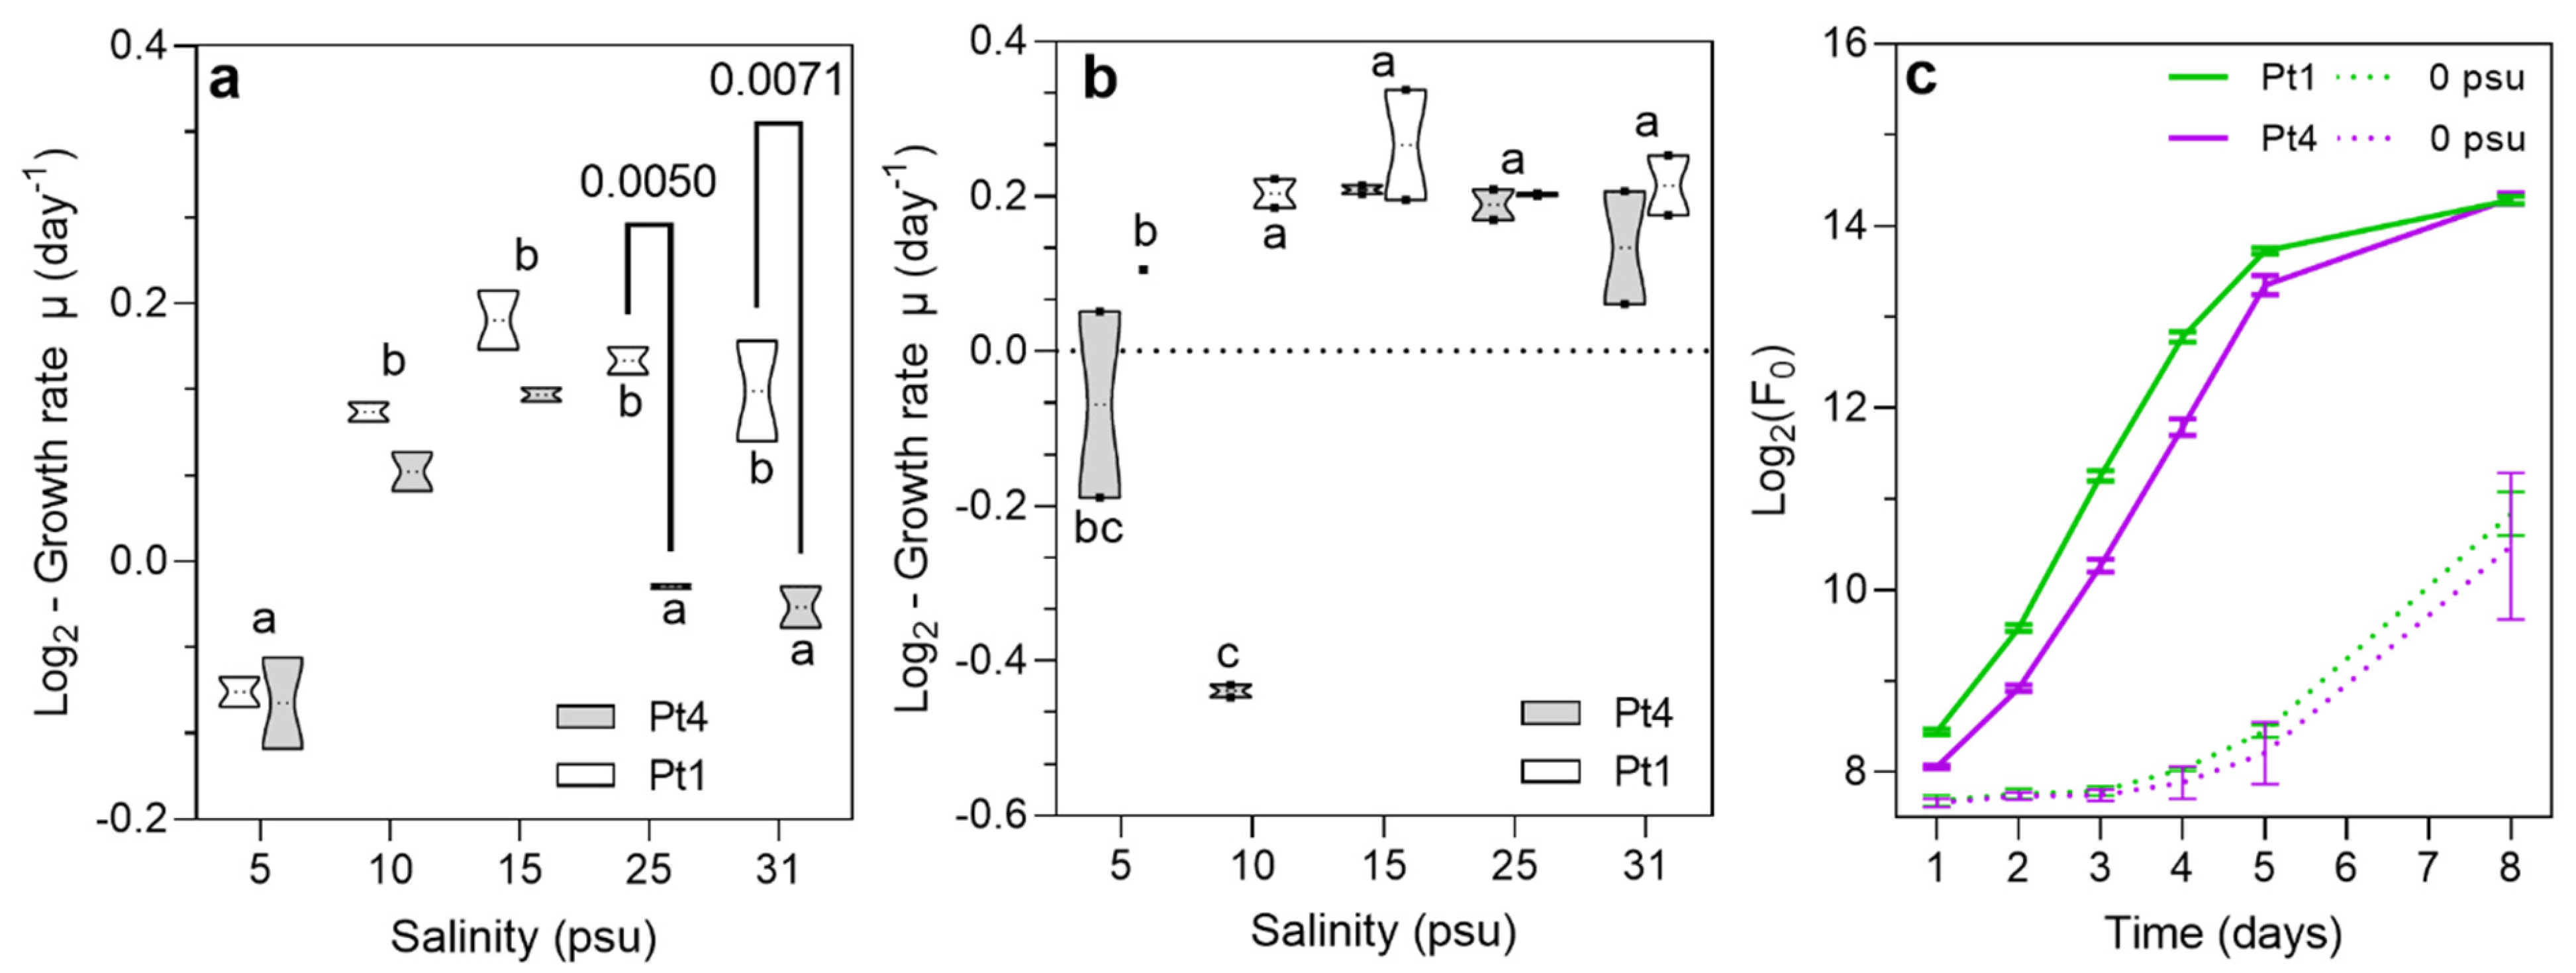
3.1. Growth Comparison of Phaeodactylum tricornutum Strains Pt1 and Pt4 at Various Salinities

A growth comparison of the P. tricornutum strains CCAP1055/1 (Pt1) and CCAP1052/6 (Pt4) was conducted to assess variation in their capacity to grow and acclimate to media with varying salinities (Figure 1). In the first experimental run (trial 1), initiated after only a three batch cultivation cycles at the respective salinities (see Section 2), Pt4 grew significantly faster in 10 and 15 psu media than in 5, 25 and 31 psu media, but differences in growth rate between the strains were not significant (Figure 1a). In trial 2, initiated after three additional acclimation cycles at the same conditions, the growth rate differences at 25 and 31 psu disappeared (Figure 1b).
For the freshwater condition (0 psu), both strains exhibited an extended lag phase during days 1–5 in both trial 1 and trial 2 (Figure 1b). This indicated that cultures were likely not fully acclimated to this freshwater condition during the provided six growth cycles (see Section 2) and made it impossible to calculate growth rates for this condition. Given the absence of significantly higher growth rates in Pt4, and an apparent broader optimal salinity range for Pt1, we selected Pt1 for subsequent experiments.

3.2. Chemical Characterization of Two Oil Field Produced Water Sources

We physicochemically characterized oilfield PW from two locations in California’s San Joaquin Valley. One PW source originated from oil fields near Edison, California, which we called “East-side” PW (EaS-PW), and the other PW source originated from oil fields near McFarland, California, which we designated “McF-PW”. Quantities of analytes for the PW sources, as they were collected, are shown in Table 1.
With 12,600 mg/L total dissolved solids (TDS), the EaS-PW had a much lower quality than the McF-PW (1160 mg/L TDS). The higher TDS value of the EaS-PW was reflected by the higher salinity (12 psu vs. 0 psu) and electrical conductivity (20 mmhos/cm vs. 1.8 mmhos/cm), as well as higher levels of nearly all tested chemical analytes. Mainly, EaS-PW contained higher levels of sodium (Na; 4400 mg/L vs. 380 mg/L), chloride (Cl; 7100 mg/L vs. 440 mg/L), potassium (K; 65 mg/L vs. 5.1 mg/L), calcium (Ca; 34 mg/L vs. 19 mg/L), boron (B; 34 mg/L vs. 1.6 mg/L), and magnesium (Mg; 54 mg/L vs. 0.43 mg/L). At lower concentrations, the EaS-PW contained more fluorine (F; 4.6 mg/L vs. 0.77 mg/L), and strontium (Sr; 2.8 mg vs. 0.33 mg/L). Barium (Ba) and copper (Cu) occurred at trace levels (0.96 mg/L and 0.061 mg/L, respectively) in EaS-PW, and were not detected in McF-PW. The macronutrients nitrate (NO3), phosphate (PO43−) and silica (SiO2) were detected at high levels in EaS-PW, but not in McF-PW. Sulfate (SO4), a much less studied nutrient for diatoms [53], was present at higher levels in EaS-PW, but was also present in McF-PW (390 mg/L vs. 180 mg/L). The alkalinity, i.e., the sum of bicarbonate (HCO3), carbonate (CO32−) and hydroxide (OH) concentrations, was ca. 6-fold higher in EaS-PW (630 mg/L vs. 100 mg/L) and this seemed to result mainly from higher HCO3 (490 mg/L vs. 100 mg/L) and CO32− (140 mg/L vs. 0 mg/L) concentrations. This was also in line with the higher pH value of EaS-PW (8.56 pH units vs. 7.9 pH units). Finally, the chemical analysis showed higher levels of total hydrocarbon contamination in EaS-PW (1.13 mg/L vs. 6.69 mg/L). The main fraction existed as C28–35 hydrocarbons (4.1 mg/L vs. 1.13 mg/L), followed by C10–28 hydrocarbons (2.59 mg/L vs. <0.05 mg/L), while shorter C6–10 hydrocarbons were not detected in either PW source.

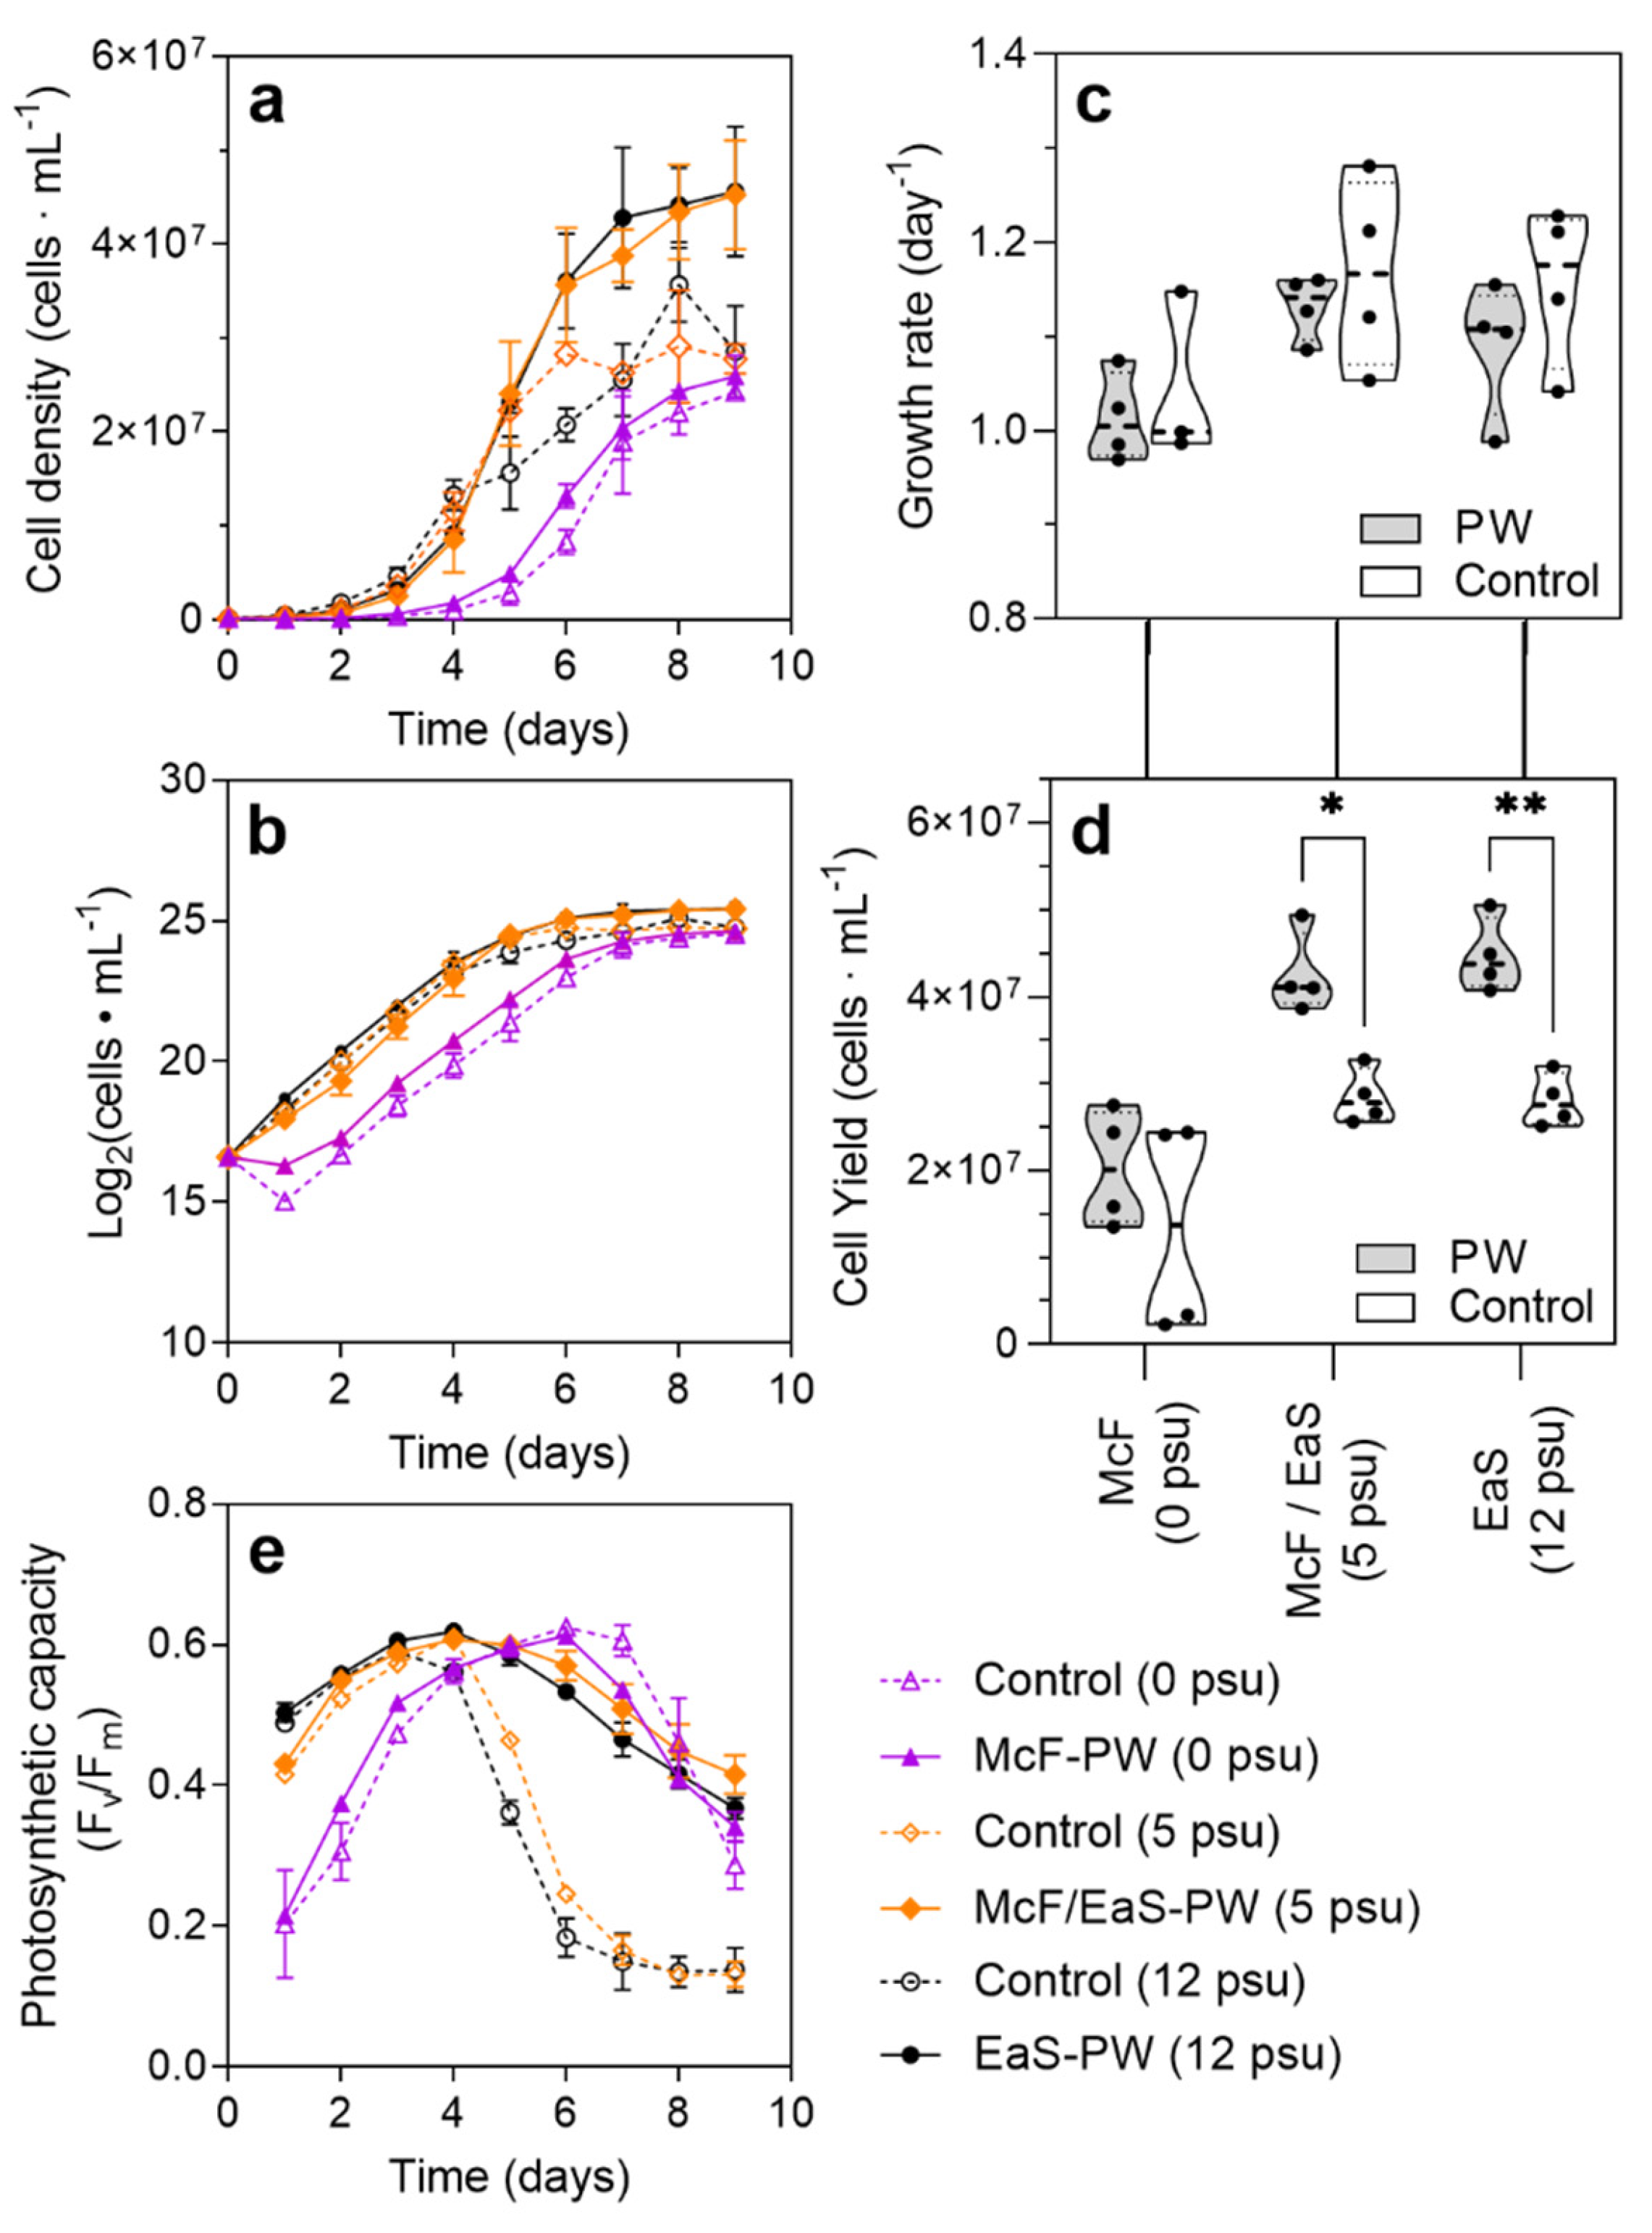
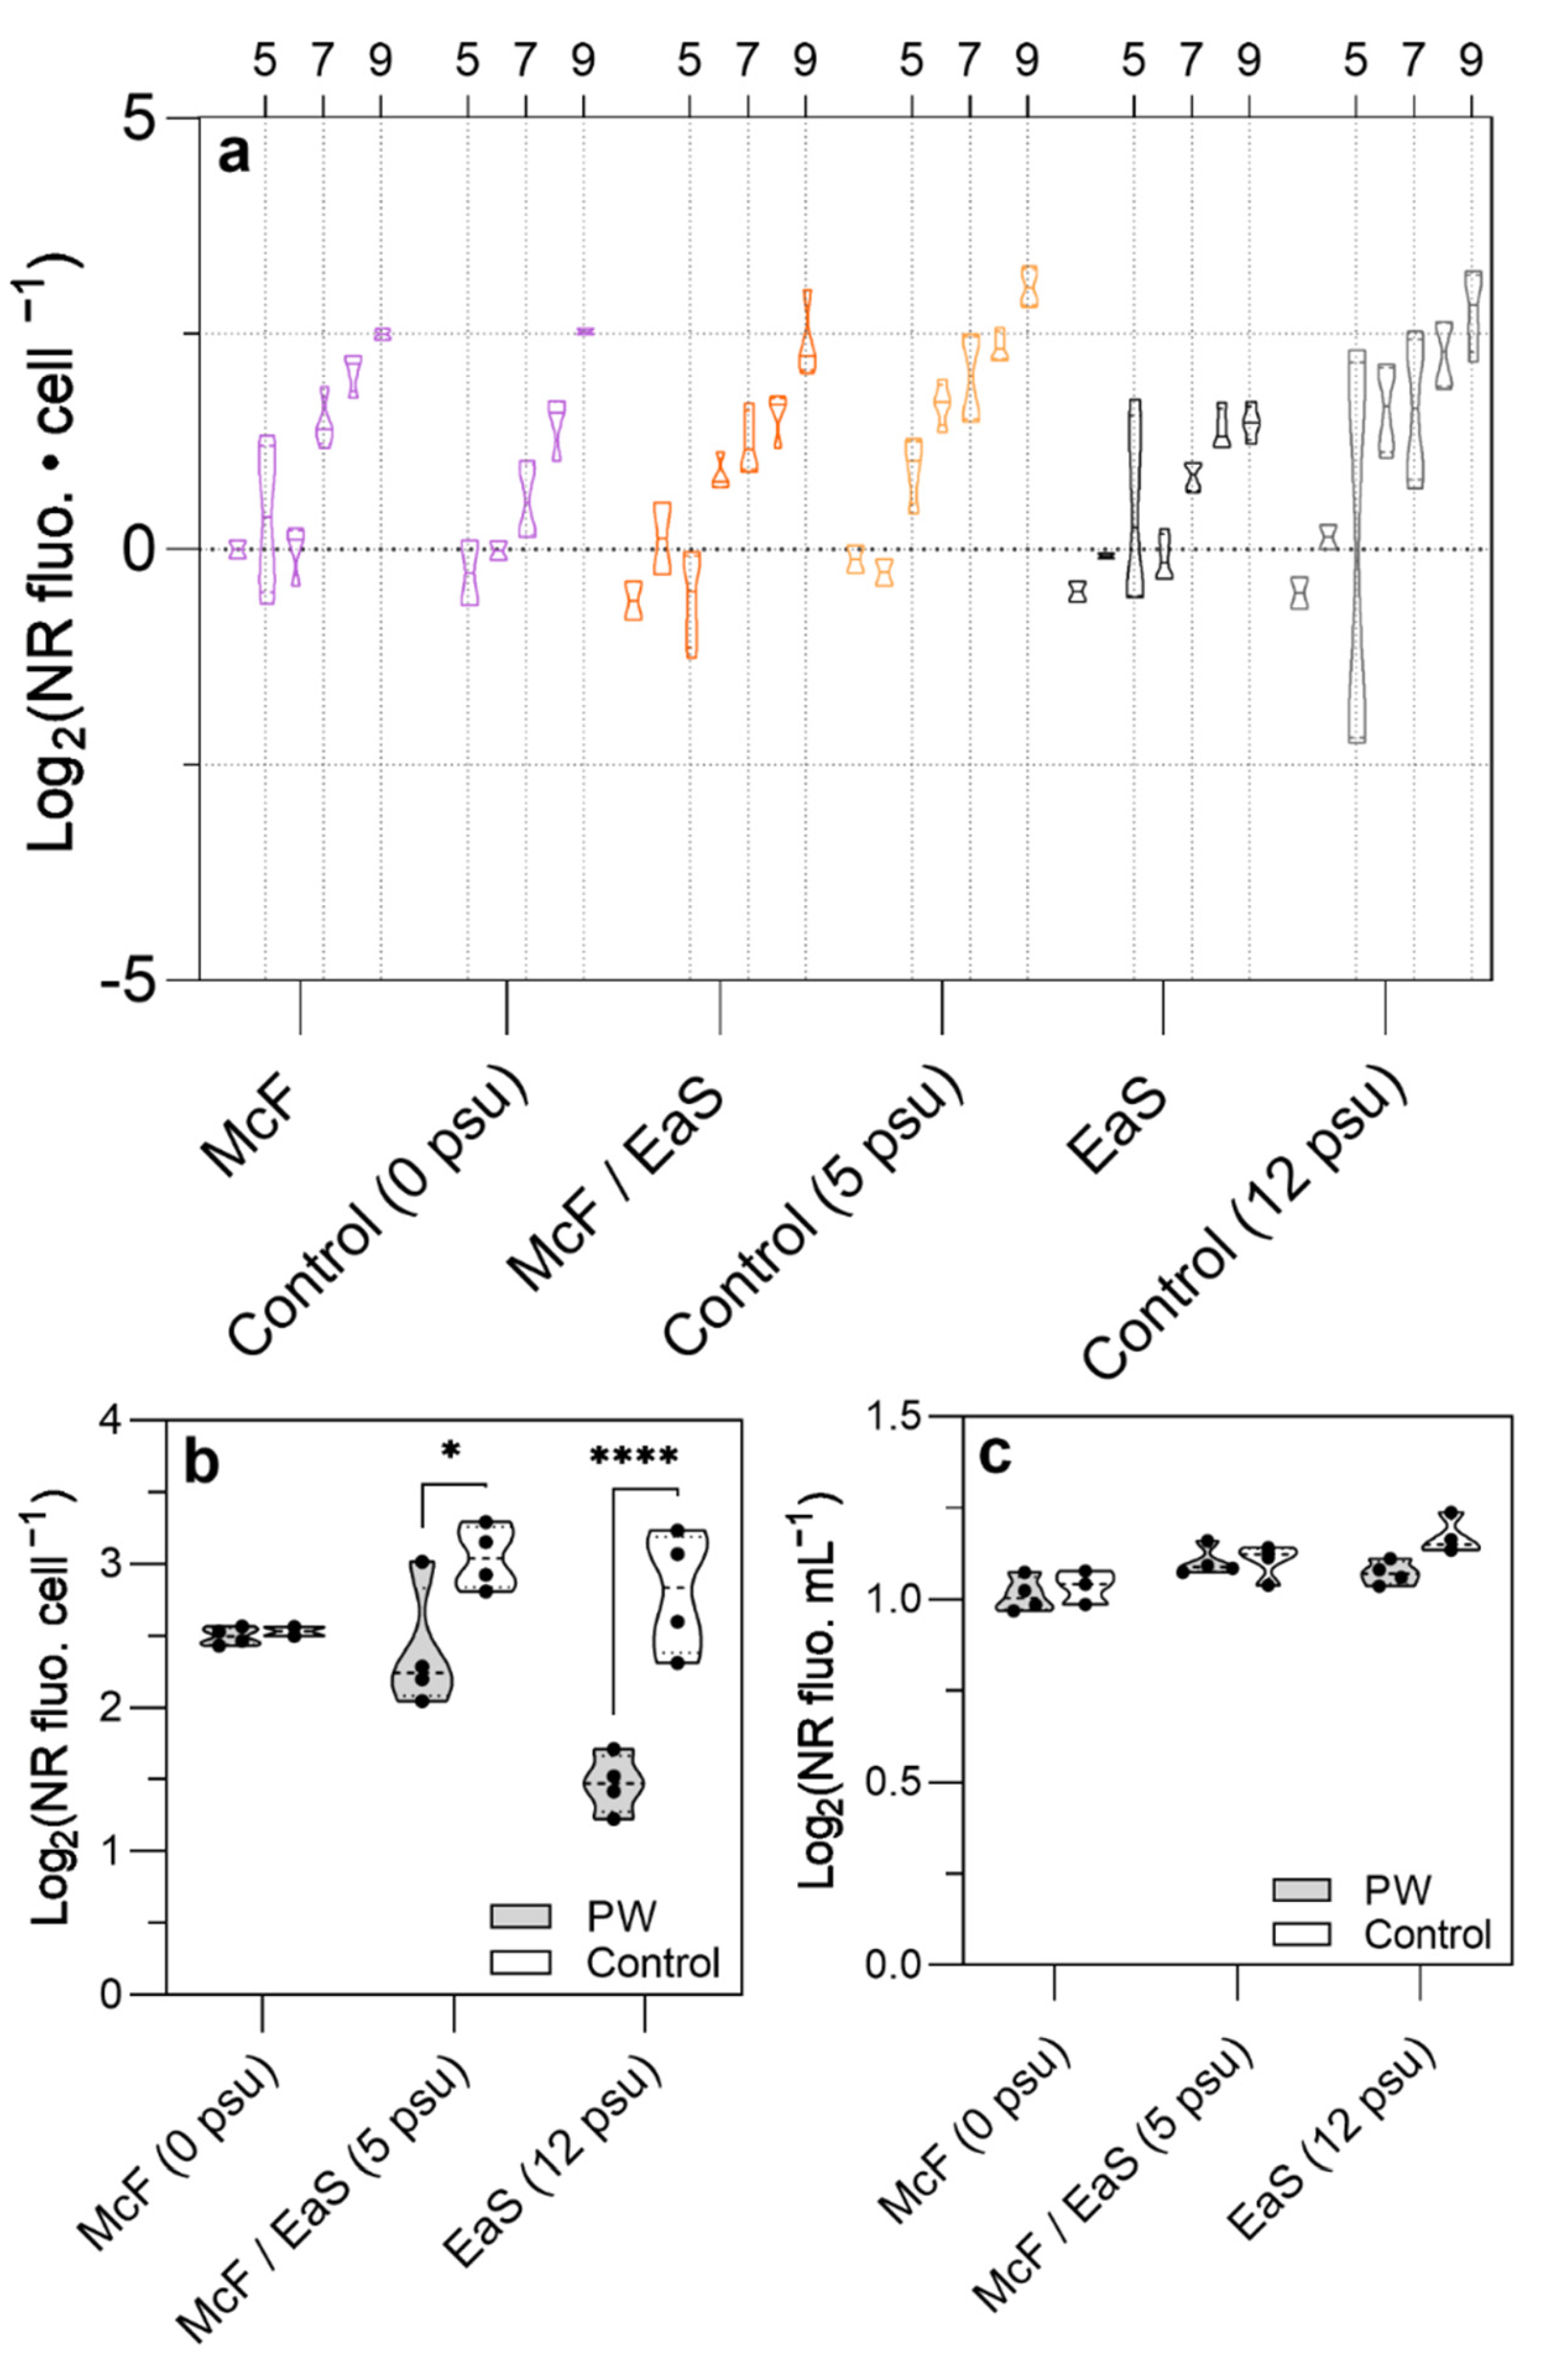
3.3. Growth Characterization and Lipid Accumulation of Pt1 in Three Distinct PW Media Formulations

To assess the impact of PW on P. tricornutum growth and physiology, PW media were prepared from the characterized PW sources by enriching them with nutrients typically used for creation of synthetic seawater media, and the same additions were used for the preparation of the synthetic control media at the corresponding salinities. Three media types were compared: McF-PW (0 psu), EaS-PW (12 psu) and McF/EaS-PW, a mixture of both PW-media at intermediate salinity (5 psu). Four replicate sets of cultures were monitored, with cultivation carried out in two runs (trial 1, trial 2), each lasting 9 days. These cultures were initiated with inocula from salinity-acclimated stock cultures that had acclimated for an additional 3 months after the earlier salinity experiments shown in Figure 1 (see Section 2). Cell densities, photosynthetic capacities and cellular lipid accumulation were determined each day. In addition, qualitative microscopic observations were made while performing cell counts to assess bacterial growth and cell morphology.
Growth curves showed that cells in most conditions immediately resumed division upon re-inoculation in their respective medium (Figure 2a,b). Only the McF-PW cultures and their 0 psu controls showed a prolonged lag-phase compared to cultures at higher salinities. However, the lag-phase was shorter than in the earlier salinity experiments (2 days vs. 5 days; compare Figure 1c and Figure 2b) indicating that the cell population was able to adjust to the 0 psu medium during the 3 months between both trials. Comparison of growth rates (Figure 2c) showed no significant difference between the treatment and control at each salinity level, thereby indicating that cells were successfully coping with the oilfield PW constituents. Furthermore, comparison of cell yields (Figure 2d) showed that both EaS-PW and McF/EaS-PW cultures had significantly higher carrying capacities compared to their controls, with a mean cell density increase of 159% (i.e., 1.67 × 10⁶ additional cells ± 643,447 SE) and 149% (i.e., 1.41 × 10⁶ additional cells ± 3,033,021 SE), respectively. Interestingly, these cell yield increases coincided with higher photosynthetic capacities during the late-exponential and stationary growth phases (Figure 2e): whereas the Fv/Fm values of the control cultures and the McF-PW cultures, experienced drastic drops after reaching their maximum values (i.e., day 5 for the 5 and 12 psu conditions, and day 8 for the 0 psu conditions) the Fv/Fm values decreased at a slower rate in the cultures that contained EaS-PW (i.e., both EaS-PW and McF/EaS-PW cultures). Thus, these result point at the EaS-PW source as the main reason for the improved growth in the EaS-PW containing media We also made qualitative microscopic observations during the cultivation experiments which indicated increased occurrence of oval cell morphologies and cell clustering in the McF-PW cultures only. Furthermore, no bacterial overgrowth was observed in any of the cultures.
Nile Red (NR)-based estimations showed lipid content per cell increased during cultivation in all conditions, reaching maximum values on day 9 (Figure 3a). A two-way ANOVA test of log-normalized values on day 9 detected lower yields in the McF/EaS-PW and the EaS-PW treatment compared to their controls (p-value = 0.017, p-value < 0.0001, respectively; Figure 3b). However, this difference disappeared when comparing the lipid content per culture volume (Figure 3c).

3.4. Characterization of the EaS-PW Medium after P. tricornutum Cultivation

To gain further insight into the limiting growth factors of the EaS-PW media, as well as to assess the remediation capacity of P. tricornutum cultures, we chemically analyzed the spent cultivation media of stationary-phase EaS-PW cultures with the same analytical methods as before. These results were used to calculate the relative change (RC) in the concentration of each analyte (Table 1; “EaS-PW medium after” and “Relative Change” column).
Foremost, while EaS-PW contained higher levels of HCO3 (which is essential for photosynthetic carbon fixation) its presence was not detected in the spent medium. This indicated that the uptake of HCO3 outpaced the dissolution of atmospheric CO2, an observation that was also reflected by the pH increase and the associated increase in bio-unavailable CO32−. Cultivation also led to a significant reduction, but not exhaustion, of the major nutrients NO3 and PO43− (92% and 76% RC, respectively). According to other studies, the remaining levels of NO3 and PO43− (90 μM, and 20 μM, respectively) are well above the level at which cells can continue importing these compounds [54,55]. Interestingly, silicon (Si), the main component of the diatom cell wall in most species, but only facultatively required by P. tricornutum [56,57], decreased with 60%. Other inorganic EaS-PW constituents that were significantly reduced by P. tricornutum cultivation were Fe (85% RC), F (72% RC), Mg (56% RC), SO42− (21% RC), and Cu (18% RC). Inorganic analytes that remained largely unchanged were B, Ba, Ca, Cl, K, and Na. Finally, surprisingly, we measured an increase in C10–28 and C28–35 hydrocarbon fractions after P. tricornutum cultivation.

4. Discussion

4.1. Acclimation and Adaptation of Phaeodactylum tricornutum to Variation in Salinity

From results of trial 1 of the salinity experiment, it appears that the optimal salinity of Pt4 ranged around 10–15 psu, while Pt1 showed a salinity tolerance across the 10–31 psu range. This higher growth rate of Pt1 at 25 and 31 psu is in accordance with the higher salinity level at its origin of isolation (Irish Sea, 30 psu) compared to that of Pt4 (Baltic Sea; ca. 6 psu). However, we had hypothesized that the habitat of Pt4, i.e., a supralittoral rock pool, would have acted as selective pressure on this strain to equip it with a higher tolerance to variation in salinity common to these complex habitats [58,59]. While the improved growth of Pt4 at the 25 and 31 psu condition after additional cultivation cycles at these salinities does indicate that this strain has a high capacity to acclimate to variation in salinity, its comparable growth rates after acclimation did not support superiority of Pt4 for growth in PW sources of variable salinity. Of relevance here is a recent study that showed a distinct pattern of nucleotide polymorphisms in Pt1, setting it apart from the other P. tricornutum strains [46]. While this indicated that Pt4 did indeed experience a stronger past selective pressure compared to other accessions, the functional analysis of the affected gene groups pointed at main effects from variation in light intensity and nitrate availability, instead of variations in salinity. Given these considerations, and our results, we can thus not support the hypothesis that Pt4 is better adapted for growth at the variable salinity levels that characterize PW sources.
While acclimation is the physiological adjustment of an organism to its environmental conditions, adaptation is a longer-term evolutionary process that involves changes to the species’ genome sequence followed by selection. While both strains did not successfully acclimate to the freshwater condition (0 psu) within the six provided batch cultivation cycles, the Pt1 strain adjusted successfully to conditions after three additional months of cultivation in the 0 psu control medium (Figure 2). The longer time scales needed for improvement of growth in the freshwater condition indicates the Pt1 strain relied on genetic adaptation instead of physiological acclimation [60]. At first sight, given that P. tricornutum is a non-sexual species, it is surprising that genetic adaptation would have occurred so rapidly. Recently, however, it was shown that under stressful conditions, P. tricornutum executes mitotic homologous recombination events between homologous chromosomes at a rate more than 10 times higher than that of the yeast S. cerevisiae [61]. The authors of that study suggest that this process underlies the phenotypic plasticity that led to its adaptation to stressful conditions, even in monoclonal strains after just one month of exposure to the stressor. Based on this information, we consider it very likely that homologous recombination events were responsible for the observed adaptation of the strains to the 0 psu and the McF-PW conditions. Together, these results show that prolonged cultivation of P. tricornutum might be a strategic approach to optimize its performance in the specific conditions pertaining to economic mass cultivation in wastewater sources, including oilfield PW.

4.2. Cultivation of P. tricornutum in Oilfield PW

While the carrying capacity of McF-PW medium trended lower compared to that of the media at higher salinity, statistical comparisons showed that this medium performed equally well compared to its control. Furthermore, P. tricornutum growth rates were also not significantly different in this condition, meaning that cells were successfully coping with the constituents of the McF-PW source. In contrast, the carrying capacities of the two media types prepared with the EaS-PW source were significantly elevated compared to their control medium. Because nutrient depletion typically constrains cell yield during diatom batch cultivation (as opposed to light or space limitation), these results suggest that P. tricornutum acquired nutrients from the EaS-PW source. Chemical analyses showed that there was a substantial amount of nitrate (NO3) present in the EaS-PW source. NO3 is the main source for N assimilation in diatoms and its depletion is well-known to lead to decreases in photosynthetic capacity, similar to those observed in the control media [62]. We, therefore, suggest that the surplus NO3 in EaS-PW, which still was not fully depleted in the stationary phase, allowed cellular maintenance of the photosynthetic machinery for a longer time, thereby stimulating additional cell divisions, and yielding higher cell densities the EaS-PW cultures compared to the control cultures. Furthermore, given the absence of bioavailable bicarbonate (HCO3) from the spent EaS-PW medium, the higher cell densities, in turn, appear to have shifted the culture to a C-limited state as opposed to a N-limited state. While HCO3- is needed for photosynthetic carbon fixation, it is known not to lead to severe impact P. tricornutum’s photosynthetic capacity [63,64]. As such the higher observed Fv/Fm values are in line with our interpretation for HCO3 limitation in EaS-PW cultures. It should be noted that EaS-PW cultures were also possibly experiencing a slight co-limitation by iron (Fe) given its low concentration in the spent medium (i.e., below the practical detection limit of 0.1 mg/L) but severe Fe limitation can again be excluded (similar to N limitation) based on the observed high photosynthetic capacities in the stationary phase of these cultures [65].
NO3 is one of the main nutrients that regulates lipid metabolism in diatoms; when the medium is depleted of these nitrogen compounds, the cells initiate proteins degradation (mainly photosynthetic light harvesting complex proteins) while storing excess carbon in the form of lipids. Then, when nitrogen becomes available again, these lipids can generate energy needed in these photosynthetic impoverished cells to restore growth [66,67,68,69,70]. Likely because of this phenomenon, together with the fact that NO3 is progressively depleted during batch cultivation, cellular lipid content measurements showed a progressive increase in the cellular lipid pool (Figure 3a).
On the final day of cultivation (day 9), cells in McF/EaS-PW and EaS-PW cultures appeared to have accumulated significantly less lipid per cell. These lower levels of cellular lipid accumulation are not surprising since these cultures contained additional NO3, which counteracts lipid synthesis as explained above. In addition, the absence of CO2 in these cultures prohibits the synthesis of the fatty acid precursor Acetyl-coA through carbon fixation [33]. This suggests that higher cellular lipid yields in the EaS-PW medium could likely be achieved by bubbling cultures with CO2 or atmospheric air, thereby shifting cells to a N-limited state instead of a C-limited state.
Interestingly, however, compared to the lipid content per unit of cell, the lipid yield per unit of culture volume was similar between the EaS-PW-containing cultures and their controls (Figure 3c). This means that the higher cell yields in these cultures offset the cell’s limited capacity for lipid accumulation. Thus, while the oilfield PW did not improve lipid yield per cell, it did allow for comparable amounts of lipids to be produced in both cultures.. Because the NR cell assay is an approximate method for lipid quantification, future experiments using more precise analytical methods would be helpful to validate these insights.
Together, our analysis shows that diatom cultivation in PW media can achieve substantial biomass that can be used for downstream processing. Nevertheless, its downstream applicability may be limited to certain purposes. For example, while it might be suitable for biofuel production, the specific contaminants of the oilfield PW could pose health or environmental risks that make it unsuitable as a nutritional feedstock in, e.g., the aquaculture industry. Thus, it should be noted that from this perspective, the downstream purpose of the biomass for certain oil field PW sources could be inversely related to the bioremediation efficiency discussed in Section 4.3.

4.3. Remediation of Oilfield PW by P. tricornutum Cultivation

There was a partial remediation of the EaS-PW by the cultivation of P. tricornutum. Foremost, the major nutrients NO3 and PO43− were drastically reduced, as is expected from cellular assimilation of these nutrients for the synthesis of protein and nucleic acid macromolecules. To drive these anabolic pathways, the cell needs an adequate supply of HCO3 for photosynthetic carbon fixation. While this HCO3 originates from the dissolution of CO2 into the water, removal of the surplus of HCO3 that was already present in the EaS-PW shows that this was also utilized for growth by P. tricornutum, and it demonstrates the capacity of microalgal cultivation to aid in atmospheric carbon sequestration. To accommodate this photosynthetic process, microalgae rely heavily on Fe, a main component of the photosynthetic apparatus. The significant removal of Fe (85% RC) from the EaS-PW medium is thus in line with the exceptional growth of P. tricornutum in this medium. Furthermore, partial removal of SO42− from the medium was also achieved. Diatoms assimilate SO42− by reducing it to the amino acid cysteine [53]. Sulfate is the oxidation product of sulfur, and while it is usually harmless to the environment, it can be converted to more environmentally harmful forms [71]. The 21% RC of SO42− thus shows that diatoms can also contribute to the remediation of this nutrient.
We found a significant reduction in the concentration of silicate (SiO2; 60% RC) after cultivation. SiO2 sequestration by diatoms commonly happens as a means to synthesize their Si-based cell walls (frustules). However, in the case of P. tricornutum, only one of the morphotypes, i.e., the oval morphotype, uses SiO2 when it is available in the medium; The other morphotypes consist of purely organic frustules, even in the presence of SiO2 [57]. The significant reduction in SiO2 thus indicates that the EaS-PW might have stimulated transformation of P. tricornutum into the oval morphotype type. Indeed, this has already been shown to happen in stressful conditions such as during changes in salinity levels [56]. In addition, as an alternative explanation for the reduction of SiO2, it is also possible that the organic fractions of the P. tricornutum frustule in the non-silicified cells adsorbed some of the SiO2 [10]. Future quantification of cell morphotypes during cultivation in PW will help to shed a more complete picture on the mechanism of SiO2 removal and the value of morphotype transformations in the bioremediation by P. tricornutum [72,73].
P. tricornutum cultivation also led to reduced amounts of some elements that occurred at trace levels in the EaS-PW medium. Fluorine content was significantly reduced (72% RC: from 4.6 mg/L to 1.3 mg/L). A common form of fluorine in water is the fluoride ion F. F has several molecular targets that can impact cellular respiration and photosynthesis [74,75], as well as be detrimental to human health [76]. The WHO limit on concentration of F in drinking water is 1.5 mg/L [77] and, depending on the ordinance levels, 1–2 mg/L are recommended for long-term soil irrigation [78]. At the same time, several phytoplankton species exhibit dose-dependent growth stimulation by F (by as yet unknown mechanisms), even at concentrations well above those in the PW media (e.g., up to 200 mg L−1 in the diatom Chaetoceros gracilis) [79]. The successful remediation of F by P. tricornutum cultivation, to levels surpassing, or close to, the legal thresholds, indicates a similar resistance of P. tricornutum to F and points at a capacity for cellular F uptake, or an adsorption to its frustules.
For copper (Cu), toxicity has been reported in microalgae and P. tricornutum at free Cu2+ ion concentrations 10-times below the measured elemental concentration present in the EaS-PW medium (i.e., LC50 ~ 0.006 mg L−1) [80,81,82]. However, P. tricornutum cultures that were grown in the presence of high levels SiO2, such as those present in the EaS-PW medium, have been shown to exhibit greater Cu adsorption and associated resistance [73]. It is thus possible that this, together with chelation of Cu2+ ions by other PW constituents, has likely contributed to the absence of any observable PW toxicity and the concomitant reduction (18% RC) in Cu concentration after P. tricornutum cultivation.
Additionally, magnesium (Mg) concentrations were significantly reduced (56% RC), but this is less essential from an environmental protection standpoint since there are no toxicity concerns for this element. Mg is the central atom that chelates chlorophyll molecules composing the light-harvesting complexes of the chloroplast membranes. In addition, it is also a common cofactor of ATP-driven enzymatic reactions. Therefore, reduction in Mg concentration could be explained by biomass-driven sequestration.
With respect to the metalloid boron (B), while some diatoms have been reported to require B for growth [83], the finding that P. tricornutum only requires B in the absence of other trace metals [84] (which was not the case) could explain why the B concentrations remained largely unchanged.
The concentrations of various remaining analytes did not change substantially (i.e., <10% RC for Ba, Ca, Cl, K). This could mean that, while some of these elements are common solutes of the diatom cytoplasm, their removal from the PW closely matched the removal by volume that was taken up by the wet diatom biomass, as this would not result in major concentration differences in the spent medium. In contrast, the substantial reduction in the PW constituents described above results from cellular sequestration in excess of the volume that was removed upon filtration. This explanation is in line with the observation of phytoremediation in plants where some species are geared towards preferential sequestration of specific components [85,86].
Finally, the higher concentration of hydrocarbons after cultivation can be attributed to the escape of lipids synthesized by P. tricornutum. This could happen naturally during the stationary growth phase when cell membranes lose integrity in advance of cell death [87]. Alternatively, while frequent microscopic observations during cultivation did not show any obvious bacterial growth in any of the media, including the EaS-PW spent medium, we judge it possible that the higher hydrocarbon values originated from a marginal growth of bacteria that were originally present in the EaS-PW source, fed on P. tricornutum photosynthate, before being passed into the collected spent medium during the separation of P. tricornutum biomass on the used glass microfiber filters, which had a nominal pore size of 1.6 µm. The fact that only the longer hydrocarbon species (C10–C35) were elevated after cultivation is in line with such biogenic origin since these hydrocarbons typically represent a larger fraction of diatom and bacterial lipid content [88,89]. Importantly, however, we would like to note that this filtration strategy (desirably) precluded attribution of the remediation of inorganic constituents to bacterial populations, thus pointing at a chief role of P. tricornutum in this process.

5. Conclusions

This study highlights the potential use oil field produced water (PW) for the photosynthetic generation of oleaginous biomass through cultivation of the model diatom species Phaeodactylum tricornutum. Our results indicate that the nutrients present in this wastewater source can increase the cell yields of cultivation, pushing the lipid production capacity of these cultures to similar levels compared to those grown in pure-water media. At the same time, chemical analyses show that P. tricornutum growth can make improvements in the water quality by removal of major nutrients and potentially harmful elements. Cultivation experiments further show that P. tricornutum strains successfully adapt to these low-salinity media over the course of several months. This result is in alignment with a recent study by Bulankova et al. (2021) showing the exceptional ability of P. tricornutum to adapt to stressful environments through genomic evolution. Together this study raises questions about the gene repertoires underlying P. tricornutum’s capacity to grow on oil field PW and its bioremediation of elements like fluorine and copper. Such follow-up studies could provide the essential know-how for the generation of genetically modified strains that can be used for future economic production of biomass using oil field PW sources.

Supplementary Materials

The following are available online at https://www.mdpi.com/article/10.3390/w13192700/s1, Supplementary File S1: raw data of salinity experiments and PW experiments; Supplementary Table S1: Calculations of the analyte quantities added in EaS-PW during nutrient enrichment.

Author Contributions

Conceptualization, J.T.F.G. and L.C.; methodology, J.T.F.G.; validation, J.T.F.G.; formal analysis, J.T.F.G.; investigation, J.T.F.G., A.L.H. and J.A.C.; resources, J.T.F.G. and L.C.; data curation, J.T.F.G.; writing—original draft preparation, J.T.F.G.; writing—review and editing, J.T.F.G., I.M.F. and L.C.; visualization, J.T.F.G.; supervision, J.T.F.G.; project administration, J.T.F.G.; funding acquisition, J.T.F.G. and I.M.F. All authors have read and agreed to the published version of the manuscript.

Funding

This research was funded by the United States Department of Agriculture (USDA) National Institute of Food and Agriculture (NIFA), Award number 2018-70001-27831, the California State University (CSU) Water Resources & Policy Initiative (WRPI), and the Research Council of the University (RCU) of CSU Bakersfield.

Institutional Review Board Statement

Not applicable.

Informed Consent Statement

Not applicable.

Data Availability Statement

Not applicable.

Conflicts of Interest

The authors declare no conflict of interest. The funders had no role in the design of the study; in the collection, analyses, or interpretation of data; in the writing of the manuscript, or in the decision to publish the results.

References

  1. Guerra, K. Bureau of Reclamation, Oil and Gas Produced Water Management and Beneficial Use in the Western United States; Dundorf, S., Ed.; U.S. Department of the Interior Bureau of Reclamation: Denver, CO, USA, 2011. [Google Scholar]
  2. Scanlon, B.R.; Reedy, R.C.; Xu, P.; Engle, M.; Nicot, J.; Yoxtheimer, D.; Yang, Q.; Ikonnikova, S. Can we beneficially reuse produced water from oil and gas extraction in the U.S.? Sci. Total Environ. 2020, 717, 137085. [Google Scholar] [CrossRef]
  3. Al-Ghouti, M.A.; Al-Kaabi, M.A.; Ashfaq, M.Y.; Da’Na, D.A. Produced water characteristics, treatment and reuse: A review. J. Water Process. Eng. 2019, 28, 222–239. [Google Scholar] [CrossRef]
  4. Murray-Gulde, C.; E Heatley, J.; Karanfil, T.; Rodgers, J.H.; E Myers, J. Performance of a hybrid reverse osmosis-constructed wetland treatment system for brackish oil field produced water. Water Res. 2003, 37, 705–713. [Google Scholar] [CrossRef]
  5. Mills, M.A.; Bonner, J.S.; McDonald, T.J.; Page, C.A.; Autenrieth, R.L. Intrinsic bioremediation of a petroleum-impacted wetland. Mar. Pollut. Bull. 2003, 46, 887–899. [Google Scholar] [CrossRef]
  6. Shutes, R. Artificial wetlands and water quality improvement. Environ. Int. 2001, 26, 441–447. [Google Scholar] [CrossRef]
  7. Pacheco, D.; Rocha, A.C.; Pereira, L.; Verdelhos, T. Microalgae Water Bioremediation: Trends and Hot Topics. Appl. Sci. 2020, 10, 1886. [Google Scholar] [CrossRef] [Green Version]
  8. Rahman, A.; Agrawal, S.; Nawaz, T.; Pan, S.; Selvaratnam, T. A Review of Algae-Based Produced Water Treatment for Biomass and Biofuel Production. Water 2020, 12, 2351. [Google Scholar] [CrossRef]
  9. Liu, J.; Danneels, B.; Vanormelingen, P.; Vyverman, W. Nutrient removal from horticultural wastewater by benthic filamentous algae Klebsormidium sp., Stigeoclonium spp. and their communities: From laboratory flask to outdoor Algal Turf Scrubber (ATS). Water Res. 2016, 92, 61–68. [Google Scholar] [CrossRef] [PubMed]
  10. Vijayaraghavan, K.; Balasubramanian, R. Is biosorption suitable for decontamination of metal-bearing wastewaters? A critical review on the state-of-the-art of biosorption processes and future directions. J. Environ. Manag. 2015, 160, 283–296. [Google Scholar] [CrossRef]
  11. Delrue, F.; Álvarez-Díaz, P.D.; Fon-Sing, S.; Fleury, G.; Sassi, J.-F. The Environmental Biorefinery: Using Microalgae to Remediate Wastewater, a Win-Win Paradigm. Energies 2016, 9, 132. [Google Scholar] [CrossRef]
  12. Judd, S.J.; Al Momani, F.A.O.; Znad, H.; Al Ketife, A.M.D. The cost benefit of algal technology for combined CO2 mitigation and nutrient abatement. Renew. Sustain. Energy Rev. 2017, 71, 379–387. [Google Scholar] [CrossRef] [Green Version]
  13. Kumar, A.K.; Sharma, S.; Patel, A.; Dixit, G.; Shah, E. Comprehensive evaluation of microalgal based dairy effluent treatment process for clean water generation and other value added products. Int. J. Phytoremediat. 2019, 21, 519–530. [Google Scholar] [CrossRef] [PubMed]
  14. Quinn, J.C.; Davis, R. The potentials and challenges of algae based biofuels: A review of the techno-economic, life cycle, and resource assessment modeling. Bioresour. Technol. 2015, 184, 444–452. [Google Scholar] [CrossRef] [Green Version]
  15. Pate, R.; Klise, G.; Wu, B. Resource demand implications for US algae biofuels production scale-up. Appl. Energy 2011, 88, 3377–3388. [Google Scholar] [CrossRef]
  16. Uduman, N.; Qi, Y.; Danquah, M.; Forde, G.M.; Hoadley, A. Dewatering of microalgal cultures: A major bottleneck to algae-based fuels. J. Renew. Sustain. Energy 2010, 2, 012701. [Google Scholar] [CrossRef]
  17. Wilson, M.H.; Groppo, J.; Placido, A.; Graham, S.; Morton, S.A.; Santillan-Jimenez, E.; Shea, A.; Crocker, M.; Crofcheck, C.; Andrews, R. CO2 recycling using microalgae for the production of fuels. Appl. Petrochem. Res. 2014, 4, 41–53. [Google Scholar] [CrossRef] [Green Version]
  18. Graham, E.J.S.; Dean, C.A.; Yoshida, T.M.; Twary, S.N.; Teshima, M.; Alvarez, M.A.; Zidenga, T.; Heikoop, J.; Perkins, G.; Rahn, T.A.; et al. Oil and gas produced water as a growth medium for microalgae cultivation: A review and feasibility analysis. Algal Res. 2017, 24, 492–504. [Google Scholar] [CrossRef]
  19. Hopkins, T.C.; Graham, E.J.S.; Schuler, A.J. Biomass and lipid productivity of Dunaliella tertiolecta in a produced water-based medium over a range of salinities. J. Appl. Phycol. 2019, 31, 3349–3358. [Google Scholar] [CrossRef]
  20. Hopkins, T.C.; Graham, E.J.S.; Schwilling, J.; Ingram, S.; Gómez, S.M.; Schuler, A.J. Effects of salinity and nitrogen source on growth and lipid production for a wild algal polyculture in produced water media. Algal Res. 2019, 38, 101406. [Google Scholar] [CrossRef]
  21. Rahman, A.; Pan, S.; Houston, C.; Selvaratnam, T. Evaluation of Galdieria sulphuraria and Chlorella vulgaris for the Bioremediation of Produced Water. Water 2021, 13, 1183. [Google Scholar] [CrossRef]
  22. Pandey, A.; Srivastava, S.; Kumar, S. Isolation, screening and comprehensive characterization of candidate microalgae for biofuel feedstock production and dairy effluent treatment: A sustainable approach. Bioresour. Technol. 2019, 293, 121998. [Google Scholar] [CrossRef] [PubMed]
  23. Zhu, L.; Li, S.; Hu, T.; Nugroho, Y.K.; Yin, Z.; Hu, D.; Chu, R.; Mo, F.; Liu, C.; Hiltunen, E. Effects of nitrogen source heterogeneity on nutrient removal and biodiesel production of mono- and mix-cultured microalgae. Energy Convers. Manag. 2019, 201, 112144. [Google Scholar] [CrossRef]
  24. Fabris, M.; Abbriano, R.; Pernice, M.; Sutherland, D.L.; Commault, A.S.; Hall, C.C.; Labeeuw, L.; McCauley, J.I.; Kuzhiumparambil, U.; Ray, P.; et al. Emerging Technologies in Algal Biotechnology: Toward the Establishment of a Sustainable, Algae-Based Bioeconomy. Front. Plant Sci. 2020, 11, 279. [Google Scholar] [CrossRef] [Green Version]
  25. Greenwell, H.C.; Laurens, L.M.L.; Shields, R.J.; Lovitt, R.W.; Flynn, K.J. Placing microalgae on the biofuels priority list: A review of the technological challenges. J. R. Soc. Interface 2010, 7, 703–726. [Google Scholar] [CrossRef] [Green Version]
  26. Xue, J.; Balamurugan, S.; Li, T.; Cai, J.-X.; Chen, T.-T.; Wang, X.; Yang, W.-D.; Li, H.-Y. Biotechnological approaches to enhance biofuel producing potential of microalgae. Fuel 2021, 302, 121169. [Google Scholar] [CrossRef]
  27. Field, C.B.; Behrenfeld, M.J.; Randerson, J.T.; Falkowski, P. Primary Production of the Biosphere: Integrating Terrestrial and Oceanic Components. Science 1998, 281, 237–240. [Google Scholar] [CrossRef] [PubMed] [Green Version]
  28. D’Ippolito, G.; Sardo, A.; Paris, D.; Vella, F.M.; Adelfi, M.G.; Botte, P.; Gallo, C.; Fontana, A. Potential of lipid metabolism in marine diatoms for biofuel production. Biotechnol. Biofuels 2015, 8, 28. [Google Scholar] [CrossRef] [Green Version]
  29. Hu, Q.; Sommerfeld, M.; Jarvis, E.; Ghirardi, M.; Posewitz, M.; Seibert, M.; Darzins, A. Microalgal triacylglycerols as feedstocks for biofuel production: Perspectives and advances. Plant J. 2008, 54, 621–639. [Google Scholar] [CrossRef]
  30. Hildebrand, M.; Davis, A.K.; Smith, S.R.; Traller, J.C.; Abbriano, R. The place of diatoms in the biofuels industry. Biofuels 2012, 3, 221–240. [Google Scholar] [CrossRef] [Green Version]
  31. Slattery, S.S.; Diamond, A.; Wang, H.; Therrien, J.A.; Lant, J.T.; Jazey, T.; Lee, K.; Klassen, Z.; Desgagné-Penix, I.; Karas, B.J.; et al. An Expanded Plasmid-Based Genetic Toolbox Enables Cas9 Genome Editing and Stable Maintenance of Synthetic Pathways in Phaeodactylum tricornutum. ACS Synth. Biol. 2018, 7, 328–338. [Google Scholar] [CrossRef]
  32. Karas, B.J.; Diner, R.E.; Lefebvre, S.C.; McQuaid, J.; Phillips, A.P.; Noddings, C.M.; Brunson, J.K.; Valas, R.E.; Deerinck, T.J.; Jablanovic, J.; et al. Designer diatom episomes delivered by bacterial conjugation. Nat. Commun. 2015, 6, 6925. [Google Scholar] [CrossRef]
  33. Wu, S.; Gu, W.; Huang, A.; Li, Y.; Kumar, M.; Lim, P.E.; Huan, L.; Gao, S.; Wang, G. Elevated CO2 improves both lipid accumulation and growth rate in the glucose-6-phosphate dehydrogenase engineered Phaeodactylum tricornutum. Microb. Cell Factories 2019, 18, 1–16. [Google Scholar] [CrossRef] [PubMed]
  34. Hao, X.; Luo, L.; Jouhet, J.; Rébeillé, F.; Maréchal, E.; Hu, H.; Pan, Y.; Tan, X.; Chen, Z.; You, L.; et al. Enhanced triacylglycerol production in the diatom Phaeodactylum tricornutum by inactivation of a Hotdog-fold thioesterase gene using TALEN-based targeted mutagenesis. Biotechnol. Biofuels 2018, 11, 312. [Google Scholar] [CrossRef] [PubMed]
  35. Yang, J.; Pan, Y.; Bowler, C.; Zhang, L.; Hu, H. Knockdown of phosphoenolpyruvate carboxykinase increases carbon flux to lipid synthesis in Phaeodactylum tricornutum. Algal Res. 2016, 15, 50–58. [Google Scholar] [CrossRef]
  36. Daboussi, F.; LeDuc, S.; Maréchal, A.; Dubois, G.; Guyot, V.; Perez-Michaut, C.; Amato, A.; Falciatore, A.; Juillerat, A.; Beurdeley, M.; et al. Genome engineering empowers the diatom Phaeodactylum tricornutum for biotechnology. Nat. Commun. 2014, 5, 3831. [Google Scholar] [CrossRef] [PubMed]
  37. Wang, X.-W.; Huang, L.; Ji, P.-Y.; Chen, C.; Li, X.-S.; Gao, Y.-H.; Liang, J.-R. Using a mixture of wastewater and seawater as the growth medium for wastewater treatment and lipid production by the marine diatom Phaeodactylum tricornutum. Bioresour. Technol. 2019, 289, 121681. [Google Scholar] [CrossRef]
  38. Burch, A.R.; Yothers, C.W.; Salemi, M.R.; Phinney, B.S.; Pandey, P.; Franz, A.K. Quantitative label-free proteomics and biochemical analysis of Phaeodactylum tricornutum cultivation on dairy manure wastewater. J. Appl. Phycol. 2021, 33, 2105–2121. [Google Scholar] [CrossRef]
  39. Veronesiv, D.; D’Imporzano, G.; Salati, S.; Adani, F. Pre-treated digestate as culture media for producing algal biomass. Ecol. Eng. 2017, 105, 335–340. [Google Scholar] [CrossRef]
  40. Libralato, G.; Gentile, E.; Ghirardini, A.V. Wastewater effects on Phaeodactylum tricornutum (Bohlin): Setting up a classification system. Ecol. Indic. 2016, 60, 31–37. [Google Scholar] [CrossRef]
  41. Fetter, C.W. Applied Hydrogeology, 4th ed.; Waveland Press: Long Grove, IL, USA, 2018. [Google Scholar]
  42. Alley, B.; Beebe, A.; Rodgers, J.; Castle, J.W. Chemical and physical characterization of produced waters from conventional and unconventional fossil fuel resources. Chemosphere 2011, 85, 74–82. [Google Scholar] [CrossRef]
  43. De Martino, A.; Meichenin, A.; Shi, J.; Pan, K.; Bowler, C. Genetic and phenotypic characterization ofPhaeodactylum tricornutum(Bacillariophyceae) accessions. J. Phycol. 2007, 43, 992–1009. [Google Scholar] [CrossRef]
  44. Young, E.F.; Holt, J.T. Prediction and analysis of long-term variability of temperature and salinity in the Irish Sea. J. Geophys. Res. Atmos. 2007, 112. [Google Scholar] [CrossRef] [Green Version]
  45. Kniebusch, M.; Meier, H.M.; Radtke, H. Changing Salinity Gradients in the Baltic Sea as a Consequence of Altered Freshwater Budgets. Geophys. Res. Lett. 2019, 46, 9739–9747. [Google Scholar] [CrossRef]
  46. Rastogi, A.; Vieira, F.R.J.; Deton-Cabanillas, A.-F.; Veluchamy, A.; Cantrel, C.; Wang, G.; Vanormelingen, P.; Bowler, C.; Piganeau, G.; Hu, H.; et al. A genomics approach reveals the global genetic polymorphism, structure, and functional diversity of ten accessions of the marine model diatom Phaeodactylum tricornutum. ISME J. 2020, 14, 347–363. [Google Scholar] [CrossRef]
  47. Berges, J.A.; Franklin, D.J.; Harrison, P.J. Evolution of an artificial seawater medium: Improvements in enriched seawater, artificial water over the last two decades. J. Phycol. 2001, 37, 1138–1145. [Google Scholar] [CrossRef]
  48. Guillard, R.R.L. Culture of phytoplankton for feeding marine invertebrates. In Culture of Marine Invertebrate Animals; Smith, W.L., Chanley, M.H., Eds.; Springer: Boston, MA, USA, 1975; pp. 29–60. [Google Scholar]
  49. Stock, W.; Blommaert, L.; Daveloose, I.; Vyverman, W.; Sabbe, K. Assessing the suitability of Imaging-PAM fluorometry for monitoring growth of benthic diatoms. J. Exp. Mar. Biol. Ecol. 2019, 513, 35–41. [Google Scholar] [CrossRef]
  50. Andersen, R.A. Algal Culturing Techniques, 1st ed.; Academic Press: Burlington, MA, USA, 2005. [Google Scholar]
  51. Chen, W.; Zhang, C.; Song, L.; Sommerfeld, M.; Hu, Q. A high throughput Nile red method for quantitative measurement of neutral lipids in microalgae. J. Microbiol. Methods 2009, 77, 41–47. [Google Scholar] [CrossRef]
  52. Sitepu, I.R.; Ignatia, L.; Franz, A.K.; Wong, D.M.; Faulina, S.A.; Tsui, M.; Kanti, A.; Boundy-Mills, K. An improved high-throughput Nile red fluorescence assay for estimating intracellular lipids in a variety of yeast species. J. Microbiol. Methods 2012, 91, 321–328. [Google Scholar] [CrossRef] [Green Version]
  53. van Tol, H.M.; Armbrust, E.V. Genome-scale metabolic model of the diatom Thalassiosira pseudonana highlights the importance of nitrogen and sulfur metabolism in redox balance. PLoS ONE 2021, 16, e0241960. [Google Scholar] [CrossRef] [PubMed]
  54. Cresswell, R.C.; Syrett, P.J. Uptake of Nitrate by the DiatomPhaeodactylum tricornutum. J. Exp. Bot. 1981, 32, 19–25. [Google Scholar] [CrossRef]
  55. Kuenzler, E.J.; Ketchum, B.H. Rate of phosphorus uptake by phaeodactylum tricornutum. Biol. Bull. 1962, 123, 134–145. [Google Scholar] [CrossRef]
  56. De Martino, A.; Bartual, A.; Willis, A.; Meichenin, A.; Villazán, B.; Maheswari, U.; Bowler, C. Physiological and Molecular Evidence that Environmental Changes Elicit Morphological Interconversion in the Model Diatom Phaeodactylum tricornutum. Protist 2011, 162, 462–481. [Google Scholar] [CrossRef] [PubMed]
  57. Borowitzka, M.A.; Volcani, B.E. The polymorphic diatomphaeodactylum tricornutum: Ultrastructure of its morphotypes1,2. J. Phycol. 1978, 14, 10–21. [Google Scholar] [CrossRef]
  58. Przeslawski, R. Combined effects of solar radiation and desiccation on the mortality and development of encapsulated embryos of rocky shore gastropods. Mar. Ecol. Prog. Ser. 2005, 298, 169–177. [Google Scholar] [CrossRef] [Green Version]
  59. Gracey, A.Y.; Chaney, M.L.; Boomhower, J.P.; Tyburczy, W.R.; Connor, K.; Somero, G.N. Rhythms of Gene Expression in a Fluctuating Intertidal Environment. Curr. Biol. 2008, 18, 1501–1507. [Google Scholar] [CrossRef] [Green Version]
  60. Raven, J.A.; Geider, R.J. Adaptation, acclimation and regulation in algal photosynthesis. In Photosynthesis in Algae; Advances in Photosynthesis and Respiration; Larkum, A.W.D., Douglas, S.E., Raven, J.A., Eds.; Springer: Dordrecht, The Netherlands, 2003; Volume 14, pp. 385–412. [Google Scholar]
  61. Bulankova, P.; Sekulić, M.; Jallet, D.; Nef, C.; van Oosterhout, C.; Delmont, T.O.; Vercauteren, I.; Osuna-Cruz, C.M.; Vancaester, E.; Mock, T.; et al. Mitotic recombination between homologous chromosomes drives genomic diversity in diatoms. Curr. Biol. 2021. [Google Scholar] [CrossRef]
  62. Alipanah, L.; Rohloff, J.; Winge, P.; Bones, A.M.; Brembu, T. Whole-cell response to nitrogen deprivation in the diatomPhaeodactylum tricornutum. J. Exp. Bot. 2015, 66, 6281–6296. [Google Scholar] [CrossRef] [Green Version]
  63. Li, W.; Gao, K.; Beardall, J. Interactive Effects of Ocean Acidification and Nitrogen-Limitation on the Diatom Phaeodactylum tricornutum. PLoS ONE 2012, 7, e51590. [Google Scholar] [CrossRef] [Green Version]
  64. Liu, N.; Beardall, J.; Gao, K. Elevated CO2 and associated seawater chemistry do not benefit a model diatom grown with increased availability of light. Aquat. Microb. Ecol. 2017, 79, 137–147. [Google Scholar] [CrossRef]
  65. Geider, R.J.; Roche, J.; Greene, R.M.; Olaizola, M. Response of the photosynthetic apparatus of phaeodactylum tricornutum (bacillariophyceae) to nitrate, phosphate, or iron starvation. J. Phycol. 1993, 29, 755–766. [Google Scholar] [CrossRef]
  66. Shifrin, N.S.; Chisholm, S.W. Phytoplankton lipids: Interspecific differences and effects of nitrate, silicate and light-dark cycles. J. Phycol. 1981, 17, 374–384. [Google Scholar] [CrossRef]
  67. Gong, Y.; Guo, X.; Wan, X.; Liang, Z.; Jiang, M. Triacylglycerol accumulation and change in fatty acid content of four marine oleaginous microalgae under nutrient limitation and at different culture ages. J. Basic Microbiol. 2013, 53, 29–36. [Google Scholar] [CrossRef]
  68. Burrows, E.H.; Bennette, N.B.; Carrieri, D.; Dixon, J.L.; Brinker, A.; Frada, M.; Baldassano, S.N.; Falkowski, P.G.; Dismukes, G.C. Dynamics of Lipid Biosynthesis and Redistribution in the Marine Diatom Phaeodactylum tricornutum Under Nitrate Deprivation. BioEnergy Res. 2012, 5, 876–885. [Google Scholar] [CrossRef]
  69. Remmers, I.M.; D’Adamo, S.; Martens, D.E.; de Vos, R.C.; Mumm, R.; America, A.H.; Cordewener, J.H.; Bakker, L.V.; Peters, S.A.; Wijffels, R.H.; et al. Orchestration of transcriptome, proteome and metabolome in the diatom Phaeodactylum tricornutum during nitrogen limitation. Algal Res. 2018, 35, 33–49. [Google Scholar] [CrossRef]
  70. Yang, Z.-K.; Ma, Y.-H.; Zheng, J.-W.; Yang, W.-D.; Liu, J.-S.; Li, H.-Y. Proteomics to reveal metabolic network shifts towards lipid accumulation following nitrogen deprivation in the diatom Phaeodactylum tricornutum. J. Appl. Phycol. 2014, 26, 73–82. [Google Scholar] [CrossRef] [PubMed] [Green Version]
  71. Beauchamp, R.O.; Bus, J.S.; Popp, J.A.; Boreiko, C.J.; Andjelkovich, D.A.; Leber, P. A Critical Review of the Literature on Hydrogen Sulfide Toxicity. CRC Crit. Rev. Toxicol. 1984, 13, 25–97. [Google Scholar] [CrossRef] [PubMed]
  72. Ma, J.; Zhou, B.; Chen, F.; Pan, K. How marine diatoms cope with metal challenge: Insights from the morphotype-dependent metal tolerance in Phaeodactylum tricornutum. Ecotoxicol. Environ. Saf. 2021, 208, 111715. [Google Scholar] [CrossRef]
  73. Zhou, B.; Ma, J.; Chen, F.; Zou, Y.; Wei, Y.; Zhong, H.; Pan, K. Mechanisms underlying silicon-dependent metal tolerance in the marine diatom Phaeodactylum tricornutum. Environ. Pollut. 2020, 262, 114331. [Google Scholar] [CrossRef]
  74. Johnston, N.R.; Strobel, S.A. Principles of fluoride toxicity and the cellular response: A review. Arch. Toxicol. 2020, 94, 1051–1069. [Google Scholar] [CrossRef]
  75. Krishna, K.; Arup, G.; Prince, V.; Kalaiyarasan, T.; Bhuvnesh, K. Effects of Fluoride on Respiration and Photosynthesis in Plants: An Overview. Ann. Environ. Sci. Toxicol. 2018, 2, 043–047. [Google Scholar] [CrossRef] [Green Version]
  76. Guth, S.; Hüser, S.; Roth, A.; Degen, G.; Diel, P.; Edlund, K.; Eisenbrand, G.; Engel, K.-H.; Epe, B.; Grune, T.; et al. Toxicity of fluoride: Critical evaluation of evidence for human developmental neurotoxicity in epidemiological studies, animal experiments and in vitro analyses. Arch. Toxicol. 2020, 94, 1375–1415. [Google Scholar] [CrossRef] [PubMed]
  77. Craig, L.; Lutz, A.; Berry, K.A.; Yang, W. Recommendations for fluoride limits in drinking water based on estimated daily fluoride intake in the Upper East Region, Ghana. Sci. Total. Environ. 2015, 532, 127–137. [Google Scholar] [CrossRef] [PubMed]
  78. Redmon, J.H.; Kondash, A.J.; Womack, D.; Lillys, T.; Feinstein, L.; Cabrales, L.; Weinthal, E.; Vengosh, A. Is Food Irrigated with Oilfield-Produced Water in the California Central Valley Safe to Eat? A Probabilistic Human Health Risk Assessment Evaluating Trace Metals Exposure. Risk Anal. 2020, 41, 1463–1477. [Google Scholar] [CrossRef]
  79. Antia, N.J.; Klut, M.E. Fluoride Addition Effects on Euryhaline Phytoplankter Growth in Nutrient-Enriched Seawater at an Estuarine Level of Salinity. Bot. Mar. 1981, 24, 147–152. [Google Scholar] [CrossRef]
  80. Wang, L.; Zheng, B. Toxic effects of fluoranthene and copper on marine diatom Phaeodactylum tricornutum. J. Environ. Sci. 2008, 20, 1363–1372. [Google Scholar] [CrossRef]
  81. Davis, A.K.; Hildebrand, M.; Palenik, B. Gene Expression Induced by Copper Stress in the Diatom Thalassiosira pseudonana. Eukaryot. Cell 2006, 5, 1157–1168. [Google Scholar] [CrossRef] [Green Version]
  82. Stuart, R.K.; Dupont, C.L.; Johnson, D.A.; Paulsen, I.T.; Palenik, B. Coastal Strains of Marine Synechococcus Species Exhibit Increased Tolerance to Copper Shock and a Distinctive Transcriptional Response Relative to Those of Open-Ocean Strains. Appl. Environ. Microbiol. 2009, 75, 5047–5057. [Google Scholar] [CrossRef] [Green Version]
  83. Smyth, D.A.; Dugger, W.M. Cellular changes during boron-deficient culture of the diatom Cylindrotheca fusiformis. Physiol. Plant. 1981, 51, 111–117. [Google Scholar] [CrossRef]
  84. Lewin, J. Boron as a growth requirement for diatoms. J. Phycol. 1966, 2, 160–163. [Google Scholar] [CrossRef]
  85. Truu, J.; Truu, M.; Espenberg, M.; Nõlvak, H.; Juhanson, J. Phytoremediation and Plant-Assisted Bioremediation in Soil and Treatment Wetlands: A Review. Open Biotechnol. J. 2015, 9, 85–92. [Google Scholar] [CrossRef]
  86. Rascio, N.; Navari-Izzo, F. Heavy metal hyperaccumulating plants: How and why do they do it? And what makes them so interesting? Plant Sci. 2011, 180, 169–181. [Google Scholar] [CrossRef] [PubMed]
  87. Veldhuis, M.; Kraay, G.; Timmermans, K. Cell death in phytoplankton: Correlation between changes in membrane permeability, photosynthetic activity, pigmentation and growth. Eur. J. Phycol. 2001, 36, 167–177. [Google Scholar] [CrossRef]
  88. Wu, H.; Li, T.; Wang, G.; Dai, S.; He, H.; Xiang, W. A comparative analysis of fatty acid composition and fucoxanthin content in six Phaeodactylum tricornutum strains from diff erent origins. Chin. J. Oceanol. Limnol. 2016, 34, 391–398. [Google Scholar] [CrossRef]
  89. Ladygina, N.; Dedyukhina, E.G.; Vainshtein, M.B. A review on microbial synthesis of hydrocarbons. Process. Biochem. 2006, 41, 1001–1014. [Google Scholar] [CrossRef]
Figure 1. Characterization of growth of P. tricornutum strains Pt1 and Pt4 in synthetic media at 0, 5, 10, 15, 25 and 31 psu based on cellular autofluorescence (F0) as a proxy for biomass. (a) Box plot showing minimum, maximum, and mean values (dotted line) of growth rates in Pt1 and Pt4 during trial 1 at all salinity levels except 0 psu. Letters ‘a’ and ‘b’ denote significant different groups (adj. p < 0.01) determined by a two-way ANOVA post hoc multiple comparisons between all group combinations. The adj. p-value is provided for the significant intra-strain differences at 25 and 31 psu. (b) Box plot as in (a) for the trial 2 (after additional acclimation to the respective media) (c) Growth curves of both strains from data in (a,b). Error bars represent SD values around the mean. Full lines represent samples of all salinity conditions except 0 psu (n = 8). Dotted lines represent growth in the 0 psu conditions (n = 2).
Water 13 02700 g001
Figure 2. Growth characterization of Pt1 cultures in EaS-PW, McF-PW, and EaS/McF-PW medium. Growth curve based on cell density counts (a) and log2-transformed cell density counts (b). Truncated violin plots showing the frequency distributions of the growth rates (c) and cell yields (d). Individual data points are shown as dots, the median is represented by a dashed line, and quartiles are represented by dotted lines. The starred comparison marks indicate significant differences in the dependent variable (*: adj. p < 0.05; **: adj. p < 0.005) based on two-way ANOVA post hoc multiple comparisons between the PW treatments and their controls (n = 4). One outlying growth rate value was removed from the 0 psu control condition (see Supplemental File S1). (e) Photosynthetic capacities (Fv/Fm) of cultures in (a,b). For graphing clarity, panels (a,b,e) show data from the second trial only (n = 2); Error bars represent standard deviations around the mean. The first trial showed comparable growth dynamics and its results are available in Supplementary File S1.
Water 13 02700 g002
Figure 3. Comparison of Nile Red (NR) based estimation of cellular neutral lipid content in PW media. (a) Truncated violin plot showing the frequency distribution of the log2-normalized NR fluorescence per cell. The medians are represented by a full line and the quartiles are represented by dashed lines. These measurements were made during cultivation in the three PW media and their respective controls (n = 4). (b,c) Truncated violin plot of the log2-normalized NR fluorescence per cell (b) and per mL of culture (c) on day 9 in the PW media and their controls. Individual data points are shown as dots, the median is represented by a dashed line, and quartiles are represented by dotted lines. The starred comparison marks indicate significant differences based on a two-way ANOVA with post hoc multiple comparisons between the PW treatments and their controls (* adj. p < 0.05; **** adj. p < 0.0001).
Water 13 02700 g003
Table 1. Analyte quantities in the produced water (PW) source and the relative change in EaS-PW analytes after Phaeodactylum tricornutum cultivation. Analyte quantities below the practical detection limit (PDL) are indicated with a smaller-than sign followed by the detection limit. Negative relative change (RC) values indicate a reduction and positive RC values indicate an increase in the quantity of the analyte after cultivation in EaS-PW medium. In cases where the PDL was reached in one of the EaS-PW samples, the RC was calculated using the PDL as a conservative estimate of the analyte’s concentration. Bolded numbers are those with a reduction exceeding 10%, while italic numbers are those with an increase exceeding 10%.
AnalyteUnitsMcF-PW Source aEaS-PW Source aEaS-PW Medium afterRC (%)
Total Dissolved Solidsmg/L116012,60013,0003
Conductivitymmhos/cm1.820215
Salinitypsu012120
pHpH units7.908.569.9116
Total Alkalinitymg/L100630530−16
HCO3mg/L1004900−100
CO32−mg/L<10140470236
OHmg/L<10<1061510
Total Hydrocarbonmg/L1.136.648.7031
C6–10 rangemg/L<0.05<0.05<0.050
C10–28 rangemg/L<0.052.593.3931
C28–35 rangemg/L1.134.15.3130
NO3mg/L<0.50 (55)20.50 (55)6.00−92
PO43−mg/L<0.30 (3.4)4.6 (3.4)1.9−76
SO42−mg/L180 (0.3)390 (0.3)310−21
SiO2mg/L31100<40−60
Bmg/L1.634408
Bamg/L<0.100.96<1.004
Camg/L1934378
Clmg/L44071006600−7
Cumg/L<0.050.06<0.05−18
Fmg/L0.774.601.30−72
Femg/L<0.10 (0.7)<0.10 (0.7)<0.10−85
Kmg/L5.165.059.0−9
Mgmg/L0.4354.0024.00−56
Namg/L380 (21)4400 (21)500013
Srmg/L0.332.802.800
a Values between parenthesis correspond to the quantity of the analyte that was supplemented after chemical analysis as part of the medium enrichment (see Supplemental Table S1 for calculations). For these analytes, the relative change (RC) is calculated using the total estimated concentration in the medium (i.e., sum of the measured concentration and supplemented concentration).
Publisher’s Note: MDPI stays neutral with regard to jurisdictional claims in published maps and institutional affiliations.

