Article

Identification of Groundwater Potential Recharge Zones in Flinders Ranges, South Australia Using Remote Sensing, GIS, and MIF Techniques

by
Alaa Ahmed
1,2,
Abdullah Alrajhi
3 and
Abdulaziz S. Alquwaizany
3,*
1
Centre for Scarce Resources and Circular Economy (ScaRCE), UniSA STEM, University of South Australia, Mawson Lakes, Adelaide, SA 5095, Australia
2
Geology Department, Division of Water Resource, Desert Research Center, Mathaf El Matariya Street, Cairo 11753, Egypt
3
King Abdulaziz City for Science and Technology, King Abdullah Road, Riyadh 11442, Saudi Arabia
*
Author to whom correspondence should be addressed.
Water 2021, 13(18), 2571; https://doi.org/10.3390/w13182571
Submission received: 30 July 2021 / Revised: 6 September 2021 / Accepted: 13 September 2021 / Published: 17 September 2021

Abstract

:
In Australia, water resource management is a major environmental, biological, and socio-economic issue, and will be an essential component of future development. The Hawker Area of the central Flinders Ranges, South Australia suffers from a lack of reliable data to help with water resource management and decision making. The present study aimed to delineate and assess groundwater recharge potential (GWRP) zones using an integration between the remote sensing (RS), geographic information system (GIS), and multi-influencing factors (MIF) approaches in the Hawker Area of the Flinders Ranges, South Australia. Many thematic layers such as lithology, drainage density, slope, and lineament density were established in a GIS environment for the purpose of identifying groundwater recharge potential zones. A knowledge base ranking from 1 to 5 was assigned to each individual thematic layer and its categories, depending on each layer’s importance to groundwater recharge potential zones. All of the thematic layers were integrated to create a combined groundwater potential map of the study area using weighting analysis in ArcGIS software. The groundwater potential zones were categorized into three classes, good, moderate, and low. The resulting zones were verified using available water data and showed a relative consistency with the interpretations. The findings of this study indicated that the most effective groundwater potential recharge zones are located where the lineament density is high, the drainage density is low, and the slope is gentle. The least effective areas for groundwater recharge are underlain by shale and siltstone. The results indicated that there were interrelationships between the groundwater recharge potential factors and the general hydrology characteristics scores of the catchment. MIF analysis using GIS mapping techniques proved to be a very useful tool in the evaluation of hydrogeological systems and could enable decision makers to evaluate, better manage, and protect a hydrogeological system using a single platform.

1. Introduction

In Australia, groundwater is vital for domestic, agricultural, mining, and industrial purposes [1]. It makes up approximately 17% of the available water resources and over 30% of the total water consumption and is accessible to 60% of the continent’s total area [2]. In last decades, most of the continent has faced water scarcity due to the overuse of groundwater that led to an unacceptable decline in water levels causing serious issues such as increased groundwater salinity, high pumping costs, seawater intrusion, and loss of access to groundwater by users and ecosystems [1]. Traditional methods such as geophysical and hydrogeological techniques that have been used in groundwater potential assessment are costly and time-consuming. The delineation and identification of potential groundwater zones have become more attainable with the utilization of geospatial methods and satellite images, which have been widely used in recent years. Mapping of groundwater resources and planning for future resources are urgently needed to overcome the problem of limited water supply and increasing demand for water. The determination of the distribution of groundwater recharge potential zones is a useful tool for sustainable groundwater management.
The occurrence and movement of groundwater are affected by the type, thickness, and structural fabric of the underlying rocks, denudation, structural features, topography, drainage, and the climate [3,4,5,6]. The impact of these factors on groundwater recharge varies from location to location. For example, linear features such as fractures and faults can act as conduits or barriers for groundwater flow [7,8,9]. Therefore, they are highly influential factors in identifying recharge potential zones. In general, buffer zones of 300–500 m near the lineament are favorable zones for groundwater recharge [10]. It is essential, however, to consider all factors in order to delineate and identify the groundwater recharge potential (GWRP) of an area.
Identification of the GWRP is traditionally completed using hydrogeological, geological, and geophysical investigations, and soil moisture modelling [11,12,13,14]. However, most in situ investigation methods are expensive, time-consuming, require skilled human resources, and are not feasible for the evaluation of the recharge potential at the catchment scale [5,15]. Currently, the integration of remote sensing (RS) and geographic information system (GIS) technology is used as a faster, more accurate, and more cost-efficient way to identify the various factors relevant to the GWRP [16,17,18]. Various studies around the world have been carried out to identify and delineate groundwater recharge potential zones by integrating RS and GIS techniques [16,19,20,21,22,23]. Most of these studies have been based on integrating the relative weights of different thematic layers such as the geology, geomorphology, lineament density, drainage density, and slope, etc., within the GIS environment [5,24,25]. The assignment of the relative weights is subjective and based on literature reviews and/or expert knowledge [15,26,27]. The multi-influencing factor (MIF) approach in GIS is commonly used for the identification of GWRP based on the interrelationships of the different factors [27]. This approach has attained its popularity from its practical applications prior to introducing costly field explorations [5,25,27].
The Flinders Ranges is located in South Australia (Figure 1). Groundwater is the main source of fresh water in the region and has played a significant role since the European settlement. The region depends on groundwater stored in fractured rock aquifers for various purposes [28]. Therefore, it is essential to understand this valuable water resource to ensure its sustainable development and management. The main aim of this study was to delineate and evaluate the GWRP for a selected catchment in the Flinders Ranges, South Australia through the integrated use of the geospatial (RS and GIS) and multi-influence factor (MIF) approach.

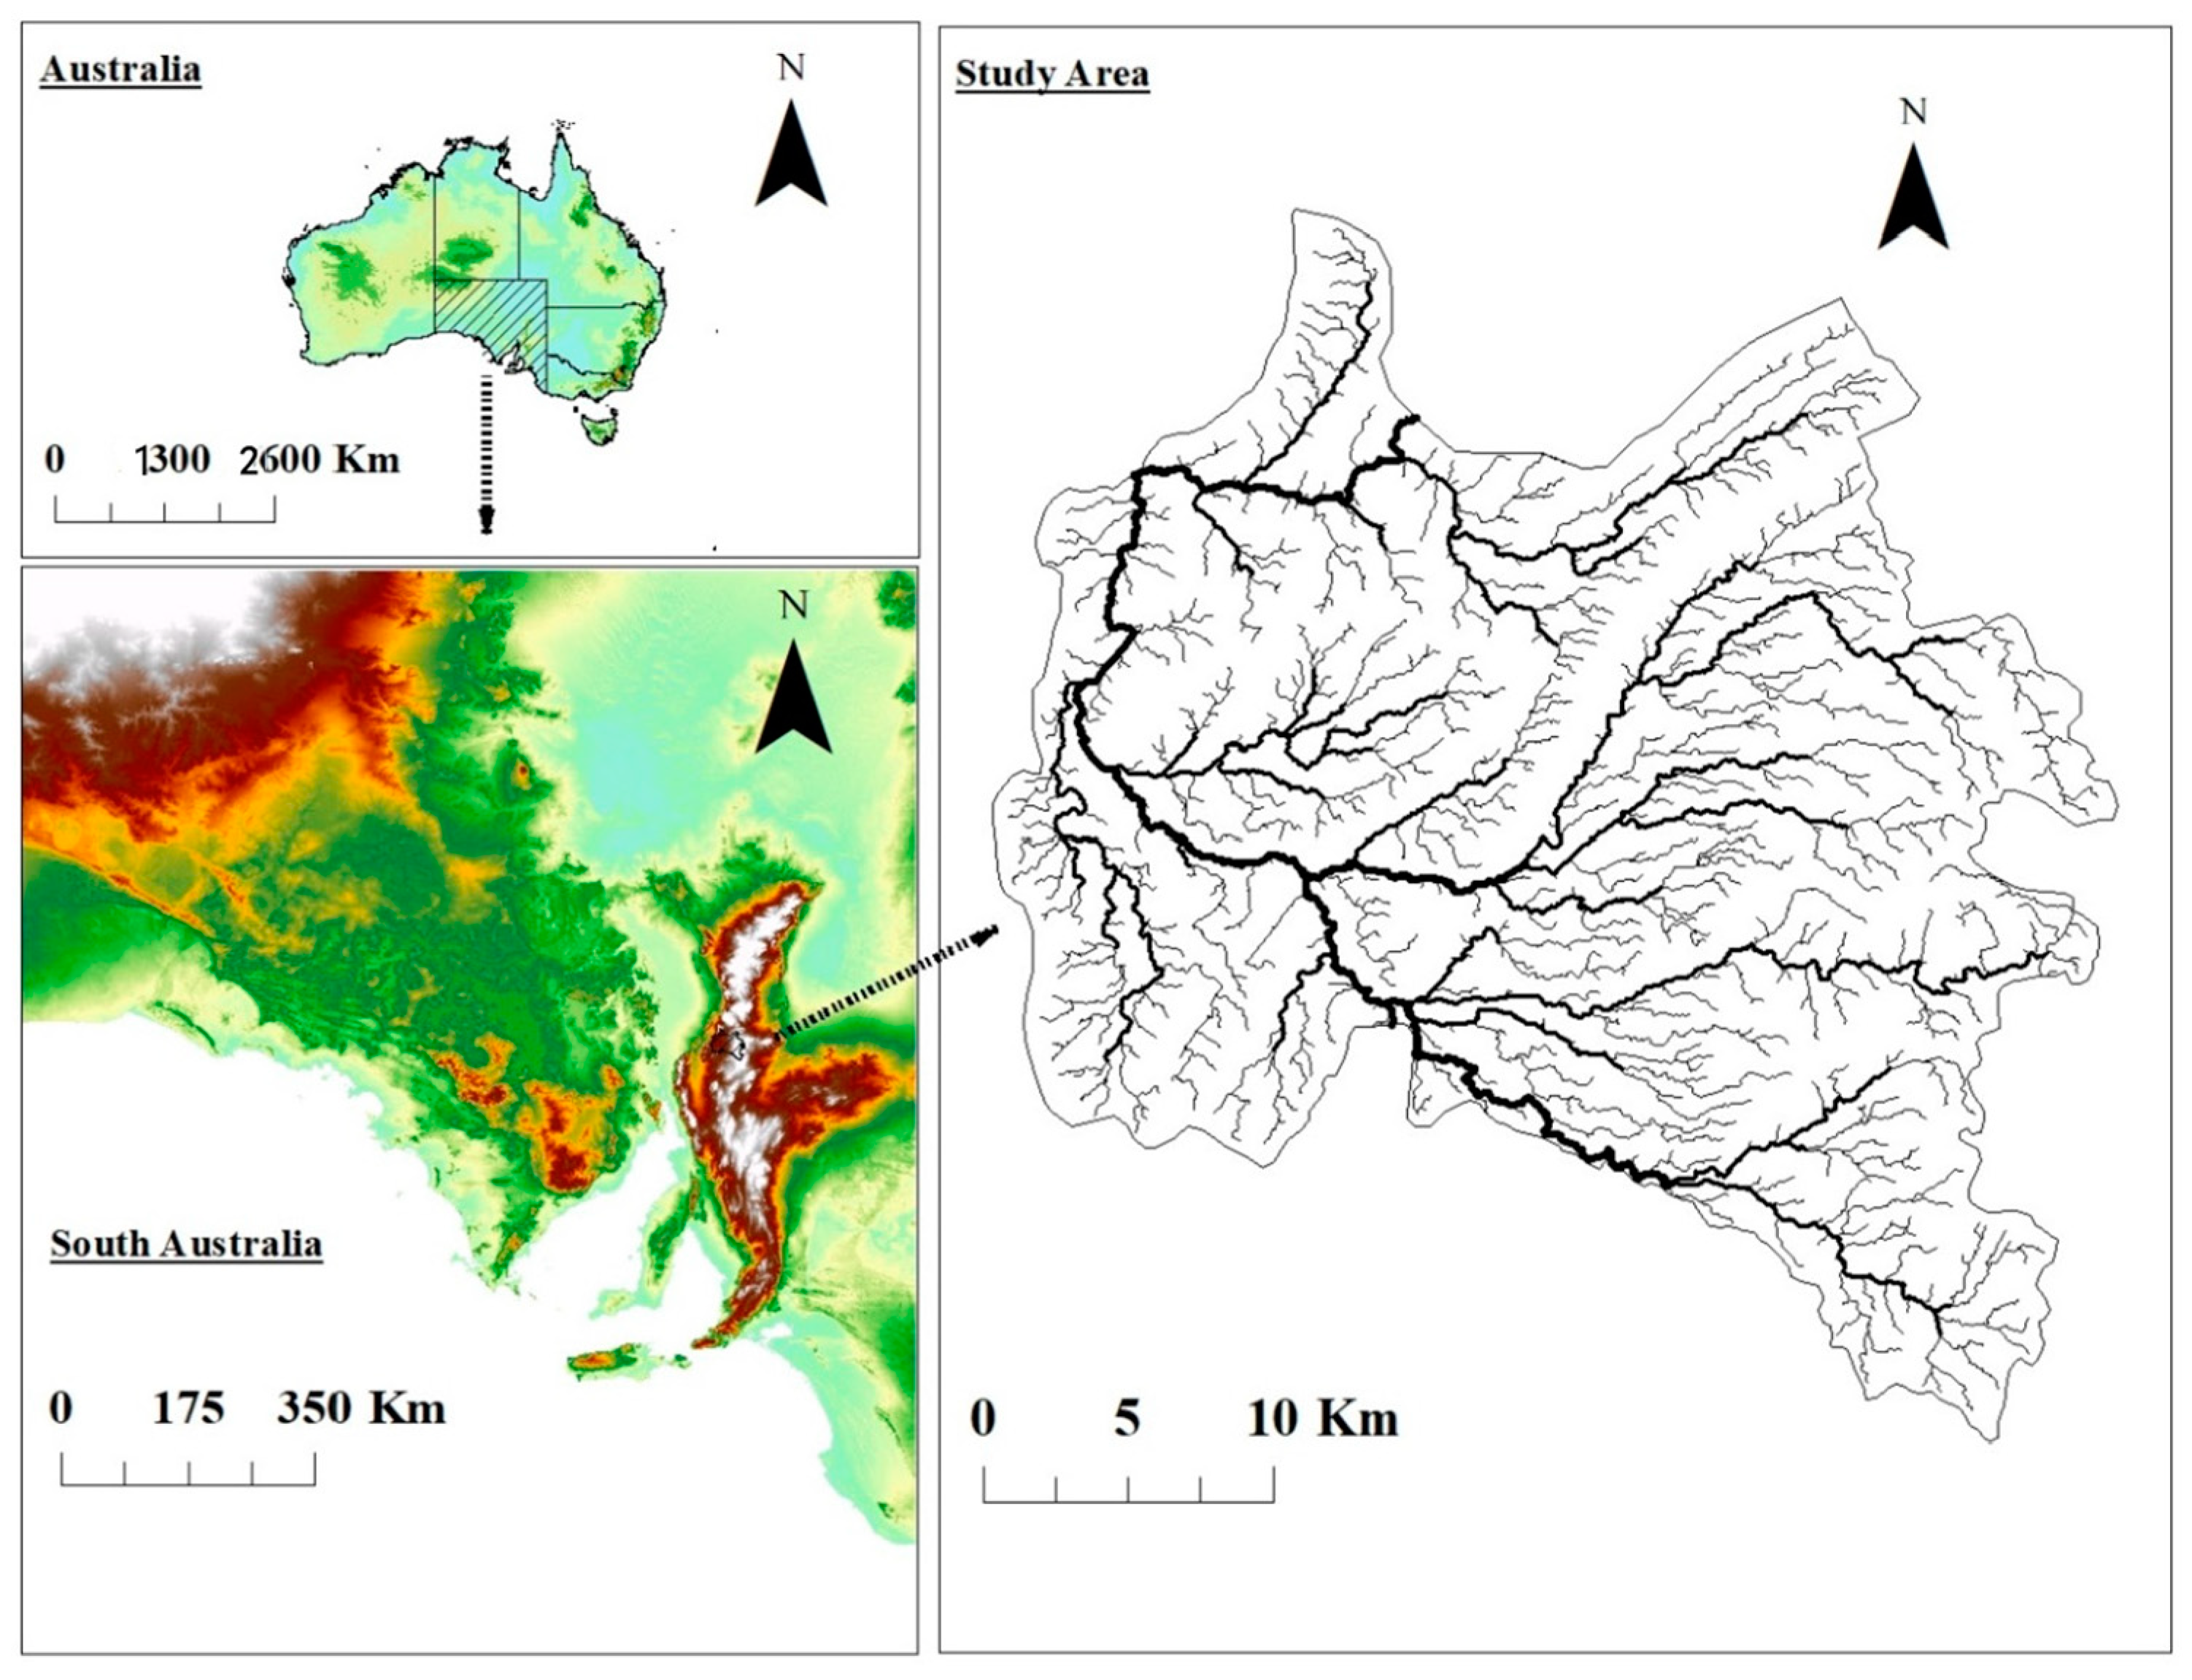
1.1. Overview of the Study Area

The Hawker Area is located 370 km north of Adelaide in the Flinders Ranges, South Australia. The study area extended from latitude 31°39′ to 32°50′ south and longitude 138°20′ to 138°50′ east covering an area of 916.4 km2 (Figure 1). The elevation ranges from 240 to 950 m. The climate of the area is characterized by semi-arid to arid conditions with hot and dry summers, and cool to mild winters with low annual rainfall. The wet period extends from May through October, while the dry period occurs between November and April (Figure 2). During the dry period, tropical lows in northern Australia may cause occasional thunderstorms with heavy rainfalls. The average annual rainfall varies from more than 300 mm in the higher elevation areas, to below 200 mm at lower elevation areas. The summer temperature ranges from 28 to 40 °C and winter temperatures range from 6 to 22 °C (http://www.bom.gov.au/) (accessed on 12 July 2021).

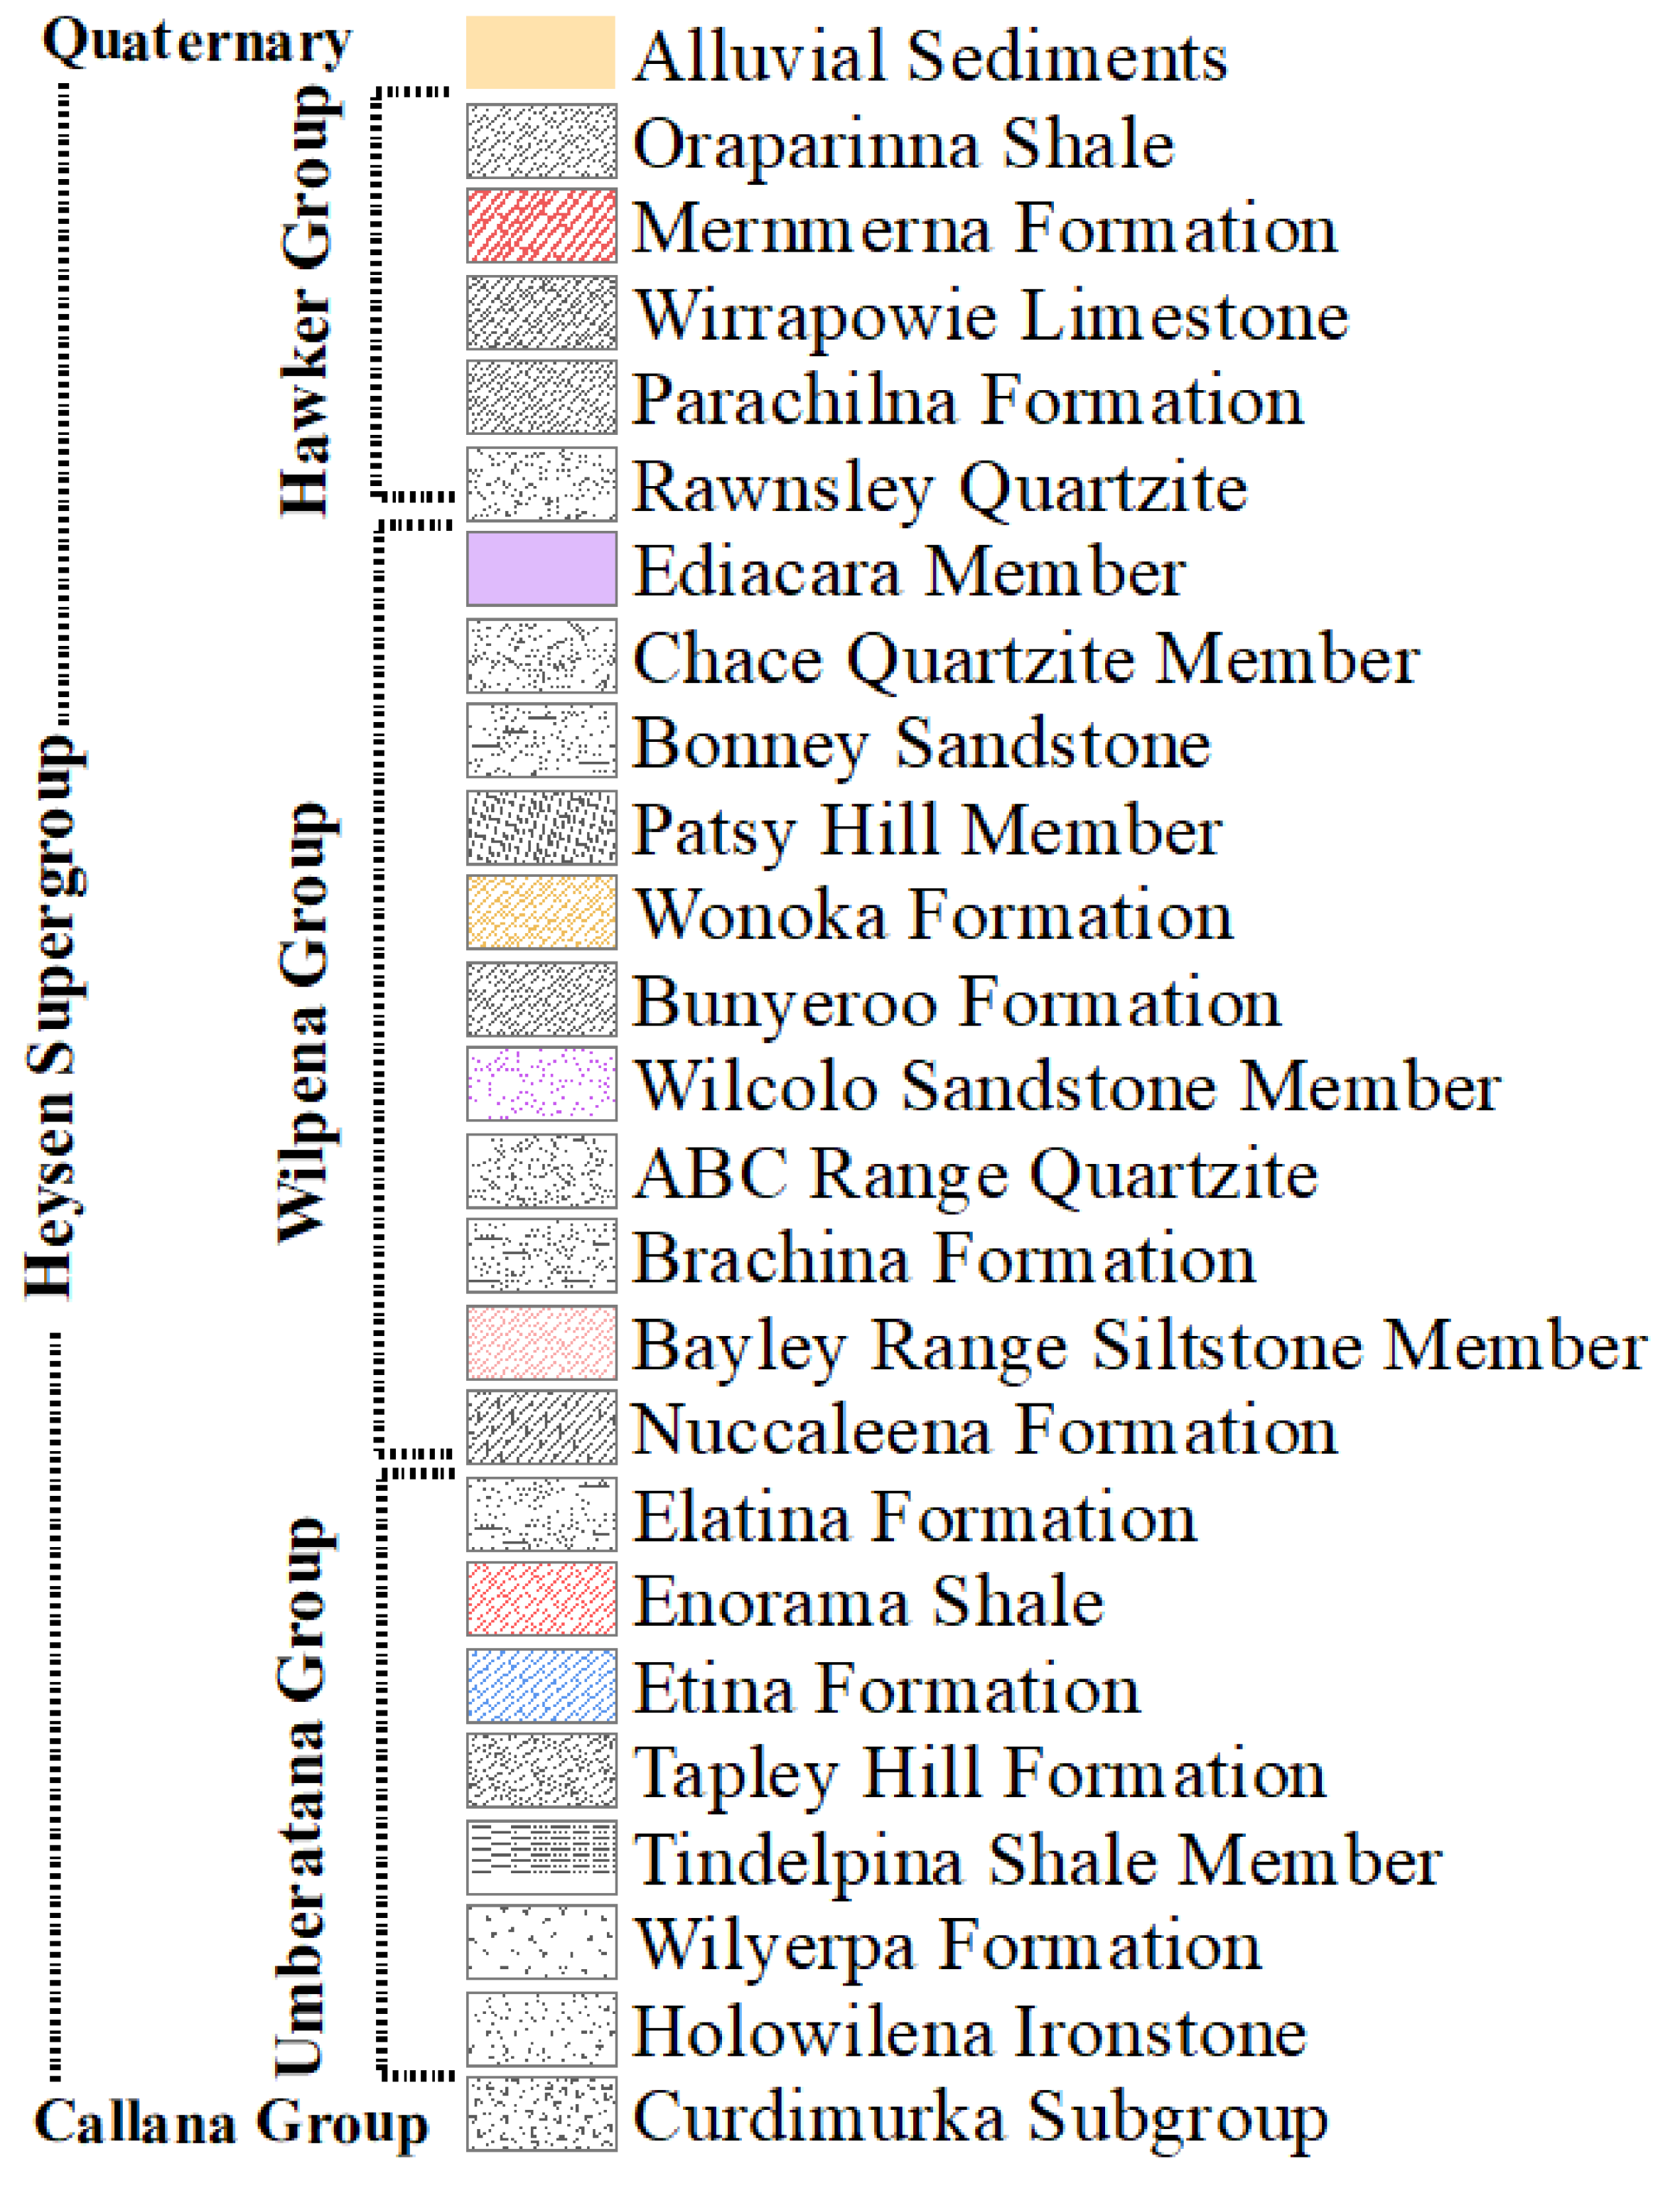
1.2. Geology and Hydrogeology

The study area is a part of the Adelaide Fold Belt, which consists of Paleoproterozoic to Mesoproterozoic basement rocks extending beyond a thick sedimentary sequence that is Neoproterozoic to Cambrian [29,30,31]. The crystalline basement and the overlying sedimentary rocks were deformed in an orogenic setting in the late Cambrian–early Ordovician Delamerian Orogeny to form the typical strike ridges of the Flinders Ranges (Figure 3). Structurally, the study area is fragmented by an anticline–syncline NW and NNW fold system resulting in a series of parallel ridges separated by relatively wide valleys [30]. The ridges are dominated by high resistance Cambrian and Neoproterozoic quartzites, and limestones and calcareous meta-siltstones (Wilpena, Umberatana, and Hawker groups), while alluvial deposits are outcropped in valleys and low topographic areas.
Most of the information regarding the hydrogeological setting was sourced from mineral or hydrocarbon exploration reports [34]. Groundwater of variable quantity and quality occurs throughout the Quaternary sediments and the underlying fractured metasediments [28]. Throughout the study area, the ridges are considered to be groundwater divides recharging the more distal parts in the low topographic areas. The thickness of the Quaternary sediments is variable ranging from 100 m in the northwest, to around 20 m in the southeast [34].

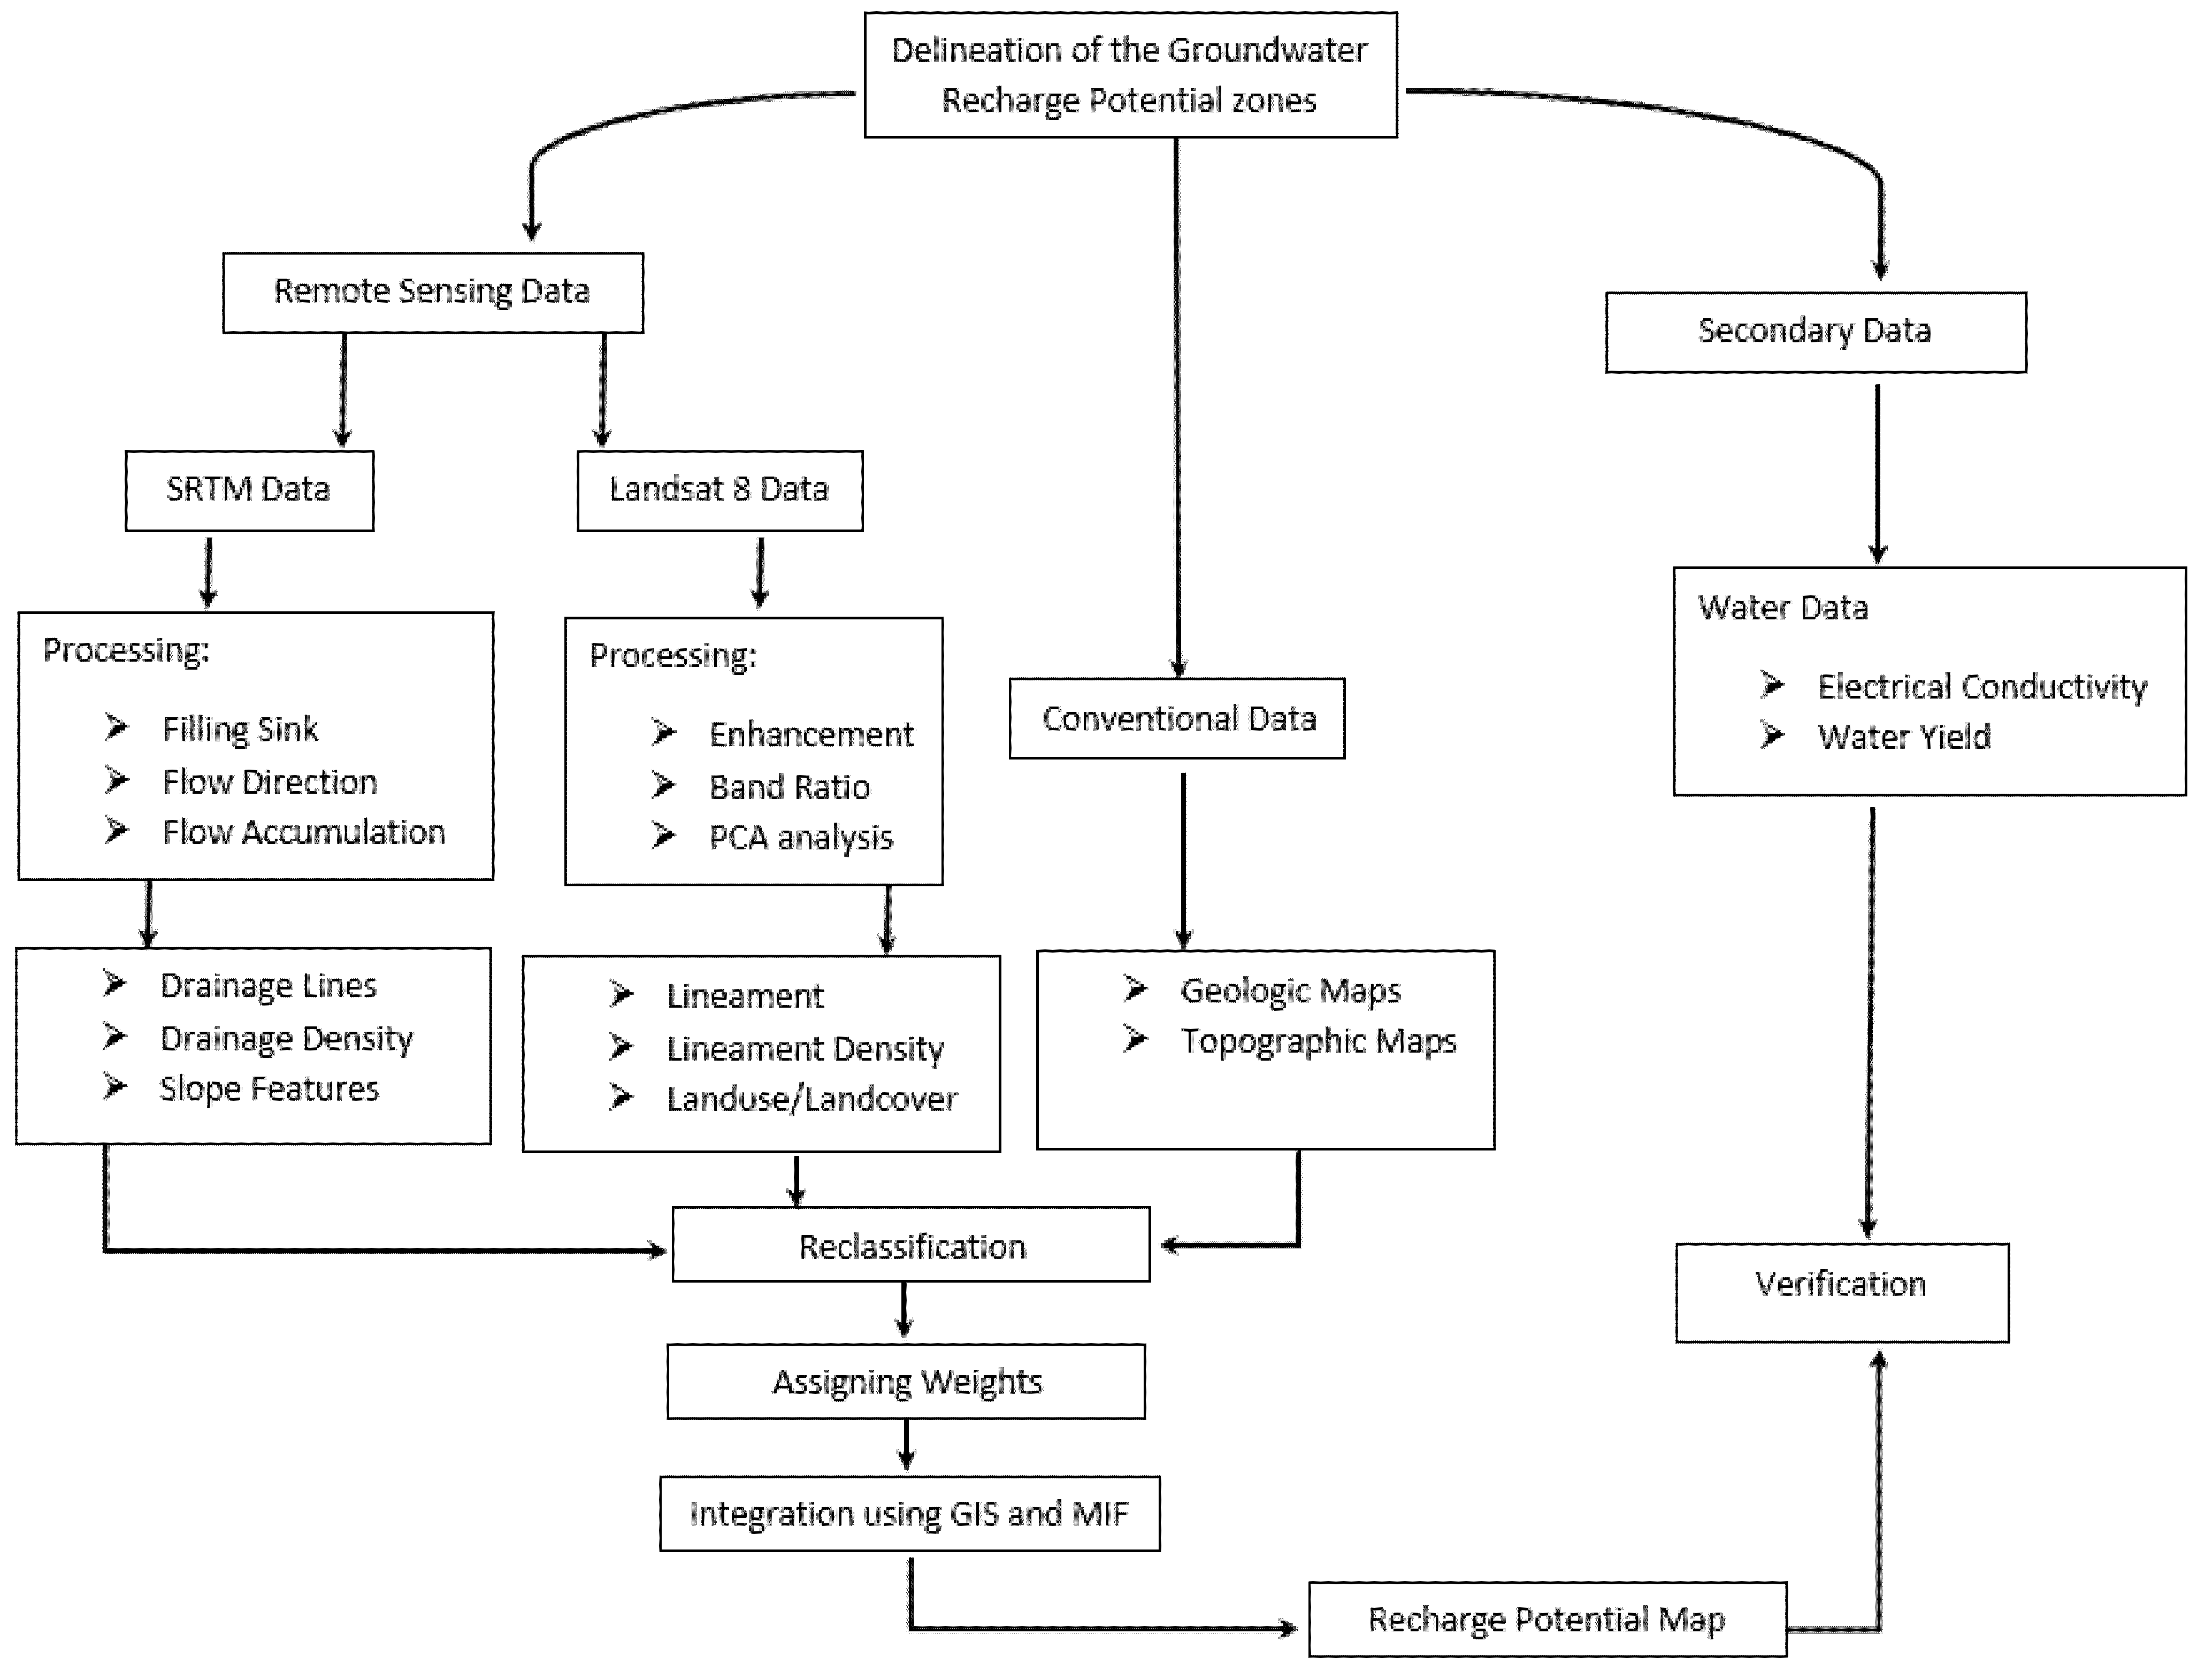
2. Materials and Methods

2.1. Processing and Extraction of Thematic Layers

In this study, groundwater recharge potential zones were delineated and evaluated by preparing and integrating RS and GIS data. Five influencing factors including lithology, lineament, drainage, slope, and landcover were considered. Various thematic layers of theses influencing factors were analyzed using the GIS and MIF approach to assess the GWRP zones. The methodology is given in the flowchart of Figure 4.
The methodology starts with identifying and assigning data sources of the various conditioning factors relevant to the groundwater potential (Table 1) followed by preprocessing these sources to ensure a uniform projection and resolution. Data extraction and analysis were carried out using ArcGIS 10.7. The Advanced Spaceborne Thermal Emission and Reflection Radiometer (ASTER GDEM) was used with topographic and geologic maps as base maps for the delineation and evaluation of the watershed (Table 1). GDEM is processed in GIS environment by filling the sinks, flow direction, and flow accumulation grids to extract streams, watersheds, and topographic and slope features.
Landsat Enhanced Thematic Mapper (ETM+) imagery with free cloud cover scenes for the year of 2015 (Path = 98 and row = 81) during summer season were best to distinguish the spectral signatures of the different landcover types. The images were preprocessed in the ENVI 5.4 environment to reduce or eliminate haze effects before mosaicking and sub-setting. Enhancement image techniques including RGB band combinations, band rationing, and decorrelation stretch of the highest contrast, were applied to the Landsat imagery. The Line Module of PCI Geomatica 2020 Software Package was then used for the detailed automatic extraction of the lineaments. The lineament density map was derived from the Landsat images based on grid cell size of 5.0 km2. The landuse/landcover (LULC) features were classified using the maximum likelihood classifier in ArcGIS 10.7. The LULC categories were further verified using image interpretation elements such as drainage, tone, texture, and relief for the satellite images.
The average annual rainfall data for a period of 30 years was collected from the Bureau of Meteorology, Australia from the grid file. Then, it was exported as a raster format using GIS and processed to extract the rainfall values. To overcome the low resolution of the grid data compared to the other factors’ thematic layers, an equal distribution of 400 points was created over the study area, and the rainfall value was extracted and interpolated using the inverse distance weighting (IDW) method to 15 m resolution. In addition, groundwater data were retrieved from the hydrogeological database of Primary Industries and Resources, South Australia (https://map.sarig.sa.gov.au/) (accessed on 12 July 2021). This database contains information recorded by well drillers about well location, water depth, water yield, and rock type. The well database for the Flinders Ranges contains information for approximately 90% of the wells in the region. All of the thematic layers were then stored and classified in a geo-database as GIS layers. Analyses and interpretations were conducted directly from the created geo-database for the influencing factors.

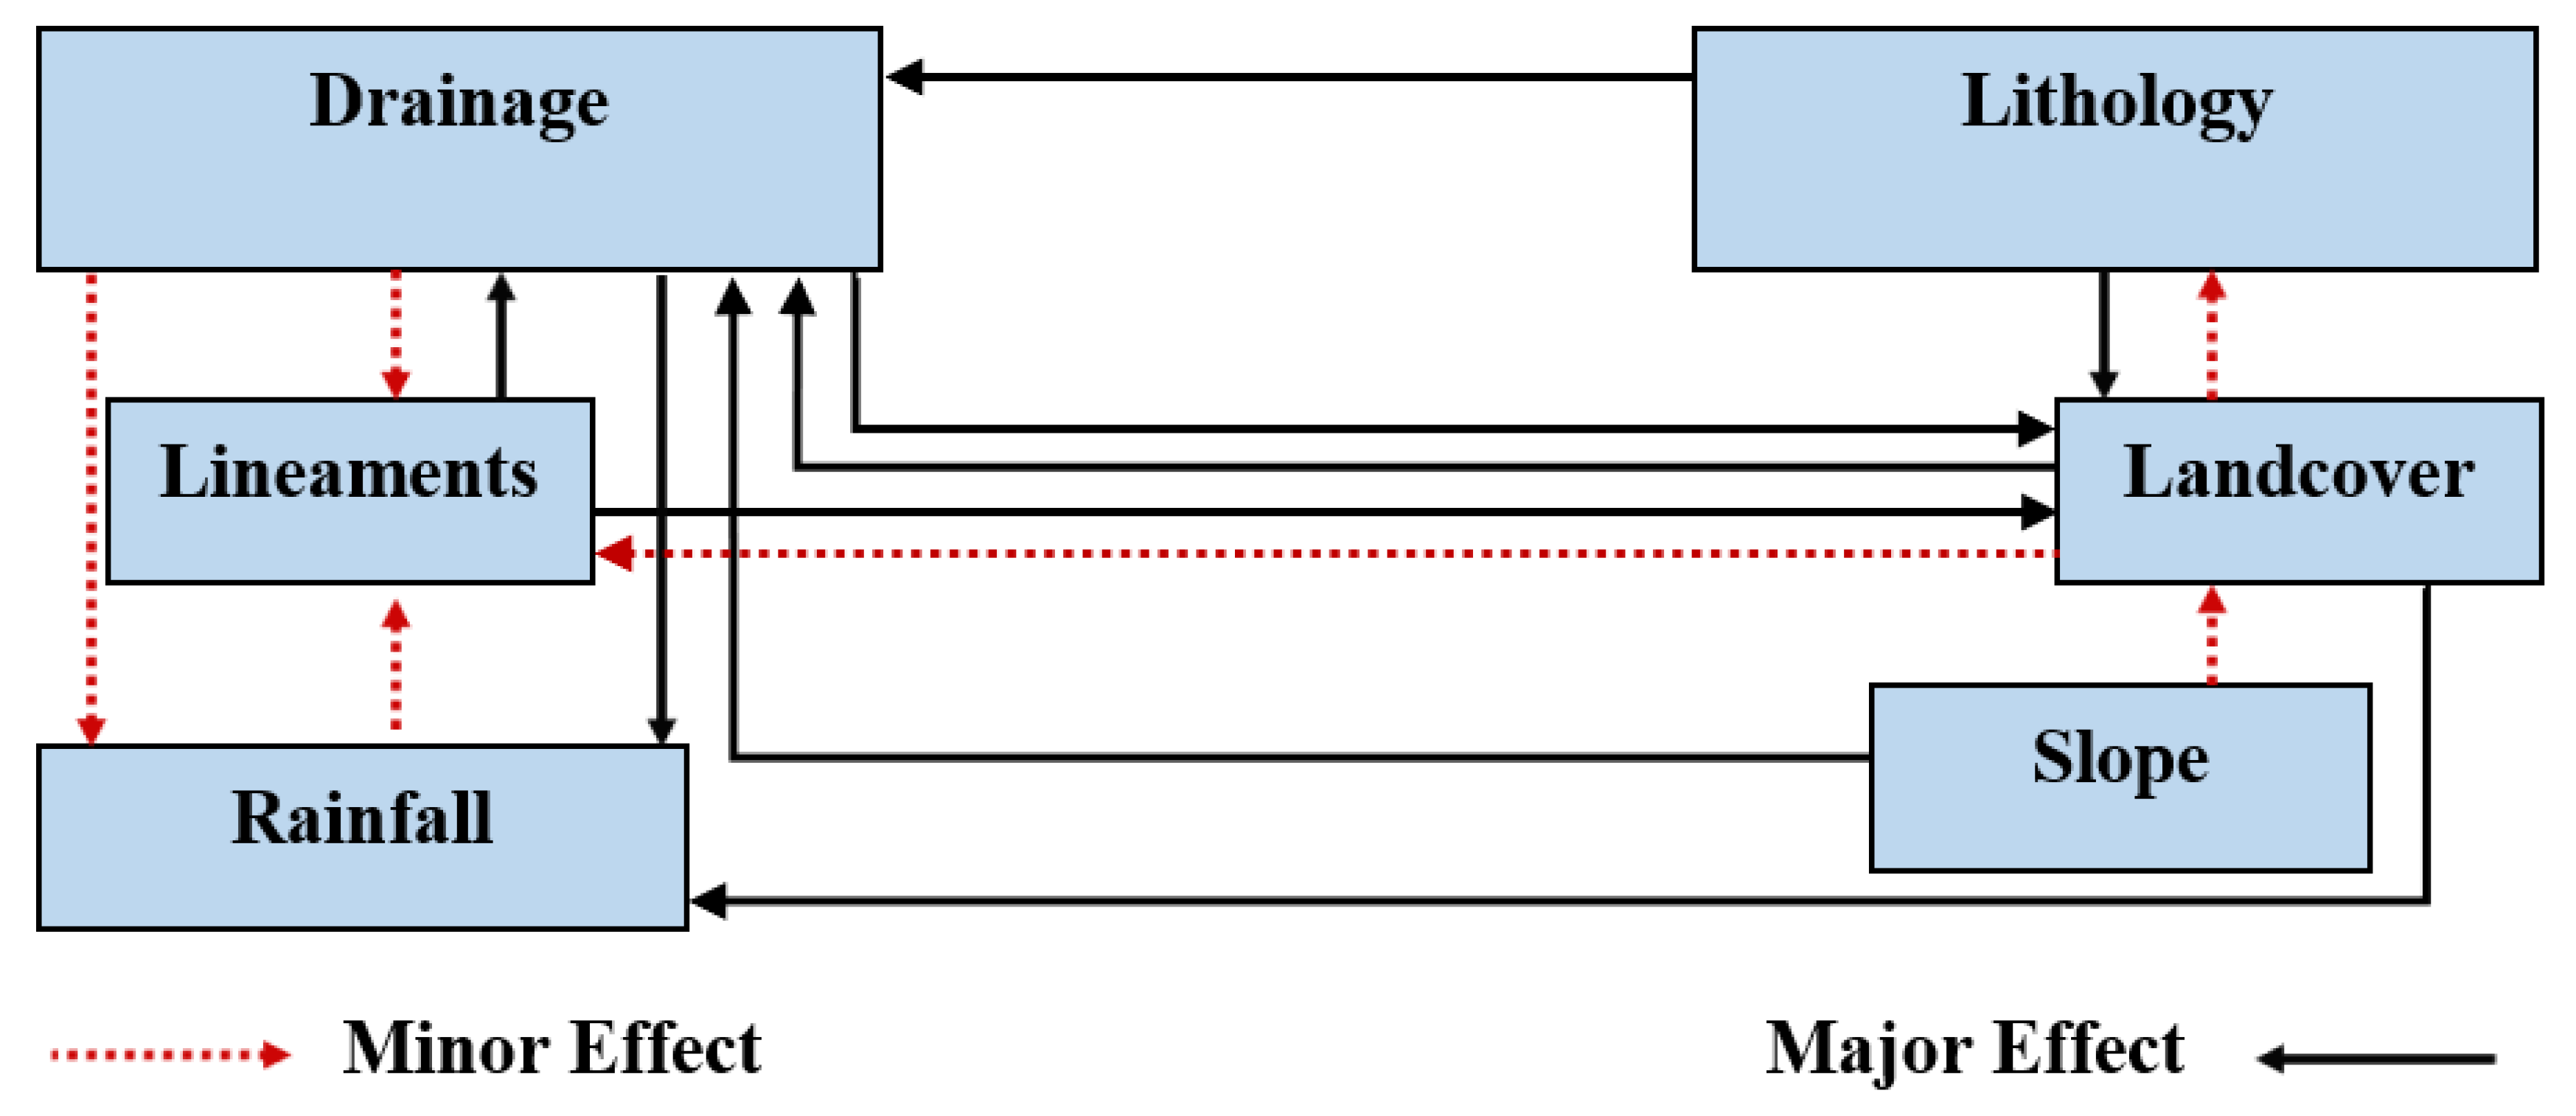
2.2. Multi-Influencing Factors Approach (MIF)

The MIF approach has been extensively and successfully applied by many researchers in groundwater recharge potential mapping studies [3,35]. In the MIF method, all thematic maps and their individual classes are weighted based on the literature review and according to their hydrological significance for the groundwater recharge potentiality [35]. Figure 5 illustrates the conceptual diagram of the interrelationships among the different influencing factors. From the figure, it is evident that the magnitude of the influence of each factor on the groundwater recharge potential can be computed and evaluated from the interrelationships among the different influencing factors (major and minor). A score of 1.0 was assigned for a strong relationship between the parameters, while a score of 0.5 was given if a minor effect was found, reflecting weak relationships between the factors. For instance, major interrelationships were observed for lineaments on landcover and drainage. Therefore, its evaluated weight was 2.0. This high weight value means that the factor significantly influences the recharge potentiality.
A cumulative score weight of both major and minor effects in terms of groundwater recharge potentiality was calculated to obtain the relative score for the different influencing factors (Table 2). This was further used to estimate the proposed score of each influencing factor, as shown in the following equation
S = A + B A + B × 100
where “S” is the proposed score of every selected influencing factor, and “A” and “B” are the major and the minor interrelationships between each two factors, respectively. The proposed score of every influencing factor was then divided and assigned to every reclassified sub-factor (Table 3). All the parameters, with their potential weights, were reclassified and integrated into five classes by applying weighted overlay analysis in the GIS environment to determine the GWRP zones.
To obtain the GWRP map, rasters with the influencing factors were overlaid using the following formula
GWRP = Li r × Li w + Lin r × Lin w + As r × As w + Lu r × Lu w + Dr r × Dr w + Rf r   × Rf w
where Li is the lithology, Lin is the lineament, As is the average slope, LU is the land use, Dr is the drainage density, Rf is the rainfall, r is the rating of each class of each thematic layer, and w is the weight of each thematic layer. The obtained values for the GWRP were classified into three categories from 1 to 3.

2.3. Verification of the GWRP

In the present study, the final map obtained using the MIF approach was validated using an independent dataset that was not used to construct the map. The observed well-yields of the water wells were obtained from the Department for Environment and Water, South Australia. The water wells were referred to as high, medium, and low water yield and used to validate the accuracy of the final groundwater recharge potential map.

3. Results

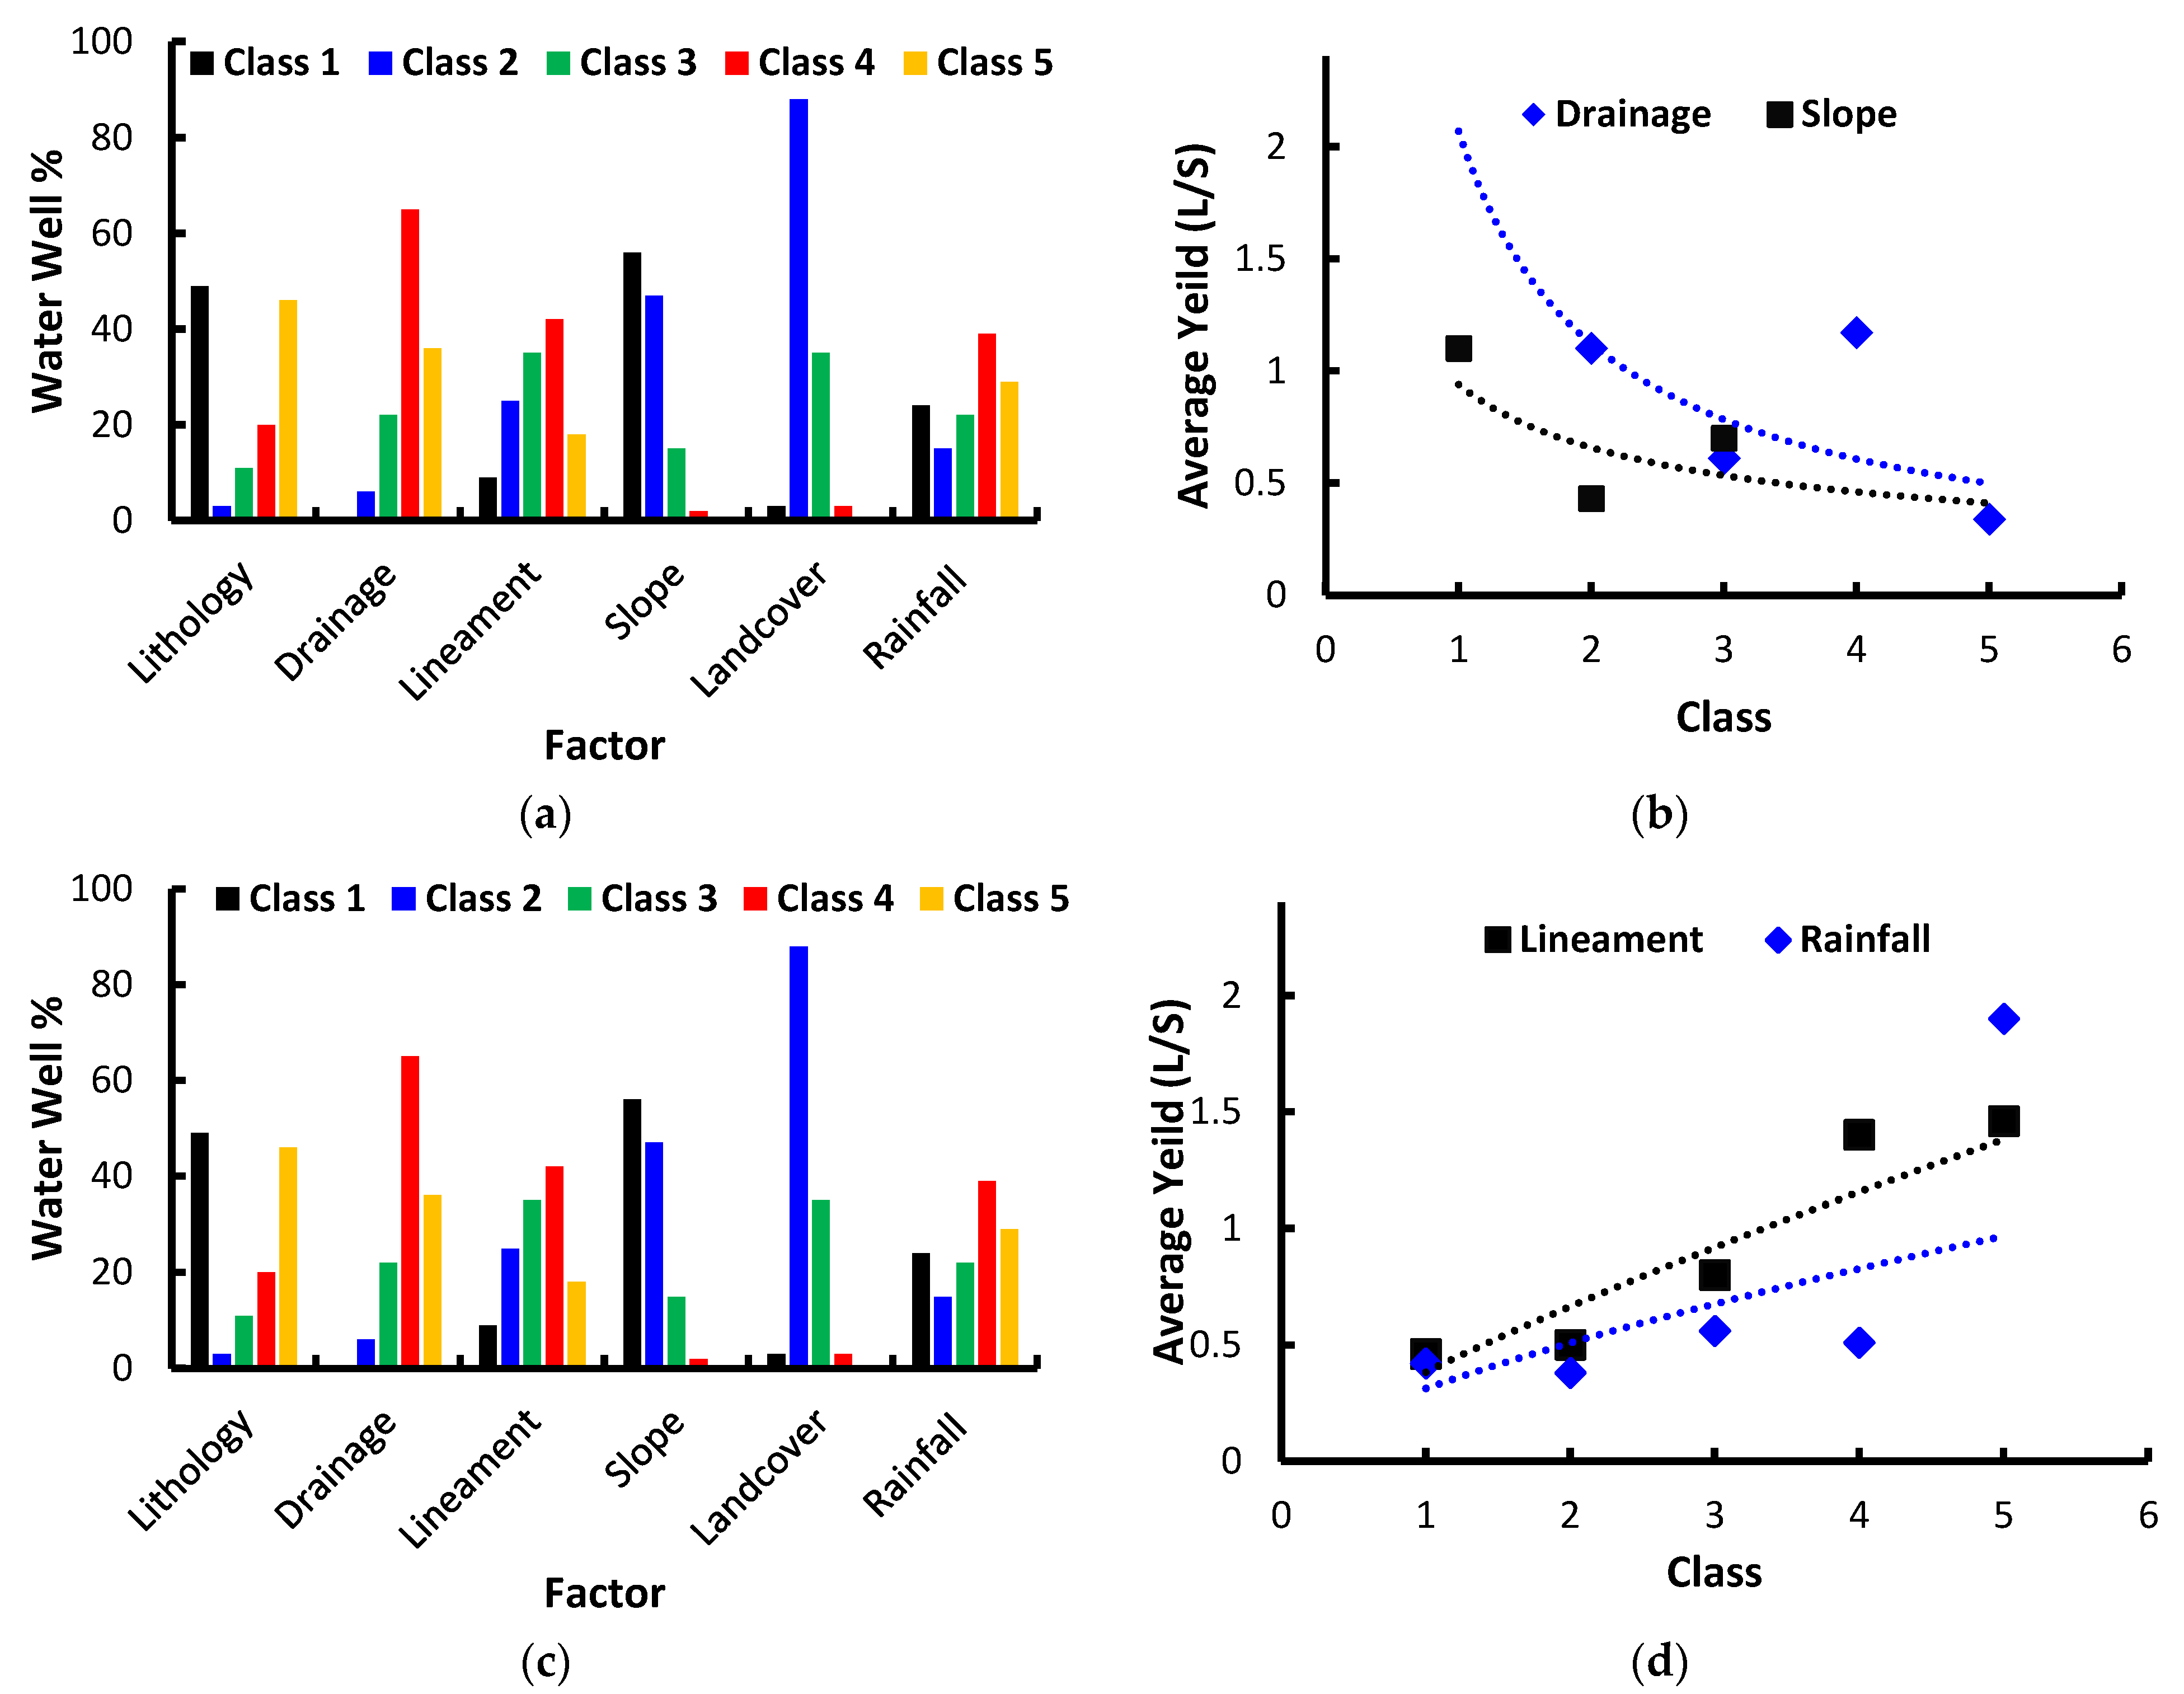
3.1. Influencing Factors

The analysis of seven major factors was performed using GIS to demonstrate and evaluate their effect on the groundwater recharge potentiality.

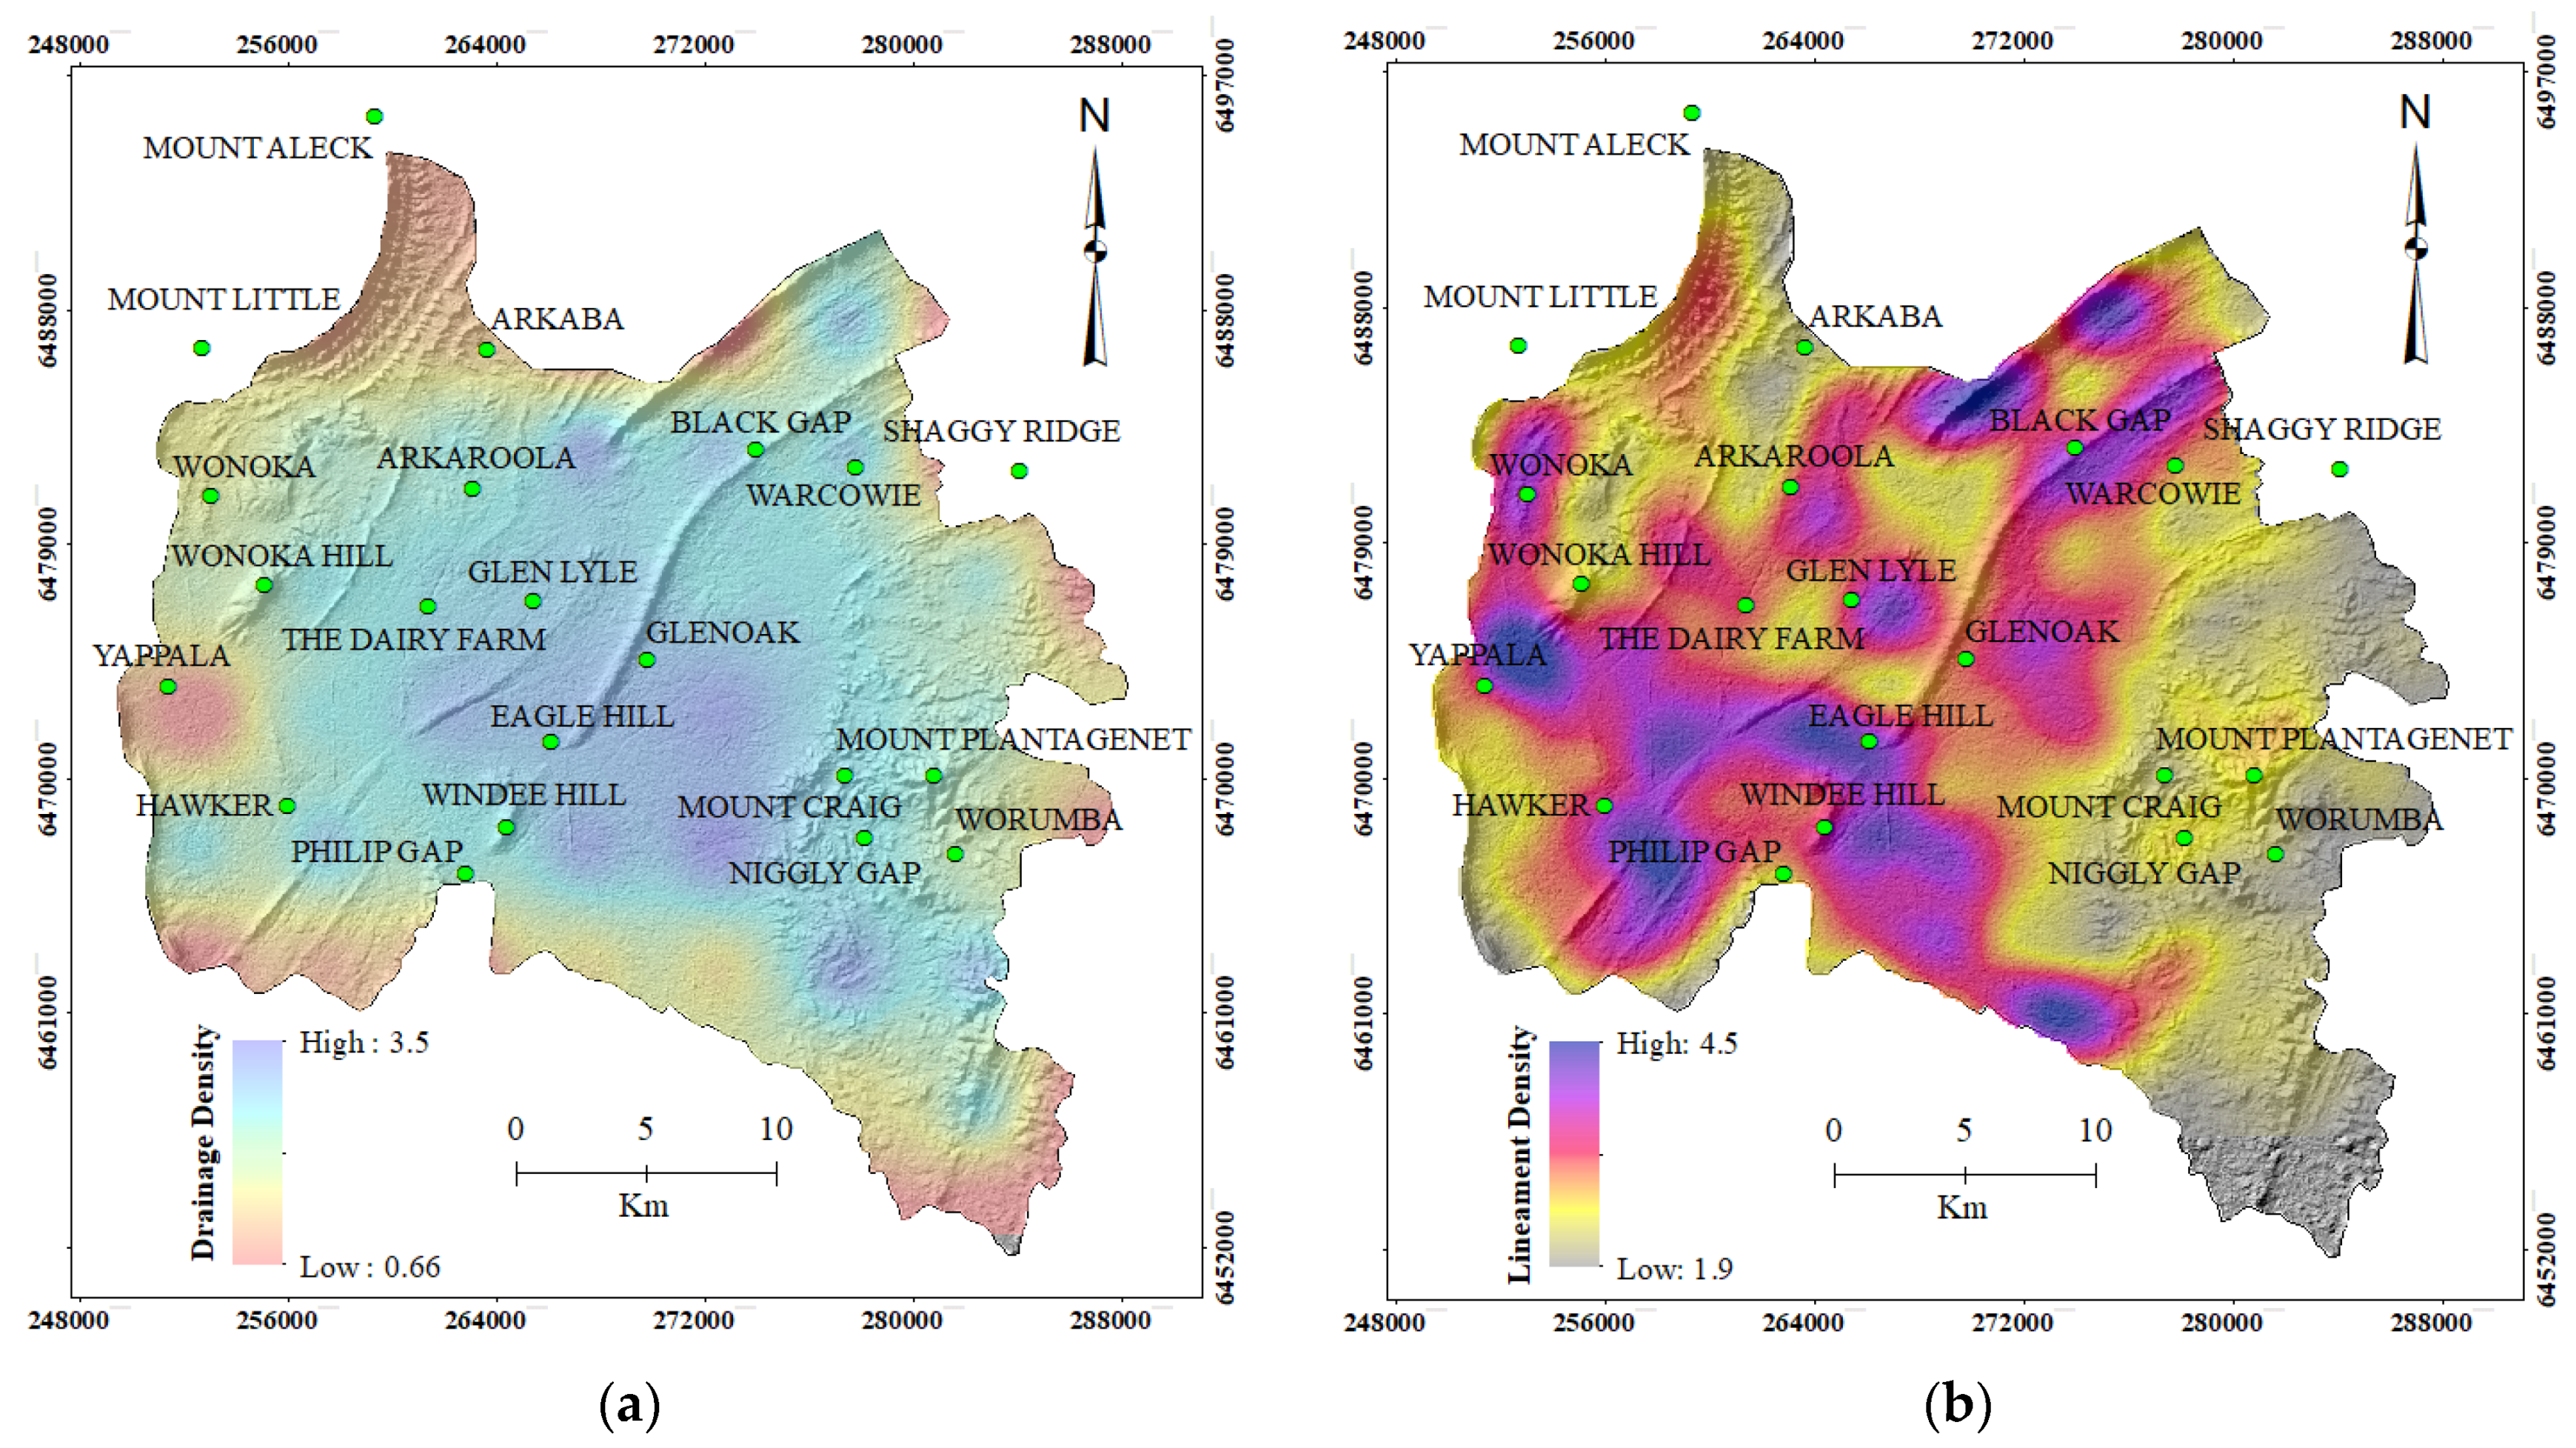
3.1.1. Drainage and Drainage Density

The nature, shape, and density of drainage are essential factors that can affect the runoff, flow, and recharge of groundwater [26]. The results indicated that the watershed shows a dendritic drainage pattern; the total area (A) of the watershed is 916.4 km2 and length (LB) is 49.5 km (Figure 6a). Using the method proposed by Strahler (1964), the watershed was found to comprise a six-order pattern with a total of 2646 streams, of which nearly 50.36% are first order, 23.15% are second order, 12.71% are third order, 7.22% are fourth order, 3.63% are fifth order and 0.03% are sixth order streams (Table 2).
The total length of all streams was 2589.6 km and ranged from 1280 km to 71 km for the first order and sixth order, respectively (Table 4). It was evident that the first order streams had the greatest total length of stream segments and, consequently, the length decreased as the stream order increased. Length of streams is a significant hydrological factor as it reflects the runoff characteristics and, hence, is related to recharging aquifers. Streams of smaller length are characterized by steep slopes, good runoff, and low recharge, while streams with longer lengths are commonly indicative of a smoother slope, low runoff, and good recharge. This change in stream length for the different orders indicated the impact of altitude, lithological variations, and slopes. More importantly, it indicated the hydrological characteristics of the underlying rock of the different stream orders in the study area [36].
Drainage density (D) was introduced by Horton (1945) as the total length of the stream per unit area. Drainage density provides a quantitative measure of the average length of streams in the whole basin. Greenbaum (1985) defined the drainage density (Dd) as the total drainage length of the drainage in a unit area. It is expressed as
D d   = i = 1 i = n S i A
where i = 1 i = n S i denotes the total length of the drainage, and A is the unit of the area. The calculated drainage density of the study area was 2.83 km/km2 (Figure 6a). Drainage density values could be linked to the permeability of the dominant landcover, topography, and vegetation [37,38,39]. Based on the findings, the drainage density in the study area was classified into five categories: very good, good, moderate, poor, and very poor density. Generally, low drainage density is more likely to dominate in highly permeable, dense vegetation, and low relief areas, while high drainage density occurs in low permeable, less vegetation, and high relief areas [40]. Accordingly, high drainage areas have less water infiltration, whereas low-density areas have high water infiltration to the aquifers [41].

3.1.2. Lineament and Lineament Density

Two main directions, NE–SW and E–W, were identified from the images. The orientations of the lineaments matched the faults-oriented NE–SW throughout the study area. The lineament length distribution obtained from Landsat images showed that the lineament lengths were highly variable (SD = 775 m), with a mean length of about 1338 m (Figure 6b). The lineament length distribution reflects high variability in lineament length and number, which can be attributed to the geological characteristics of the study area (Figure 6b).
Lineament density is considered a useful tool to identify “hot spots” of groundwater recharge potentiality [42,43,44]. Lineament density (Ld) is defined as the total lineament length in a unit area. It is expressed as
L d = i = 1 i = n A L i
where i = 1 i = n L i denotes the total length of lineaments and A is the unit area.
The highest densities were identified in the northeast and southwest, and around the Hawker town (Figure 6b). The lineament densities in this study area were quite high, which can be attributed to the geologic setting of the study area.

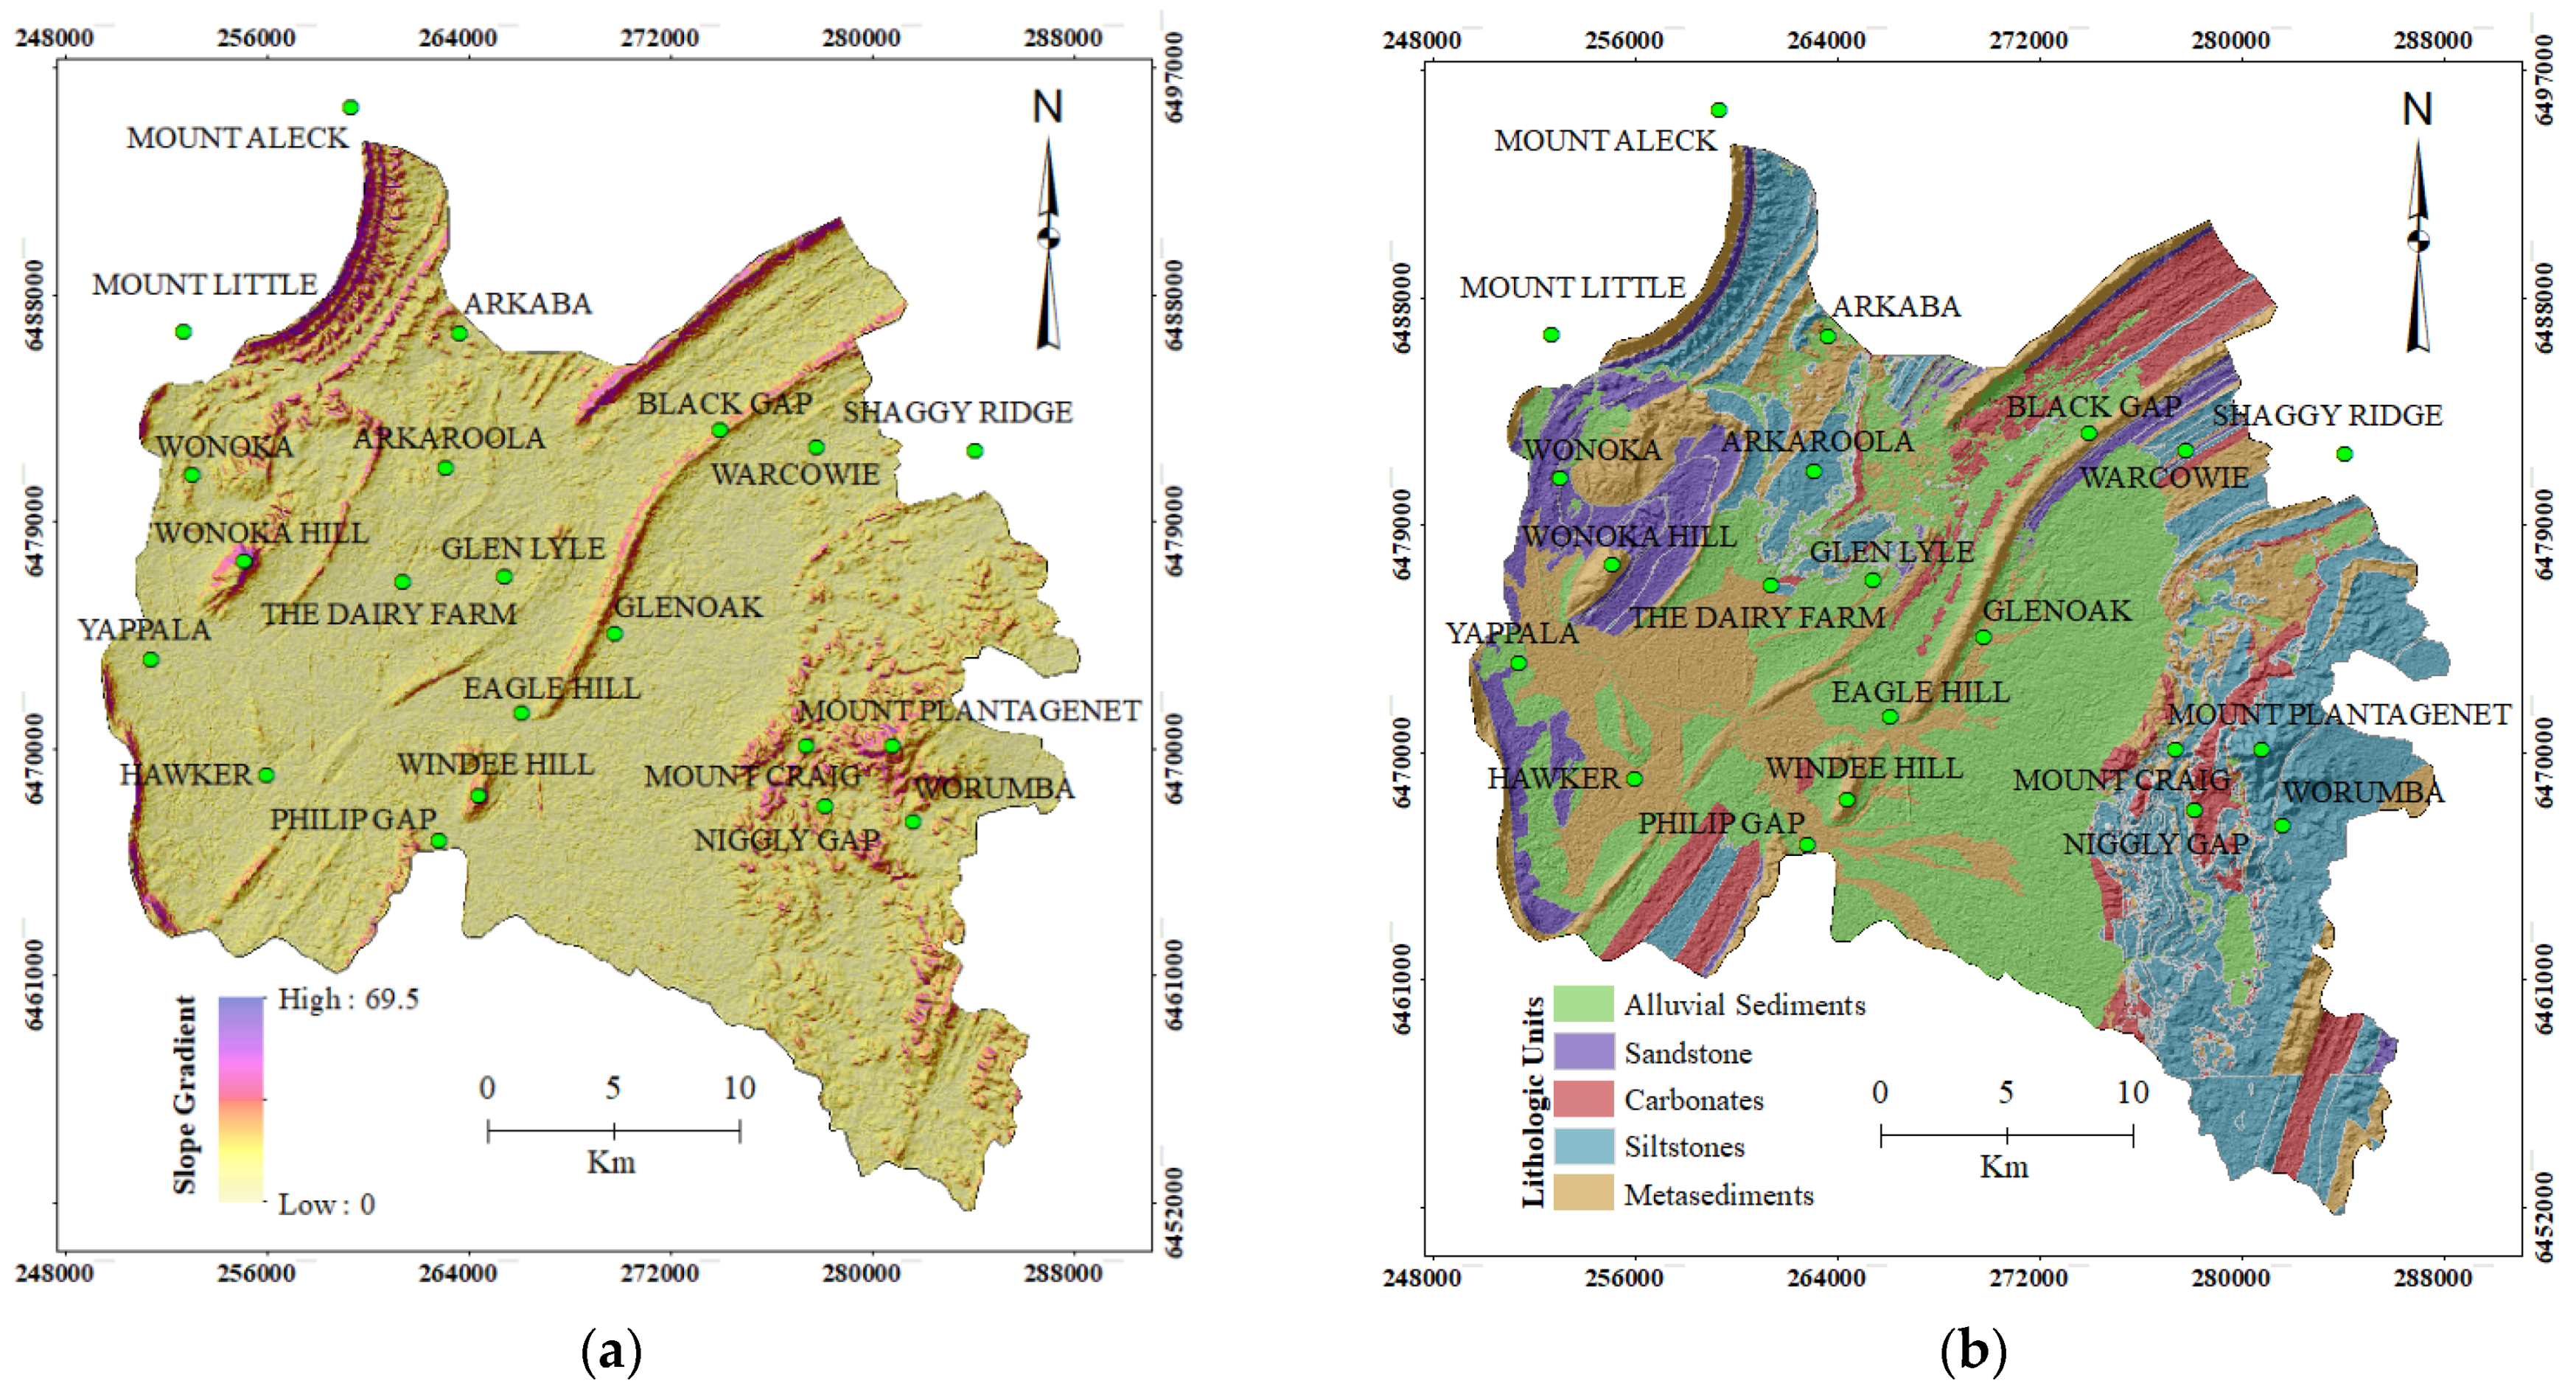
3.1.3. Topographic and Slope Features

The relief ratio (Rr) was introduced to express the difference between the highest and the lowest elevation of the basin [45]. The maximum elevation of the basin was 1000 m and the lowest was 250 m; therefore, the relief of the basin was 750 m. The relief ratio for this area was 0.02, which indicated a moderate topographic nature. The relief ratio and the elongated ratio of the watershed implied low resistance and more erosion and weathering processes, which are positive for groundwater potential [36].
Basin slope (Sb) is another influencing factor, which is mainly controlled by climate processes in areas outcropped by different lithologies [46,47]. In the present study, based on the degree of the slope, the watershed was classed into gentle (<10°), moderate (10–20°), and steep (>20°). Gentle slopes were classified as “good” for groundwater recharge as nearly flat terrain is the most favorable for infiltration (Figure 7a). Moderate slopes were categorized as “moderate” for groundwater recharge due to their slightly undulating topography, which permits partial runoff. Steep slopes allow high surface runoff and a negligible amount of infiltration and, therefore, were assigned to the “poor” category for groundwater recharge.

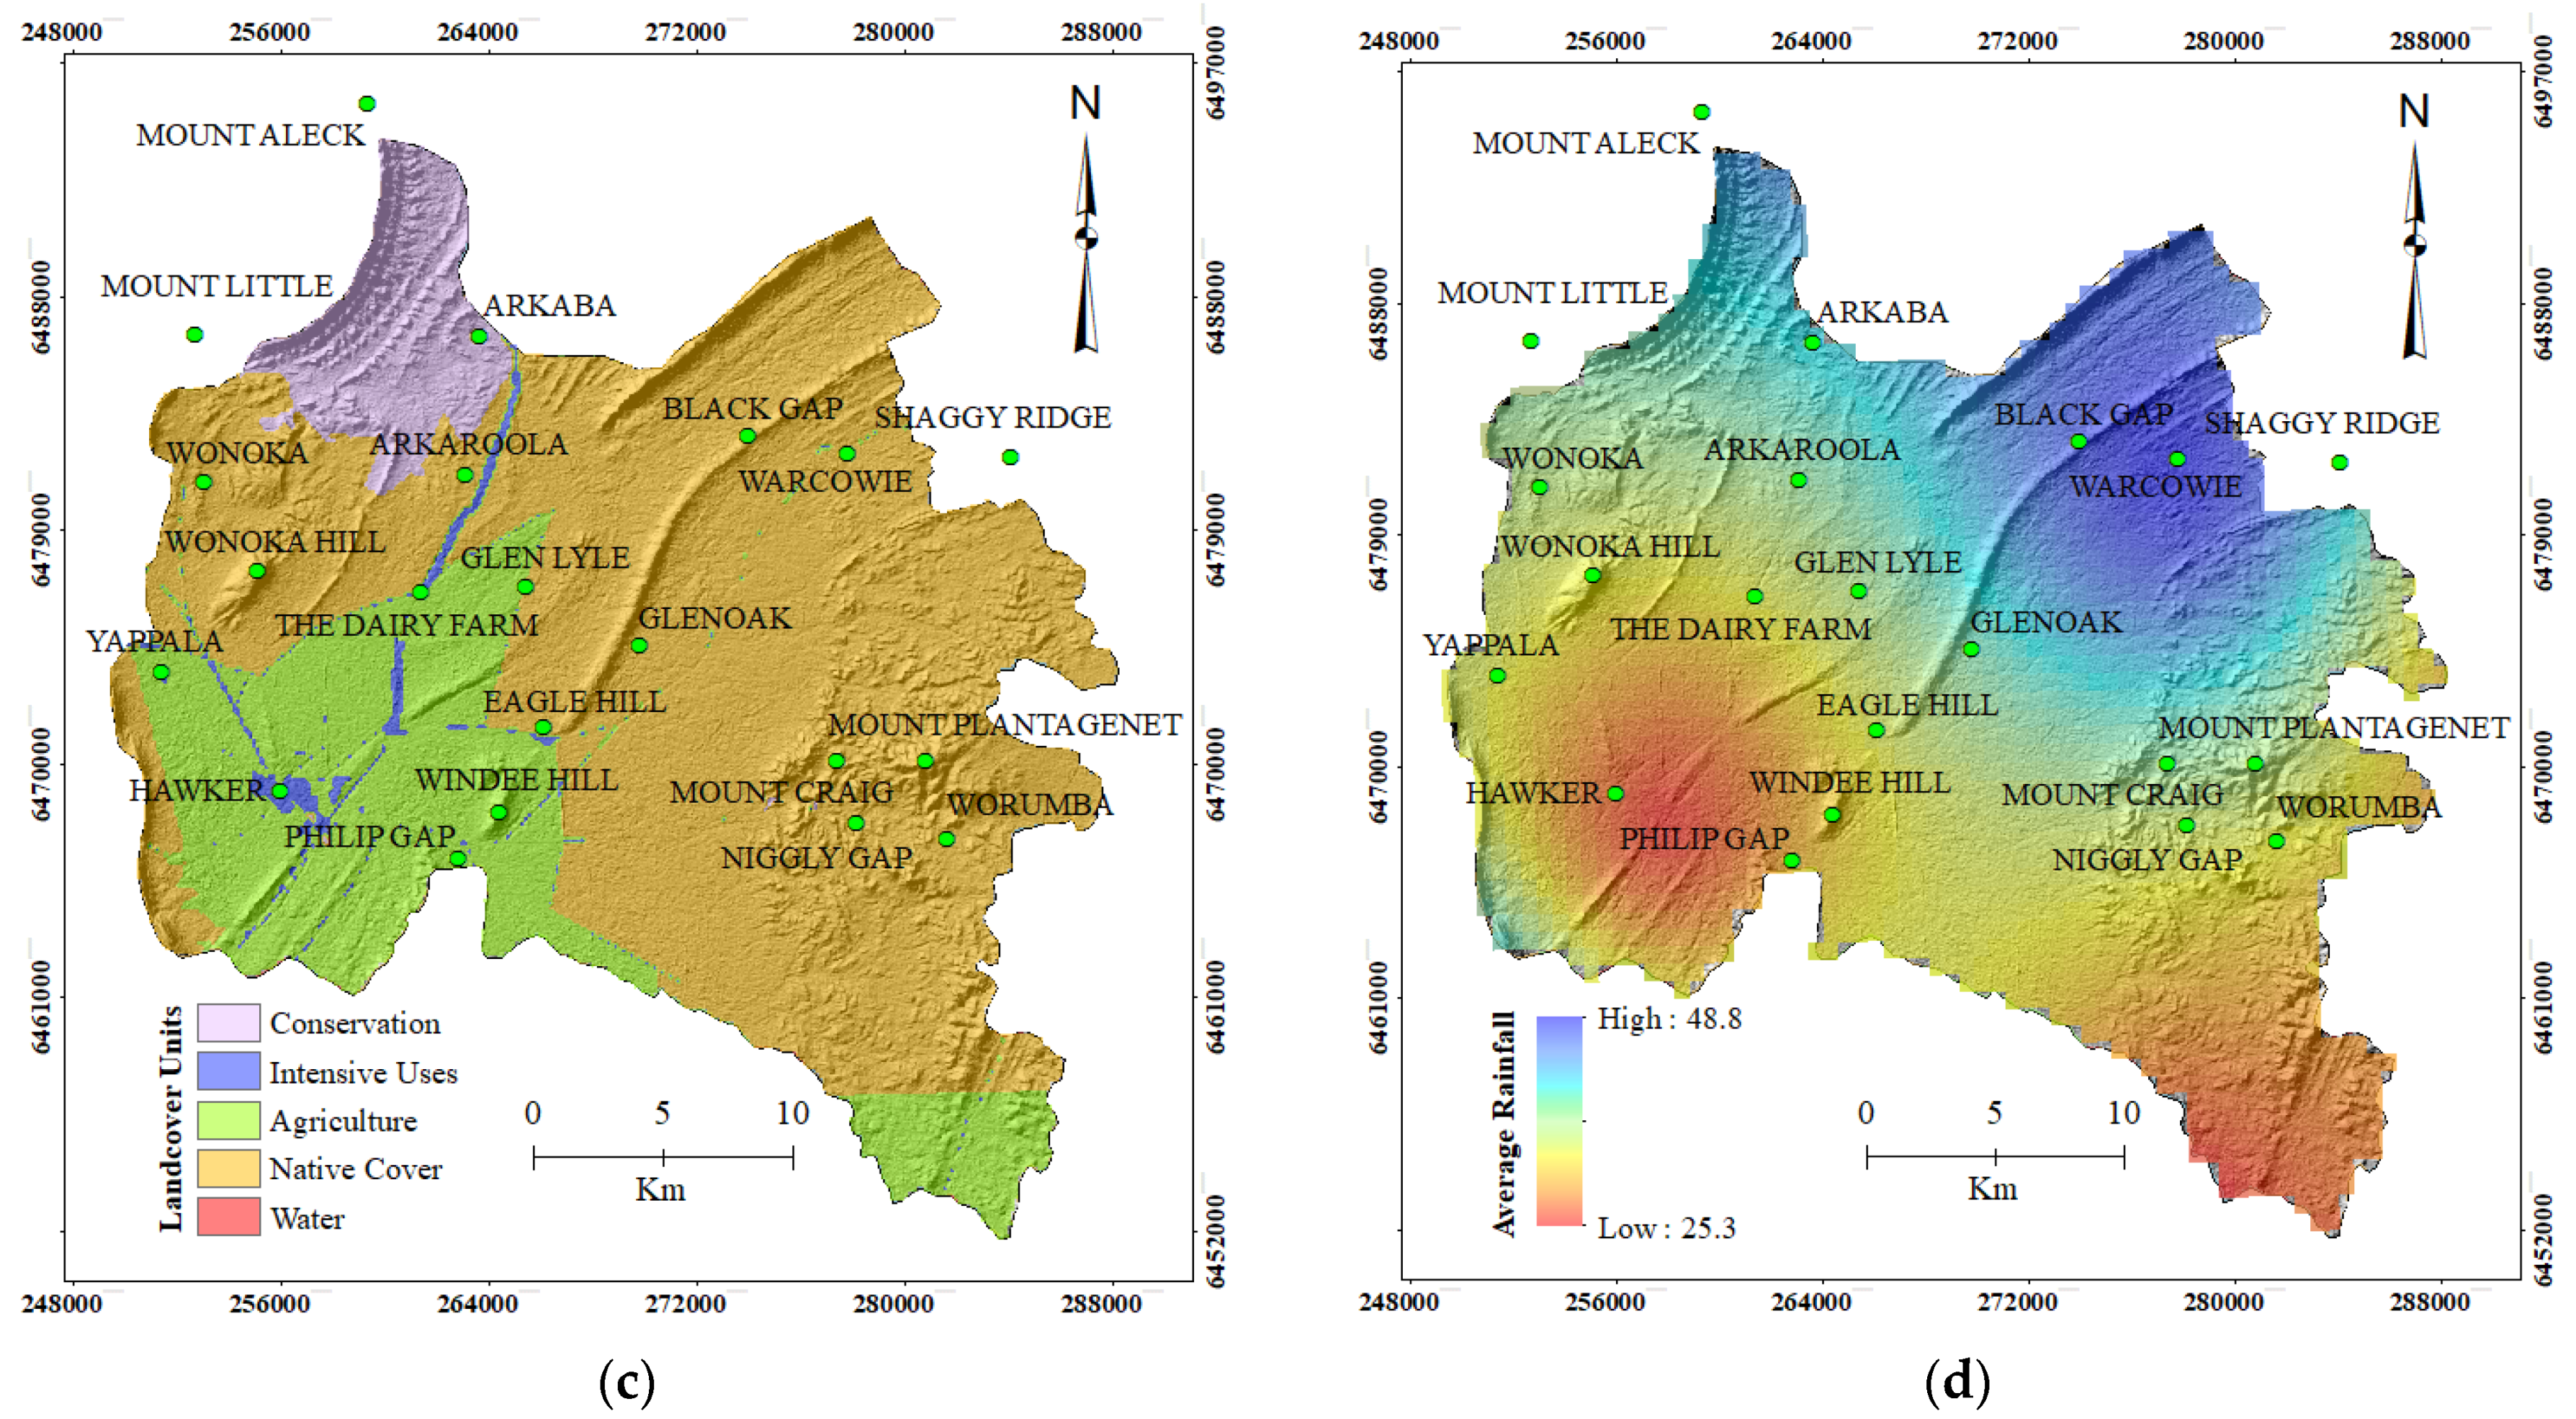
3.1.4. Lithology and Landcover
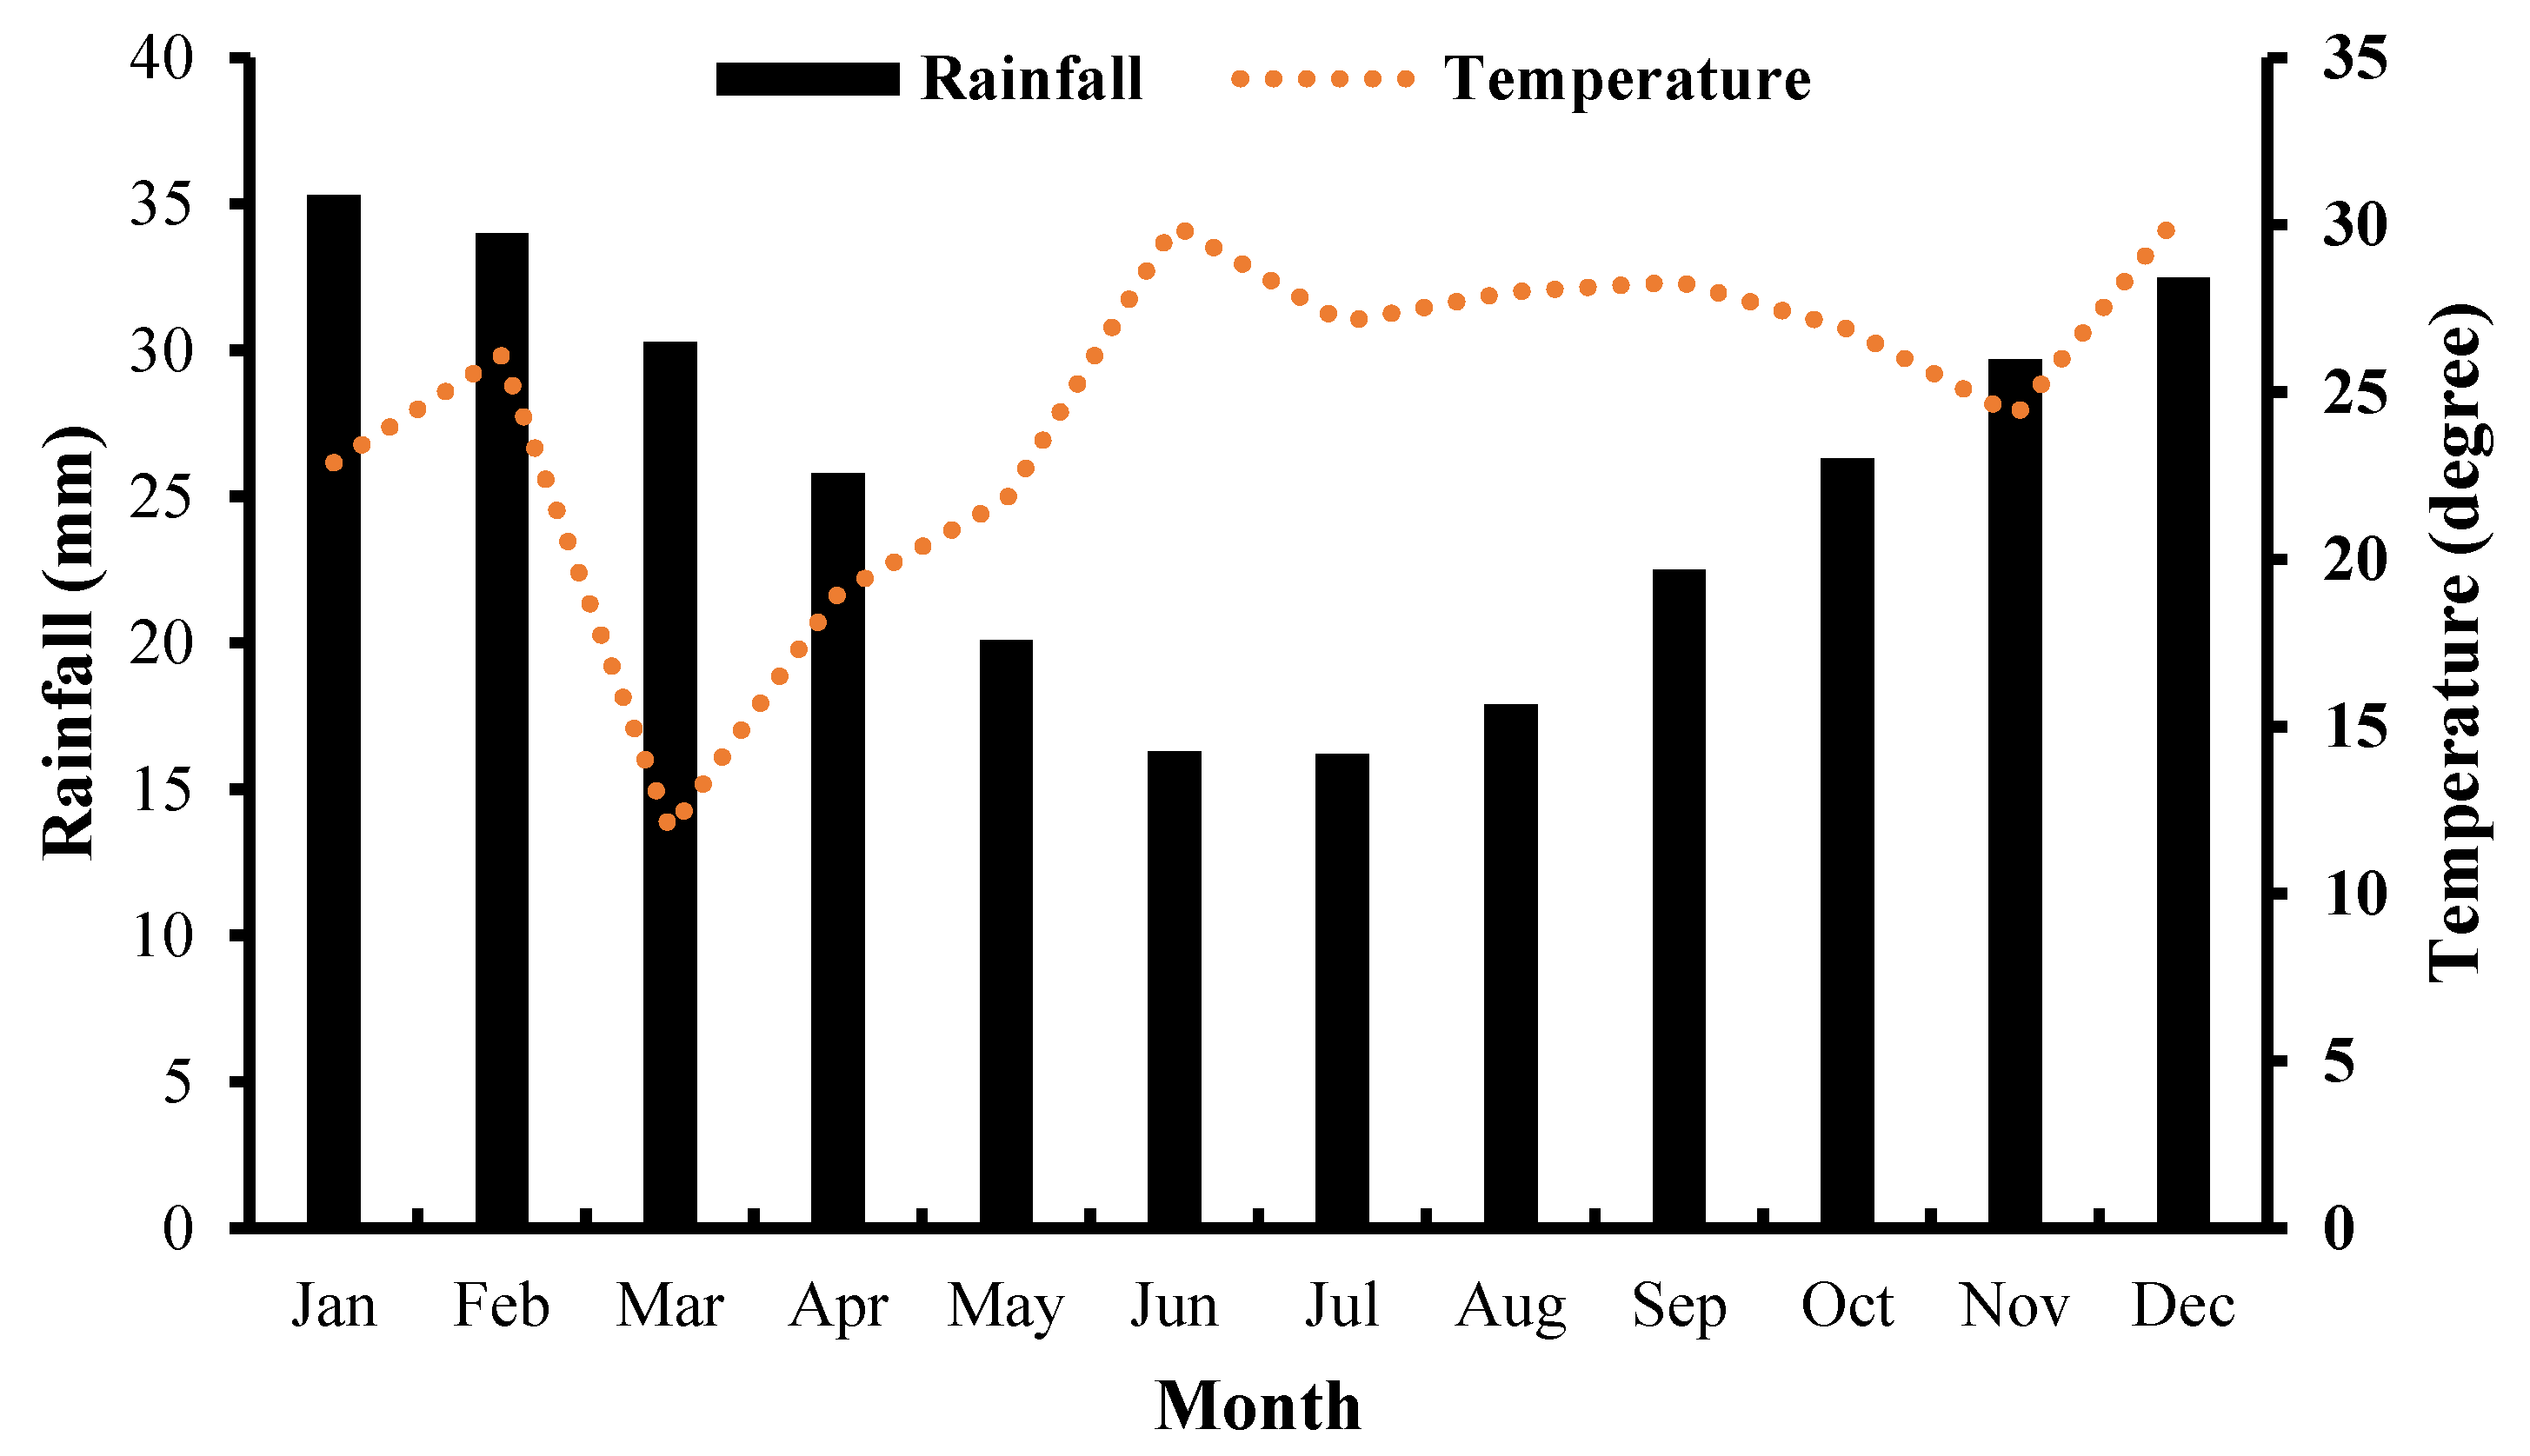
In the Hawker Area, while the lithological log data for the wells was not available, the lithological grouping was decided based on detailed available geological maps. The geological map of the study area revealed that the high elevation features are covered by metasediments, quartzite, sandstone, limestone, shale, and siltstone, and the lower elevation areas are dominated by recent alluvial sediments (Figure 7b). Different rock formations were assigned rankings based on their recharge potential properties. Generally, massive unfractured lithologic units have little influence on groundwater recharge potentiality, while alluvial and sandstones with secondary porosity form a good potential groundwater zone.
The landuse/cover is a significant factor that can influence the recharge, infiltration, and runoff process of the groundwater regime [48]. In Figure 7c, the primary landuse/cover is composed of grazing native vegetation (68.55%), agriculture and plantations (22.29%), conservation and natural environments (7.26%), industrial (1.90%), and water (<1%). Due to the high potentiality to recharge and the storage of groundwater, water bodies were assigned the highest weightage. Lower weightage was allocated to industrial lands due to their poor water holding capacity and less infiltration. Agricultural areas were given moderate weightage factors and native covers were allocated the highest weightage due to their ability to reduce the speed of water flow and increase the time duration for infiltration.

3.1.5. Rainfall

In arid areas, rainfall is considered as one of the most influential factors in groundwater recharge capability [49]. Processes such as precipitation, evapotranspiration, and percolation can control the water availability at the land surface [35]. As mentioned earlier, rainfall is the main source for the aquifers’ recharge in the study area. The climate of the area is classified as arid to semi-arid with a high variation in rainfall. The average annual rainfall of the study area ranges from 35 to 50 mm. Accordingly, the annual rainfall is classified into five classes. Higher rainfall potentially infiltrates into the soil and is stored in the aquifers (Figure 7d). The rainfall distribution map indicates that the annual rainfall is higher in the high topographic areas than in the low topographic areas. Rainfall is typically regular in the hillslope areas in contrast to the foothill areas [50].

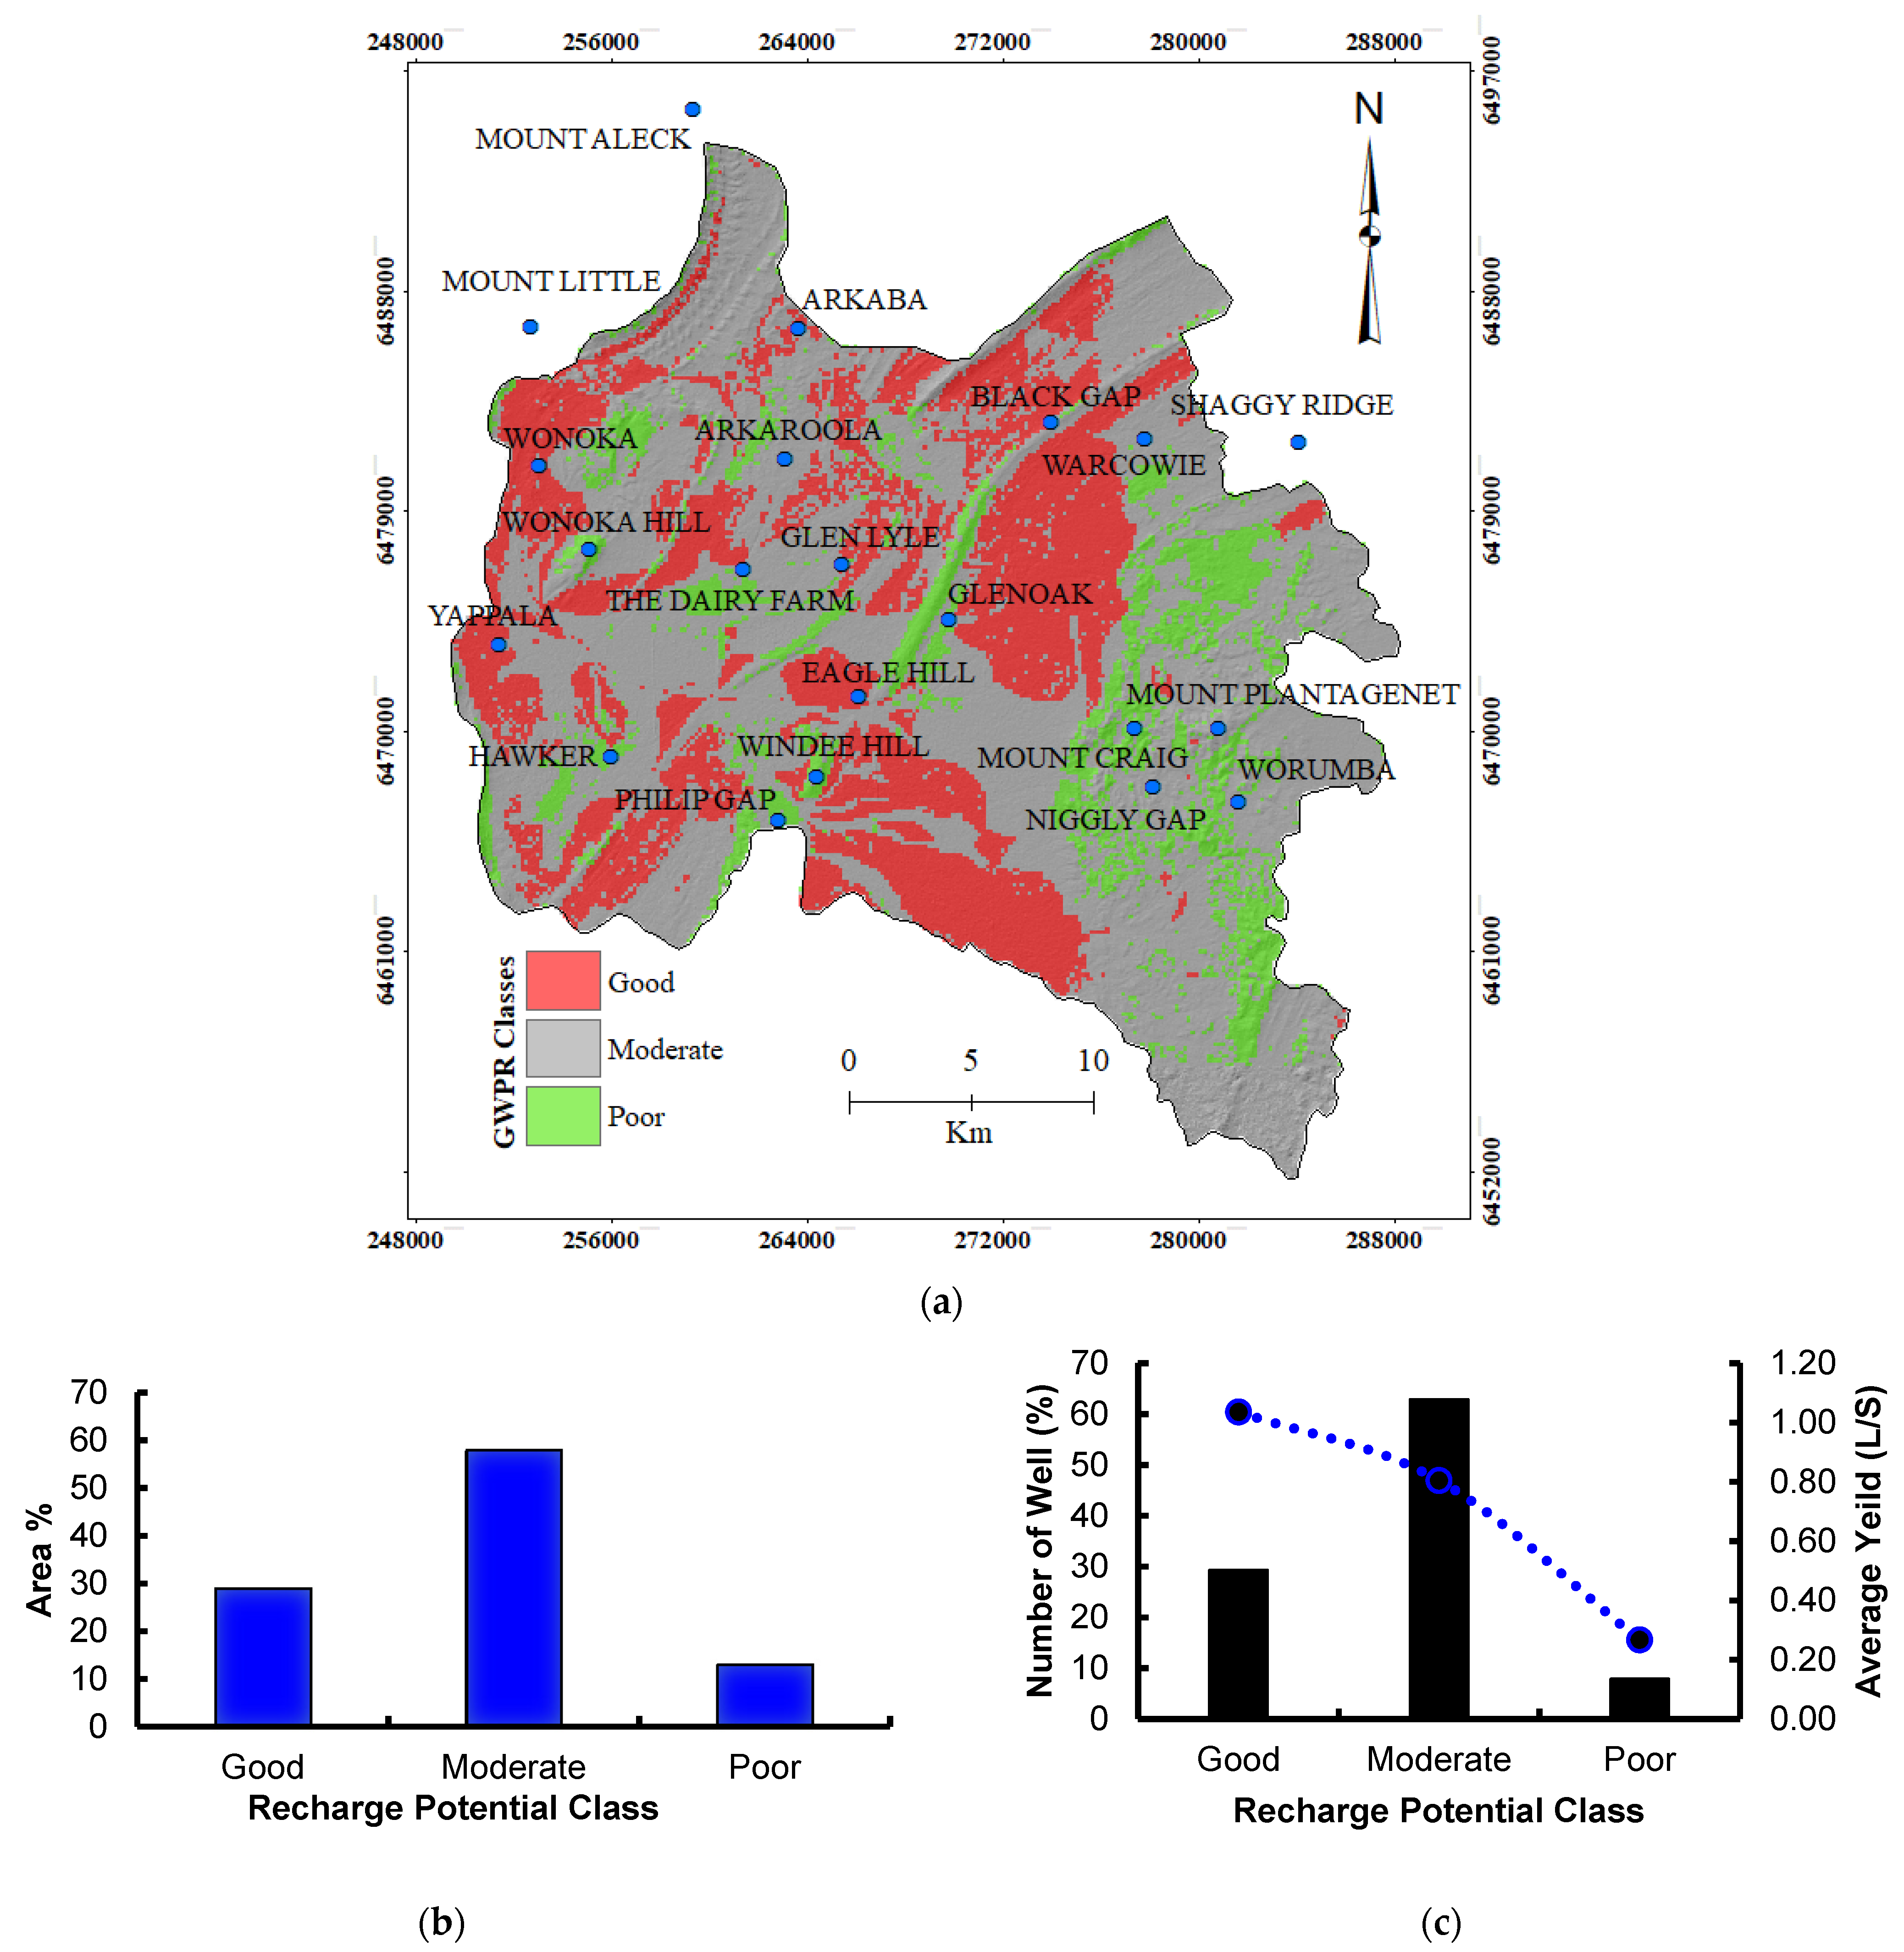
3.2. Recharge Potential Model

By classifying and implementing the MIF approach, the final map of the GWRP was produced, and grouped into three classes (good, moderate, and low) (Figure 8a). It was observed that about 28.97%, 58%, and 13.03% of the areas fall under good, moderate, and low groundwater potential zones, respectively (Figure 8b). Good groundwater potential zones were observed in the central, western, and small parts of the eastern areas due to the distribution of low slope, high drainage density, alluvial sediments, high lineament density, and natural and agricultural land. Medium and low groundwater potential recharge zones existed mainly in elevated areas in the southern and eastern parts of the study area where higher slopes and siltstone are the main lithology.

3.3. Verification of the Recharge Potential Model

For the purpose of verification, validation of the groundwater potential map was undertaken using water yield data from the study area (Figure 8b,c). The water yield data was used to statistically demonstrate the failure and success relative to each obtained class of recharge potential. The results showed that 29.29% of the wells with a high water yield (mean = 1.04 L/S) are sited on good areas, 62.86% with moderate yield (mean = 0.80 L/S) are located on moderate areas, and 7.86% are on poor groundwater potential recharge zones (Figure 8).

4. Discussions

Influencing factors related to groundwater recharge potentiality were selected and weighted in order to identify favorable zones for recharge using the RS, GIS, and MIF approach. The findings indicated that the groundwater regime of arid regions is mainly controlled by the topography, geology, fracture systems, and climatic conditions. As shown in this study, the various groundwater potential recharge zones are distributed along the study area. The northern and western parts near lineaments with low drainage density, and where secondary structures and alluvial lithology are located, are characterized as good groundwater potential recharge areas (Figure 9). The central areas, which are dominated by a low lineament density and high slope features, are classified as low recharge potential areas. This variability in groundwater potentiality can be attributed to many geological factors [8,10,51]. Lineaments, as a structural weakness, could play an essential role in groundwater potential recharge zones by increasing the infiltration capacity of the soil, and facilitating the groundwater flow and movement [26,49]. In addition, the occurrence of lithologic units with high permeability such as alluvial sediments could increase groundwater storage and yields [52]. These directly impact water infiltration and percolation [23,53]. This infiltration capacity could also be influenced by the dominant slope gradient. Gentle slopes promote groundwater recharging potentiality by providing sufficient time for infiltration, while areas with steep slopes permit low recharging due to rapid flow and low infiltration capacity [15]. Drainage density is considered another significant factor in identifying recharge sites because of its influence on surface runoff. The occurrence of a dense drainage system indicates high water permeability zones in the region [54].
The effects of the combination of these influencing factors on controlling the groundwater regime contribute to the recharge potentiality of different aquifers. Areas with good to moderate groundwater potential zones can attribute this to the lithology, slope, and drainage density territories. This classification could, thus, provide preferred targets for groundwater exploration since it combines several hydrogeological features that could affect groundwater availability. The findings from this study are comparable to the findings of other recharge potential studies in many areas around the world [15,20,24,27,55].
However, it is important to note that the delineation of the recharge potential map using the MIF method might not be a better reflection of the realities on the ground. This study was limited by the absence of recent drilling flows to validate the sensitivity of the results. However, it appeared that the drilling program was not optimized and suffered from a lack of preliminary investigation of groundwater availability. This was evident when comparing the locations of the wells throughout the study area. The siting of boreholes in relation to the local topography and, occasionally, to local fractures is the most common drilling method. In many cases, however, social factors such as the location of the house to be supplied or the boundary of the property determine the siting of the borehole. As a result, the validation of the groundwater potential map should be improved using recent drilling data in order to better evaluate the realities on the ground. In addition, the delineation of a good recharge potential zone does not assure a 100% success rate in drilling, even if the prospect appeared to be promising and verified by available water yield data. In-depth investigation is required within the proposed approach to overcome the limitation encountered from the hypothetical interpolations of surface data.

5. Conclusions

This study obtained a groundwater recharge potential map of the Hawker Area in the Flinders Ranges, South Australia, using a GIS, RS, and MIF approach. Analysis of the results provides ample information and analysis for decision makers. Integration of thematic maps such as drainage density, lithology, slope, landcover, rainfall, and lineament density could present valuable information for local authorities and planners regarding suitable areas for groundwater recharge potentiality in the Flinders Ranges.
The results showed that the most promising groundwater recharge potential zones are located in areas with high lineament density, low drainage density, and gentle slopes. Furthermore, the data analysis suggested that alluvial sediments and sandstone have high infiltration capacity. The areas that are least effective for groundwater recharge are underlain by shale and siltstone, and have low lineament density. This was validated by the correlation between water yield and the recharge potential categories. Through the integration of GIS, RS, and MIF, along with other hydrological characteristics of the drainage basin, the strategy of identifying and selecting groundwater recharge zones could provide better groundwater management plans.
Based on the present study, a number of future investigations are suggested. To start with, lineament zones need to be investigated in more detail. The focus should be on classifying, categorizing, and exploring these lineaments by means of drilling and field mapping both across their width and along the strike. Additionally, lithological data for most of the wells are not available; therefore, further data are required to develop a feasible interpretation of the recharge potential mapping. Moreover, a detailed investigation of the water chemistry and water level should be undertaken to understand the impacts of lithology and water rock interactions to give more meaningful results. This can be achieved by installing new piezometers in the monitoring boreholes to obtain hydraulic head data for a better understanding of the flow directions. Finally, building on different applied approaches and models such as the analytical hierarchy method (AHP) and frequency ration (FR), and optimizers such as UCODE or hydroPSO, as well as sensitivity analysis, could provide more meaningful results for practical applications [56,57,58].

Author Contributions

Conceptualization, original draft preparation and editing, A.A. (Alaa Ahmed); methodology, investigation, editing, A.A. (Abdullah Alrajhi); and editing and funding, A.S.A. All authors have read and agreed to the published version of the manuscript.

Funding

This research received no external funding.

Institutional Review Board Statement

Not applicable.

Informed Consent Statement

Not applicable.

Data Availability Statement

Not applicable.

Acknowledgments

The authors would like to thank Abdullatif Lacina, University of South Australia for help in editing, revision, and improvement of the manuscript.

Conflicts of Interest

The authors declare that they have no known competing financial interests or personal relationships that could have appeared to influence the work reported in this paper.

References

  1. Barnett, S.; Harrington, N.; Cook, P.; Simmons, C.T. Groundwater in Australia: Occurrence and Management Issues. In Sustainable Groundwater Management; Springer: Berlin/Heidelberg, Germany, 2020; pp. 109–127. [Google Scholar]
  2. Pigram, J. Australia’s Water Resources: From Use to Management; CSIRO Publishing: Clayton South, Australia, 2007. [Google Scholar]
  3. Selvam, S.; Magesh, N.; Chidambaram, S.; Rajamanickam, M.; Sashikkumar, M. A GIS based identification of groundwater recharge potential zones using RS and IF technique: A case study in Ottapidaram taluk, Tuticorin district, Tamil Nadu. Environ. Earth Sci. 2015, 73, 3785–3799. [Google Scholar] [CrossRef]
  4. Souissi, D.; Msaddek, M.H.; Zouhri, L.; Chenini, I.; El May, M.; Dlala, M. Mapping groundwater recharge potential zones in arid region using GIS and Landsat approaches, southeast Tunisia. Hydrol. Sci. J. 2018, 63, 251–268. [Google Scholar] [CrossRef]
  5. Magesh, N.S.; Chandrasekar, N.; Soundranayagam, J.P. Delineation of groundwater potential zones in Theni district, Tamil Nadu, using remote sensing, GIS and MIF techniques. Geosci. Front. 2012, 3, 189–196. [Google Scholar] [CrossRef] [Green Version]
  6. Ahmed, A.A.; Shabana, A.R. Integrating of remote sensing, GIS and geophysical data for recharge potentiality evaluation in Wadi El Tarfa, eastern desert, Egypt. J. Afr. Earth Sci. 2020, 172, 103957. [Google Scholar] [CrossRef]
  7. Edet, A.; Teme, S.; Okereke, C.; Esu, E. Lineament analysis for groundwater exploration in Precambrian Oban massif and Obudu plateau, SE Nigeria. In Proceedings of International Journal of Rock Mechanics and Mining Sciences and Geomechanics Abstracts; Elsevier Science: Amsterdam, The Netherlands, 1996; p. 215A. [Google Scholar]
  8. Solomon, S.; Quiel, F. Groundwater study using remote sensing and geographic information systems (GIS) in the central highlands of Eritrea. Hydrogeol. J. 2006, 14, 1029–1041. [Google Scholar] [CrossRef] [Green Version]
  9. Sander, P. Lineaments in groundwater exploration: A review of applications and limitations. Hydrogeol. J. 2007, 15, 71–74. [Google Scholar] [CrossRef]
  10. Corgne, S.; Magagi, R.; Yergeau, M.; Sylla, D. An integrated approach to hydro-geological lineament mapping of a semi-arid region of West Africa using Radarsat-1 and GIS. Remote Sens. Environ. 2010, 114, 1863–1875. [Google Scholar] [CrossRef]
  11. Eilers, V.; Carter, R.C.; Rushton, K.R. A single layer soil water balance model for estimating deep drainage (potential recharge): An application to cropped land in semi-arid North-east Nigeria. Geoderma 2007, 140, 119–131. [Google Scholar] [CrossRef] [Green Version]
  12. Maliva, R.G.; Clayton, E.A.; Missimer, T.M. Application of advanced borehole geophysical logging to managed aquifer recharge investigations. Hydrogeol. J. 2009, 17, 1547–1556. [Google Scholar] [CrossRef]
  13. Daesslé, L.; Pérez-Flores, M.; Serrano-Ortiz, J.; Mendoza-Espinosa, L.; Manjarrez-Masuda, E.; Lugo-Ibarra, K.; Gómez-Treviño, E. A geochemical and 3D-geometry geophysical survey to assess artificial groundwater recharge potential in the Pacific coast of Baja California, Mexico. Environ. Earth Sci. 2014, 71, 3477–3490. [Google Scholar] [CrossRef]
  14. Chenini, I.; Msaddek, M.H.; Dlala, M. Hydrogeological characterization and aquifer recharge mapping for groundwater resources management using multicriteria analysis and numerical modeling: A case study from Tunisia. J. Afr. Earth Sci. 2019, 154, 59–69. [Google Scholar] [CrossRef]
  15. Singh, S.K.; Zeddies, M.; Shankar, U.; Griffiths, G.A. Potential groundwater recharge zones within New Zealand. Geosci. Front. 2019, 10, 1065–1072. [Google Scholar] [CrossRef]
  16. Fagbohun, B.J. Integrating GIS and multi-influencing factor technique for delineation of potential groundwater recharge zones in parts of Ilesha schist belt, southwestern Nigeria. Environ. Earth Sci. 2018, 77, 1–18. [Google Scholar] [CrossRef]
  17. Lentswe, G.B.; Molwalefhe, L. Delineation of potential groundwater recharge zones using analytic hierarchy process-guided GIS in the semi-arid Motloutse watershed, eastern Botswana. J. Hydrol. Reg. Stud. 2020, 28, 100674. [Google Scholar] [CrossRef]
  18. Vishwakarma, A.; Goswami, A.; Pradhan, B. Prioritization of sites for Managed Aquifer Recharge in a semi-arid environment in western India using GIS-Based multicriteria evaluation strategy. Groundw. Sustain. Dev. 2021, 12, 100501. [Google Scholar] [CrossRef]
  19. Senanayake, I.; Dissanayake, D.; Mayadunna, B.; Weerasekera, W. An approach to delineate groundwater recharge potential sites in Ambalantota, Sri Lanka using GIS techniques. Geosci. Front. 2016, 7, 115–124. [Google Scholar] [CrossRef] [Green Version]
  20. Yeh, H.-F.; Cheng, Y.-S.; Lin, H.-I.; Lee, C.-H. Mapping groundwater recharge potential zone using a GIS approach in Hualian River, Taiwan. Sustain. Environ. Res. 2016, 26, 33–43. [Google Scholar] [CrossRef] [Green Version]
  21. Arabameri, A.; Rezaei, K.; Cerda, A.; Lombardo, L.; Rodrigo-Comino, J. GIS-based groundwater potential mapping in Shahroud plain, Iran. A comparison among statistical (bivariate and multivariate), data mining and MCDM approaches. Sci. Total Environ. 2019, 658, 160–177. [Google Scholar] [CrossRef] [PubMed]
  22. Arshad, A.; Zhang, Z.; Zhang, W.; Dilawar, A. Mapping favorable groundwater potential recharge zones using a GIS-based analytical hierarchical process and probability frequency ratio model: A case study from an agro-urban region of Pakistan. Geosci. Front. 2020, 11, 1805–1819. [Google Scholar] [CrossRef]
  23. Mukherjee, I.; Singh, U.K. Delineation of groundwater potential zones in a drought-prone semi-arid region of east India using GIS and analytical hierarchical process techniques. Catena 2020, 194, 104681. [Google Scholar] [CrossRef]
  24. Shaban, A.; Khawlie, M.; Abdallah, C. Use of remote sensing and GIS to determine recharge potential zones: The case of Occidental Lebanon. Hydrogeol. J. 2006, 14, 433–443. [Google Scholar] [CrossRef]
  25. Yeh, H.-F.; Lee, C.-H.; Hsu, K.-C.; Chang, P.-H. GIS for the assessment of the groundwater recharge potential zone. Environ. Geol. 2009, 58, 185–195. [Google Scholar] [CrossRef]
  26. Das, S.; Pardeshi, S.D. Integration of different influencing factors in GIS to delineate groundwater potential areas using IF and FR techniques: A study of Pravara basin, Maharashtra, India. Appl. Water Sci. 2018, 8, 1–16. [Google Scholar] [CrossRef] [Green Version]
  27. Ahmed, A.; Ranasinghe-Arachchilage, C.; Alrajhi, A.; Hewa, G. Comparison of Multicriteria Decision-Making Techniques for Groundwater Recharge Potential Zonation: Case Study of the Willochra Basin, South Australia. Water 2021, 13, 525. [Google Scholar] [CrossRef]
  28. Watt, E.; Berens, V. Non-Prescribed Groundwater Resources Assessment—Alinytjara Wilurara Natural Resources Management Region; Phase 1; South Australia Government Printer: Adelaide, Australia, 2011. [Google Scholar]
  29. Preiss, W.V. The Adelaide Geosyncline: Late Proterozoic Stratigraphy, Sedimentation, Palaeontology and Tectonics. In Geological Survey of South Australia Bulletin; South Australia Government Printer: Adelaide, Australia, 1987. [Google Scholar]
  30. Paul, E.; Flöttmann, T.; Sandiford, M. Structural geometry and controls on basement-involved deformation in the northern Flinders Ranges, Adelaide Fold Belt, South Australia. Aust. J. Earth Sci. 1999, 46, 343–354. [Google Scholar] [CrossRef]
  31. Preiss, W. The Adelaide Geosyncline of South Australia and its significance in Neoproterozoic continental reconstruction. Precambrian Res. 2000, 100, 21–63. [Google Scholar] [CrossRef]
  32. Backé, G.; Baines, G.; Giles, D.; Preiss, W.; Alesci, A. Basin geometry and salt diapirs in the Flinders Ranges, South Australia: Insights gained from geologically-constrained modelling of potential field data. Mar. Pet. Geol. 2010, 27, 650–665. [Google Scholar] [CrossRef]
  33. Hearon IV, T.E.; Rowan, M.G.; Lawton, T.F.; Hannah, P.T.; Giles, K.A. Geology and tectonics of Neoproterozoic salt diapirs and salt sheets in the eastern Willouran Ranges, South Australia. Basin Res. 2015, 27, 183–207. [Google Scholar] [CrossRef]
  34. Osei-Bonsu, K.; Dennis, K.J. Robe Township Water Supply Wellfield Evaluation; Department of Water, Land and Biodiversity Conservation, South Australia Government Printer: Adelaide, Australia, 2004. [Google Scholar]
  35. Agarwal, R.; Garg, P. Remote sensing and GIS based groundwater potential & recharge zones mapping using multi-criteria decision making technique. Water Resour. Manag. 2016, 30, 243–260. [Google Scholar]
  36. Sreedevi, P.; Sreekanth, P.; Khan, H.; Ahmed, S. Drainage morphometry and its influence on hydrology in an semi arid region: Using SRTM data and GIS. Environ. Earth Sci. 2013, 70, 839–848. [Google Scholar] [CrossRef]
  37. Jasmin, I.; Mallikarjuna, P. Satellite-based remote sensing and geographic information systems and their application in the assessment of groundwater potential, with particular reference to India. Hydrogeol. J. 2011, 19, 729–740. [Google Scholar] [CrossRef]
  38. Deepika, B.; Avinash, K.; Jayappa, K. Integration of hydrological factors and demarcation of groundwater prospect zones: Insights from remote sensing and GIS techniques. Environ. Earth Sci. 2013, 70, 1319–1338. [Google Scholar] [CrossRef]
  39. Arya, S.; Subramani, T.; Karunanidhi, D. Delineation of groundwater potential zones and recommendation of artificial recharge structures for augmentation of groundwater resources in Vattamalaikarai Basin, South India. Environ. Earth Sci. 2020, 79, 1–13. [Google Scholar] [CrossRef]
  40. Nag, S.; Ghosh, P. Delineation of groundwater potential zone in Chhatna Block, Bankura District, West Bengal, India using remote sensing and GIS techniques. Environ. Earth Sci. 2013, 70, 2115–2127. [Google Scholar] [CrossRef]
  41. Bagyaraj, M.; Ramkumar, T.; Venkatramanan, S.; Gurugnanam, B. Application of remote sensing and GIS analysis for identifying groundwater potential zone in parts of Kodaikanal Taluk, South India. Front. Earth Sci. 2013, 7, 65–75. [Google Scholar] [CrossRef]
  42. Tam, V.; De Smedt, F.; Batelaan, O.; Dassargues, A. Study on the relationship between lineaments and borehole specific capacity in a fractured and karstified limestone area in Vietnam. Hydrogeol. J. 2004, 12, 662–673. [Google Scholar] [CrossRef] [Green Version]
  43. Şener, B.; Süzen, M.L.; Doyuran, V. Landfill site selection by using geographic information systems. Environ. Geol. 2006, 49, 376–388. [Google Scholar] [CrossRef]
  44. Shankar, M.R.; Mohan, G. Assessment of the groundwater potential and quality in Bhatsa and Kalu river basins of Thane district, western Deccan Volcanic Province of India. Environ. Geol. 2006, 49, 990–998. [Google Scholar] [CrossRef]
  45. Schumm, S.A. Evolution of drainage systems and slopes in badlands at Perth Amboy, New Jersey. Geol. Soc. Am. Bull. 1956, 67, 597–646. [Google Scholar] [CrossRef]
  46. Sharma, K.; Singh, H.; Pareek, O. Rainwater infiltration into a bare loamy sand. Hydrol. Sci. J. 1983, 28, 417–424. [Google Scholar] [CrossRef] [Green Version]
  47. Fox, D.; Bryan, R.; Price, A. The influence of slope angle on final infiltration rate for interrill conditions. Geoderma 1997, 80, 181–194. [Google Scholar] [CrossRef]
  48. Bronstert, A.; Niehoff, D.; Bürger, G. Effects of climate and land-use change on storm runoff generation: Present knowledge and modelling capabilities. Hydrol. Process. 2002, 16, 509–529. [Google Scholar] [CrossRef]
  49. Ahmed, A.; El Ammawy, M.; Hewaidy, A.G.; Moussa, B.; Hafz, N.A. Mapping of lineaments for groundwater assessment in the Desert Fringes East El-Minia, Eastern Desert, Egypt. Environ. Monit. Assess. 2019, 191, 1–22. [Google Scholar] [CrossRef] [PubMed]
  50. Subyani, A.M. Geostatistical study of annual and seasonal mean rainfall patterns in southwest Saudi Arabia/Distribution géostatistique de la pluie moyenne annuelle et saisonnière dans le Sud-Ouest de l’Arabie Saoudite. Hydrol. Sci. J. 2004, 49. [Google Scholar] [CrossRef] [Green Version]
  51. Babiker, M.; Gudmundsson, A. The effects of dykes and faults on groundwater flow in an arid land: The Red Sea Hills, Sudan. J. Hydrol. 2004, 297, 256–273. [Google Scholar] [CrossRef]
  52. Benjmel, K.; Amraoui, F.; Boutaleb, S.; Ouchchen, M.; Tahiri, A.; Touab, A. Mapping of groundwater potential zones in crystalline terrain using remote sensing, GIS techniques, and multicriteria data analysis (Case of the Ighrem Region, Western Anti-Atlas, Morocco). Water 2020, 12, 471. [Google Scholar] [CrossRef] [Green Version]
  53. Zhu, Q.; Abdelkareem, M. Mapping groundwater potential zones using a knowledge-driven approach and GIS analysis. Water 2021, 13, 579. [Google Scholar] [CrossRef]
  54. Krishnamurthy, J.; Venkatesa Kumar, N.; Jayaraman, V.; Manivel, M. An approach to demarcate ground water potential zones through remote sensing and a geographical information system. Int. J. Remote Sens. 1996, 17, 1867–1884. [Google Scholar] [CrossRef]
  55. Chang, K.-T.; Weng, C.-I. An investigation into the structure of aqueous NaCl electrolyte solutions under magnetic fields. Comput. Mater. Sci. 2008, 43, 1048–1055. [Google Scholar] [CrossRef]
  56. Abdelaziz, R.; Merkel, B.J. Sensitivity analysis of transport modeling in a fractured gneiss aquifer. J. Afr. Earth Sci. 2015, 103, 121–127. [Google Scholar] [CrossRef]
  57. Dar, T.; Rai, N.; Bhat, A. Delineation of potential groundwater recharge zones using analytical hierarchy process (AHP). Geol. Ecol. Landsc. 2020, 1–16. [Google Scholar] [CrossRef] [Green Version]
  58. Abd Manap, M.; Nampak, H.; Pradhan, B.; Lee, S.; Sulaiman, W.N.A.; Ramli, M.F. Application of probabilistic-based frequency ratio model in groundwater potential mapping using remote sensing data and GIS. Arab. J. Geosci. 2014, 7, 711–724. [Google Scholar] [CrossRef]
Figure 1. Location of the study area showing the wells’ locations in the Hawker Area.
Water 13 02571 g001
Figure 2. Modern climate of the study area. Monthly average temperature (Red dotes) and precipitation (black column) at Hawker Weather Station (1980–2021). Data source: The Australia Bureau of Meteorology, http://www.bom.gov.au/) (accessed on 12 July 2021).
Water 13 02571 g002
Figure 3. Stratigraphic units in the study area [31,32,33].
Water 13 02571 g003
Figure 4. Materials and methods flowchart.
Water 13 02571 g004
Figure 5. The interactive influence of the selected factors.
Water 13 02571 g005
Figure 6. (a) Drainage Density and (b) Lineament density.
Water 13 02571 g006
Figure 7. (a) Slope in degrees, (b) lithology, (c) landcover, and (d) average rainfall in millimeters.
Water 13 02571 g007aWater 13 02571 g007b
Figure 8. (a) Recharge potential map, (b) Recharge potential classes’ areas and (c) Recharge potential classes against number of wells (%) and average yield.
Water 13 02571 g008
Figure 9. (a) Percentage of the water wells within the different classes of the influencing factors, (bd) Average of the water yield against the classes of the influencing factors.
Water 13 02571 g009
Table 1. Data and sources used for GWRP analysis for the Hawker Area.
Data/SoftwareDescriptionSourceThematic Layer
Aster GDEM14 spectral bands with a spatial resolution of 90 m in the thermal infrared (TIR), 30 m in the short-wave infrared (SWIR), and 15 m in the visible and near-infrared (VNIR).https://earthdata.nasa.gov/ (accessed on 12 July 2021)Drainage
Landsat Images9 spectral bands with a spatial resolution of 30 m for bands 1 to 7 and 9 and 15 m for band 8 (panchromatic).https://earthexplorer.usgs.gov/ (accessed on 12 July 2021)Lineaments
landuse
Topographic Map1:50,000https://map.sarig.sa.gov.au/ (accessed on 12 July 2021)Topography
Geologic Map1:250,000 Geology
Borehole data https://map.sarig.sa.gov.au/ (accessed on 12 July 2021)Water layers
Table 2. Reclassified values of the influencing factors on the recharge potentiality.
Influencing FactorMajor Effect (A)Minor Effect (B)Sum (A + B)Proposed Score of Each Factor
Lineament1 + 10219
Lithology1 + 10219
Drainage10.51.514
Landcover1 + 10.52.524
Slope10.51.514
Rainfall00.5 + 0.5110
∑10.5∑100
Table 3. Classification of weighted parameters influencing the groundwater potential zone (GWPZ).
ParameterZoneTotal ScoreIndividual Score
LithologyAlluvial sediments1919
Sandstones 15
Carbonates 11
Shale and siltstone 7
Metasediments 3
Lineament density (Km/Km)<0.05–0.251919
0.26–0.36 15
0.37–0.46 11
0.47–0.57 7
>0.58–0.79 3
Average slope (°)<21414
2.01–4.00 11
4.01–11 8
11.01–20.00 5
>30.00 2
Landuse and landcoverWater bodies 2424
Grazing 19
Agriculture 14
Conservation 9
Industrial 4
Drainage density (Km./Km.)Less than 0.251414
0.26–0.33 11
0.34–0.39 8
0.4–0.46 5
More than 0.46 2
Rainfall (mm)25–301010
30–35 8
35–40 6
40–45 4
45–50 2
Table 4. Morphometric aspects of the study area.
ParameterFormula1st2nd3rd4th5th6thTotal
Number of streamsNu295613597464242131725870
Number% 50.3623.1512.717.223.630.03
Stream lengthLu128064631719581712589
Mean lengthLsm = Lu/Nu0.430.480.420.460.380.41
Publisher’s Note: MDPI stays neutral with regard to jurisdictional claims in published maps and institutional affiliations.

