Article

Four-Year Monitoring Study of Shallow Landslide Hazards Based on Hydrological Measurements in a Weathered Granite Soil Slope in South Korea

Geo-Environmental Hazard Research Center, Geologic Environment Division, Korea Institute of Geoscience and Mineral Resources, Daejeon 34132, Korea
*
Author to whom correspondence should be addressed.
Water 2021, 13(17), 2330; https://doi.org/10.3390/w13172330
Submission received: 9 June 2021 / Revised: 17 August 2021 / Accepted: 23 August 2021 / Published: 25 August 2021
(This article belongs to the Section Hydrology)

Abstract

:
To build a comprehensive understanding of long-term hydro-mechanical processes that lead to shallow landslide hazards, this study explicitly monitored the volumetric water content (VWC) and rainfall amount for a weathered granite soil slope over a four year period. From the 12 operational landslide monitoring stations installed across South Korea, the Songnisan station was selected as the study site. VWC sensors were placed in the subsurface with a grid-like arrangement at depths of 0.5 and 1.0 m. Shallow landslide hazards were evaluated by applying an infinite slope stability model that adopted a previously proposed unified effective stress concept. By analyzing the variations in the monitored VWC values, the derived matric suctions and suction stresses, and the calculated factor of safety values, we were able to obtain numerous valuable insights. In particular, the seasonal effects of drainage and evapotranspiration on the slope moisture conditions and slope stability were addressed. Preliminary test results indicated that continuous rainfall successfully represented the derived matric suction conditions at a depth of 1.0 m in the lower slope, although this was not the case for the upper and middle slopes. The significance of a future study on cumulative field monitoring data from various sites in different geological conditions is highlighted.

1. Introduction

The threats posed by geological disasters to populations and societies worldwide have increased substantially over the past several decades [1]. Additionally, extreme weather events, which often intensify the severity of natural disasters, are occurring more frequently due to the global impact of climate change [2]. Landslides are one of the most common geological hazards in South Korea [3]. They are mainly caused by heavy rainfall [4], and exhibit different types of movements. In general, landslides are gravitational mass movements involving rocks, debris, and earth materials along a steep or gentle slope. A robust landslide monitoring system considering field performance and efficiency is required because of the diverse landslide types that include slides, falls, flows, spreads, and toppling rocks [5]. The design and implementation of a landslide monitoring system is dependent on the cause and type of the landslides. To avoid or mitigate landslide disasters related to economic and environmental impacts, an appropriate early warning system based on in-situ landslide monitoring at a local scale should be designed. Such a system can be robust and can help to plan hazard mitigation strategies regarding emergency plans, and evacuation scenarios, for landslides [6,7].
Detecting the timing and location of landslides is crucial for estimating landslide risks. These factors can be evaluated using various landslide measurements and evaluation techniques. Typical systems and techniques for landslide monitoring include: (a) remote sensing or satellite techniques, (b) ground-based geodetic techniques, (c) satellite-based geodetic techniques, and (d) geotechnical techniques. The first three techniques may be more suitable for active landslides, such as slow-moving landslides. Nonetheless, the last approach is used extensively and covers a wide range of landslide types [7,8,9,10]. In addition, fiber optic sensors are applicable to rockslides, and seismic noise and shear-wave velocity can be used as indicators of clay-rich mass movements [11,12]. An impending catastrophic landslide can also be estimated by predicting the velocity and acceleration of landslide displacement and the volume of landslide materials in the source area. This may be very useful for reactivated slopes. It is also possible to predict the landslide occurrence time and size in response to the velocity of mass movements using a large-scale laboratory flume [13]. This approach can be applied to reactivated slopes, such as clay-rich creep mass movement along pre-existing slip surfaces [14,15]. In reality, however, the approach is very complicated for weathered soil slopes. Slope failure often occurs when high intensity and prolonged precipitation overwhelm soil resistance. In geotechnical and hydrological techniques, the monitoring of deformation and meteorological parameters is crucial for landslide prediction. The monitoring sensors and parameters should be applied differently depending on the slope conditions. Typical geotechnical and hydro-mechanical sensors include crack meters, extensometers, inclinometers, geophones, piezometers, matric suction, strain gauges, tiltmeters, and volumetric water content. Matric suction and volumetric water content monitoring in unsaturated soils subjected to rainfall infiltration are essential for slope stability analyses [16,17,18,19,20,21].
A combination of rain gauges and volumetric water content sensors is an efficient and effective means of examining the slope stability of a weathered soil slope. This is because the change in water content is a sensitive response owing to the infiltration of water into the soil deposits on a natural slope. This combination can also influence the variations in matric suction in slopes. As a result, the safety factor can be calculated based on monitoring data. A similar concept to the LAndslide MOnitoring System (LAMOS) was designed by the Korea Institute of Geosciences and Mineral Resources (KIGAM). The KIGAM-LAMOS network is in operation at 12 different landslide monitoring stations across eight national parks in South Korea [4]. A comprehensive understanding of the relationship between rainfall and water content is vital for slope stability, especially for landslide monitoring systems at local scales. Thus, in this study, detailed monitoring analyses of long-term hydrological behavior on a slope were conducted. A study site was selected in the Mt. Songnisan National Park, where a KIGAM-LAMOS landslide monitoring station is located. Among the 12 KIGAM-LAMOS landslide monitoring stations, this study only analyzed the Songnisan station. This is due to the study focusing on the initial testing of a landslide monitoring framework and the initial stages of a long-term analysis of hydrological trends in slopes. In the Songnisan station, a total of 14 volumetric water content sensors were arranged in multiple subsurface locations in the longitudinal, transverse, and vertical directions to recognize locally different hydrological processes within a single slope. Rainfall and volumetric water content data collected from the Songnisan station during the four years from 2017 to 2020 were used in the analyses to evaluate shallow landslide hazards.
In this paper, first, the typical characteristics of landslides in South Korea and the Songnisan monitoring station are presented. Second, the theoretical background is described. An infinite slope stability model applying a unified effective stress concept that is pertinent to both unsaturated and saturated soils [22] is introduced. Third, the unsaturated and geotechnical properties of soil are clarified based on field surveys and laboratory test studies. Fourth, the monitored source data regarding rainfall and volumetric water content are delineated. The matric suction and suction stress in unsaturated soil were derived from the monitored volumetric water content and laboratory-derived soil–water characteristic curves and suction stress characteristic curves. Finally, the calculated safety factor in the slope and possible scenarios with more hazardous slope conditions are discussed. Preliminary test results on the effectiveness of a rainfall parameter denoted by continuous rainfall are included. In the present study, the estimated matric suction data and monitored continuous rainfall amounts at the study site were utilized to validate the continuous rainfall to represent slope moisture conditions that may lead to the initiation of shallow landslide hazards.

2. Landslides, Monitoring Station, and Sensors

2.1. Physical Setting

The Songnisan landslide monitoring station is located in an area with a wide distribution of alkali feldspar granites from the Cretaceous Period, the last period of the Mesozoic Era. This type of rock is reddish in color, and as a coarse material, the main component minerals are quartz and microcline with trace amounts of biotite. In Korea, landslide-prone areas contain a wide distribution of typical granite-weathered residual soils, most of which are residuum: soil and subsoils resulting from long periods of weathering. The soil order, suborder, great soil group, and World Reference Base (WRB) can be classified as Inceptisols, Udepts, Dystrudepts, and Cambisols, respectively. Additional information can be found through the portal site Rural Development Administration in Korea [23]. The annual mean temperatures of the study area ranged from −3 to 16 °C from 1971 to 2000; the average temperature at the Songnisan station is 12.2 °C. The annual rainfall is approximately 1300 mm.

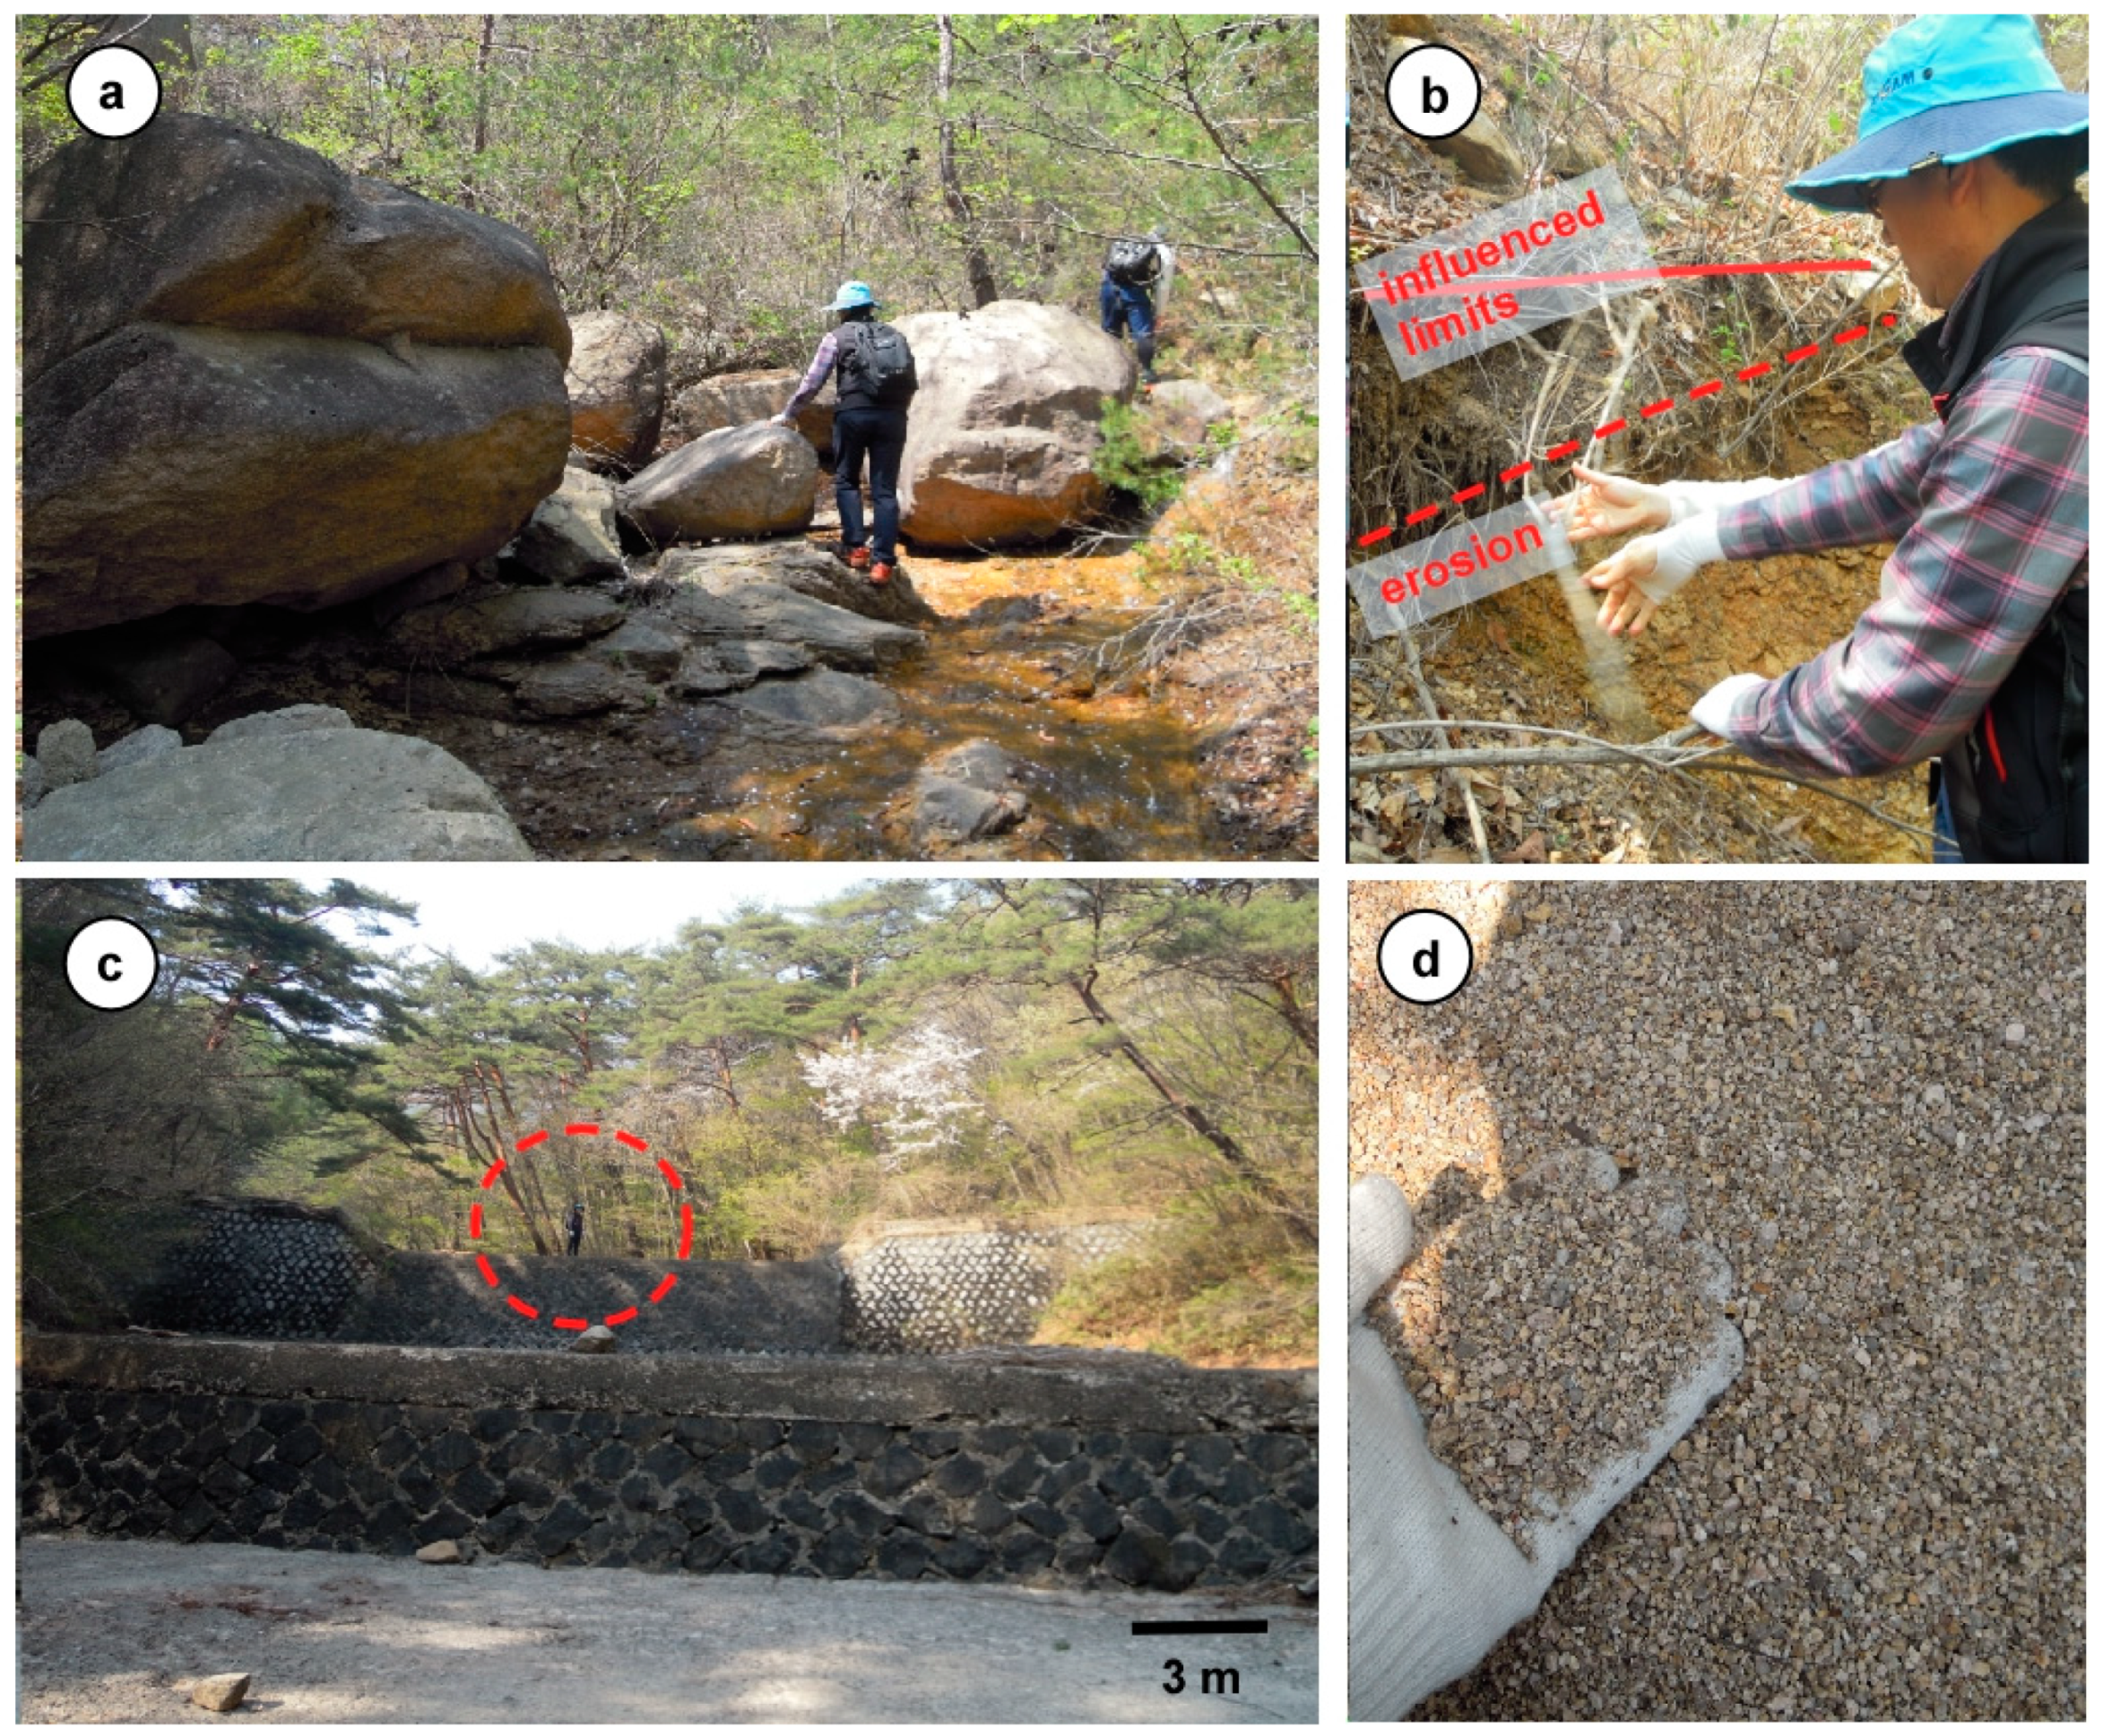
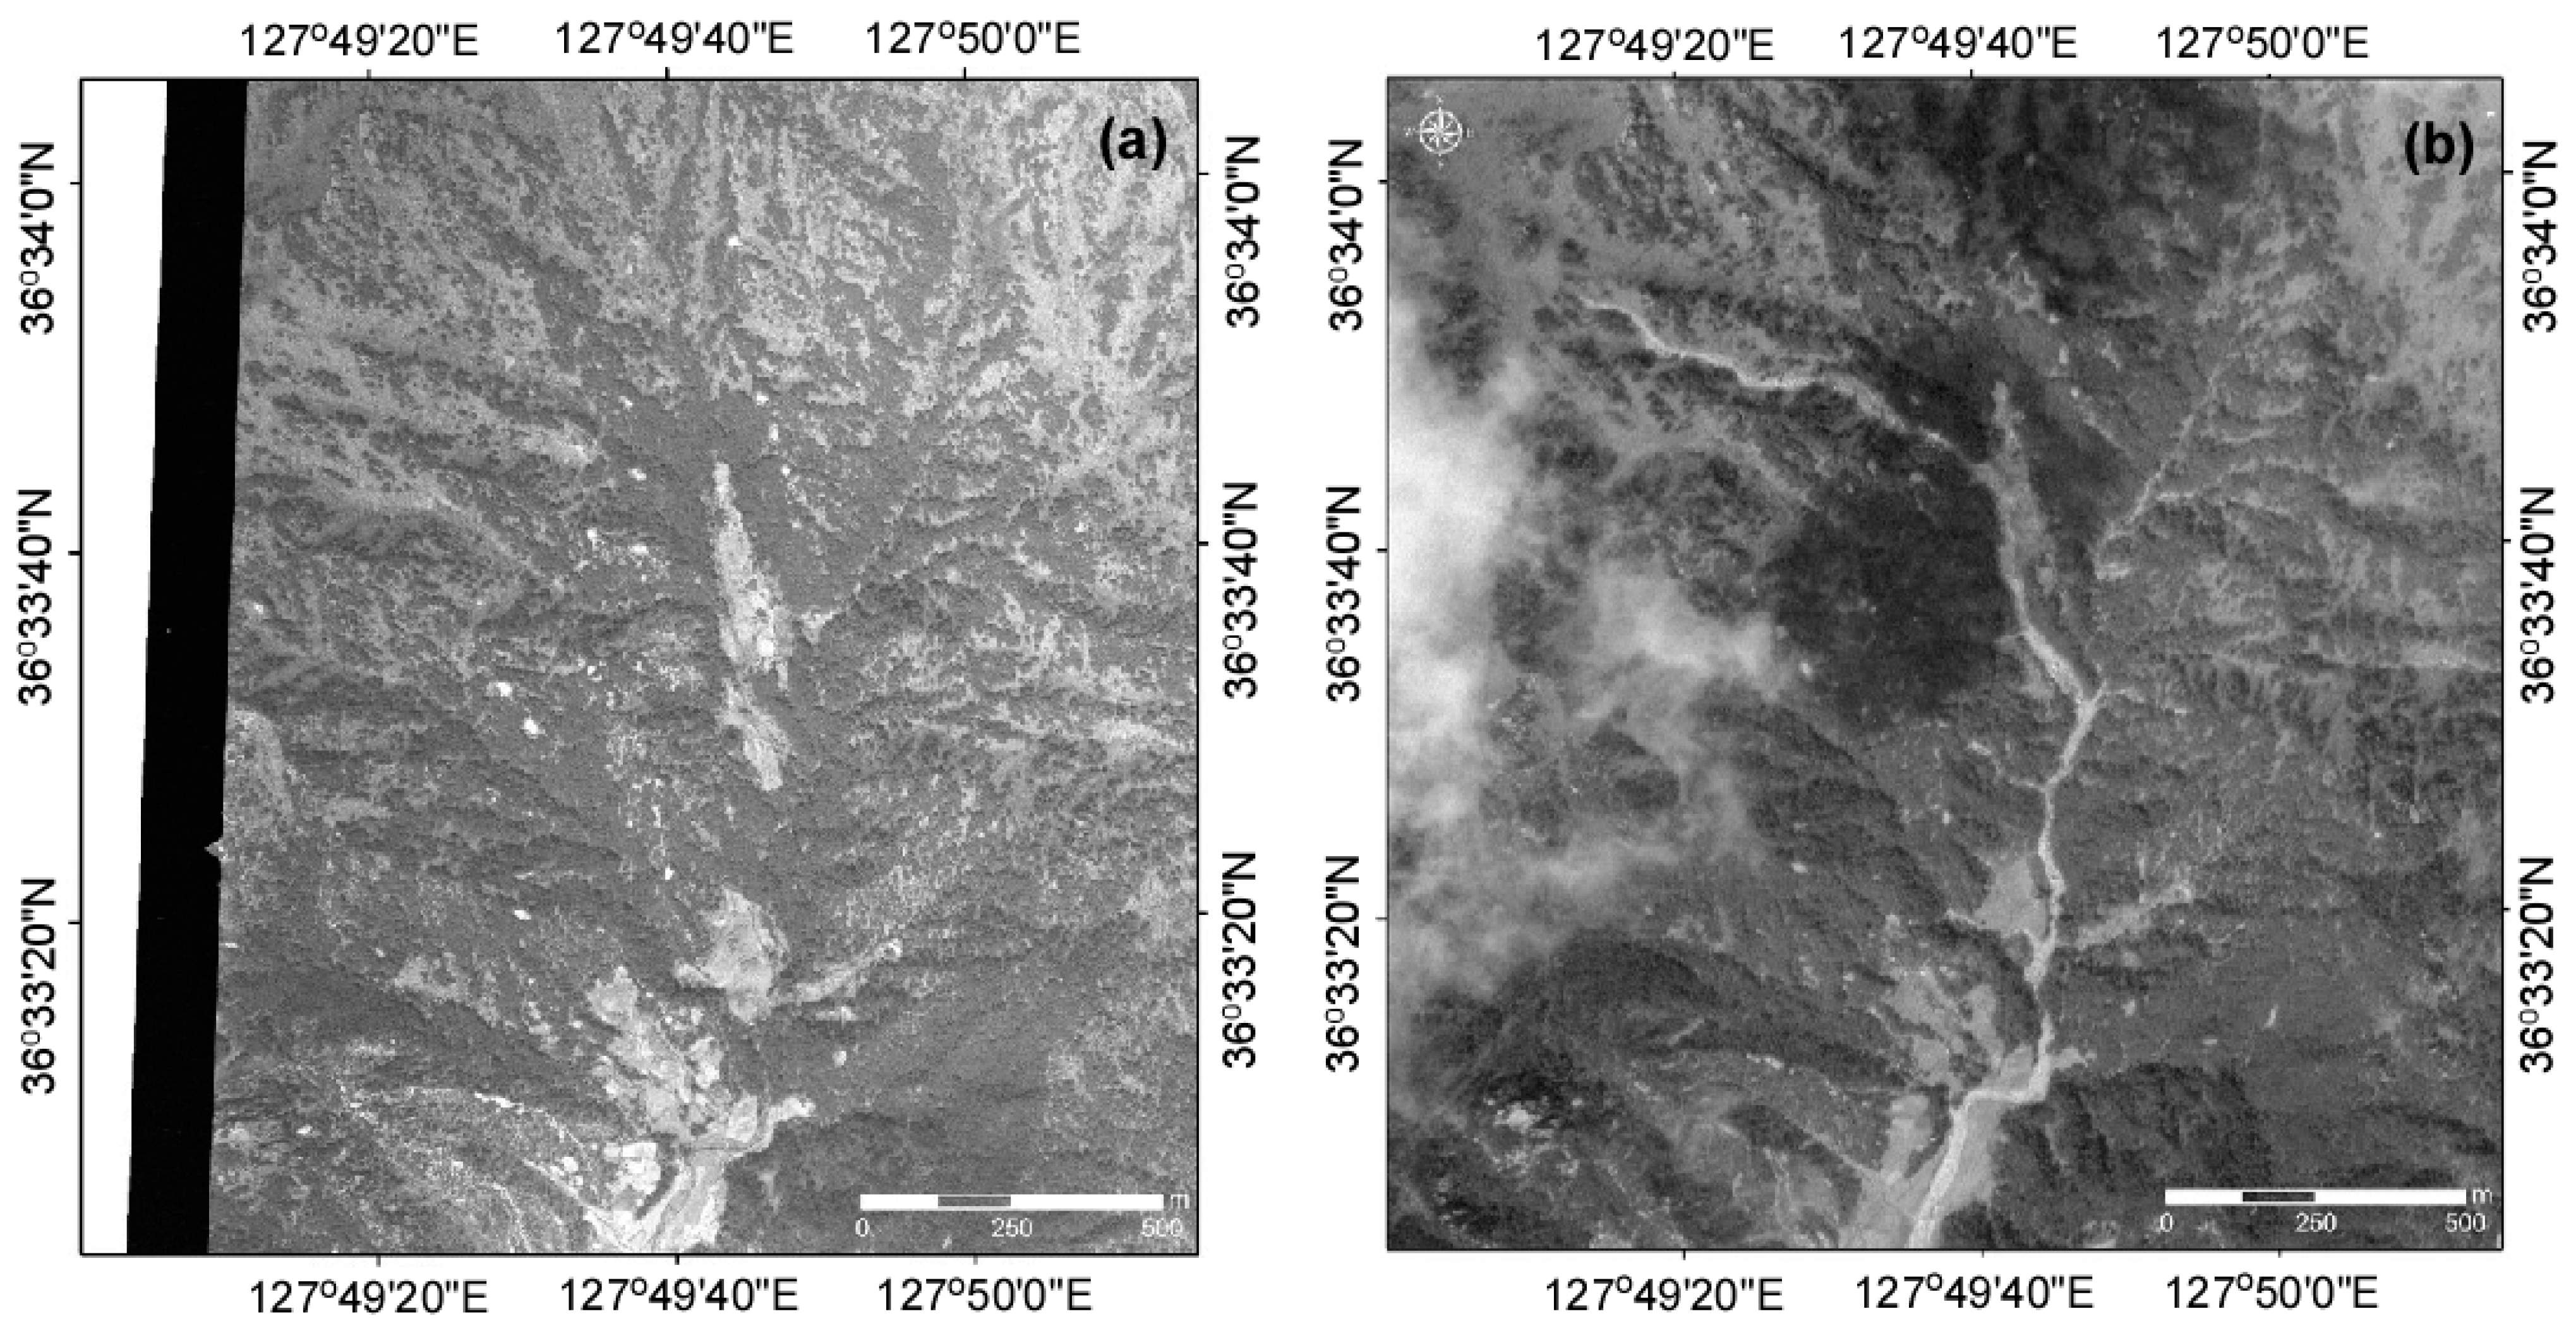
2.2. Landslides in Mt. Songnisan National Park, South Korea

Landslides in South Korea are often initiated at shallow soil depths during the summer monsoon period from June to October. In general, the soil depth typically ranges from 1 to 2 m in thickness. The sliding thickness in the source area usually ranges from 0.5 to 1.0 m. For this reason, landslides that occur in South Korea are categorized as rainfall-induced shallow landslides. Most such landslides easily turn into debris avalanches or debris flows. These can include boulder-sized rocks and earth materials capable of sweeping away a house and infrastructure in mountainous areas. The study area in the Mt. Songnisan National Park has a history of landslides and debris flows. Figure 1 shows the landslide occurrences in 1977 and 1984. Traces of landslides and debris flows are shown at the center of the figure. In the first event, the landslide zone was 600 m long, and the damaged area was approximately 35,000 m2. In the second event, the travel distance of the debris flow was approximately 2 km. Even though a small stream in the study area does not show evidence of a high frequency of debris flow, it could create severe potential risks to life and infrastructure. Large amounts of debris are supplied to the flow channel after erosion and previous slope failures. Figure 2 shows the presence of debris and sediments deposited along the main channel. Two check dams constructed in 1986 and located at the bottom of the basin are fully filled with debris and soil. From the source area to a check dam, the soil thickness in the main channel varies from 0.5 to 2 m. The depth in the source area is very shallow and increases as the debris flow progresses. Landslide materials are weathered granite soil. Landslide materials are mainly composed of sand and gravel with little fine content (i.e., clay and silt). A long-term monitoring study of a shallow landslide, which turns into a high mobile debris flow and is potentially destructive, must be designed and maintained as appropriate.

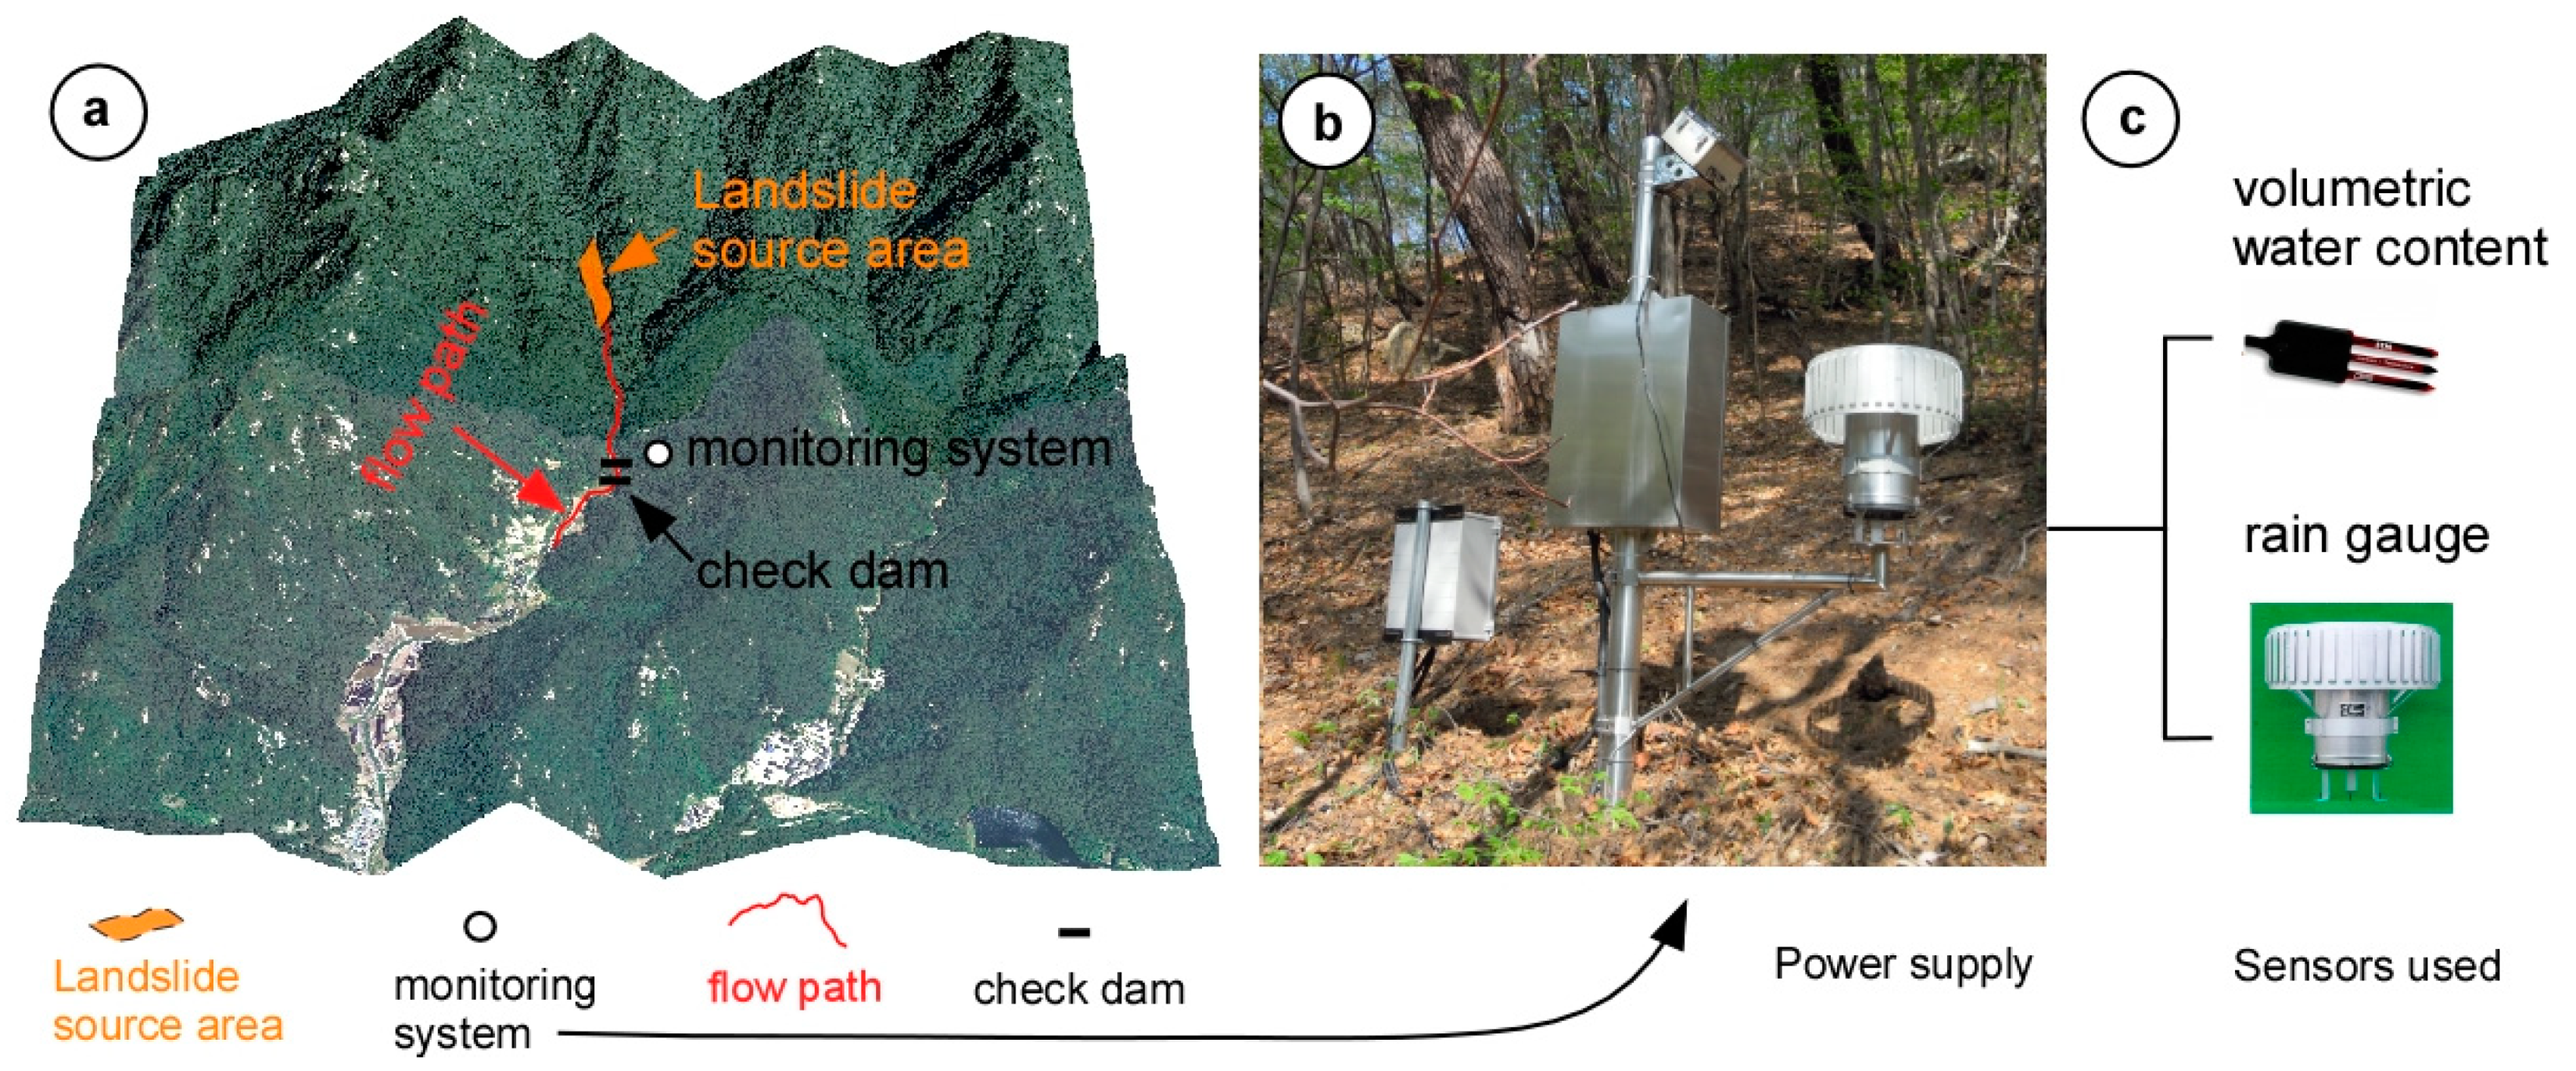
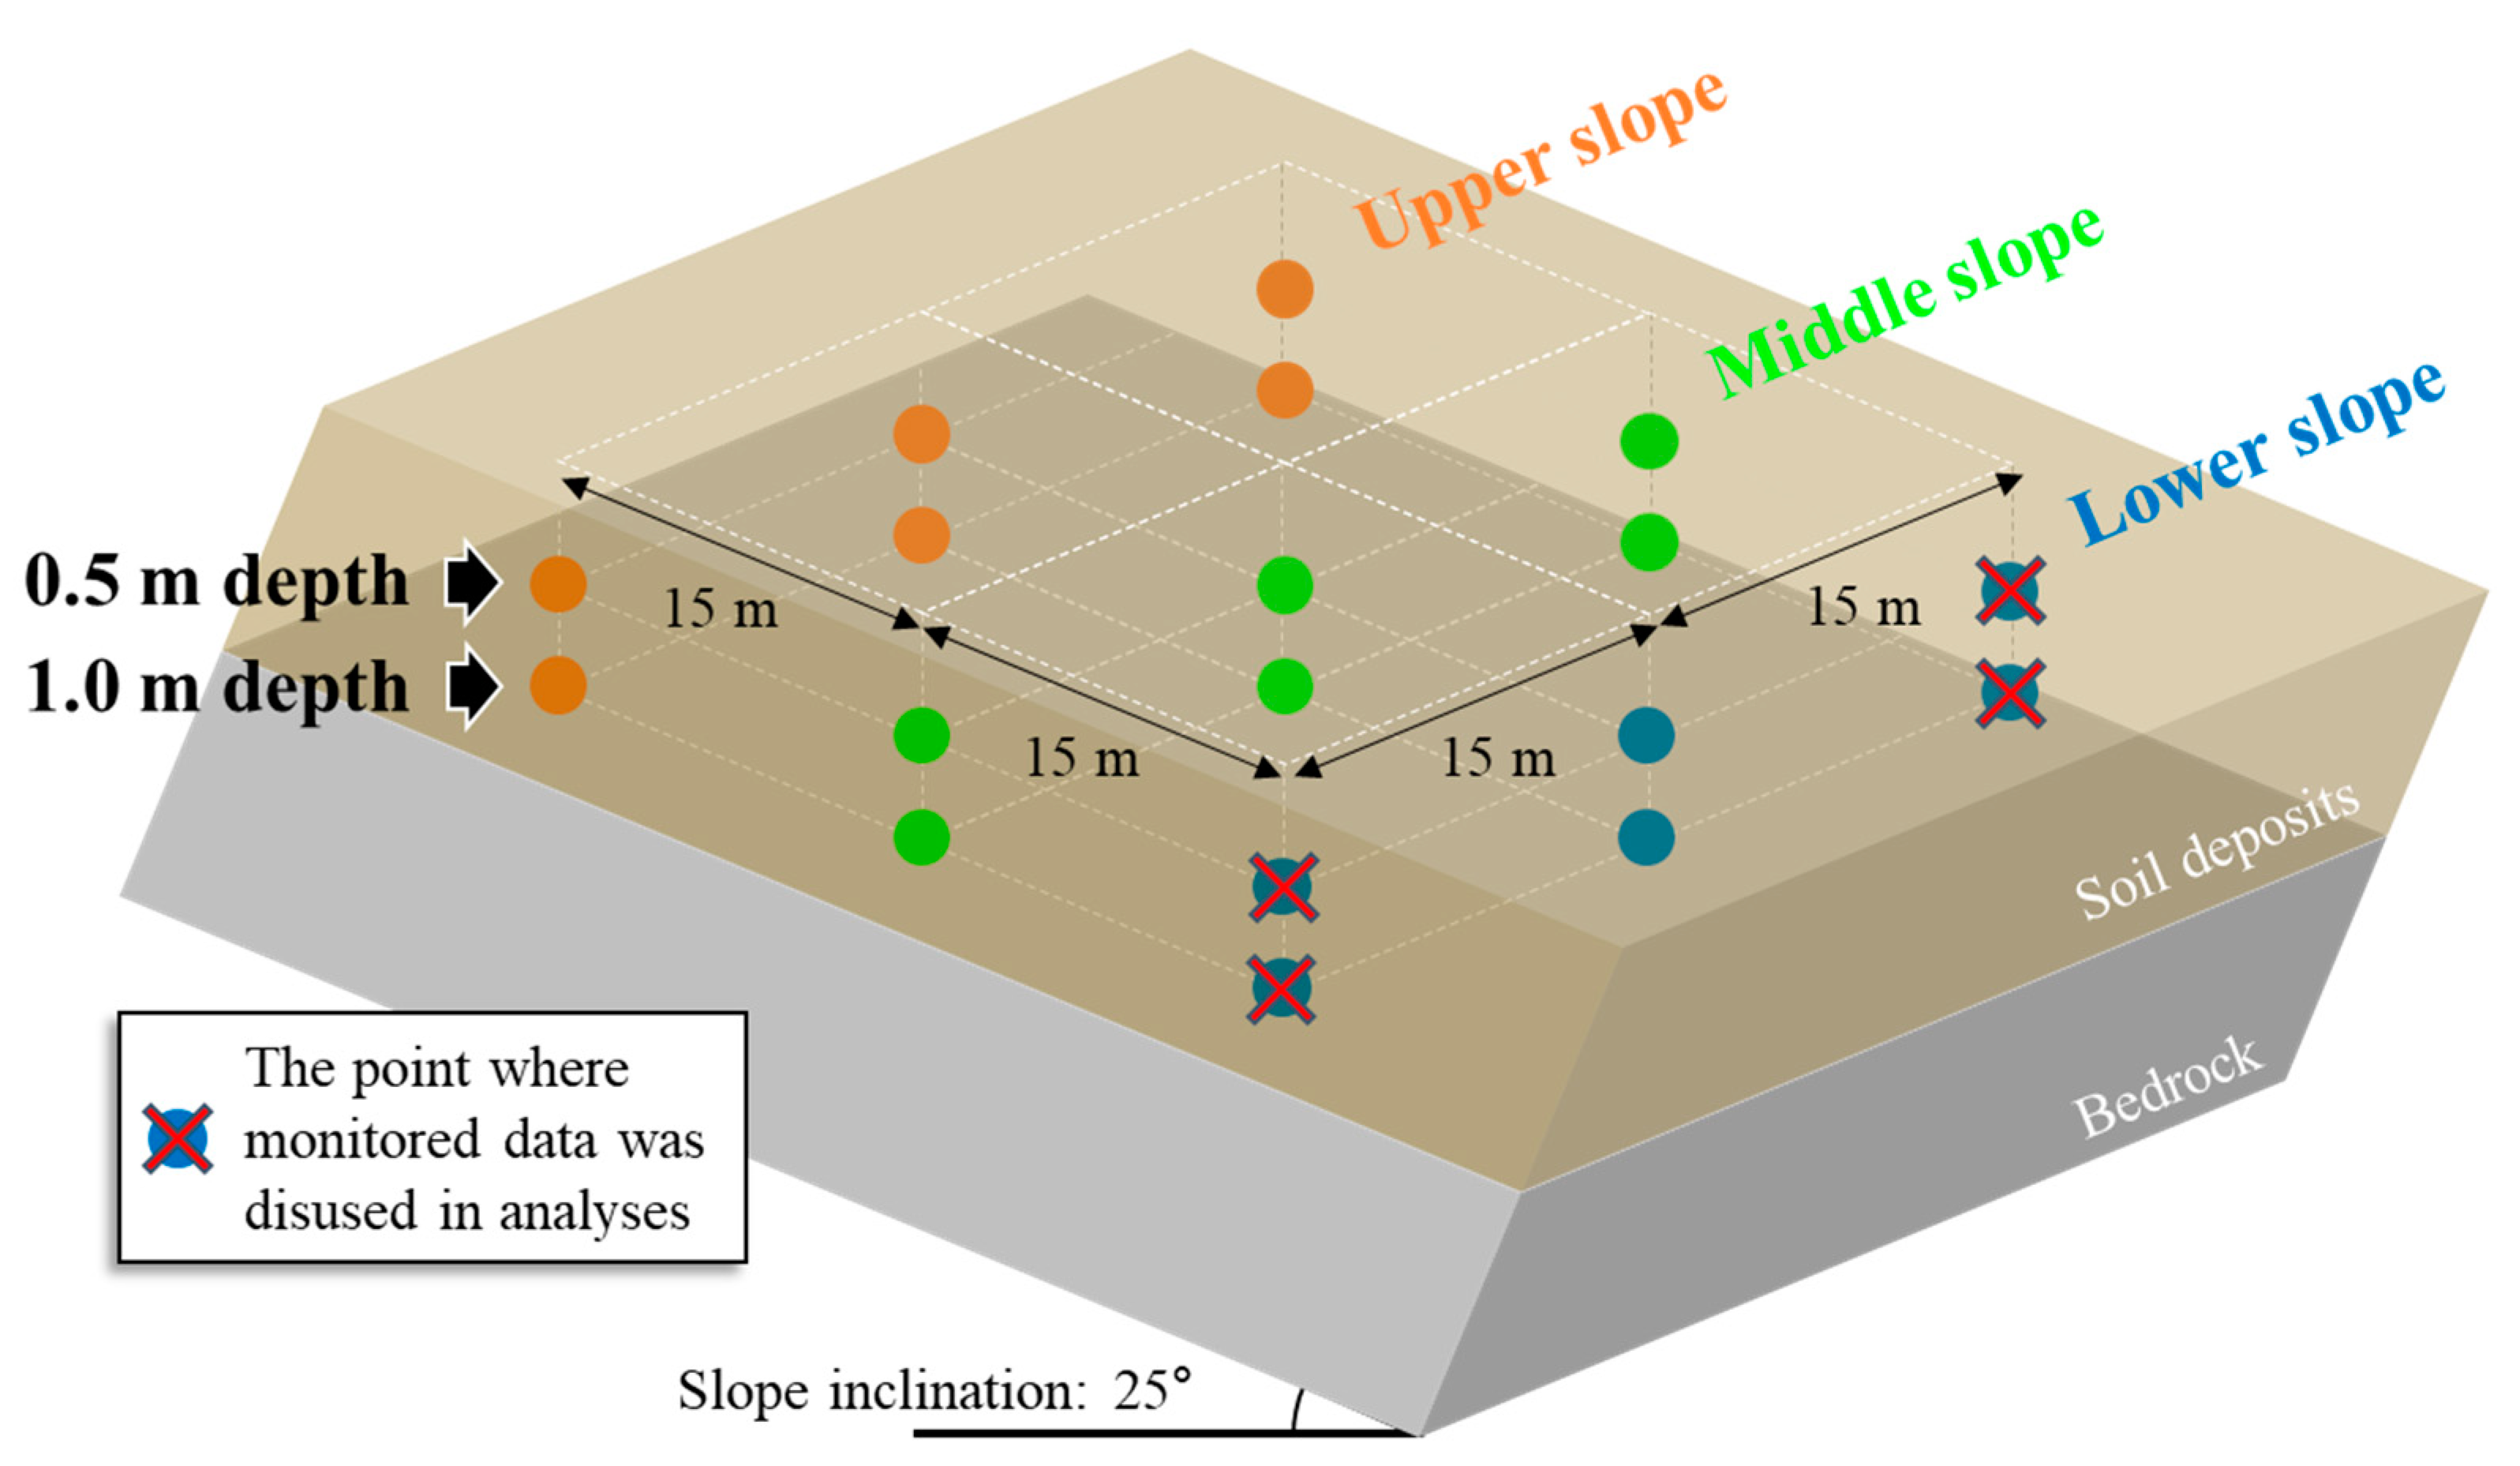
2.3. Monitoring Station and Sensors

A landslide monitoring station of KIGAM-LAMOS was installed and operated at a local scale near the previous landslide source area and check dam on Mt. Songnisan. Figure 3 shows the locations of the monitoring station, installation, and sensors used. According to Michoud et al. [24], a robust monitoring network may be characterized by simplicity, life expectancy, a combination of multiple sensors, power supply, and communication line backups. The Mt. Songnisan station included a model WDR-205 tipping bucket type rain gauge (Wedaen) and model 5TM volumetric water content (VWC) sensors (Decagon ICT International) [4]. The sensor conditions were 0.5 mm and 0%–100% for rain and VWC, respectively. The values obtained from the sensors were within a suitable range to calculate the safety factor. The measurement equipment minimizes the difficulty of obtaining data through a constant power supply, producing a relatively cost-effective station system. Globally, 87% of the slopes are destabilized because of the water in landslides [24]. Among the various monitoring parameters to be checked, rainfall information is one of the most important. Rainfall and water infiltration can weaken the hydro-mechanical properties of soils, resulting in slope failure.

3. Methods and Data

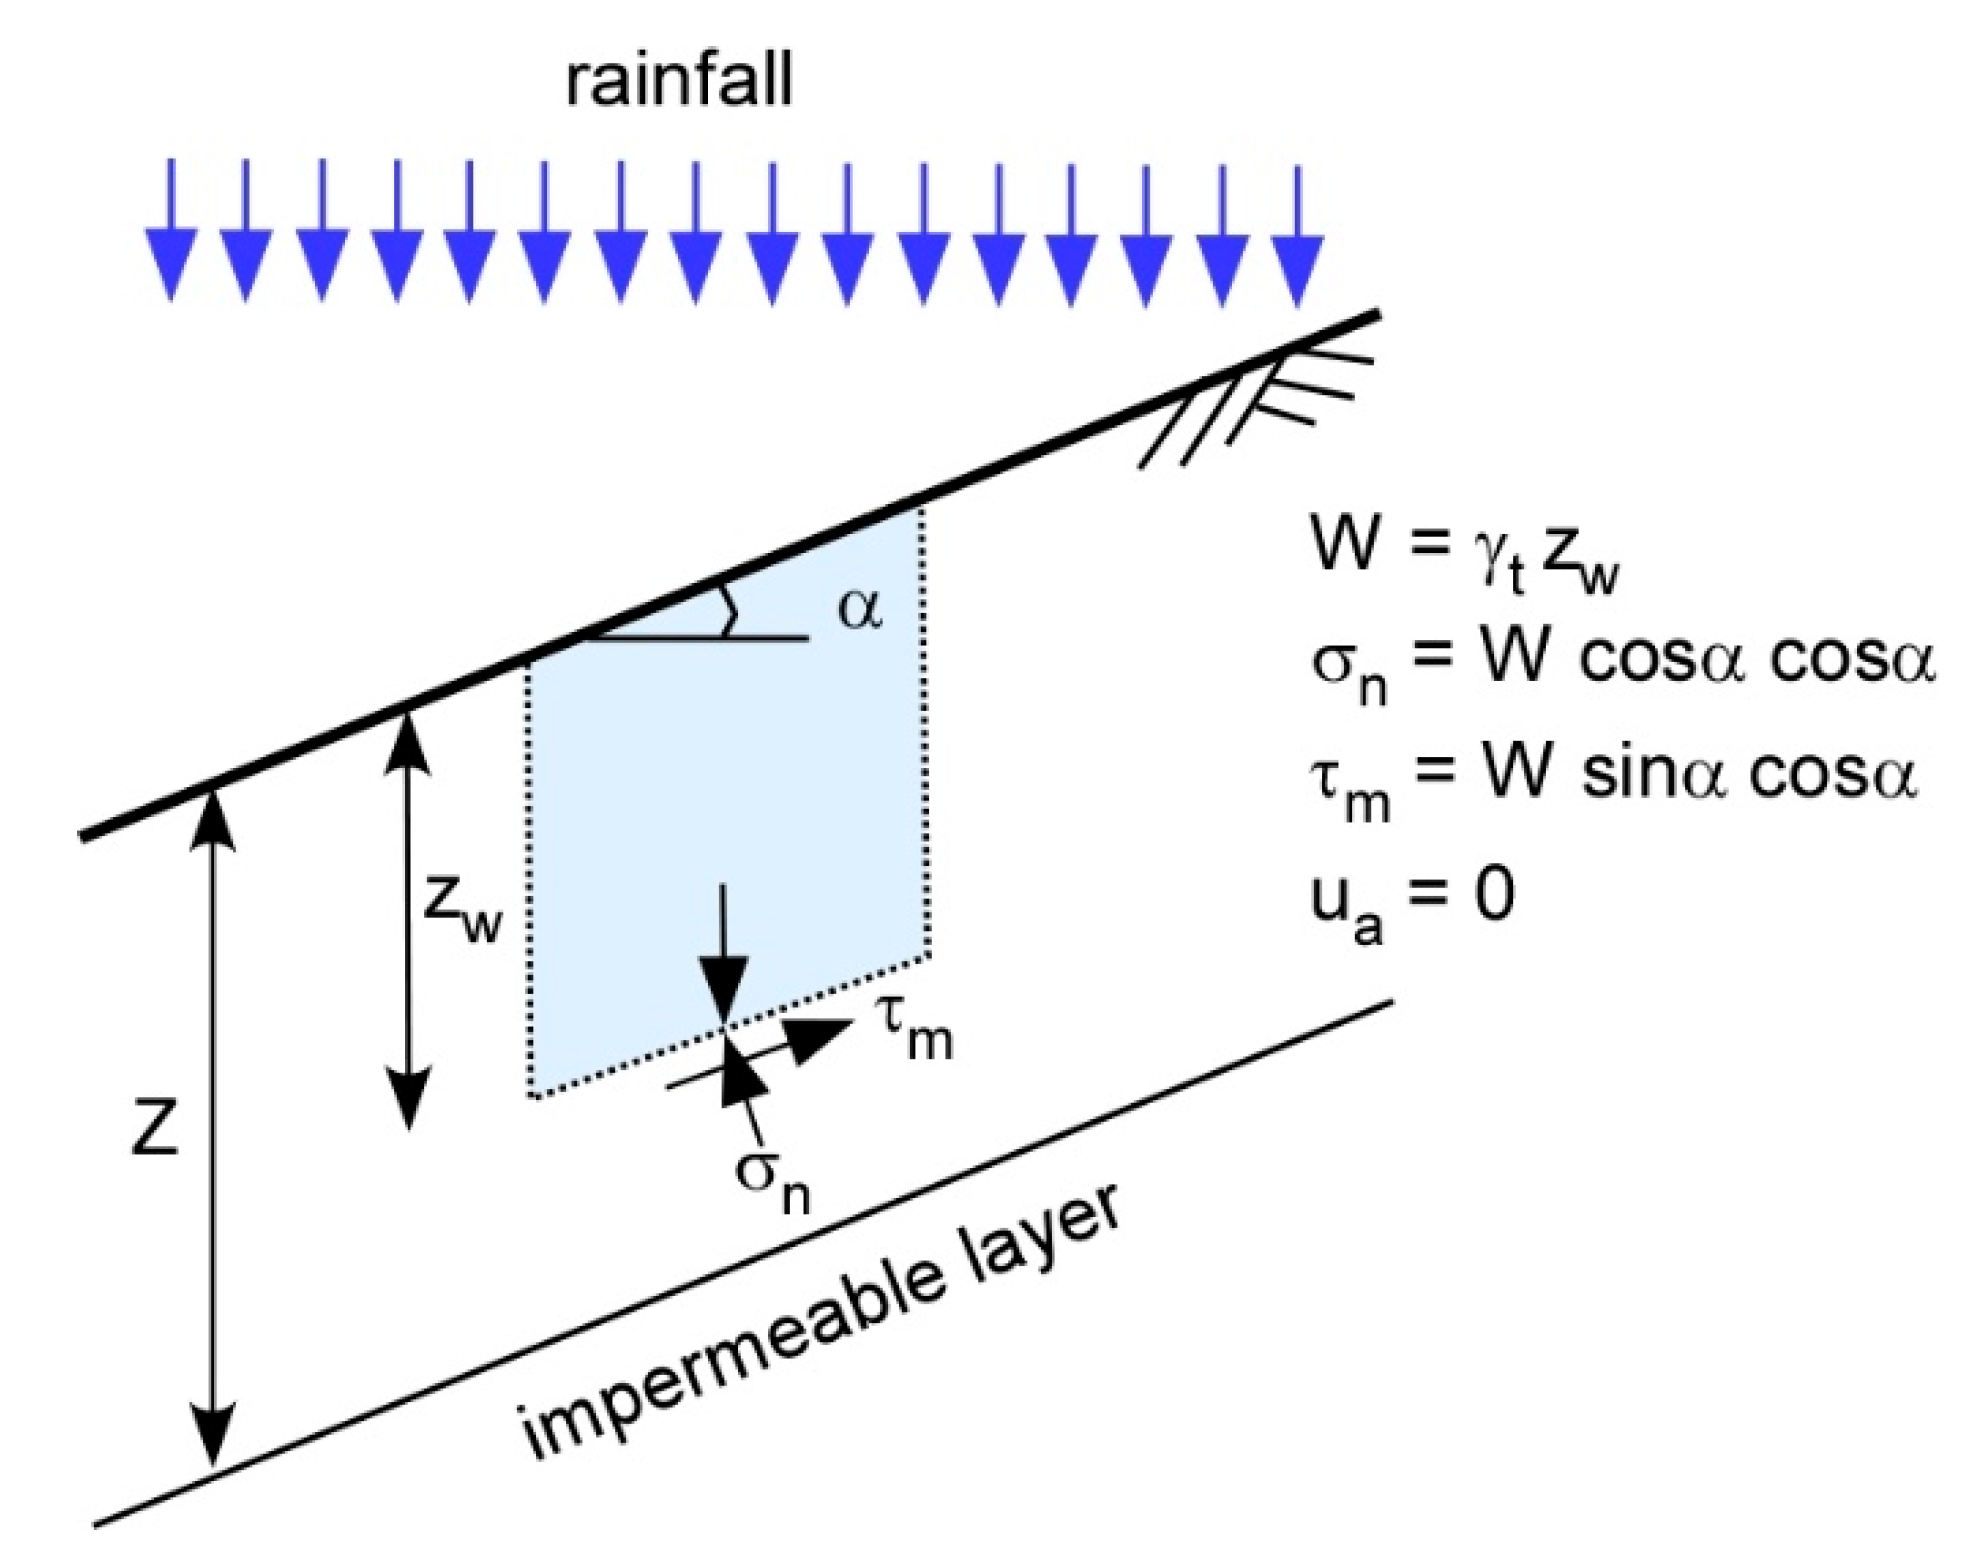
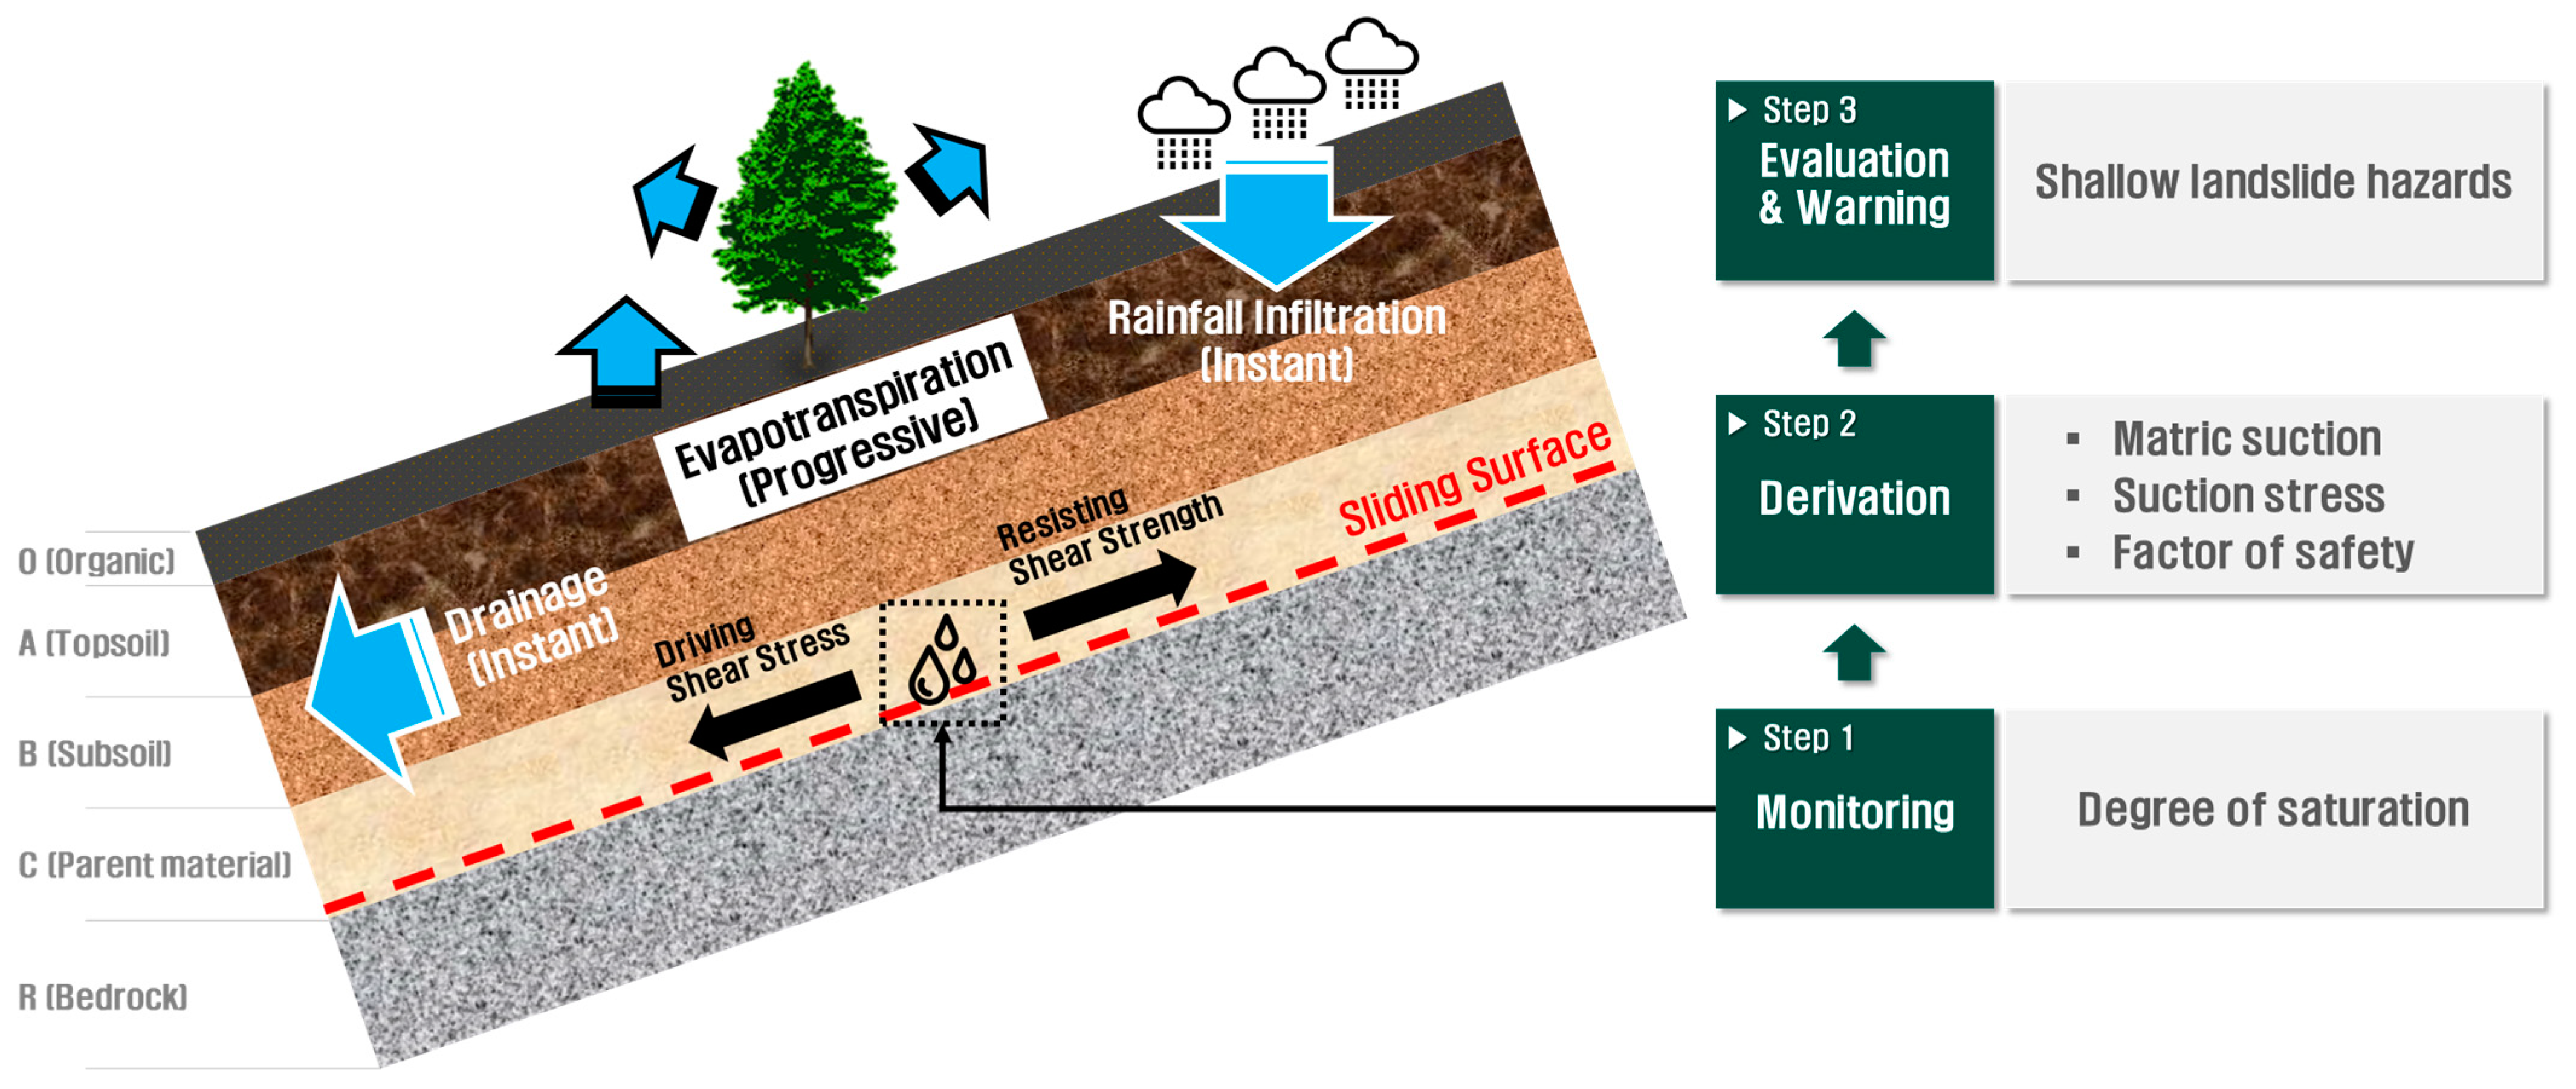
3.1. Theoretical Scheme of Shallow Landslide Hazard Monitoring

This study aimed to explicitly monitor long-term hydrological processes in a single slope in natural terrain. Therefore, VWCs were measured in multiple subsurface locations, and rainfall amounts were recorded hourly over a four-year period. The collected VWC data were analyzed to clarify the transient unsaturated soil stresses and slope stabilities.
Among the 12 landslide monitoring stations of KIGAM-LAMOS installed across eight national parks in South Korea [4], only the Songnisan station was covered in this study to initially test the aforementioned approach. As illustrated in Figure 4, the VWC sensors were arranged in 18 different subsurface locations to comprehensively investigate the temporal variations of geo-hydrological conditions in the slope at Songnisan station. In more detail, at soil depths of 0.5 m and 1.0 m a 3 × 3 matrix with 15 m longitudinal and transverse intervals was constituted using nine different sensor locations. The slope can be separated into three sections (upper, middle, and lower) according to elevation. For each section of the slope, transient VWCs were monitored from both soil depths, where slip surfaces would most likely exist considering the shallow landslide characteristics of Korea [25]. To reduce sensing instabilities and uncertainties, VWCs were measured at three different locations along the transverse direction for each of the two soil depths. In the lower slope, the data obtained from sensors on both sides for all depths were excluded from this study because of the data anomalies and irregularities possibly caused by sensor malfunctions and instabilities of installation environments. The slope of the Songnisan station was inclined at 25°.
For each sensor location, infinite slope stability analyses were conducted by applying a unified effective stress model under both saturated and unsaturated soil conditions [22]. The unified effective stress model allows temporal variations in suction stress resulting from changes in soil moisture conditions. Applying the infinite slope method [26] in this study was reasonable, as the assumption of a method in which the slope extent is much longer than the depth of the potential slip surface corresponds well to the characteristics of translational or shallow landslides.
The factor of safety (FOS) equation, which is based on the Mohr–Coulomb failure criterion and the limit equilibrium approach in the infinite slope method, is illustrated in Figure 5 and can be written as shown in Equation (1) by applying the unified model of effective stress (Equation (2)):
FOS = tan φ tan α + c - σ s tan φ z ω ( γ t sin α cos α )
σ = ( σ - u a ) - σ s
where φ′ is the effective internal friction angle, c′ is the effective cohesion (kPa), σs is the suction stress (kPa), α is the slope angle, zω is the vertical soil depth of a potential slip surface (fixed to a monitoring soil depth, 0.5 m or 1.0 m, in this study), σ′ is the effective stress, σ is total stress, and ua is the pore air pressure. γt is the water-content-dependent unit weight of soil (as kN/m3) and is calculated by the equation γt = γd + θ·ρw, where θ is the monitored VWC, and ρw is the density of water. An infinite slope stability analysis method that applies the conceptualized suction stress term, as in the case of Equation (1), was previously proposed by Lu and Godt [27] and has been widely used in various studies [28,29].
The monitored source data in the slope (i.e., VWC) can be expressed as the effective degree of saturation using Equation (3):
S e = θ θ r θ s θ r
where Se is the effective degree of saturation, θ is the measured VWC, θs is the saturated VWC, and θr is the residual VWC.
Then, given the soil–water characteristic curve (SWCC) in the field, the matric suction can be interpreted as a function of the effective degree of saturation by applying the van Genuchten [30] model, as shown in Equation (4):
S e = 1 1 + a ( u a - u w ) n m u a - u w = a 1 S e 1 / m 1 1 / n
where a is the inverse of the air entry pressure, n indicates the pore size distribution parameter (m = 1 − 1/n), (uauw) is the matric suction, and uw is the pore water pressure.
Consequently, by applying a closed-form equation for the suction stress characteristic curve (SSCC) proposed by Lu and Likos [22] and Lu et al. [31], the suction stress term σs in Equation (1) can also be expressed in terms of the effective degree of saturation as shown in Equation (5):
σ s = - S e ( u a - u w ) = - S e a 1 S e 1 / m 1 1 / n
Finally, substituting Equation (5) for σs in Equation (1), the FOS at a fixed location in a slope becomes a function of the time-variable effective degree of saturation. When the FOS of a slope is reduced to less than unity by the increase in the effective degree of saturation and the resultant loss of suction stress, the slope is regarded to have lost equilibrium and enters an unstable state in which the initiation of a shallow landslide is imminent.

3.2. Geotechnical and Unsaturated Properties of Soil

Disturbed and undisturbed samples were collected from the Songnisan landslide monitoring station study site, where thin weathered granite residual soil layers overlie the bedrock. A variety of laboratory tests were conducted in compliance with the Korean Industrial Standards (KS) to understand the engineering properties of the soil. More specifically, physical and mechanical properties were obtained from the disturbed and undisturbed soil samples. The undisturbed soil samples were taken using a stainless cylindrical ring sampler that was 10 cm in diameter and 5 cm in height. In general, the samples were collected at depths of about 40–60 cm after removing the topsoil. A total of 20 soil samples were tested, and average values were obtained for each property. The physical properties include Atterberg limits (i.e., liquid limit and plastic limit), grain size distribution, permeability, dry unit weight, optimum moisture content, specific gravity, and water content. In particular, the test results for permeability (ks = 1.89 × 10⁻⁵ m/s), effective grain size (D10 = 0.11 mm), and specific gravity (Gs = 2.68) indicated that the soils in the study site could be represented as sands or fine sands. For the mechanical properties, effective cohesion and the internal friction angle were measured from direct shear tests. The test results of the geotechnical parameters that were used to calculate Equation (1) are summarized in Table 1.
An automated SWCC test apparatus [32,33] was used to estimate the unsaturated soil properties of the study site. The tests consisted of two conditions: the drying process in which pore water was progressively drained from a fully saturated soil sample by the air pressure loading, and the wetting process in which dry pores were progressively saturated by the air pressure unloading. The test results provided raw data of sequentially measured matric suctions and their respective inflow or outflow masses of water. Nonlinear least-squares regression analyses fit the previously introduced van Genuchten [30] model (Equation (4)) to the raw data points.
The values of the curve-fit parameters (α, n, and m) were determined, as shown in Table 2, and the SWCC was plotted using these parameters. Figure 6a shows the SWCCs for the drying and wetting processes derived using the van Genuchten [30] model. As the unsaturated soils exhibited hysteresis, the soil was less saturated during the wetting process than during the drying process at the same matric suction. The SSCCs for the drying and wetting processes were also plotted in Figure 6b using the previously introduced closed-form Equation (5). The magnitude of the suction stress gradually decreased as the soil became saturated, and rapidly proceeded toward zero as it neared full saturation. The soil abruptly lost the suction stresses over the effective degree of saturations of approximately 0.96 and 0.88 for the drying and wetting processes, respectively. Notably, the magnitudes of suction stress were less than 10 kPa at all degrees of saturation except in the near-dry range. This magnitude range corresponds to those of sand or silt according to the SSCCs of typical soils proposed by Lu et al. [31]. In contrast, the suction stress of the tested soil followed the pattern of clayey soils in that the magnitude increased monotonically as the degree of saturation approached zero. The range of values of the α and n parameters for different soil types suggested in the literature [31] indicates that the tested soil in this study can be classified as clayey sand. This indicates that, although sand was the dominant material in the tested soil, moderate amounts of clay minerals contributed to increasing tensile inter-particle stresses, even under dry conditions.
As the wetting process test condition better represents the phenomena of soil slope saturations induced by rainfall infiltration that directly led to the reduction of slope stability in reality, the curve-fit parameters derived from the wetting process SWCC were applied to the analyses in this study.

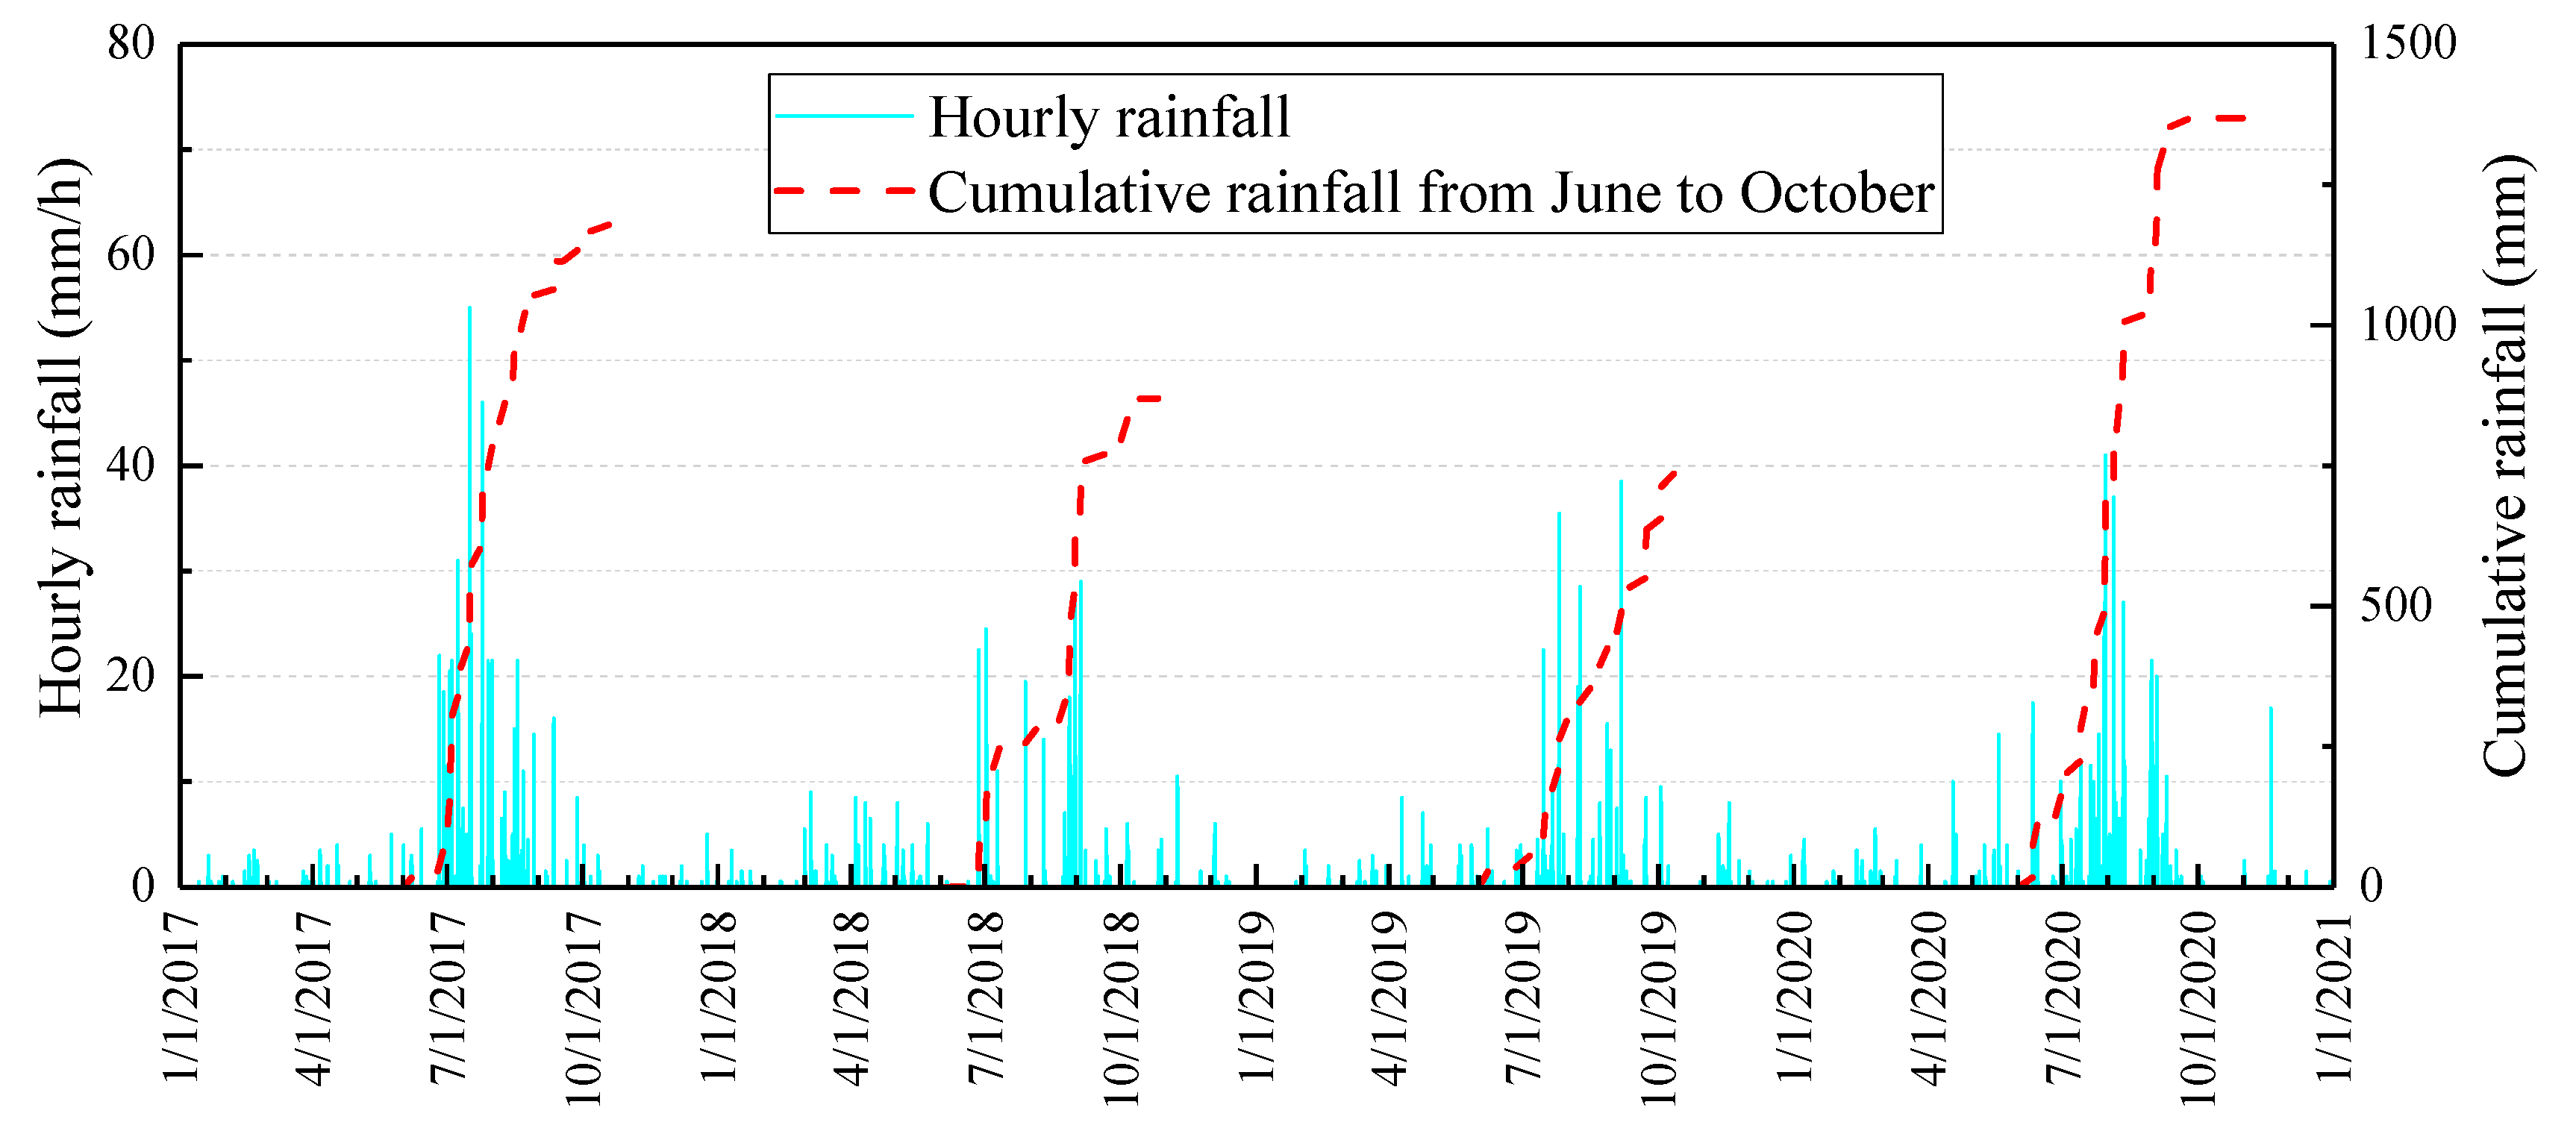
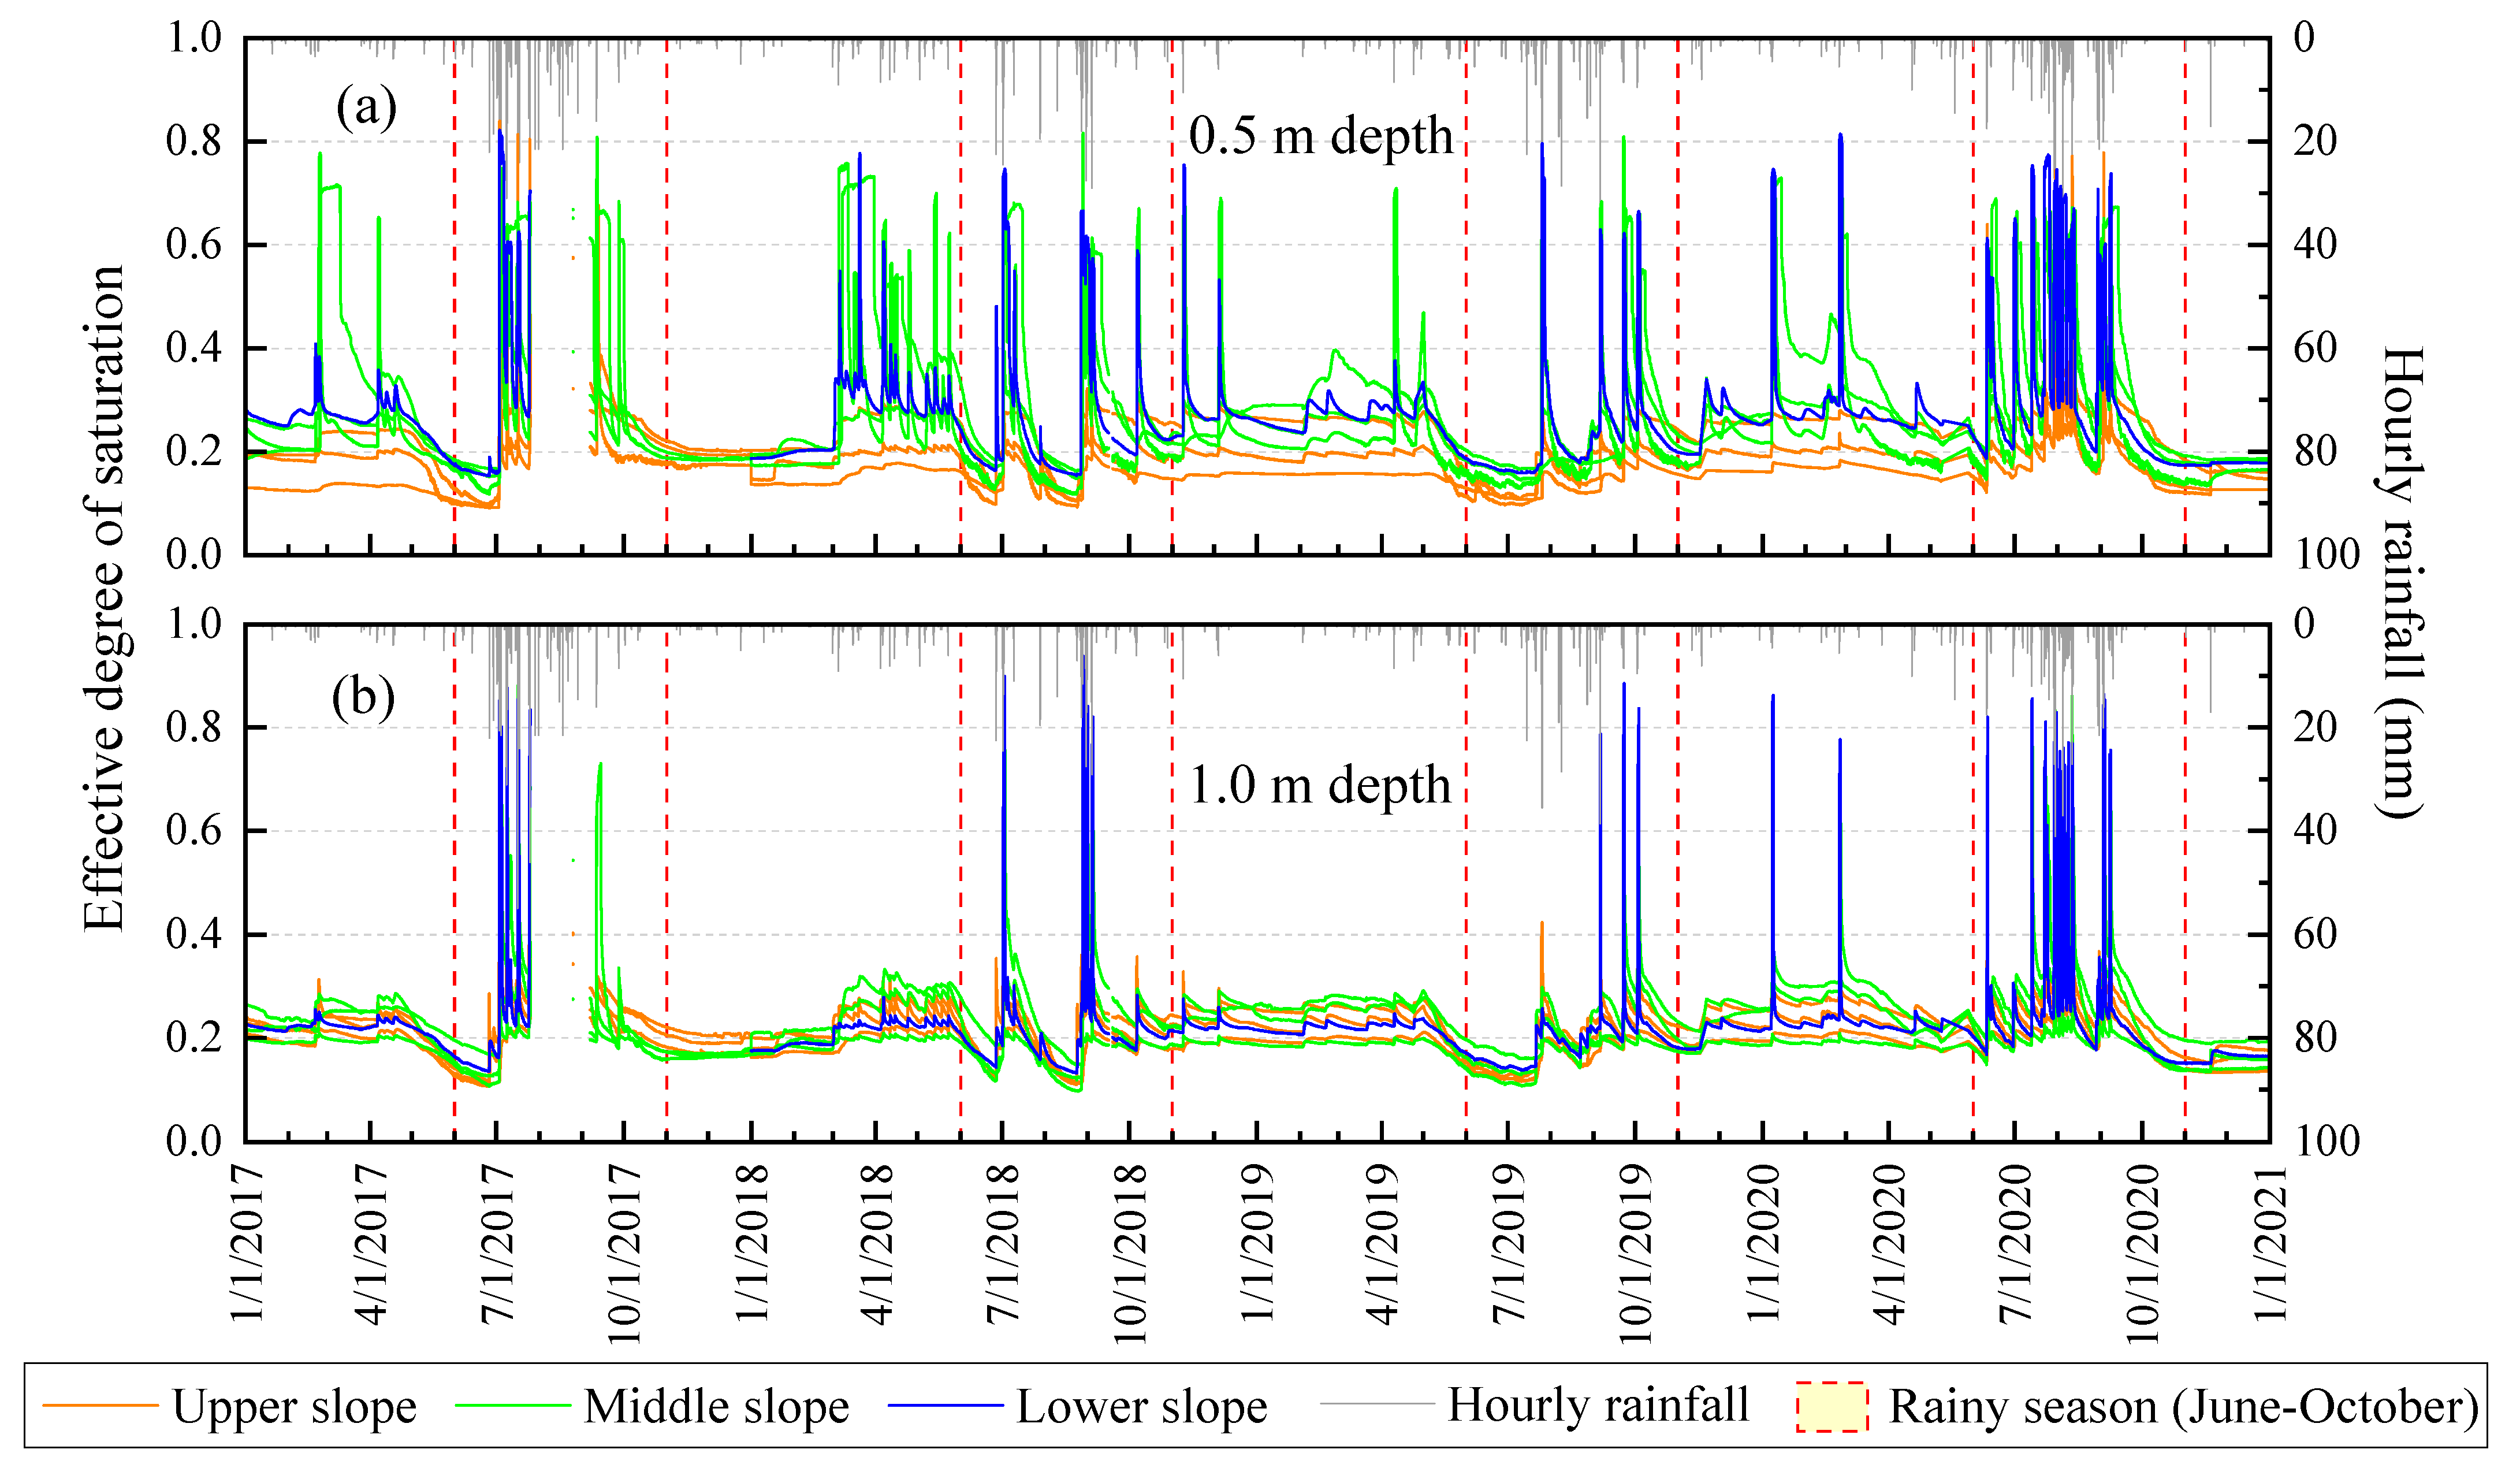
3.3. Monitored Source Data: Rainfall and VWC

Rainfall and VWC in the slope were monitored for four years between 2017 and 2020 using the KIGAM-LAMOS operational system. Figure 7 shows hourly recorded rainfall distributions with respect to time elapsed during the four years and cumulative rainfall from June to October for each year. The majority of the precipitation was recorded from June to October. Nearly all landslides were reported during this season in South Korea. Accordingly, the period from June to October was designated as the rainy season or landslide-prone season. While the two highest rainfall intensities were observed in 2017, the maximum total cumulative rainfall amount during the rainy season was measured in 2020. This was because, over the entire rainy season, rainfall was more persistent with moderately high intensities in 2020 than in 2017. The total cumulative rainfall during the rainy seasons were 1178.5 mm in 2017, 893.5 mm in 2018, 736 mm in 2019, and 1368.5 mm in 2020. During these four years, multiple landslides were reported in the neighboring regions of Songnisan station during the rainy seasons of 2017 and 2020. Coincidentally, the cumulative rainfalls during the rainy season exceeded 1100 mm in these two years.
Figure 8 shows the variations in the effective degree of saturation in the slope with respect to the time elapsed during the four years. The measured raw data (i.e., VWC) were converted to the effective degree of saturation by applying Equation (3). From 25 July to 5 September 2017, the data collection was suspended because of malfunction problems and repair work.
From a global perspective, the slope tended to maintain an approximately 0.2 effective degree of saturation (mean = 0.216; median = 0.203), as a preset value during non-rainy seasons (from November to the next May). The value seemed to be the soil’s unique minimum moisture level that is retained and not drained any further. However, during the rainy (or landslide-prone) seasons that occur in summer, the preset value started to decrease more if the non-rain period lasted longer. Therefore, it is reasonable to interpret that such a decrease in the soil moisture level was due to the increased evapotranspiration effects in high-temperature conditions, instead of the drainage effects. It can be deduced that the drainage effects dominantly govern the instant and sharply increased degree of saturation caused by rainfall infiltration, with a reduction to the preset conditions in a relatively short time.
In addition, different tendencies in hydrological responses of the slope to rainfall between 0.5 m (Figure 8a) and 1.0 m (Figure 8b) soil depths could be readily recognized. First, the deeper the soil depth of a slope, the lower the sensitivity to rainfall. This is because most spikes of saturations in the 1.0 m depth were formed in response to only relatively large rainfall events during the rainy seasons, in contrast with the 0.5 m depth, where the effective degree of saturations spiked in response to even some tenuous rainfall during non-rainy seasons. Second, the deeper the soil depth of a slope, the lesser the dispersion of soil moisture levels. The dispersions at 0.5 m were larger than those at 1.0 m. The soil moisture levels at 0.5 m were more dispersed than at 1.0 m within each section of the slope and between the three sections of the slope. Generally, the sections that exhibited high soil moisture levels at 0.5 m were in the order of the lower, middle, and upper slopes. Thus, the soil moisture levels tend to increase along the downslope direction, and this tendency becomes clearer as the depth decreases. This is because infiltrated rainwater flows downslope so that water tends to concentrate and accumulate from the lower sections of slopes. This assertion was previously corroborated by observations from laboratory experiments and numerical analyses of rainfall infiltration on a miniaturized model slope [34].

4. Results and Discussion

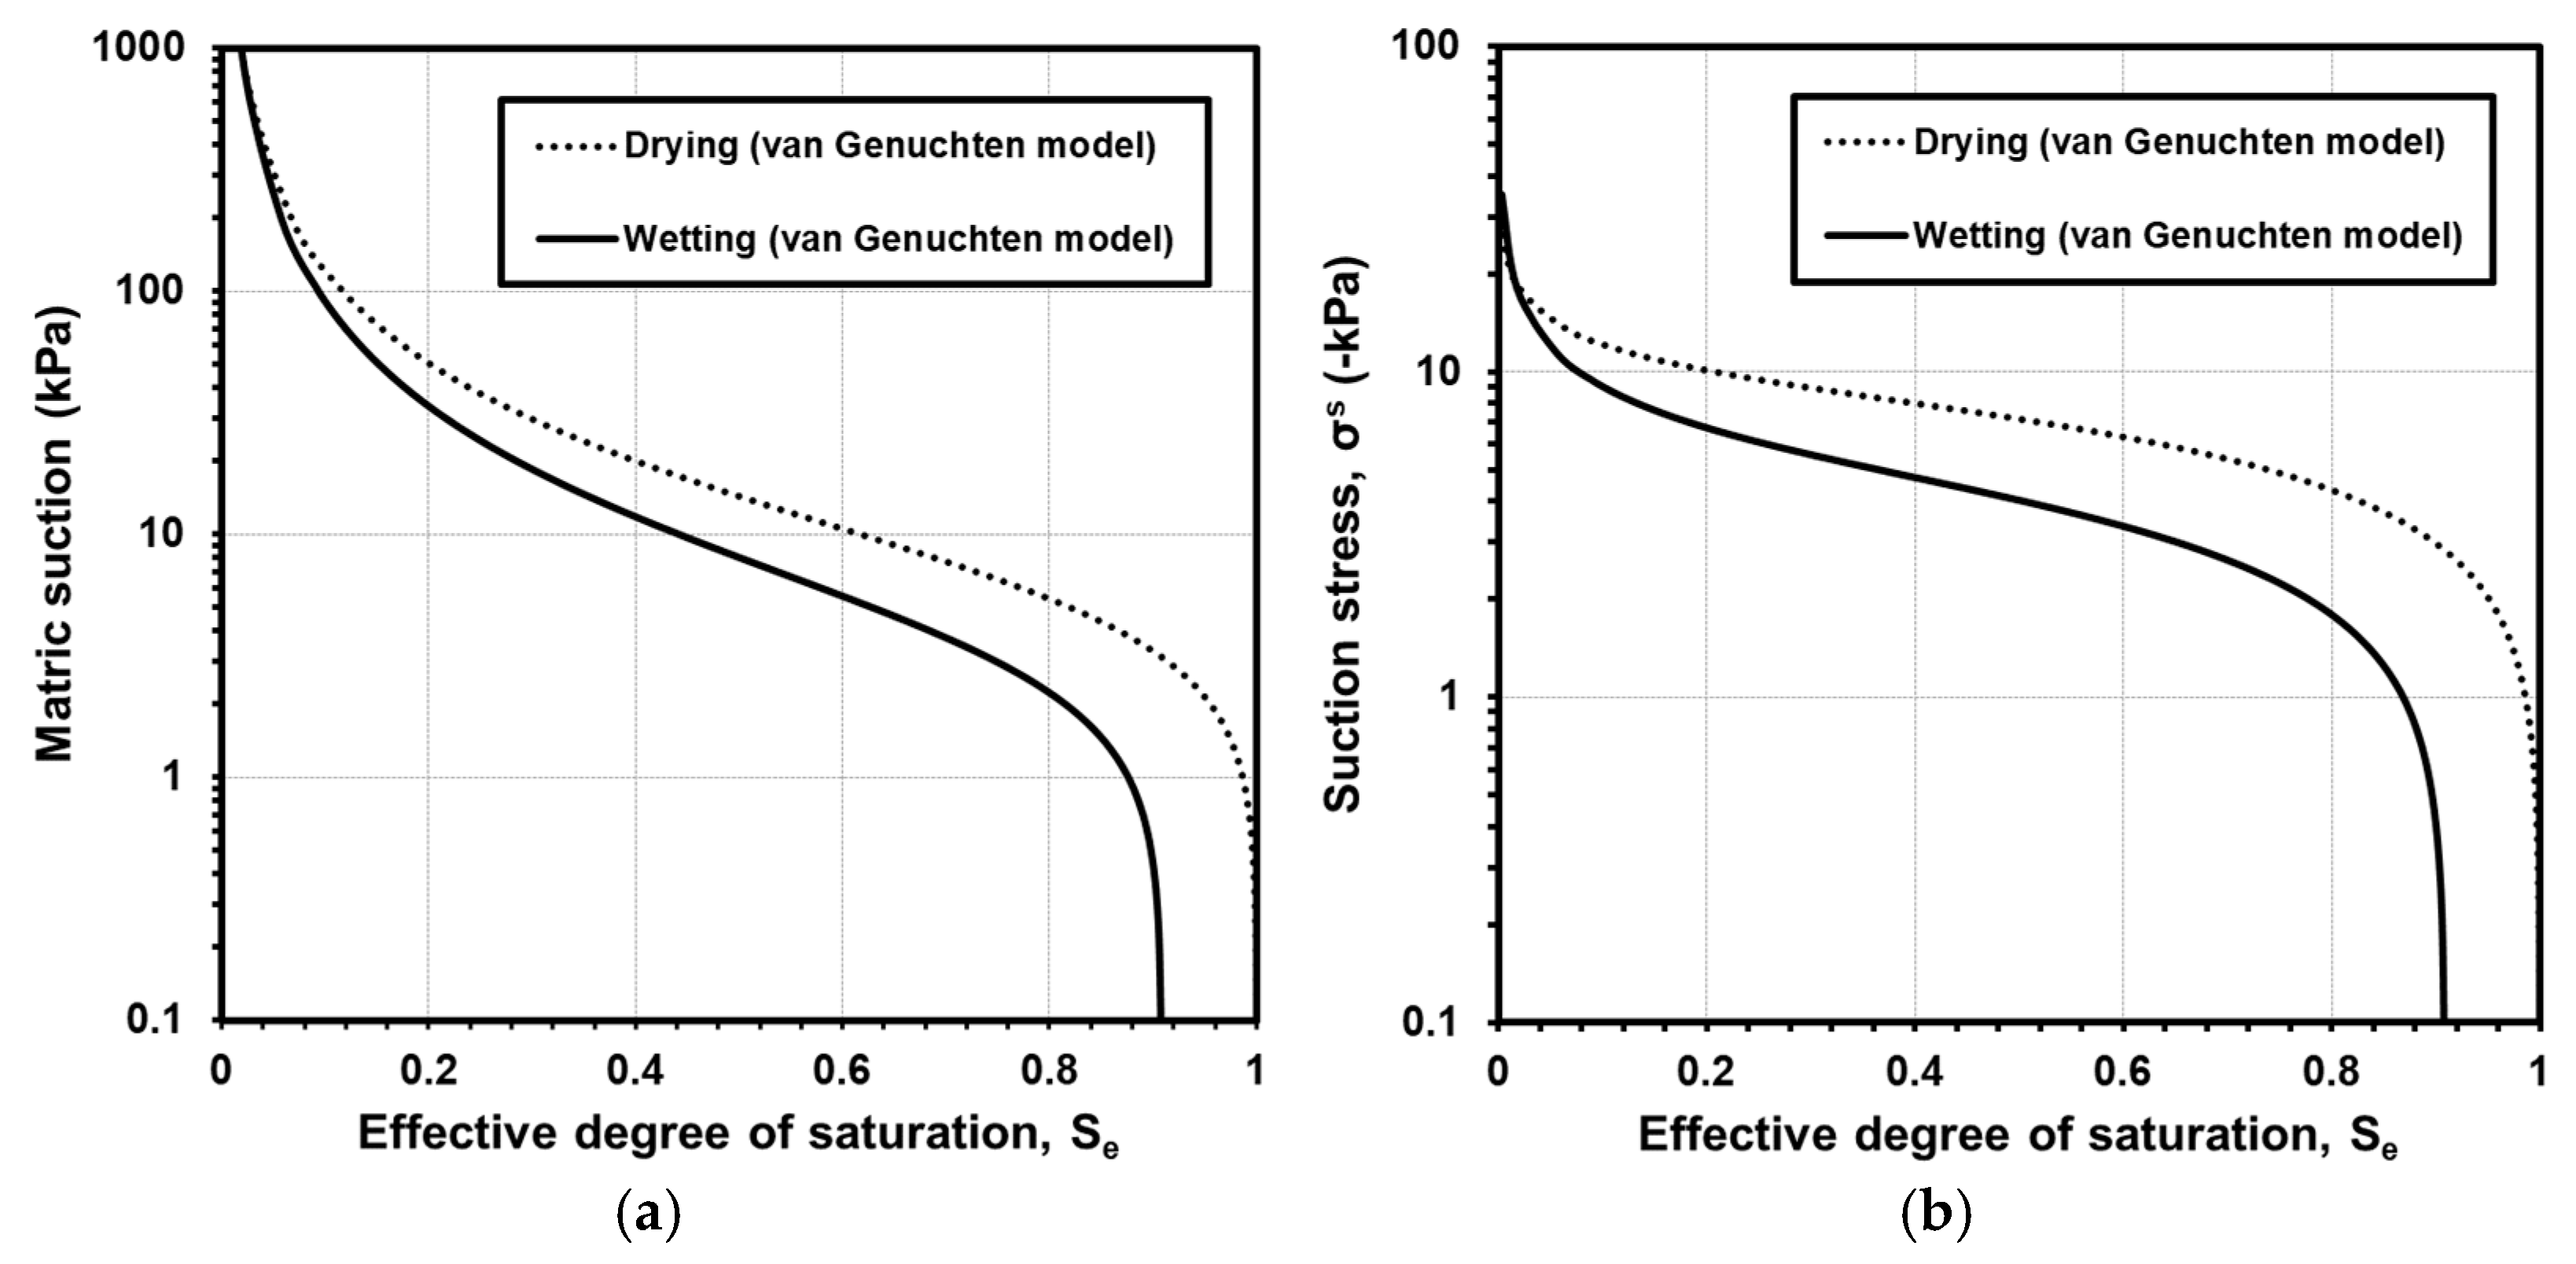
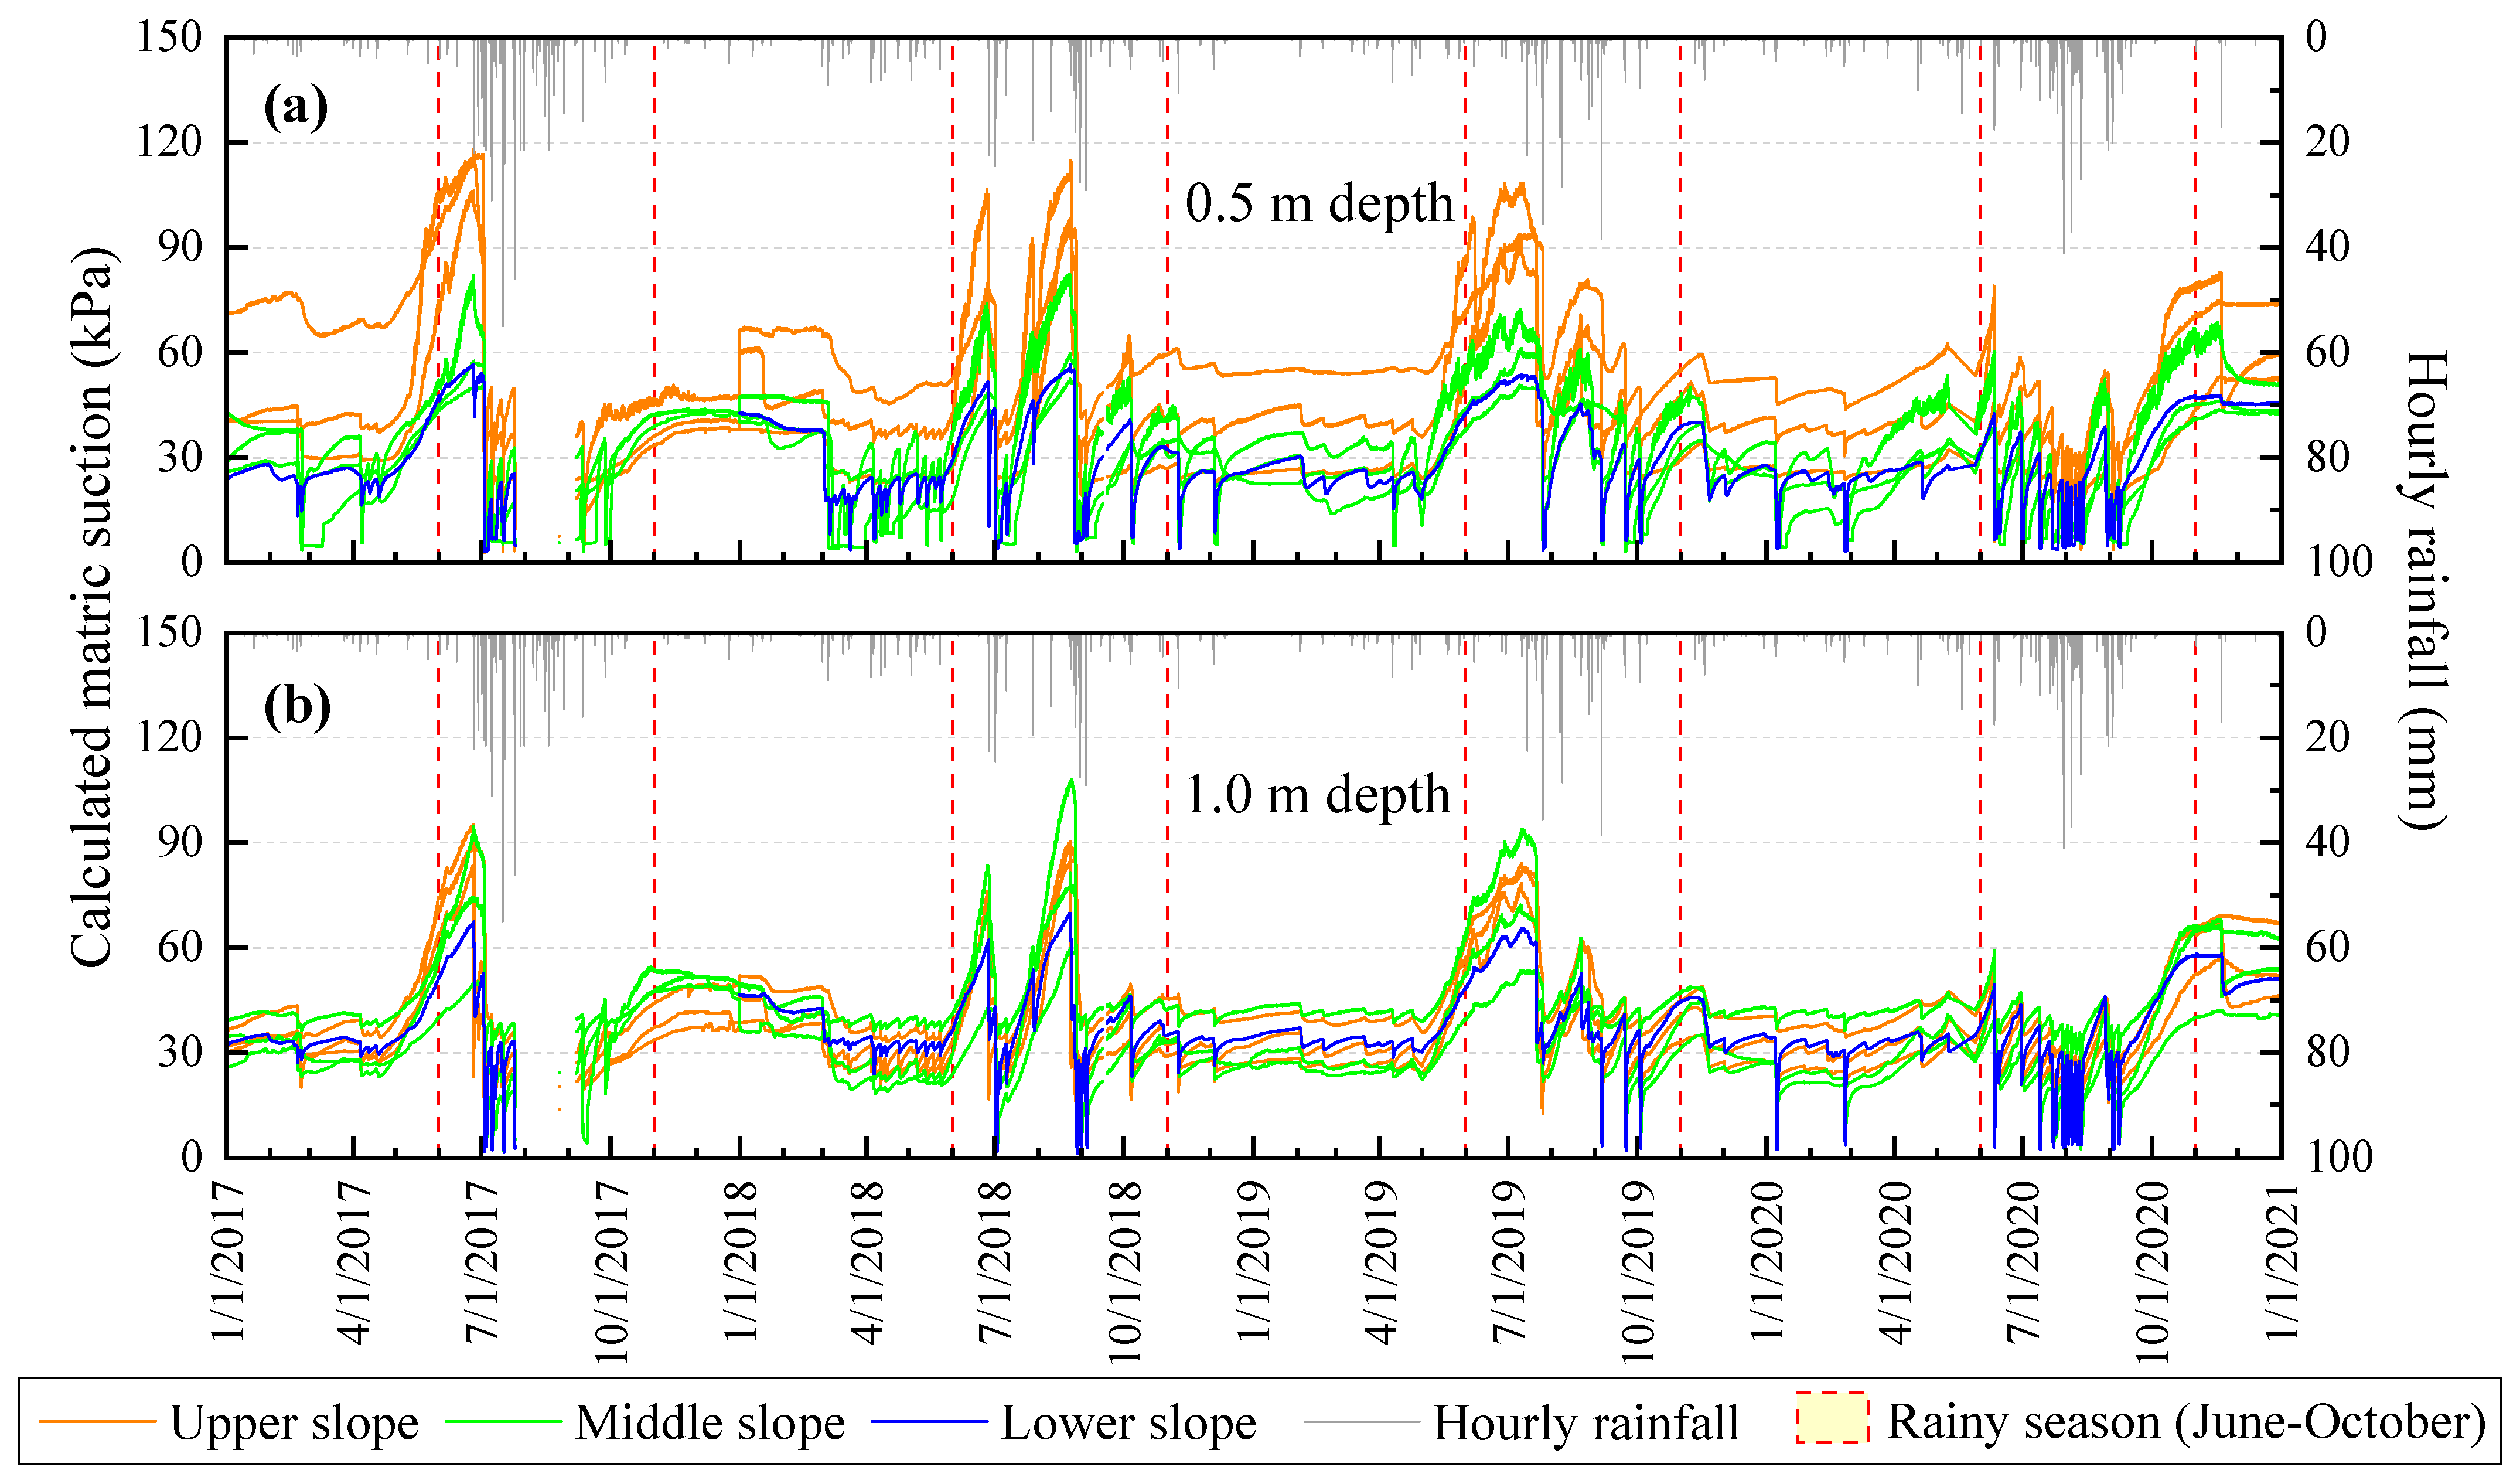
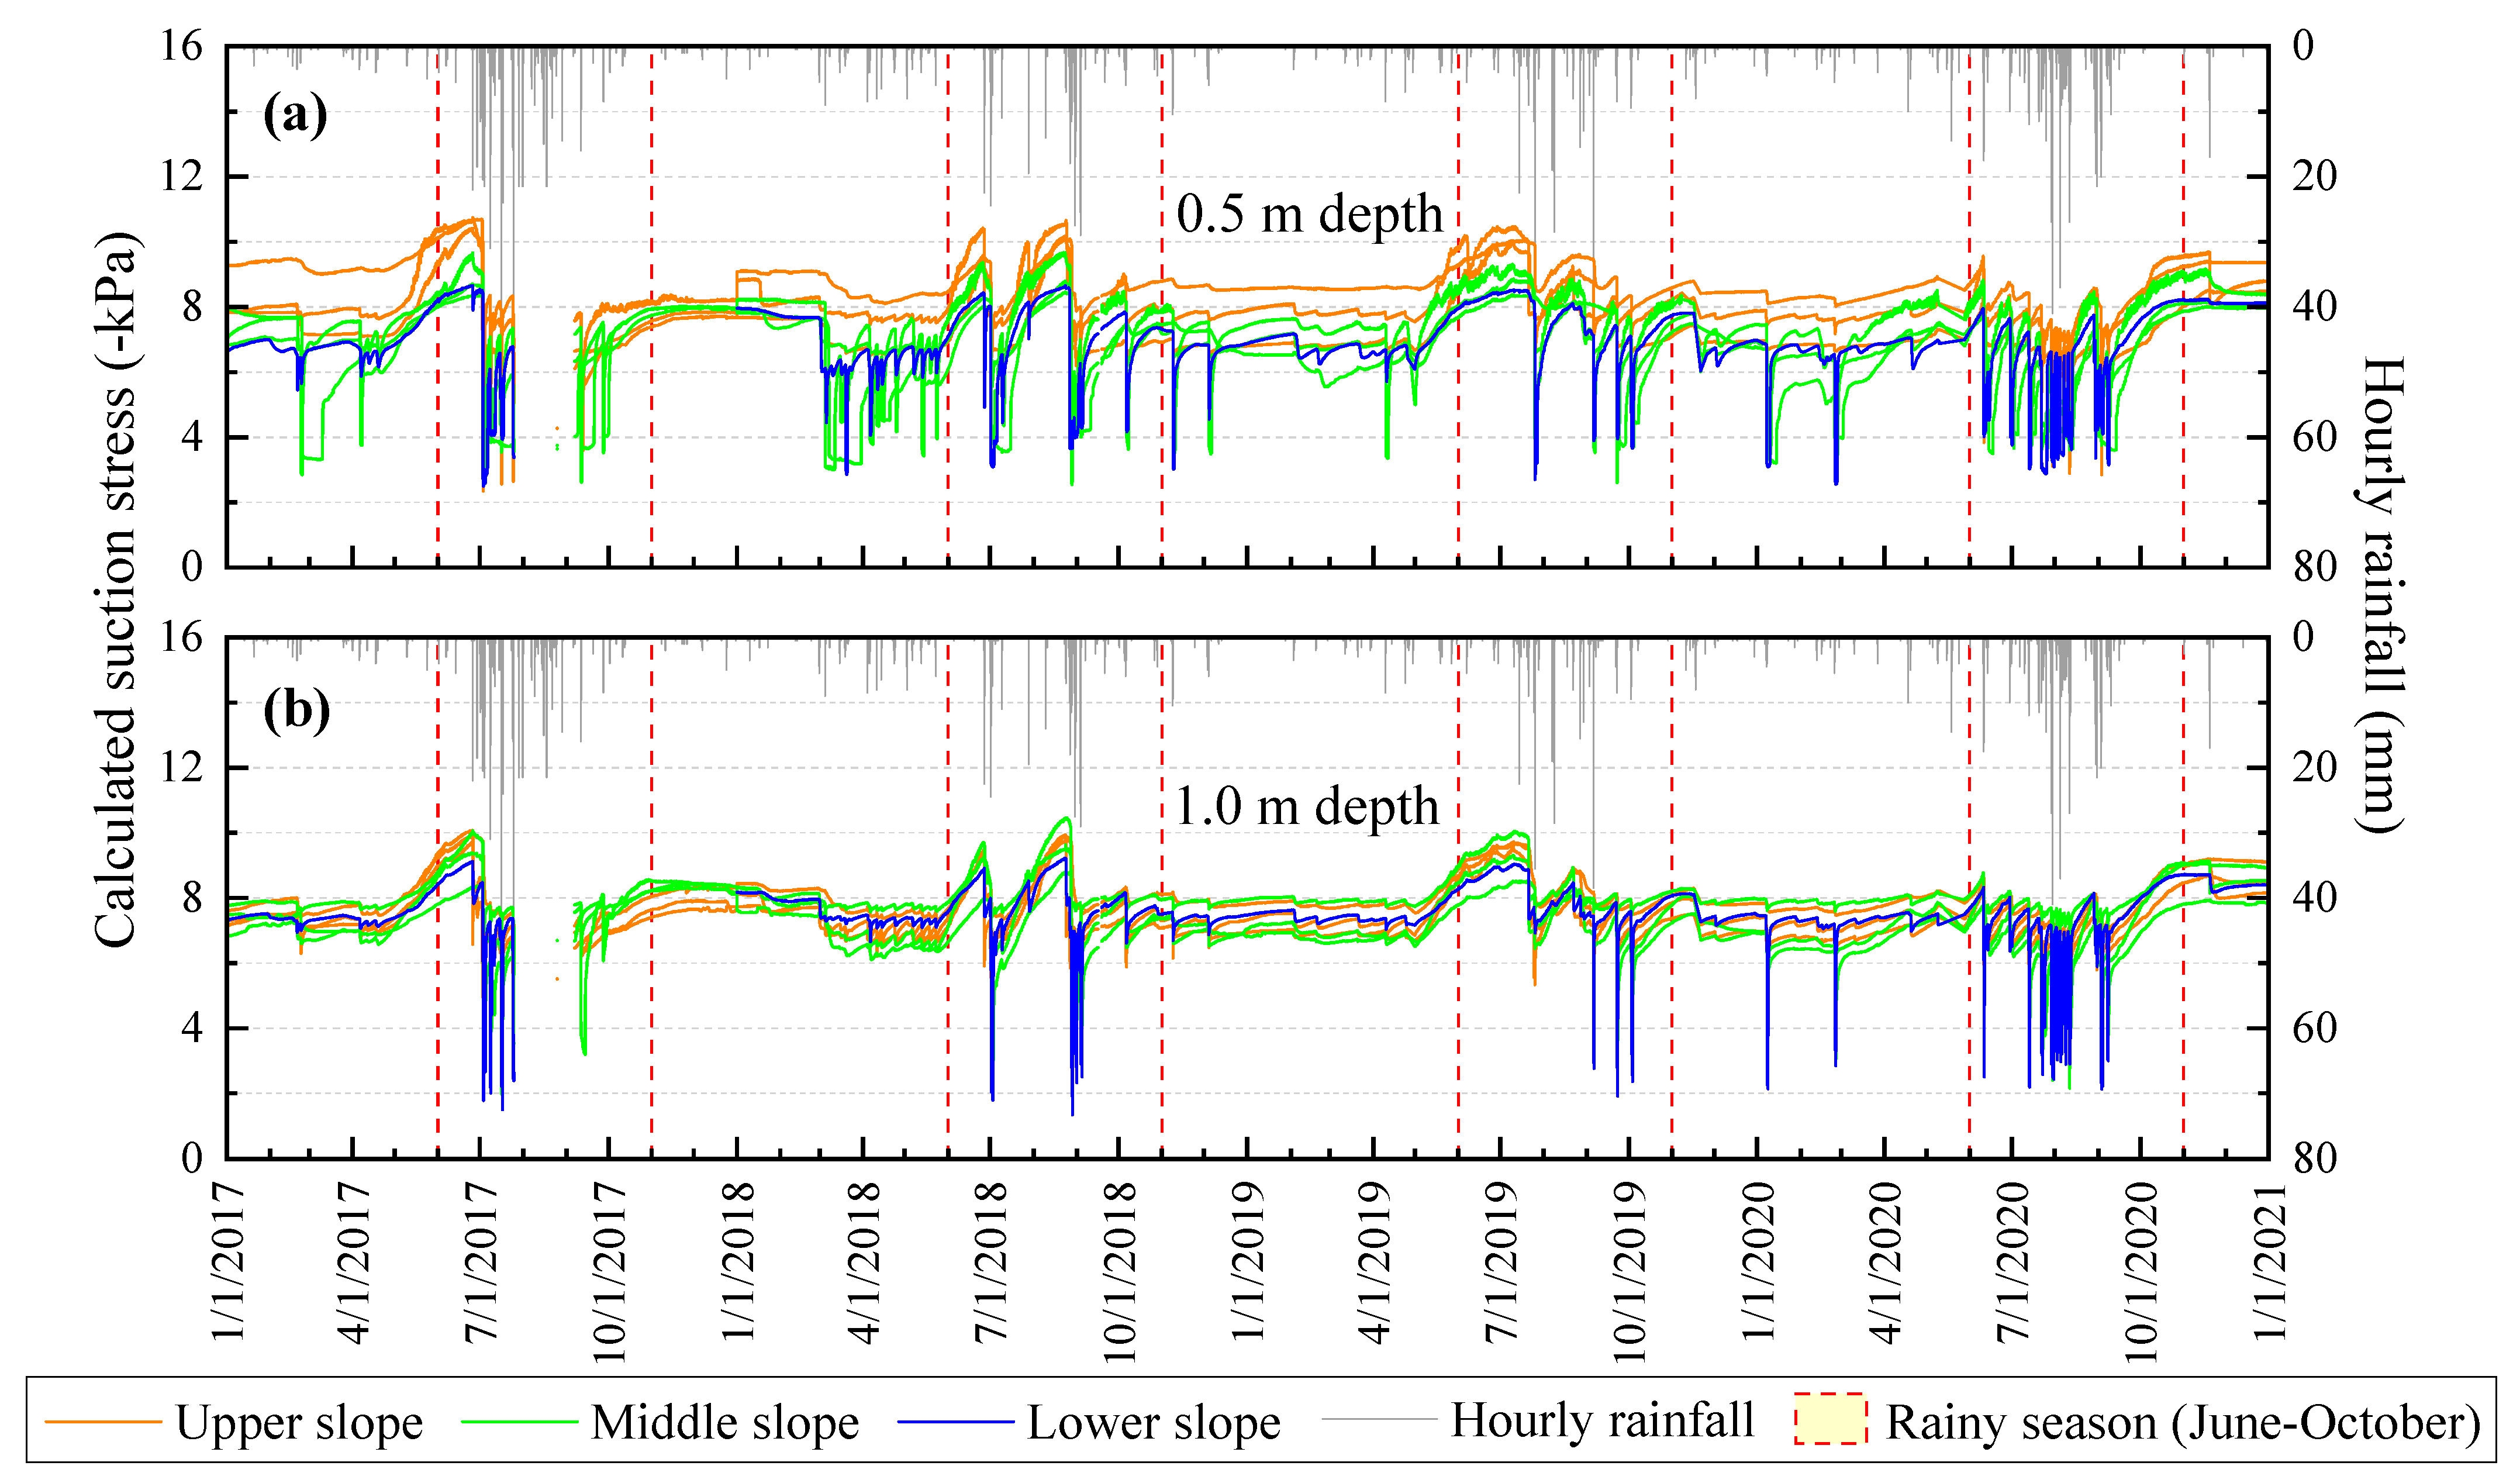
4.1. Estimations of Matric Suction and Suction Stress

As a result of rainfall infiltration, the degree of saturation increases, while matric suction decreases in soils according to a unique relationship represented by the SWCC. These subsurface hydrologic processes conclusively determine the variations in the suction stress and net interparticle stress generated within unsaturated soils, according to the unique relationship represented by the SSCC [22]. Rainfall-induced landslides can be interpreted as a result of the considerable reductions in these suction stresses on potential failure interfaces in slopes. In the case of shallow landslides in natural slopes of mountainous terrains in South Korea, the slip surfaces typically form at depths of about 1 m in shallow soil layers overlying bedrock [25]. From a pedogenic perspective, we propose that the sliding mostly occurs in soil horizon transitions from C to R or within the C horizons, based on our accrued experience in conducting investigations on shallow landslide source areas in Korea. More specifically, unconsolidated parent earth materials and partly weathered rock fragments are readily observed in the source areas, whereas bedrock surfaces are often exposed on the slip surfaces. Therefore, it is important to estimate the matric suction and suction stress based on the results of VWC measurements at shallow soil depths where slip surfaces are typically created.
Figure 9 shows temporal variations in matric suction in the Songnisan station slope plotted against the distributions of hourly rainfalls during the four years of the study. The matric suction values were estimated based on the measurements of water content (Figure 8) and the SWCC relationship as formerly shown in Figure 6a. Although matric suction was not a primary source variable for the analyses in this study, but rather a derived variable from VWC, trends of the derived matric suction values were analyzed. This is because the matric suction is considered the most familiar and widely used concept to interpret shear strength properties and consequent sliding phenomena in unsaturated soils [35].
At the 0.5 m depth, the calculated values of matric suction varied from approximately 3 to 120 kPa. At the 1.0 m depth, the calculated values varied from approximately 1.4 to 105 kPa. During the non-rainy seasons, the slope tended to retain a calculated matric suction of approximately 30 kPa on average. However, entering rainy (or landslide-prone) seasons in the summer, the matric suction started to increase as much as the rainfall stoppage term persisted. As mentioned in Section 3.3, it is reasonable to interpret that the progressive increases in matric suction over relatively prolonged rainfall stoppage periods in rainy seasons mainly results from the evapotranspiration effects, whereas the recovery of downward spikes of matric suctions that are instantly induced by rainfall are primarily governed by drainage effects over relatively short periods of time.
In addition, consistent with the results of the degree of saturation measurements, the 1.0 m depth (Figure 9b) exhibited lower sensitivities to rainfall and less dispersion in the calculated matric suction than the 0.5 m depth (Figure 9a). More specifically, the calculated matric suction values dropped upon strong (as well as some tenuous) rainfall at the 0.5 m depth. As a whole, the calculated matric suction tended to be greater in the order of upper, middle, and lower slopes in the 0.5 m depth, while there were no clear trends in the 1.0 m depth between the three sections of the slope. All the calculated matric suctions at a specific time were within the deviation range of approximately ± 10 kPa in the 1.0 m depth.
Figure 10 depicts the temporal variations in the calculated suction stress in the Songnisan station slope against the distributions of hourly rainfalls during the four years of the study. The suction stress was calculated by multiplying the effective degree of saturation in Figure 8 and the matric suction in Figure 9. This calculation involved Equation (5) and the SSCC in Figure 6b. Comparing Figure 9 and Figure 10 revealed that the calculated suction stress exhibited analogous variations compared to those in the calculated matric suction with more reduced magnitude trends in the higher range of the matric suction. This is because of the concurrent trends of the matric suction and suction stress with respect to an increase or decrease in the effective degree of saturation over its entire range (Figure 6). At the 0.5 m depth, the calculated suction stress varied from approximately 2.5 to 11 kPa. At the 1.0 m depth, it varied from approximately 1.3 to 10.5 kPa.
During the non-rainy seasons, the slope tended to retain a calculated suction stress of approximately 7.5 kPa on average. However, upon entering rainy (or landslide-prone) seasons in summer, the calculated suction stress started to increase as much as the rainfall suspended term was prolonged. As formerly discussed, the progressive increases in suction stress over relatively prolonged rainfall stoppage periods in rainy seasons mainly resulted from evapotranspiration effects, with the instantly induced downward spikes of suction stress during rainfall governed by drainage effects over relatively short times.
In addition, consistent with the results of the matric suction estimations, at 1.0 m (Figure 10b) sensitivity to rainfall was lower and dispersion among different sections under suction stress was less compared to the 0.5 m depth (Figure 10a). As mentioned above, the decreased suction stress values involved both intense and tenuous rainfall events at 0.5 m. Suction stress tended to be greater in the order of upper, middle, and lower slopes at 0.5 m, with no clear trends at the 1.0 m depth between the three sections of the slope. The calculated suction stresses at a specific time deviated by approximately ±1 kPa at 1.0 m.
Both the calculated matric suction and suction stress were more dispersed at 0.5 m than at 1.0 m within each section of the slope and between the three sections of the slope. In general, the sections that exhibited small suction stresses at 0.5 m were in the order of the lower, middle, and upper slopes. On the contrary, at 1.0 m the slope exhibited almost homogeneous hydro-mechanical behaviors (i.e., variations in moisture levels and suction stress) regardless of the measurement location. The findings indicate that the magnitude of net interparticle tensile stresses (i.e., suction stress) in unsaturated soils tends to decrease along the downslope direction, and this tendency fades as the depth increases. As mentioned above, this phenomenon is due to the tendency of infiltrated water flows to converge and accumulate from lower sections of slopes. Such hydro-mechanical processes may be one of the main reasons that translational slides are often observed in retrogressive slope failure types.

4.2. Evaluation of Shallow Landslide Hazards of Unsaturated Soil Slope

Figure 11 shows the calculation results of variations in the FOS in the Songnisan station slope during the four years of the study (2017–2020). The infinite slope stability was evaluated using Equation (1) and the previously estimated suction stress in unsaturated soil.
The FOS was maintained at approximately 5.1 and 3.1 in the 0.5 m and 1.0 m depths, respectively, in the non-rainy seasons, except for its sudden drops and rapid recoveries caused by some instant and mild rainfalls. However, during the rainy seasons (June to October) that occur in summer, the fluctuations became larger because of the increased temperature and number of moderate or intense rainfall events. During the rainy seasons, the FOS increased to 5.5 at maximum as rainfall stopped, and decreased to 4.3 at minimum as rainfall continued at 0.5 m; however, it increased to 3.3 at maximum as rainfall stopped and decreased to 2.6 at minimum as rainfall continued at 1.0 m. For example, an interim dry period occurred from 4 July to 22 August (Figure 11). Mainly due to evapotranspiration effects, the FOS at the 1.0 m soil depth increased by approximately 0.25 during this interim dry period. As shown in Figure 8, Figure 9 and Figure 10, the effective degree of saturation decreased by approximately 0.1 during the same period, whereas the matric suction and suction stress increased by approximately 60 kPa and 2.5 kPa, respectively.
Second, the slope exhibited larger dispersions in the FOS among different measurement locations at the 0.5 m depth compared to the 1.0 m depth. In particular, at the shallower depth, the slope exhibited a clearer tendency for a higher FOS in more upslope locations.
Third, the slope responded more sensitively to external factors, such as rainfall and temperature, at 0.5 m than at 1.0 m. In particular, in some cases of mild rainfall infiltration, wetting fronts were created and managed to penetrate 0.5 m into the soil. However, more intense and persistent rainfall conditions were necessary for the wetting fronts to penetrate to 1.0 m. This explains why in some mild rainfall events, the FOS sharply decreased at 0.5 m but remained constant at 1.0 m.
To better illustrate the typical temporal variations in rainfall and slope responses, shorter time windows during major rainfall event periods in each of the four years are illustrated in Figure 12. Only the FOS values at a 1.0 m depth were included in the figure to focus on the behaviors of a more typical sliding surface depth in shallow landslides in South Korea.
In Figure 12, six main moderate- or high-intensity rainfall events triggered drastic drops in the FOS. In 2017 and 2018, due to rainfall infiltrations, the FOS at 1.0 m (a lower slope section) during major rainfall events decreased to a minimum of 2.619 and 2.606, respectively. The two major rainfall events that triggered the minimum FOS values in 2017 and 2018 exhibited different rainfall characteristics to each other. More specifically, the rainfall event in 2018 gathered a larger rainfall amount with moderate intensities over longer durations, resulting in a slightly lower minimum FOS value than the rainfall event in 2017, which involved rainfalls with high intensities over shorter periods of time. The major rainfall event in 2020 consisted of two instances of rainfall separated by about a 13-h period without rainfall. The reason that the calculated FOS did not further decrease in response to the second instance of rainfall is connected to the limitations of this study, which will be discussed in Section 4.3.
On the other hand, it should be noted that the field conditions in mountainous terrain are not always effectively represented by idealized model conditions. Therefore, considering field uncertainties, two probable scenarios that induce more hazardous conditions were considered as follows.
First, the study site consists of weathered sandy soils that have relatively little cohesion effects. Moreover, some soils in the slope may have been disturbed by human activities and lost their cohesion. As shown in Figure 12, the infinite slope stability calculations under cohesionless conditions led to a decrease in the FOS by 1.37, resulting in minimum FOS values of 1.245 and 1.233 in 2017 and 2018, respectively.
In the second scenario, in addition to the cohesionless condition, the slopes adjacent to the Songnisan station with steeper terrain may have almost identical unsaturated soil properties. Thus, they would experience similar hydro-mechanical processes in the subsurface. As shown in Figure 12, if such a steep slope had an inclination over 30° with a negligible cohesion condition, the FOS would eventually decrease past 1.0, which is the limit of slope stability.
These results emphasize the necessity of considering the field uncertainties in landslide hazard assessments. Although high FOSs indicating stable states can be derived from an immediate measurement location in a slope of interest, the slope, in reality, may become unstable and even fail because of slightly different field conditions.

4.3. Future Study: Validating Continuous Rainfall as an Index of Slope Moisture Conditions

Long-term hydrological monitoring of slopes also provides valuable data that can help find an optimal definition of a rainfall parameter as an indicator of slope moisture conditions. In this section, the preliminary test results of analyzing monitored data in the Songnisan station to validate the definition of a rainfall parameter are discussed. Park et al. [36] proposed the concept of continuous rainfall as an index of slope moisture conditions in natural terrain that may lead to the initiation of shallow landslides. Continuous rainfall was defined as cumulative rainfall that includes a series of rainfall events with intervening rainfall-free times shorter than 24 h. Therefore, a continuous rainfall event was terminated when the period of no rainfall exceeded 24 h.
Figure 13 shows temporal variations in the continuous rainfall amounts and the matric suctions at 1.0 m in the slope of the Songnisan station during major rainfall event periods in each of the four years. A comparison of the black dotted line and the blue straight line in Figure 13 revealed that the amount of continuous rainfall may successfully represent the matric suction (or moisture level) condition at 1.0 m in the lower slope.
In Figure 13, approximately 30 kPa seemed to be the initial matric suction at 1.0 m in wet soil conditions corresponding to a continuous rainfall amount of 0 mm. However, as shown in Figure 9, the matric suctions were much higher than 30 kPa at 1.0 m in the dry periods immediately before the first major rainfall events, and in the interim dry periods that lasted as long as one to two months during a rainy season. During all the rainy seasons in the four years of the study, the initial conditions of such higher matric suctions formed five times at 1.0 m. Except for these five cases, the continuous rainfall effectively represented sudden drops of matric suction from the 30 kPa initial condition and its recovery to the initial condition at 1.0 m.
The 24-h non-rainfall time in Figure 13, as a criterion to terminate a continuous rainfall event, seemed appropriate to represent the recovery time of the slope to its initial matric suction (or moisture level) condition through drainage processes.
In addition, in Figure 13, comparing the second continuous rainfall event in 2018 and the continuous rainfall event in 2019 revealed that the matric suction in the slope did not drastically decrease to near zero unless the continuous rainfall exceeded 100 mm.
In the case of the terraced continuous rainfall event in 2020 shown in Figure 13, we believe that in response to the second drastic increase in the continuous rainfall amount, the slope would have lost matric suction and further proceeded to exhibit positive pore water pressures. However, the estimated matric suction remained near zero, despite the second drastic increase in the continuous rainfall amount, because it was not possible to calculate the positive pore water pressure from the VWC. This highlights one of the main constraints in evaluating slope stability just by monitoring VWC.
In contrast to the lower slope, the level of matric suction in the upper and middle slopes did not correspond well with the continuous rainfall amount. Possible causes include: (1) downslope drainage processes being more rapid than vertical flows of subsurface water, (2) disturbances of natural conditions resulting from installation works, and (3) defective sensors. Clarifying the true causes of the disagreements between different sections of the slopes will require the cumulation of monitored matric suction data from a sufficient number of various sites over longer periods of time. Therefore, a conclusive definition and determination of continuous rainfall in South Korea requires more evidence from other monitoring sites. In this context, the KIGAM-LAMOS, which has been collecting monitored data every hour from the 12 landslide monitoring stations in eight national parks in South Korea since 2017, will be fundamentally important in future studies.
Once the optimal definition of continuous rainfall that effectively represents slope moisture conditions in South Korea is established through comprehensive long-term monitoring studies from various sites, well-qualified numerical analyses may provide valuable outputs. For example, each continuous rainfall amount can be linked to the corresponding degree of saturation on slopes. Furthermore, a critical amount of continuous rainfall, which is the minimum requirement for entering a phase of slope instability, can be found for each slope.

4.4. Cross-Sectional Conceptual Framework and Discussion of Limitations

A cross-sectional scheme of the conceptual framework derived from the four-year monitoring study results is illustrated in Figure 14. Soil profiles in natural weathered granite slopes in Korea are typically layered with O-A-B-C-R horizons from top to bottom. As previously mentioned, the formation of sliding surfaces is most often observed in soil horizon transitions from C to R, or within the C horizon. Slope moisture conditions are mainly determined by three different hydrological phenomena: rainfall infiltration, drainage, and evapotranspiration. Rainfall infiltration and drainage govern relatively short-term and instant variations in slope moisture conditions, whereas evapotranspiration is involved in relatively long-term and progressive variations during the summer seasons. The degree of saturation, which represents the slope moisture conditions, was taken as a primary source variable and monitored in this study. Based on the degree of saturation measurements at the typical soil depths of sliding surfaces, we estimated the corresponding matric suctions and suction stresses in unsaturated soils. As a result, the factor of safety values could be derived as the ratios between the resisting shear strengths and the driving shear stresses. Finally, warnings of shallow landslide hazards can be issued if the factor of safety drops below the unity.
However, it should be stressed that the proposed monitoring-based framework has several limitations. First, the framework is not applicable for extended regional areas; it is limited to single slope scales or locations that have been immediately monitored. Second, it can be costly and labor-intensive to execute the framework in practice as it requires various equipment as well as installation and maintenance. Third, the applicability of the framework for early warnings is limited to nowcasting as it is based on real-time monitored data instead of forecasted data. Lastly and most importantly, the framework of evaluating slope stability based on VWC (or the degree of saturation) monitoring possesses a loophole as it is not capable of deriving positive pore-water pressures in slopes, which are among the fundamental scenarios that trigger shallow landslides.
To complement such limitations of the monitoring-based framework, the combined application of physically based or probabilistic modeling approaches could be potential subjects to be addressed in future studies. Physically based modeling approaches analytically or numerically solve pore-water pressures in slopes using governing equations to analyze slope stability [27,28,37,38]. On the other hand, the probabilistic modeling approach derives landslide occurrence probabilities based on various statistical analyses and correlations of historical data [39].

5. Conclusions

A comprehensive understanding and valuable insights with respect to hydro-mechanical processes in slopes and the resultant shallow landslide hazards were obtained based on the detailed four-year monitoring results of rainfall and VWC. In particular, 14 VWC sensors were systematically arranged at two different depths and multiple locations on a single slope. The slope located in a landslide monitoring station in Mt. Songnisan National Park, where large-scale shallow landslides have occurred in the past, was selected as the study site. Temporal variations in matric suction and suction stress in the slope were derived using the SWCC and SSCC of the unsaturated soil, respectively. Consequently, variations in the FOS in the slope were calculated by applying an infinite slope stability model that adopted a unified effective stress concept proposed by Lu and Likos [22]. The conclusions are summarized as follows.
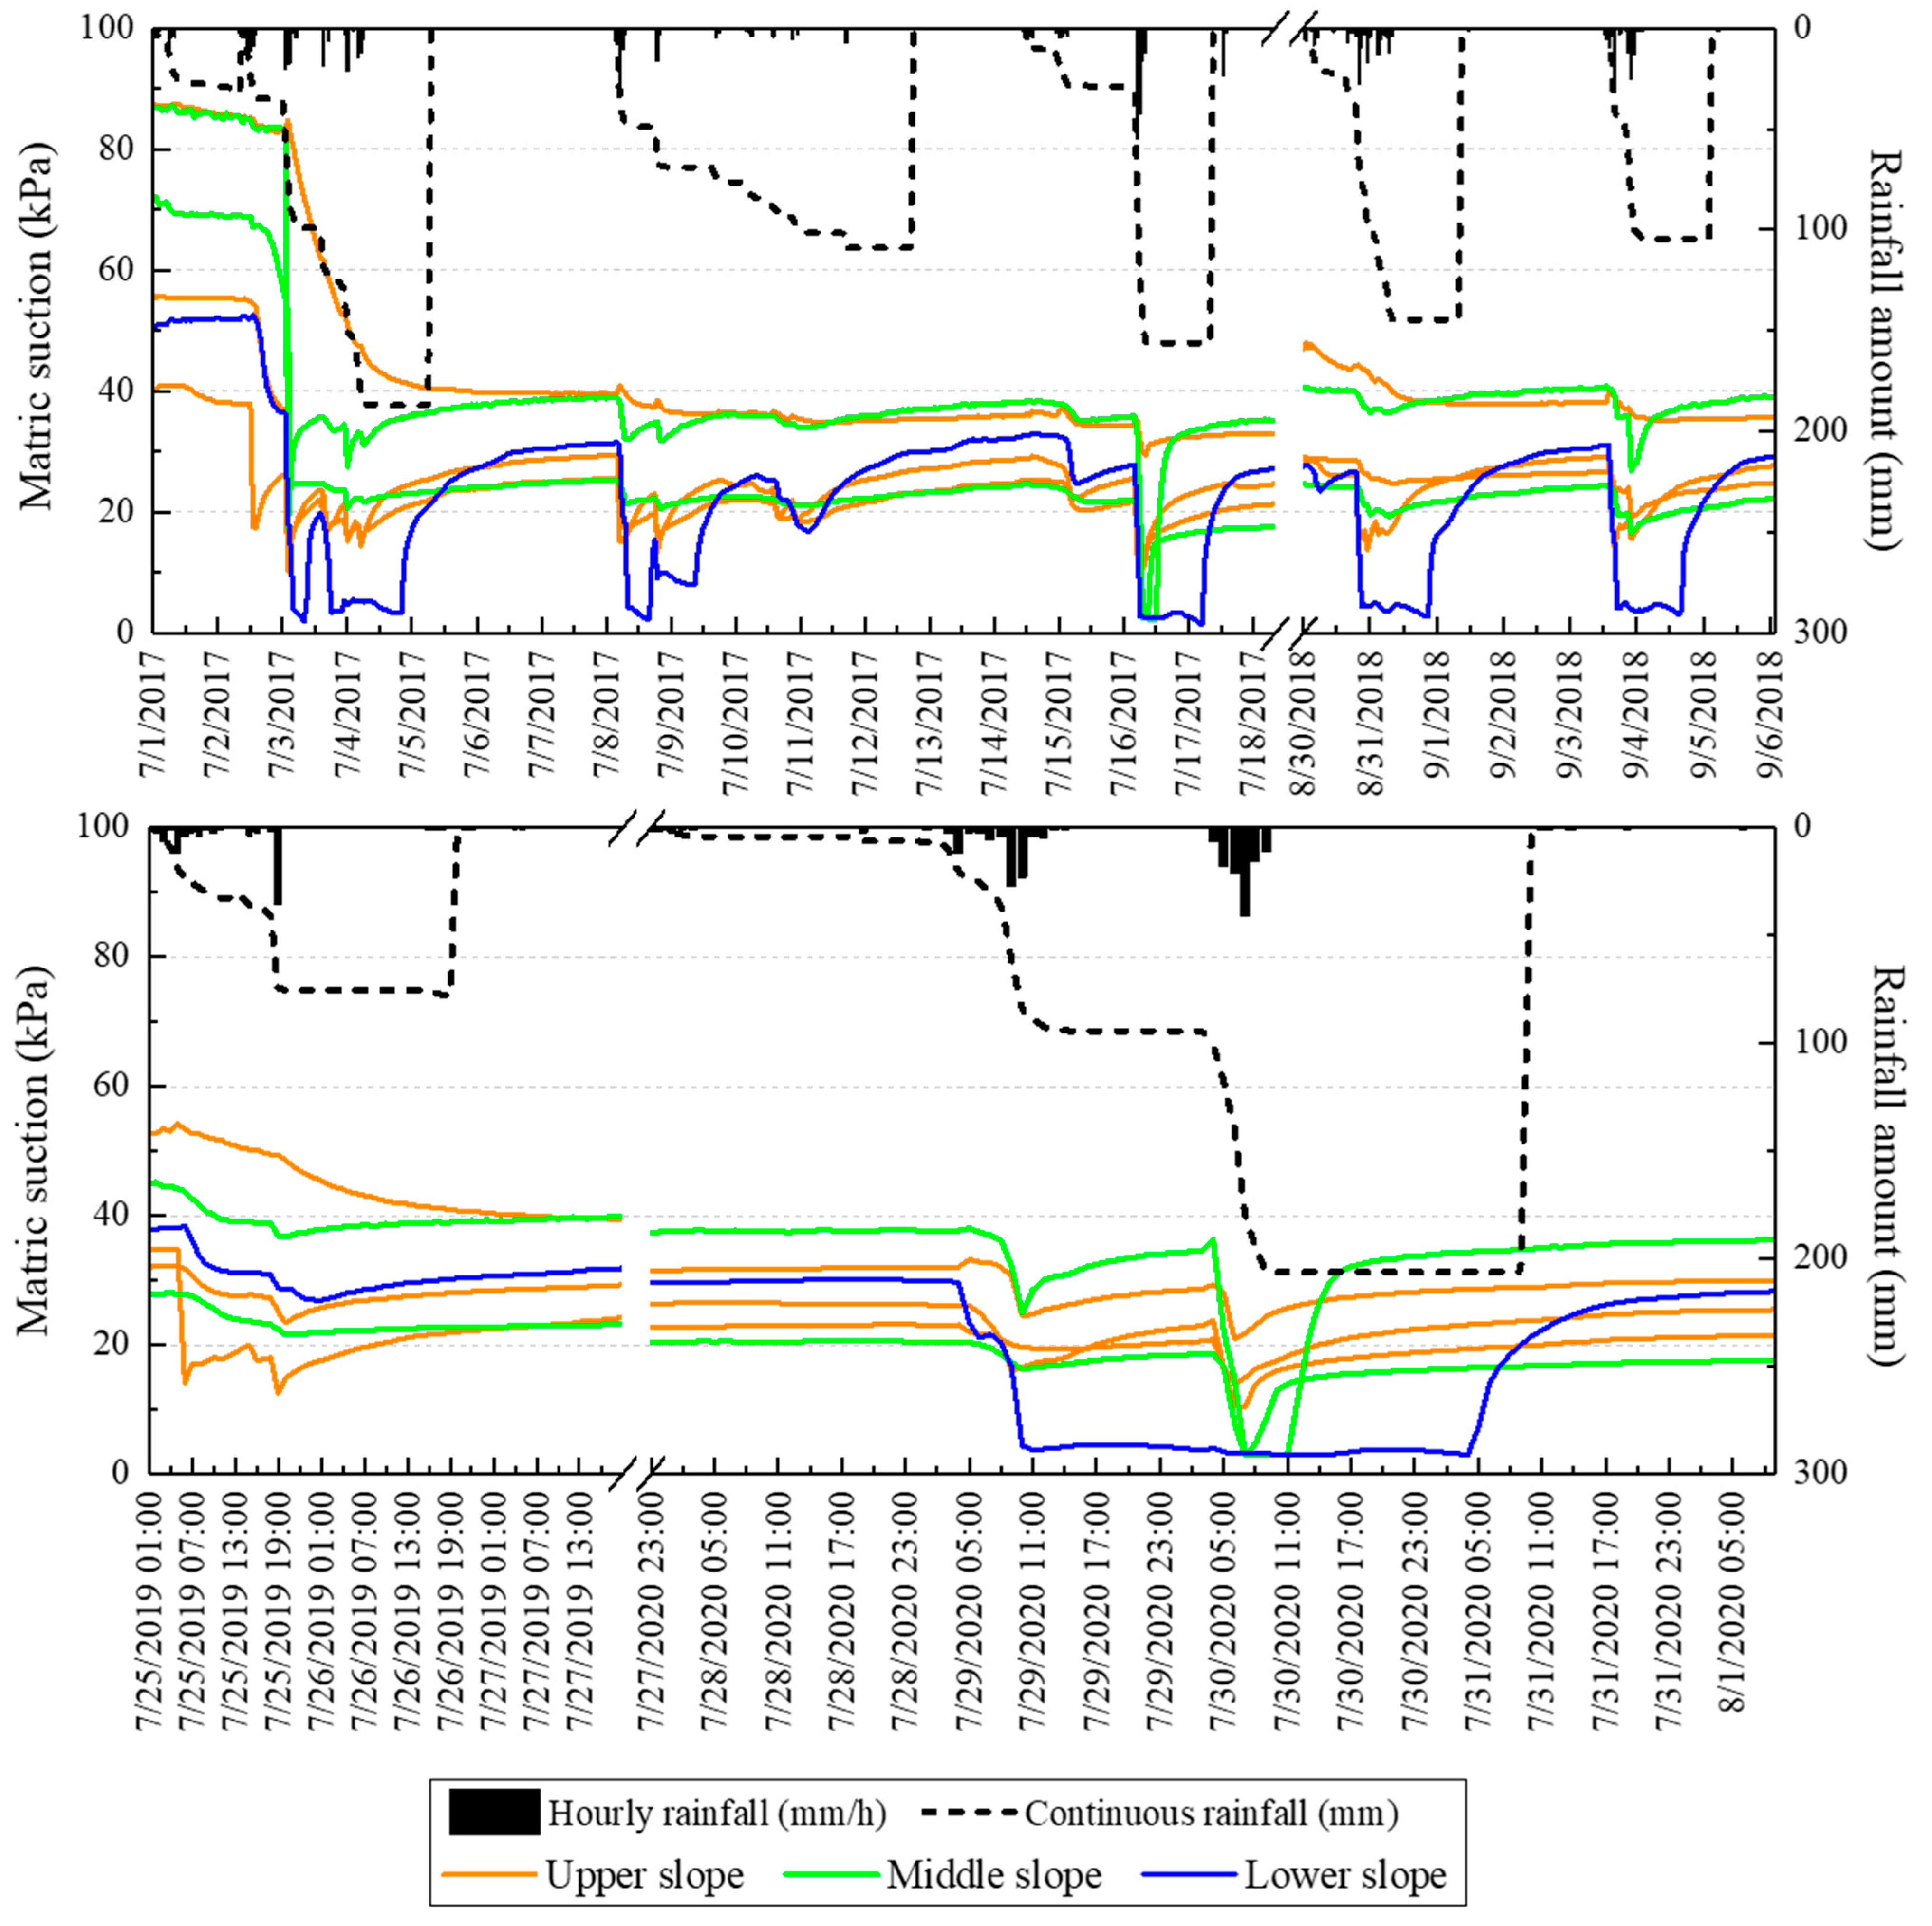
  • The monitoring results of VWC: it seemed that the slope had its own unique minimum moisture level that was retained and no longer drained during non-rainfall periods. Such a unique minimum moisture level of the slope corresponded to an effective degree of saturation of 0.2. The estimated matric suction and suction stress at the unique minimum moisture level were 30 kPa and 7.5 kPa, respectively. However, entering the rainy season in summer, further decreases in the moisture level less than the unique minimum were evident due to evapotranspiration effects. On the other hand, the drainage effects dominantly governed relatively instant and sharp reductions back to the unique minimum moisture level in the increased degrees of saturation in the slope induced by rainfall infiltration.
  • Different tendencies in the hydrological responses of the slope to rainfall existed between the 0.5 m and 1.0 m soil depths. The deeper location was less sensitive to rainfall and displayed less dispersion of the soil moisture level.
  • The soil moisture levels tended to increase along the downslope direction. This tendency faded as the depth increased. Accordingly, the magnitude of suction stress in unsaturated soils tended to decrease along the downslope direction. This is because infiltrated rainwater flows downslope and tends to converge and accumulate in the lower sections of the slopes. Such hydro-mechanical processes may be one of the main reasons that translational slides are often observed in retrogressive slope failure types.
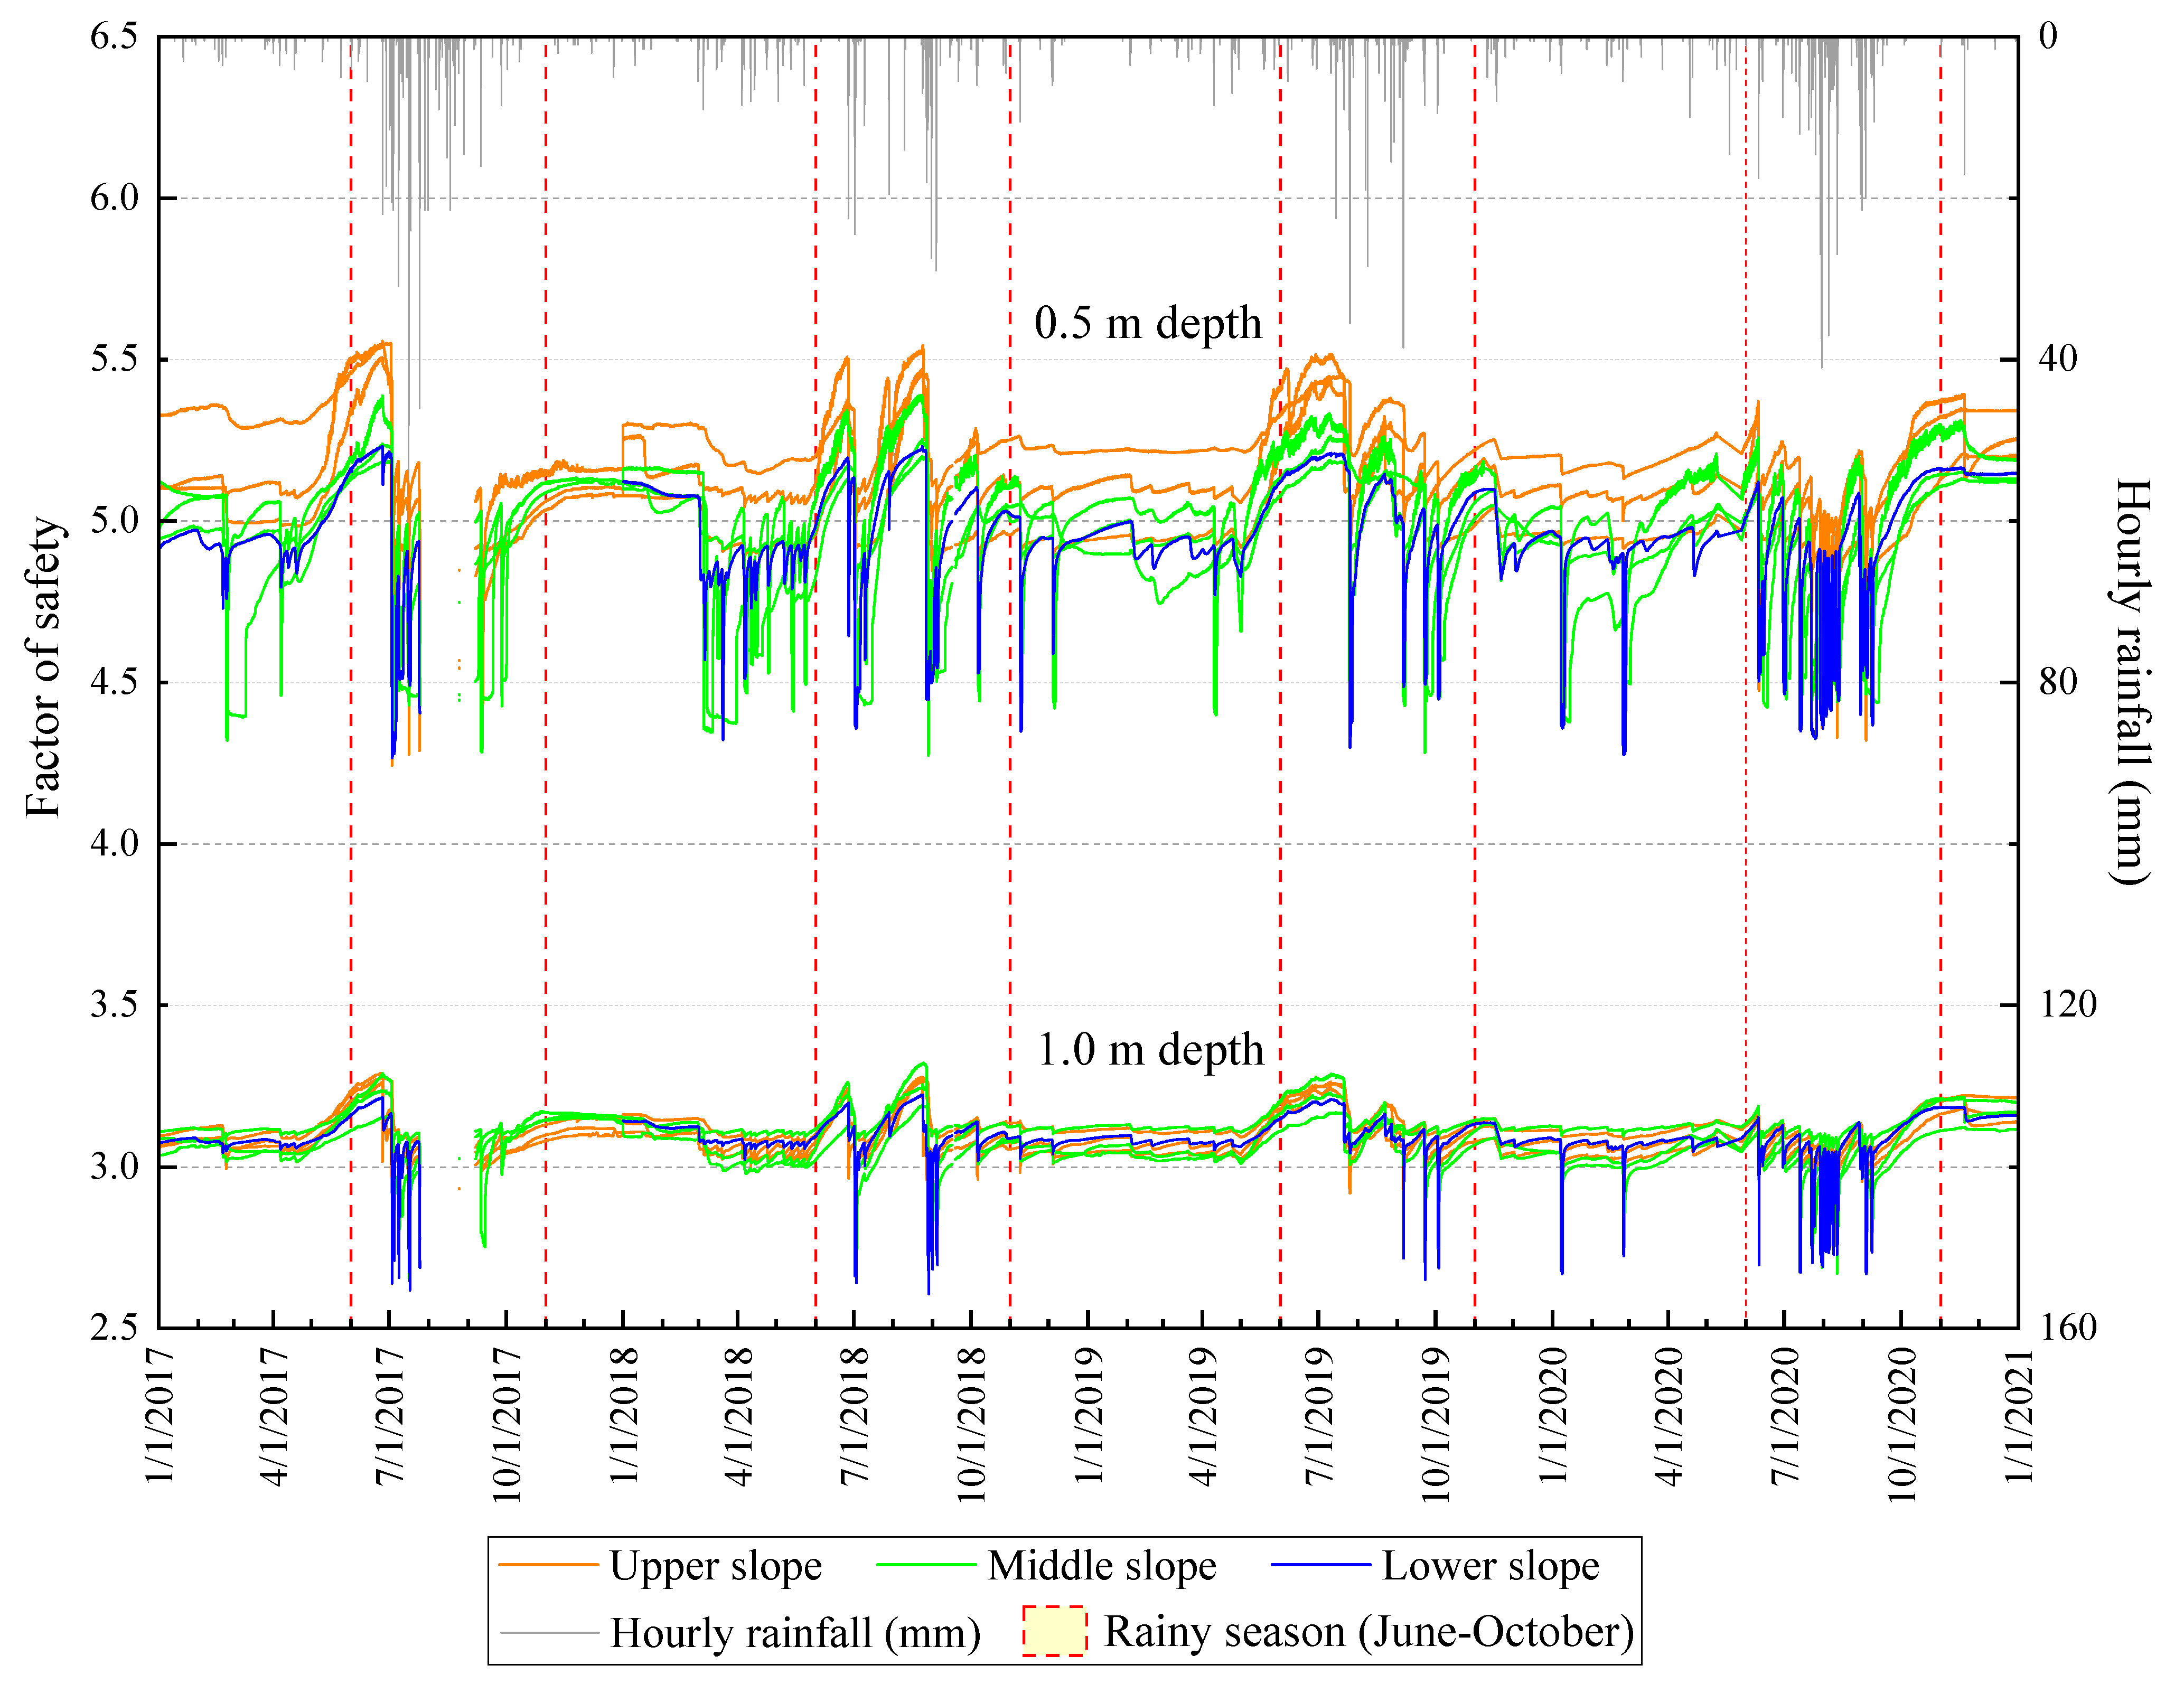
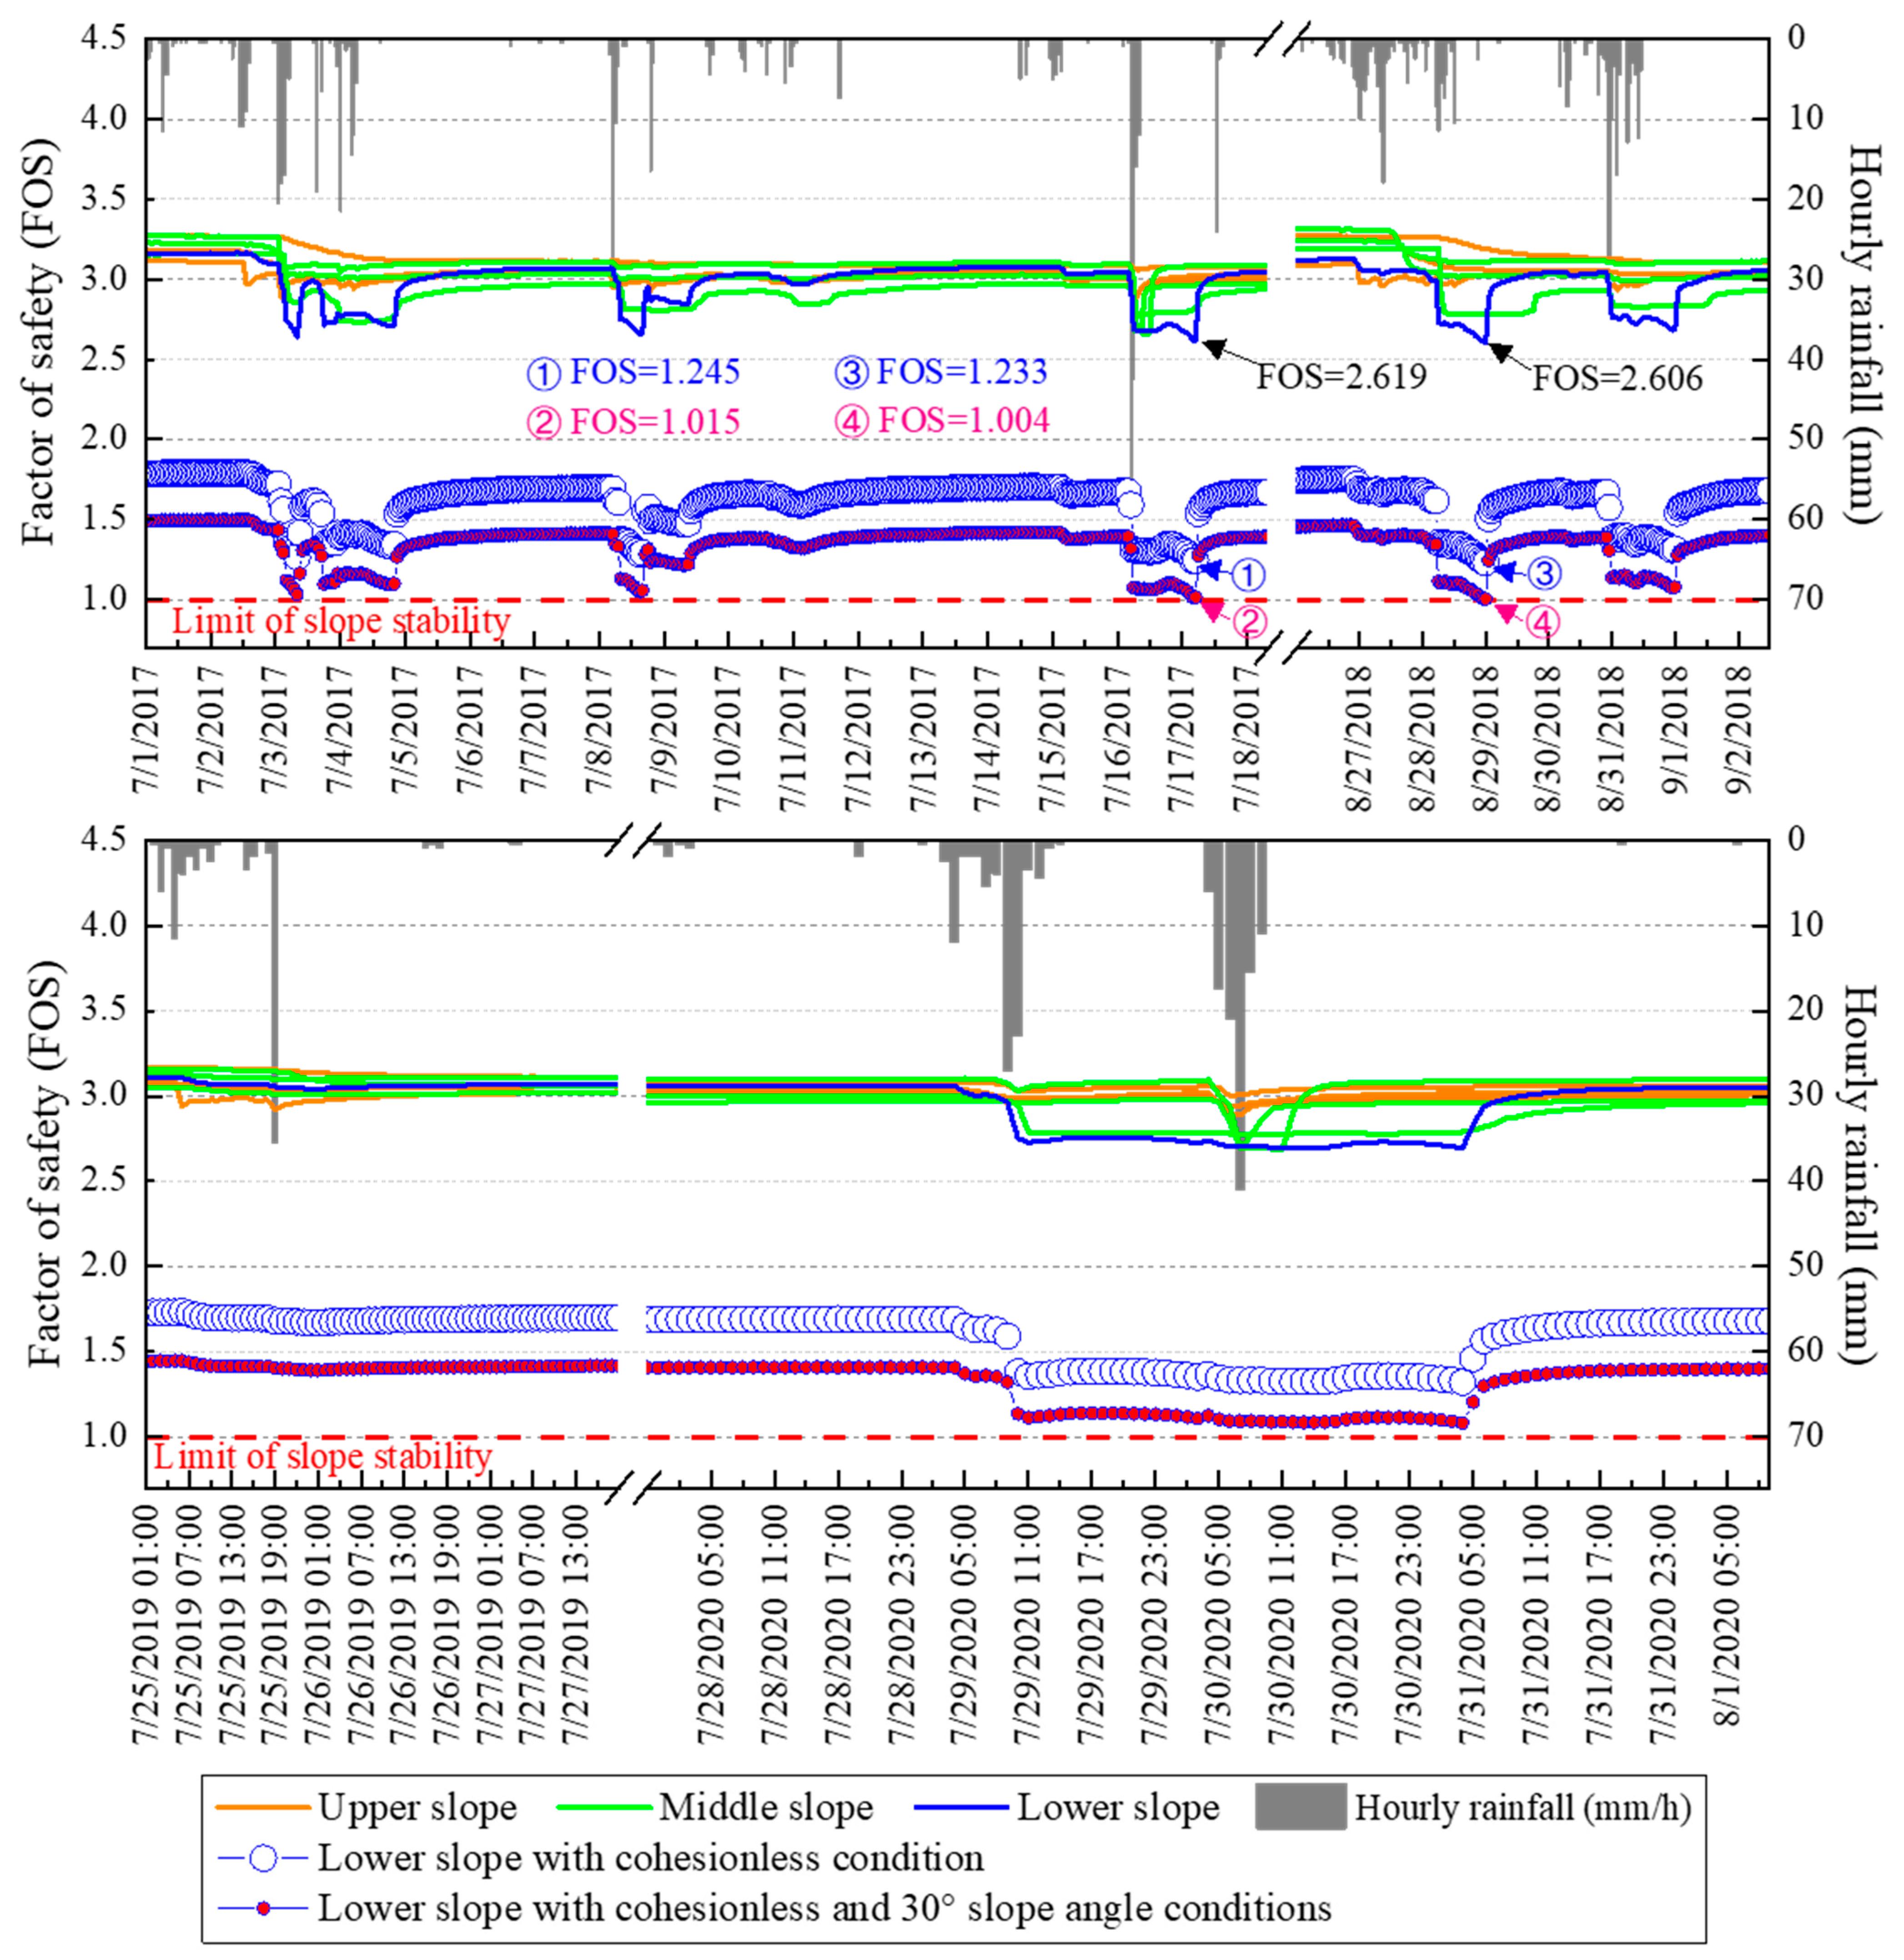
  • The calculated FOS values in the slope ranged from 4.3 to 5.5 at 0.5 m, and from 2.6 to 3.3 at 1.0 m. At the shallower depth, larger dispersions in the FOS were observed with higher FOSs in more upslope locations. The slope responded more sensitively to external factors, such as rainfall and temperature, at shallower depths.
  • Considering field uncertainties, a probable scenario with more hazardous slope conditions could be presumed, where cohesion effects were negligible and the slope was inclined over 30°. In this scenario, the minimum FOS decreased from 2.6 to less than 1.0, namely, the limit of slope stability.
  • Continuous rainfall, which has been previously proposed as an indicator of slope moisture conditions that could potentially lead to the initiation of shallow landslides, successfully represented the matric suction (or moisture level) condition at the 1.0 m depth in the lower slope, whereas this was not the case for the upper and middle slopes. Presuming no installation-induced errors, this is perhaps due to the downslope drainage processes being more rapid than the vertical flows of subsurface water.
  • Future analyses of monitoring data collected from various sites in other geological conditions in Korea are expected to numerically deduce the critical amount of continuous rainfall, which is a minimum requirement to enter a phase of slope instability for each slope. In this presumption, it is desirable in the future to establish an integrated shallow landslide hazard evaluation strategy that utilizes in parallel a monitoring-based real-time evaluation method and the numerically determined critical quantity of continuous rainfall to provide validated early warning information at a single slope and at a regional scale.
  • This study, which highlights a hydrological measurement-based shallow landslide monitoring framework, possesses several limitations: the high cost, the fact that it is not applicable for regional scales or forecasting, and the inability of the framework to derive positive pore-water pressures.
This study presents results of great significance for the landslide monitoring and risk assessment community. In particular, further insights into the hydrological processes leading to the initiation of shallow landslides can be gained through explicit and detailed monitoring analyses spanning several years. Furthermore, we may be able to develop an integrated advanced landslide early warning system through sustained efforts to combine the proposed shallow landslide monitoring framework with physically based or probabilistic modeling approaches.

Supplementary Materials

The following are available online at https://www.mdpi.com/article/10.3390/w13172330/s1.

Author Contributions

Conceptualization, J.-Y.P. and S.-W.J.; Data curation, J.-Y.P.; Formal analysis, J.-Y.P.; Funding acquisition, Y.-S.S.; Investigation, K.-S.K. and M.K.; Methodology, J.-Y.P.; Project administration, K.-S.K.; Resources, K.-S.K. and M.K.; Software, J.-Y.P.; Supervision, Y.-S.S.; Validation, J.-Y.P.; Visualization, S.-W.J. and J.-Y.P.; Writing–original draft, J.-Y.P. and S.-W.J.; Writing–review and editing, K.-S.K. All authors have read and agreed to the published version of the manuscript.

Funding

This research was supported by the Basic Research Project (no. 21-3412-1) of the Korea Institute of Geoscience and Mineral Resources (KIGAM) funded by the Ministry of Science and ICT of Korea.

Institutional Review Board Statement

Not applicable.

Informed Consent Statement

Not applicable.

Data Availability Statement

The monitored and calculated data presented in this study are openly available in the attached Supplementary Materials.

Conflicts of Interest

The authors declare no conflict of interest.

References

  1. Froude, M.J.; Petley, D. Global fatal landslide occurrence from 2004 to 2016. Nat. Hazards Earth Syst. Sci. 2018, 18, 2161–2181. [Google Scholar] [CrossRef] [Green Version]
  2. Pachauri, R.K.; Allen, M.R.; Barros, V.R.; Broome, J.; Cramer, W.; Christ, R.; Church, J.A.; Clarke, L.; Dahe, Q.; Dasgupta, P.; et al. Climate Change 2014: Synthesis Report. Contribution of Working Groups I, II and III to the Fifth Assessment Report of the Intergovernmental Panel on Climate Change; IPCC: Geneva, Switzerland, 2014; p. 151. [Google Scholar]
  3. Chhorn, C.R.; Kim, G.; Yune, C.Y.; Lee, S.W. Analysis of the magnitude of debris flows in Korea. Nat. Hazards Rev. ASCE 2015, 16, 04015001. [Google Scholar] [CrossRef]
  4. Song, Y.-S.; Chae, B.-G.; Kim, K.-S.; Park, J.-Y.; Oh, H.-J.; Jeong, S.-W. A Landslide Monitoring System for Natural Terrain in Korea: Development and Application in Hazard Evaluations. Sensors 2021, 21, 3040. [Google Scholar] [CrossRef] [PubMed]
  5. Locat, J.; Lee, H.J. Submarine landslides: Advances and challenges. Can. Geotech. J. 2002, 39, 193–212. [Google Scholar] [CrossRef]
  6. Intrieri, E.; Gigli, G.; Mugnai, F.; Fanti, R.; Casagli, N. Design and implementation of a landslide early warning system. Eng. Geol. 2012, 147–148, 124–136. [Google Scholar] [CrossRef] [Green Version]
  7. Pecoraro, G.; Clvello, M.; Piciullo, L. Monitoring strategies for local landslide early warning systems. Landslides 2019, 16, 213–231. [Google Scholar] [CrossRef]
  8. Savvaidis, P.D. Existing Landslide Monitoring Systems and Techniques; School of Rural and Surveying Engineering, The Aristotle University of Thessaloniki: Thessaloniki, Greece, 2003; pp. 242–258. [Google Scholar]
  9. Travelletti, J.; Delacourt, C.; Allemand, P.; Malet, J.P.; Schmittbuhl, J.; Toussaint, R.; Bastard, M. Correlation of multi-temporal ground-based optical images for landslide monitoring: Application, potential and limitations. ISPRS J. Photo. Rem. Sens. 2012, 70, 39–55. [Google Scholar] [CrossRef] [Green Version]
  10. Uhlemann, S.; Smith, A.; Chambers, J.; Dixon, N.; Dijkstra, T.; Haslam, E.; Meldrum, P.; Merritt, A.; Gunn, D.; Mackay, J. Assessment of ground-based monitoring techniques applied to landslide investigations. Geomorphology 2016, 253, 438–451. [Google Scholar] [CrossRef] [Green Version]
  11. Moore, J.R.; Gischig, V.; Button, E.; Loew, S. Rockslide deformation monitoring with fiber optic strain sensors. Nat. Hazards Earth Syst. Sci. 2010, 10, 191–201. [Google Scholar] [CrossRef]
  12. Mainsant, G.; Larose, E.; Bronnimann, C.; Jongmans, D.; Michoud, C.; Jaboyedoff, M. Ambient seismic noise monitoring of a clay landslide: Toward failure prediction. J. Geophys. Res. 2012, 117, F01030. [Google Scholar] [CrossRef] [Green Version]
  13. Fukuzono, T. A new method for predicting the failure time of a slope. In Proceedings of the IVth International Conference Field Workshop on Landslides, Tokyo, Japan, 23–31 August 1985; pp. 145–1050. [Google Scholar]
  14. Malet, J.P.; Maquaire, O.; Calais, E. The use of global positioning system techniques for the continuous monitoring of landslides: Application to the Super-Sauze earthflow (Alpes-de-Haute-Provence, France). Geomorphology 2002, 43, 33–54. [Google Scholar] [CrossRef] [Green Version]
  15. Calvello, M.; Cascini, L.; Sorbino, G. A numerical procedure for predicting rainfall-induced movements of active landslides along pre-existing slip surfaces. Intl. J. Num. Anal. Meth. Geomech. 2008, 32, 327–351. [Google Scholar] [CrossRef]
  16. Lim, T.T.; Rahardjo, H.; Chang, M.F.; Fredlund, D.G. Effect of rainfall on matric suctions in a residual soil slope. Can. Geotech. J. 1996, 33, 618–628. [Google Scholar] [CrossRef]
  17. Ng, C.W.W.; Zhan, L.T.; Bao, C.G.; Fredlund, D.G.; Gong, B.W. Performance of an unsaturated expansive soil slope subjected to artificial rainfall infiltration. Geotechniques 2003, 53, 143–157. [Google Scholar] [CrossRef]
  18. Springman, S.M.; Jommi, C.; Teysseire, P. Instabilities on moraine slopes induced by loss of suction: A case history. Geotechniques 2003, 53, 3–10. [Google Scholar] [CrossRef]
  19. Godt, J.W.; Baum, R.L.; Lu, N. Landsliding in partially saturated materials. Geophys. Res. Let. 2009, 36, L02403. [Google Scholar] [CrossRef]
  20. Damiano, E.; Olivares, L.; Picarelli, L. Steep-slope monitoring in unsaturated pyroclastic soils. Eng. Geol. 2012, 137–138, 1–12. [Google Scholar] [CrossRef]
  21. Bordoni, M.; Meisina, C.; Valentino, R.; Lu, N.; Bittelli, M.; Chersich, S. Hydrological factors affecting rainfall-induced shallow landslides: From the field monitoring to a simplified slope stability analysis. Eng. Geol. 2015, 193, 19–37. [Google Scholar] [CrossRef]
  22. Lu, N.; Likos, W.J. Suction stress characteristic curve for unsaturated soil. J. Geotech. Geoenviron. Eng. 2006, 132, 131–142. [Google Scholar] [CrossRef] [Green Version]
  23. Korean Soil Information System. Available online: http://soil.rda.go.kr/eng/index.jsp (accessed on 16 July 2021).
  24. Michoud, C.; Bazin, S.; Blikra, L.H.; Derron, M.H.; Jaboyedoff, M. Experiences from site-specific landslide early warning systems. Nat. Hazards Earth Syst. Sci. 2013, 13, 2659–2673. [Google Scholar] [CrossRef] [Green Version]
  25. Kim, K.S.; Song, Y.S. Geometrical and geotechnical characteristics of landslides in Korea under various geological conditions. J. Mt. Sci. 2015, 12, 1267–1280. [Google Scholar] [CrossRef]
  26. Skempton, A.W.; DeLory, F.A. Stability of natural slopes in London clay. Int. Conf. Soil Mech. 1957, 2, 378–381. [Google Scholar]
  27. Lu, N.; Godt, J. Infinite slope stability under steady unsaturated seepage conditions. Water Resour. Res. 2008, 44. [Google Scholar] [CrossRef]
  28. Giuseppe, F.; Simoni, S.; Godt, J.W.; Lu, N.; Rigon, R. Geomorphological control on variably saturated hillslope hydrology and slope instability. Water Resour. Res. 2016, 52, 4590–4607. [Google Scholar] [CrossRef] [Green Version]
  29. Song, Y.S.; Chae, B.G.; Lee, J. A method for evaluating the stability of an unsaturated slope in natural terrain during rainfall. Eng. Geol. 2016, 210, 84–92. [Google Scholar] [CrossRef]
  30. Van Genuchten, M.T. A Closed-form Equation for Predicting the Hydraulic Conductivity of Unsaturated Soils. Soil Sci. Soc. Am. J. 1980, 44, 892–898. [Google Scholar] [CrossRef] [Green Version]
  31. Lu, N.; Godt, J.W.; Wu, D.T. A closed-form equation for effective stress in unsaturated soil. Water Resour. Res. 2010, 46. [Google Scholar] [CrossRef]
  32. Song, Y.S.; Hwang, W.K.; Jung, S.J.; Kim, T.H. A comparative study of suction stress between sand and silt under unsaturated conditions. Eng. Geol. 2012, 124, 90–97. [Google Scholar] [CrossRef]
  33. Wayllace, A.; Lu, N. A transient water release and imbibitions method for rapidly measuring wetting and drying soil water retention and hydraulic conductivity functions. Geotech. Test. J. 2012, 35, 103–117. [Google Scholar]
  34. Park, J.Y.; Song, Y.S. Laboratory Experiment and Numerical Analysis on the Precursory Hydraulic Process of Rainfall-Induced Slope Failure. Adv. Civ. Eng. 2020, 2020, 2717356. [Google Scholar] [CrossRef]
  35. Lu, N. Is matric suction a stress variable? J. Geotech. Geoenviron. Eng. 2008, 134, 899–905. [Google Scholar] [CrossRef]
  36. Park, J.Y.; Lee, S.R.; Oh, S.; Lee, J.H.; Jeon, J.S.; Song, Y.S.; Park, H.S. Critical continuous rainfall map for forecasting shallow landslide initiations in Busan, Korea. Water 2020, 12, 2404. [Google Scholar] [CrossRef]
  37. Baum, R.L.; Godt, J.W.; Savage, W.Z. Estimating the timing and location of shallow rainfall-induced landslides using a model for transient, unsaturated infiltration. J. Geophys. Res. Earth Surf. 2010, 115, F3. [Google Scholar] [CrossRef]
  38. Chen, P.; Lu, N.; Formetta, G.; Godt, J.W.; Wayllace, A. Tropical storm-induced landslide potential using combined field monitoring and numerical modeling. J. Geotech. Geoenviron. Eng. 2018, 144, 05018002. [Google Scholar] [CrossRef]
  39. Lombardo, L.; Mai, P.M. Presenting logistic regression-based landslide susceptibility results. Eng. Geol. 2018, 244, 14–24. [Google Scholar] [CrossRef]
Figure 1. Landslides occurred in the study area in 1977 (a) and debris flow slides in 1984 (b).
Water 13 02330 g001
Figure 2. Site survey and regional characteristics in the study area: (a) main channel, (b) erosion, (c) check dam (with a man denoted by a dashed circle to provide scale), and (d) deposition of sediments at the bottom of the basin.
Water 13 02330 g002
Figure 3. The Songnisan landside monitoring station: (a) areal overview, (b) power supply, and (c) sensors used.
Water 13 02330 g003
Figure 4. Diagram of VWC sensor points layout in the Songnisan landslide monitoring station.
Water 13 02330 g004
Figure 5. Diagram of infinite slope stability analysis applying a unified effective stress model [22].
Water 13 02330 g005
Figure 6. Unsaturated soil properties at the Songnisan landslide monitoring station: (a) soil–water characteristic curve and (b) suction stress characteristic curve.
Water 13 02330 g006
Figure 7. Precipitation recorded during the four years (2017–2020) at the Songnisan landslide monitoring station.
Water 13 02330 g007
Figure 8. Effective degrees of saturation measured at the soil depth of (a) 0.5 m, and (b) 1.0 m, during 4 y (2017–2020) at the Songnisan landslide monitoring station.
Water 13 02330 g008
Figure 9. Four-year variations in matric suctions estimated in (a) 0.5 m and (b) 1.0 m soil depths at each of the three sections in the Songnisan landslide monitoring station.
Water 13 02330 g009
Figure 10. Four-year variations in suction stresses estimated in (a) 0.5 m and (b) 1.0 m soil depths at each of the three sections in the Songnisan landslide monitoring station.
Water 13 02330 g010
Figure 11. Four-year variations in the factor of safeties calculated at soil depths of 0.5 and 1.0 m at each of the three sections in the Songnisan landslide monitoring station.
Water 13 02330 g011
Figure 12. Hourly rainfalls and temporal variations in the factor of safety (FOS) values at 1.0 m under different slope conditions during annually representative rainfall events in the four-year study period.
Water 13 02330 g012
Figure 13. Comparison of continuous rainfall and matric suctions at 1.0 m in the slope of the Songnisan monitoring station during annually representative rainfall events in the four-year study period.
Water 13 02330 g013
Figure 14. Cross-sectional scheme of the conceptual framework derived from the four-year monitoring study.
Water 13 02330 g014
Table 1. Geotechnical properties of the soil at the Songnisan landslide monitoring station.
ParameterSymbol and UnitValue
Dry Unit Weightγd (g/cm3)1.34
Effective Cohesionc′ (t/m2)0.94
Effective Internal Friction Angleφ′ (°)28
Table 2. Curve-fit parameters of the SWCC model (van Genuchten [30]).
Test Conditionαnm
Drying Process0.1451.990.497
Wetting Process0.2451.7120.416
Publisher’s Note: MDPI stays neutral with regard to jurisdictional claims in published maps and institutional affiliations.

