Abstract
Nutrients carried in upstream rivers to lakes are the main cause of eutrophication. Building near-natural estuarine wetlands between rivers and lakes is an effective way to remove pollutants and restore the ecology of estuarine areas. However, for the existing estuarine wetland ecological restoration projects, there is a lack of corresponding evaluation methods and index systems to make a comprehensive assessment of their restoration effects. By summarizing a large amount of literature and doing field research, an index system was constructed by combining the characteristics of the near-natural estuarine wetlands themselves. It covered environmental benefits, technical management and maintenance, and socio-economic functions, and contained 3 systems, 7 criteria, and 16 indicators. The analytical hierarchy process (AHP) was used to determine the weights of each indicator. The top 5 indicators in order of importance were habitat diversity, total phosphorus (TP), coverage of aquatic plants, ammonia nitrogen (NH3-N), and adaptation to the surrounding landscape. The above evaluation system was used for the comprehensive evaluation of the water purification project in the Fuhe estuarine wetland, Hebei Province, as an example. The results showed that the comprehensive score of the Fuhe estuarine wetland at this stage was 4.1492, and the evaluation grade was excellent. The effect of water purification and ecological restoration was good, and the selected technology was suitable and stable in operation. It had a greater positive impact on the surrounding economy and society and can be promoted and applied. The research results were important for clarifying the advantages and defects of the project and developing efficient and advanced restoration technologies.
1. Introduction
Wetlands play an important role in protecting biodiversity and regulating regional climates [1]. However, with the rapid socio-economic development, more and more nutrients have entered the wetlands. The eutrophication of water bodies has become a worldwide problem attracted great concern [2,3]. The nutrients carried by upstream rivers into wetlands are the main exogenous pollution. Wang et al. found that harmful algal blooms in Lake Erie were mainly caused by exogenous pollution from rivers [4]. Pei et al. concluded that pollutants in the Fuhe River could threaten the water quality and ecosystem of Baiyangdian Lake [5]. The control of nutrients in rivers is essential to control eutrophication and restore the ecosystem.
An estuarine wetland buffer area can be defined as a transitional zone between terrestrial and aquatic ecosystems, consisting mainly of plants, substrates, and microorganisms [6]. Adsorption by substrate, uptake by plants, and transformation by microorganisms are the main processes of water purification in estuarine wetlands [7]. In addition to reducing nutrient concentration, the construction of wetlands also brings benefits to flow regulation, ecosystem stability, and landscape improvement [8]. Since the 21st century, China has established lots of near-natural estuarine wetlands in Dianchi Lake, Erhai Lake, Chao Lake, and Fuxian lake, which have effectively reduced pollutants such as nitrogen and phosphorus and restored the ecology of estuarine areas [9,10,11].
Many scholars have done plenty of research on substrate selection, plant and microbial purification mechanism, and operational parameters adjustment of estuarine wetlands for a long time [12,13,14,15]. However, there is a lack of studies on the evaluation of estuarine wetland projects. Several indices including the water quality index, biological index, and land type index are used to evaluate the water quality and ecology of estuarine wetlands [16,17,18]. The application of these methods only evaluates one aspect and does not provide a comprehensive method and system for evaluating the technology and engineering of near-natural estuarine wetlands so far. Therefore, it is important to establish a comprehensive set of index evaluation system to analyze accurately and scientifically the advantages and defects and develop efficient and advanced ecological restoration techniques for estuarine wetlands. AHP is a multi-criteria way of thinking, which combines qualitative analysis and quantitative analysis, to hierarchize and quantify the evaluation process [19]. The group decision-based hierarchical analysis can synthesize the knowledge and information of different experts and reduce the subjective influence with the help of group wisdom. AHP has become one of the most widely used methods for the practical solution of multi-criteria decision problems such as evaluate the suitability of coastal zone reclamation [20,21], but the application in the evaluation of near-natural estuarine wetlands has not been reported.
In this study, a four-level evaluation index system was constructed containing environmental benefits, engineering, technology, and socio-economics aspects. The indicators were assigned weights using group decision hierarchy analysis and the evaluation thresholds were determined to form a complete estuarine wetland evaluation system. To verify the effectiveness of this evaluation system, the largest near-natural estuarine wetland in North China, the Fuhe estuarine wetland, was evaluated as a case. The evaluation results are beneficial for the long-term management and sustainable operation of the Fuhe estuarine wetland. They are also significant for the subsequent clarification of the advantages and defects of other near-natural estuarine wetland projects and help to develop efficient and advanced ecological restoration techniques for estuarine wetlands.
2. Materials and Methods
2.1. Construction of the Indicator Hierarchy
The selection and determination of indicators should follow the following principles: scientific and reasonable, comprehensive and systematic, highlighting the focus, and the method follows the target.
We organized and analyzed domestic and foreign cases of ecological restoration project evaluation and ecological health evaluation for rivers and lakes. Based on that, in the implemented projects, the evaluation index only targeted the water purification effectiveness. Therefore, the evaluation results only reflected the water quality of water bodies and could not cover the condition of the whole ecosystem. In addition, the socio-economic and engineering technical indicators were not comprehensive enough, and the expression of restoration effect evaluation was not rich enough [22,23]. In this study, a hierarchical structure model of the evaluation index system was established by using hierarchical analysis. The model incorporated three aspects of ecological environment, engineering technology, and socioeconomics and combined with the frequency of literature indicators and the expert scoring. Combined with the frequency of literature indicators, four layers of target layer (A layer), system layer (B layer), criterion layer (C layer), and indicator layer (D layer) were constructed. Among them, the system layer included ecological benefits, technical management, and maintenance as well as socio-economic functions. Seven criterion layers of water quality, biology, technology, engineering, maintenance, society, and economy were set under the system layer. The evaluation index system of water quality purification project of near-natural wetlands in estuaries was constructed from multiple aspects and perspectives. Table 1 shows the indexes and calculation methods.

Table 1.
Evaluation index system and description.
2.2. Determination of Indicator Weights
AHP is a method that organically combines qualitative and quantitative indicators. It treats the research object as a system and assigns weights according to decomposition, comparative judgment, and synthesis, quantifying the degree of influence of each factor in each level on the results [24]. In this paper, a hierarchical analysis based on group decision making was used to determine the weights of each indicator. Seventeen experts in the same field from universities, research institutes and design institutes and 12 senior engineers from ecological restoration project construction companies participated in the evaluation process. Based on the two-by-two judgment of the experts on the indexes, a consistent aggregated judgment matrix was constructed. The judgment matrix construction method and consistency test are as follows.
2.2.1. Construction of Judgment Matrix
The importance of each element in the same level to the upper level was compared pairwise and the judgment matrix was constructed. The expert scoring uses the ‘1–9 scale method’ proposed by Professor Saaty [25]. This method can determine the importance among the indicators and can reduce the influence of subjectivity of experts and other uncertainties [26]. Let m expert groups consisting of S1, S2, …, Sm score the n indicators B1, B2, …, Bn. Let the i-th expert score the j-th indicator Bj as: (0 ≤ ≤ 100, ∈ Z), and the average value of each expert’s score on the j-th indicator is according to Equation (1), and the n-dimensional vector is obtained. Take as the judgment matrix of the expert group, where ∈ (1, 2, ……, n), and the judgment form is as in Equation (2):
2.2.2. Weight Calculation and Consistency Test
According to the judgment matrix of subfactors at a certain level, the weight of subfactors at that level was calculated. The eigenvalues of the judgment matrix A were solved to find the maximum eigenvalue , and put into Equation (3) to solve for x, and normalize x to get eigenvector , where was the weight value of subfactors at a certain level. The weights from the target level to the system level, the system level to the criterion level, and the criterion level to the indicator level were calculated sequentially. The consistency test was done using the consistency index and the consistency ratio where and were calculated by the formulas by Equations (4) and (5). When ≤ 0.1, the consistency of the judgment matrix is considered good. Otherwise, experts need to be asked to reconsider and confirm the scores of each index. Note that when n = 1, 2, takes 0, at this time, there is no need to calculate again, and it can be considered to satisfy the consistency.
where, E is the identity matrix with all diagonals being 1 and other elements being 0; n is the order of the judgment matrix; is the average random consistency index corresponding to n, which is obtained by looking up the Table S1.
Using the above method to calculate the indicator weights at each level. The final assignment results are shown in Table 2. The system layer to target layer, criterion layer to system layer, and indicator layer to criterion layer consistency parameters are all less than 0.1, indicating that the results meet the consistency requirements. The weight ranking from the indicator layer to the target layer indicates the importance ranking of the indicators in the system. In this index system, the top 5 indexes in order of weight are: habitat diversity, TP, coverage of aquatic plants, NH3-N, and adaptation to the surrounding landscape.
Table 2.
The weight of each level of indicators.
2.3. Indicator Thresholds and Evaluation Methods
2.3.1. Determination of Indicator Thresholds
The evaluation indicators selected for the indicator system are both qualitative and quantitative indicators. Referring to the Environmental Quality Standard for Surface Water (GB3838-2002) and combining with a large amount of ecological restoration project evaluation information, the quantitative indicators were divided, and the evaluation thresholds of the indicators were determined (Table 3). In the evaluation of the qualitative indicators, the grades were divided according to Table S2. The setting of the thresholds in this paper has been proofread by experts, which is scientific and can ensure the accuracy of the evaluation results.
Table 3.
Threshold value and score of evaluation system.
2.3.2. Evaluation Result Grading
The final score was calculated by direct weighting method, referring to the following Formula (6). According to the scores of each index, the final evaluation results are divided into 5 levels: poor, relatively poor, average, good, and excellent. Based on the characteristics of each level and combined with the actual research, the evaluation results are outlined for each level of status. It should be ensured that the evaluation results can clearly and intuitively reflect the restoration status, and the evaluation grading is shown in Table 4. In order to further analyze the benefits of each system layer of the estuarine wetland and accurately analyze the impact of water quality, technology, engineering, economy, and society on the evaluation results, the system layer was divided into three levels: poor, average, and excellent. The division Criteria and descriptions are shown in Table 5, , , are the scores of environmental benefits, technical management and maintenance, social and economic functions, respectively. A range of system level scores was obtained by multiplying the system level weights with the lowest score of 1 and the highest score of 5, respectively. Afterwards, this range was averaged into three ranges to obtain the range of scores for each level of the system layer.
where F is the evaluation score; is the score of the i-th evaluation index; is the weight of the i-th evaluation index; n is the total number of evaluation indexes; and n = 16 in this evaluation system.
Table 4.
Classification of evaluation results of ecological restoration projects.
Table 5.
Classification of evaluation results of system level.
3. Case Study
3.1. Overview
Baiyangdian Lake, known as the “Kidney of North China”, is crucial as a critical node for maintaining the ecological balance of North China, regulating the climate of the Hebei Plain and even the Beijing-Tianjin region, supplementing groundwater sources, regulating floods, and protecting biodiversity and rare species resources [27]. With socio-economic development, the volume of water entering Baiyangdian Lake has gradually shrunk, resulting in serious fragmentation of the wetland ecological landscape, gradual reduction of the ecological function and the decrease of biological species year by year [28,29]. The PuRiver, Cao River and the Fu River are the three upstream rivers of Baiyangdian Lake. As they flow through towns and cities, the discharge of agricultural non-point source pollution, domestic sewage, and tailwater from sewage treatment leads to poor water quality of the rivers [30]. These are the main pollution source of Baiyangdian Lake, especially in the western part. The water quality is directly related to the water safety of Baiyangdian Lake [31]. In September 2020, the construction of the water quality purification project at Fu River estuary was completed. Its function is to purify the three rivers and increase the stability of the ecosystem of estuary. The project is located in the north of Anxin Jianchang Village, near Zhaili Town, where three rivers converge. The geographical location is shown in Figure 1.
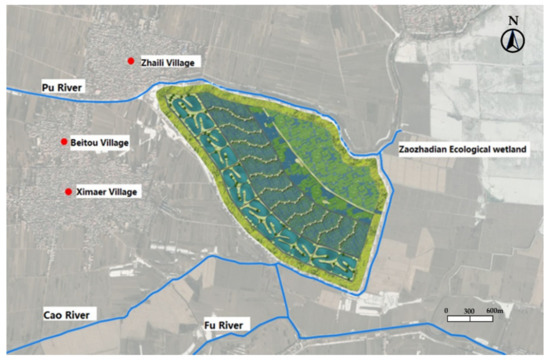
Figure 1.
Location map of the Fuhe estuarine wetland.
The project adopted the combination process of “pre-ecological sedimentation pond + subsurface flow constructed wetland + macrophyte pond”, covering 3.15 km2 in total, with a daily processing capacity of 250,000 tons. It was divided into three parts and covering area of 0.82 km2, 1.02 km2 and 1.31 km2, respectively, as shown in Figure 2. The pre-sedimentation pond was the first treatment unit of the water purification project in the Fuhe estuarine wetland. Its main function was to precipitate the suspended matter and reduce the sand content in the river, at the same time, degrade the complex pollutants initially under the action of microorganisms and plants to further improve the biodegradability of the pollutants for the subsequent biochemical treatment of pollutants. The subsurface-flow wetland took over the effluent of the ecological sedimentation pond and relied mainly on the action of the roots of macrophytes, microorganisms and substrates to remove pollutants. The aquatic plant pond consisted of two parts, the front part is the submerged plant area, and the back end is the emerged plant area, which purified the water through the action of microorganisms and plants.
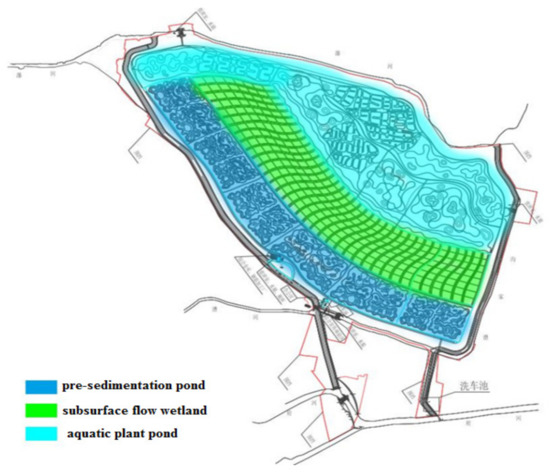
Figure 2.
Wetland water purification unit.
3.2. Date Acquisition
3.2.1. Quantitative Indicators
On-site water quality monitoring was conducted for the purification project. Sampling points were set up at the inlet and outlet of three units, respectively. The specific sampling points were shown in Figure 3. Sampling was conducted once a month for 3 consecutive days during October 2020 to March 2021, once a day. Water samples were collected at 0.5 m below the water surface using sample apparatus. Water quality parameters included pH, DO, CODCr, TP, NH3-N, etc. We used the quadrat method to select a total of 9 points of 2 m × 2 m in the three-water purification units and used the formula “Coverage of aquatic plants = aquatic plant coverage area/4 m2 × 100%” to calculate the aquatic plant coverage of each plot. The average “coverage of aquatic plants” of the 9 plots was calculated as the current month’s data. Parameters such as maintenance duration, investment costs and operating costs were obtained from the project design documents and verified with the managers of Fuhe wetland. Quantitative indicator data are shown in Table 6. Six months data of the wetland outlet were used in the evaluation process to score water quality indicators.
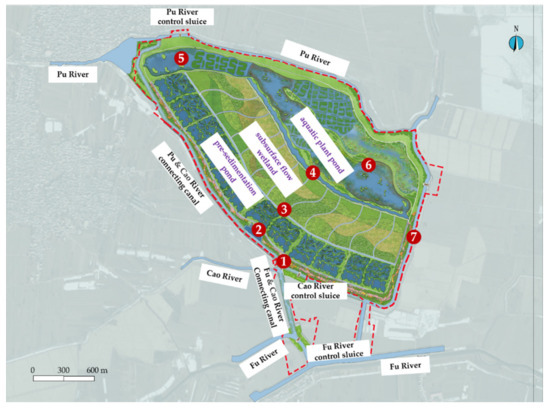
Figure 3.
Location map of sampling points.
Table 6.
Quantitative index data.
3.2.2. Qualitative Indicators
In order to make the qualitative indicators more credible, different people and approaches were selected for evaluation for different qualitative indicators (Table 7). For habitat diversity, technical advancement, technical maturity, engineering operability, and engineering stability, 20 experts and senior engineers who were more knowledgeable about the Fuhe estuarine wetland were invited. The adaptation to the surrounding landscape and the economic impact on the surrounding area were obtained by means of a questionnaire survey. A total of 50 people living around the wetland were given questionnaires, and 50 valid questionnaires were obtained. The maintenance complexity was evaluated by 15 operation and maintenance personnel of Fuhe estuarine wetland.
Table 7.
Qualitative index evaluation results.
4. Results and Discussion
4.1. Fuhe Estuarine Wetland Evaluation Results
In this case evaluation stage, the overall score of Fuhe estuarine wetland was 4.1492, and the evaluation result was “excellent”. The indicator scores and final evaluation results were shown in Table 8; Table 9, respectively.
Table 8.
Evaluation data and score.
Table 9.
Evaluation results of the Fuhe estuarine wetland.
4.2. System-Level Evaluation
4.2.1. Environmental Benefits
The Fuhe estuarine wetland scored 1.8403 in environmental benefits, with an evaluation grade of excellent. The Fuhe estuarine wetland had a good effect on pollutant removal, a strong self-purification ability of the water body and a stable ecosystem. The score of water quality indexes was 1.065, among which four indexes, CODCr, NH3-N, DO and TP score 5, 4, 5, and 4 respectively, indicating that the wetland performs well for the removal of CODCr, TP, and NH3-N and the enhancement of DO.
Comparing the effluent of Fuhe estuarine wetland with the Environmental Quality Standard for Surface Water (GB3838-2002) (Figure 4), CODCr reached Class III water in five months during the monitoring period and met the design requirements. The removal performance of each unit on CODCr was analyzed based on the monitoring of influent and effluent of the three units (Figure S1 in Supplementary Material). The removal rates of CODCr in the pre-sedimentation pond and subsurface-flow wetland were 3.3% and 14.7%, respectively, while in the aquatic plant pond CODCr content increased slightly. The main reason for this phenomenon was the release of organic substances caused by the decomposition of aquatic plants during autumn and winter of monitoring time [32]. In general, the Fuhe estuarine wetland could remove CODCr, and the subsurface-flow wetland was the main reduction unit of CODCr. However, it was more influenced by the growth and decomposition of aquatic plants. Figure 4b shows the effluent content of NH3-N. It can be seen that water quality in terms of NH3-N reached Class III for only one month during the monitoring period, and the rest of the months were better than Class III. The average influent concentration of NH3-N in the Fuhe estuarine wetland was 0.48 mg/L and the average effluent concentration was 0.32 mg/L. The overall removal rate of NH3-N was 33.33% (Figure S2). The removal rates of NH3-N in the pre-sedimentation pond, subsurface-flow wetland, and aquatic plant pond were 23.33%, 26.03%, and 42.37%, respectively. The aquatic plant pond contributed main for NH3-N removal. TP of effluent during the monitoring period all reached Class II. TP of influent was 0.071 mg/L averagely and the effluent concentration was 0.044 mg/L. The removal rates of the pre-sedimentation pond, subsurface-flow wetland and aquatic plant pond were 20.29%, 37.27%, and 50.66%, respectively (Figure S3). In terms of effluent quality and removal rate, the Fuhe estuarine wetland was effective in TP treatment. DO is an important parameter for the self-purification ability. A high level of dissolved oxygen in water and the short time required to return to the initial state after being consumed indicates a strong self-purification ability of the water body [33]. As shown in Figure 4c, the high DO level reached Class I-II, indicating that good self-purification ability of Fuhe estuarine wetland.

Figure 4.
Water quality of the effluent from Fuhe estuarine wetland ((a) CODCr, (b) NH3-N, (c) DO, (d) TP).
The aquatic plant coverage of the Fuhe estuarine wetlands was 28.76% during the monitoring period. The purifying effect of aquatic plants on pollutants mainly contains both plant uptake and metabolism of rhizosphere microorganism. The decomposition of aquatic plants themselves also release nutrients to the water body. Therefore, the amounts of aquatic plants should be moderate. According to the evaluation results, the habitat diversity of Fuhe estuarine wetland is good, wetland has constructed habitats such as the lotus pond area and the reed area, and combined with the growth needs of plants, the wetland plants have been restored, and have created a variety of healthy wetland habitats such as bird and fish habitats. The overall service quality of the region has been improved, and the resilience and stability of the wetland ecosystem has been enhanced.
4.2.2. Technical Management and Maintenance
The system layer for technical management and maintenance scored 0.998 with a evaluation grade of “excellent”. The technical indicators, engineering indicators, and maintenance management indicators contributed 0.4255, 0.3244 and 0.2481 points respectively. The technical advancement scored 4, indicating that the Fuhe estuarine wetland has improved in some respects such as water treatment, ecological restoration, and maintenance cost. As for substrate selection, gravel, zeolite, and steel slag were selected as carrier for the subsurface-flow wetland. The adsorption and precipitation effects of steel slag in phosphorus removal were less dependent on season and temperature [34]. And high-quality steel slag was abundant in the vicinity. The choice of substrate not only achieved stable TP removal but also reduced the investment. The technology maturity score was the highest score of 5. The near-natural water purification process of “pre-sedimentation pond + subsurface-flow wetland + aquatic plant pond” in this project was mature and reliable, which has been applied in the practice of many wetlands and has been operating stably [9,35].
The project operability and stability both scored 4, indicating that the geological, hydrological, and topographical conditions meet the project requirements, and the project can operate stably in the long term. The maintenance of the Fuhe estuarine wetland relied on a digital maintenance management system, which requires 22 people to operate. The management system made comprehensive use of automated control technology, modern information, and telecommunications technology. The water quality from the upstream and the water level inside the wetland were monitored in real time through an automated monitoring system. The water depth and flow inside the wetland were adjusted through a remote-control system, ultimately realizing mechanization and automation for management and maintenance. The maintenance time scored 4. From the field survey, the single maintenance time was around 4 to 6 h, which mainly included the control of water distribution, vegetation maintenance and site monitoring.
4.2.3. Social and Economic Functions
The system layer of socio-economic function scored 1.3109, and the evaluation grade was “excellent”. The social impact and economic input contributed 0.6867 and 0.6242 points respectively. In this case, not only the effect of water purification, but also the landscape was considered in the matching and selection of plants. On the basis of the original plants, plants with high ornamental value were added appropriately. The landscape value was improved and the disturbance to the ecological environment of this site was less. The constructed reed terraces and lotus ponds, forming a unique reed and lotus ocean landscape, were suitable for the Baiyangdian Lake.
The indicator of economic impact on the surrounding area scored 4, indicating that the surrounding residents recognized the good contribution of wetland project to the local economy. During the construction period, the purchase of plants and padding was dominated by local businesses, contributing to the growth of the related economy. In addition, employment increased during construction and the sequent maintenance. The capital and operational cost of the project were 22.47 $/m2 and 0.02 $/(m2·a), respectively, which were in a reasonable range.
4.3. Target-Level Evaluation
The evaluation results showed that the water quality has been better after the pre- sedimentation pond, subsurface-flow constructrd wetland and aquatic plant pond, for the good removal performance of NH3-N, TP and CODCr. In terms of habitat construction, the wetland increased biodiversity, enhanced the resilience and stability of the ecosystem, and improved the service quality of the overall region. The Fuhe estuarine wetland performed well in terms of engineering for the technology adopted, which was stable. The improvements in substrate, plant configuration and topography construction made the wetland more effective in removing pollutants and restoring the ecosystem. The construction of this project met local development requirements and promoted the local economy. However, according to the index layer scores, the indicators of coverage of aquatic plants and maintenance complexity scored lowest. Therefore, we suggested the following: (1) increase the amounts of aquatic plants in the treatment units or the available lakeshore to enhance the water purification efficiency and landscape appreciation value; (2) further improve the mechanization and automation of management and reduce maintenance personnel. In summary, the Fuhe estuarine wetland performance well in water purification, ecological restoration, engineering technology and socio-economic aspects, and could be popularized.
5. Conclusions
Based on the characteristics of near-natural estuarine wetlands, an evaluation index system was constructed covering the aspects of environmental benefits, technical management and maintenance, and socio-economic functions, containing 1 target layer, 3 system layers, 7 criterion layers, and 16 indicator layers. The weight of indicators in different layers was determined by group decision-based hierarchical analysis and a fuzzy evaluation was used as the evaluation algorithm. A case evaluation was conducted using the Fuhe estuarine wetland project in Xiong’an New Area of Hebei Province as an example. The water purification project of Fuhe estuarine wetland was evaluated and the result was “excellent”, indicating that Fuhe estuarine wetland had good effect on pollutants removal. The technology adopted had good effect in practical application, for the improvement in ecological restoration and investment reduction. The project site was suitable, and it had a positive impact on the surrounding environment, economy, and social development. The Fuhe estuarine wetland can be optimized and improved by increasing the coverage of aquatic plants and improving the efficiency of maintenance and management. The traditional evaluation of water purification and ecological restoration projects was mostly limited to the evaluation of restoration effects. However, the evaluation system constructed in this study added qualitative and quantitative indicators on various aspects such as technical, engineering, social and economic impacts, to build a more scientific and comprehensive evaluation system for evaluating near-natural estuarine wetlands, which provided an accurate way to analyze. It provides strong support to accurately analyze the advantages and defects of water purification and ecological restoration projects, and to develop advanced and efficient technologies.
Supplementary Materials
The following are available online at https://www.mdpi.com/article/10.3390/w13152116/s1. Table S1: Random consistency index table; Table S2: Basis for qualitative index evaluation; Figure S1: Reduction of CODCr in Fuhe estuarine wetland (a: pre-ecological sedimentation pond; b: subsurface flow constructed wetland; c: macrophyte pond); Figure S2: Reduction of NH3-N in Fuhe estuarine wetland (a: pre-ecological sedimentation pond; b: subsurface flow constructed wetland; c: macrophyte pond); Figure S3: Reduction of TP in Fuhe estuarine wetland (a: pre-ecological sedimentation pond; b: subsurface flow constructed wetland; c: macrophyte pond).
Author Contributions
Conceptualization, J.S. and Y.H.; methodology, J.S.; software, Y.H.; validation, P.Z., H.W. and Y.C.; formal analysis, L.L. and M.L.; investigation, M.L.; resources, H.W. and P.Z.; data curation, Y.C.; writing—original draft preparation, Y.H.; writing—review and editing, J.S.; visualization, J.S.; supervision, H.W. and Y.L.; project administration, P.Z. All authors have read and agreed to the published version of the manuscript.
Funding
This research was supported by the Major Science Technology Program for Water Pollution Control and Treatment of China (2018ZX07110).
Institutional Review Board Statement
Not applicable.
Informed Consent Statement
Not applicable.
Data Availability Statement
Not applicable.
Acknowledgments
We are thanks to our all colleagues and research staff members for their constructive advice and help.
Conflicts of Interest
The authors declare no conflict of interest.
References
- Ji, Z.; Zhang, H.; Zhang, Y.; Chen, T.; Long, Z.; Li, M.; Pei, Y. Distribution, ecological risk and source identification of heavy metals in sediments from the Baiyangdian Lake, Northern China. Chemosphere 2019, 237, 124425. [Google Scholar] [CrossRef] [PubMed]
- Ramsar Convention on Wetlands (RCW). Global Wetland Outlook: State of the World’s Wetlands and their Services to People; Ramsar Convention Secretariat: Gland, Switzerland, 2018. [Google Scholar]
- Hu, S.; Niu, Z.; Chen, Y.; Li, L.; Zhang, H. Global wetlands: Potential distribution, wetland loss, and status. Sci. Total Environ. 2017, 586, 319–327. [Google Scholar] [CrossRef] [PubMed]
- Wang, Y.; Zhang, T.; Zhao, Y.; Ciborowski, J.; O’Halloran, I.; Qi, Z.; Tan, C. Characterization of sedimentary phosphorus in Lake Erie and on-site quantification of internal phosphorus loading. Water Res. 2021, 188, 116525. [Google Scholar] [CrossRef] [PubMed]
- Qi, Y.; Wang, Z.; Pei, Y. Evaluation of water quality and nitrogen removal bacteria community in Fuhe River. Procedia Environ. Sci. 2012, 13, 1809–1819. [Google Scholar] [CrossRef][Green Version]
- Sudarsan, J.S.; Annadurai, R.; Mukhopadhyay, M.; Chakraborty, P.; Nithiyanantham, S. Domestic wastewater treatment using constructed wetland: An efficient and alternative way. Sustain. Water Resour. Manag. 2018, 4, 781–787. [Google Scholar] [CrossRef]
- Li, D.; Chu, Z.; Huang, M.; Zheng, B. Multiphasic assessment of effects of design configuration on nutrient removal in storing multiple-pond constructed wetlands. Bioresour. Technol. 2019, 290, 121748. [Google Scholar] [CrossRef] [PubMed]
- Dørge, J. Modelling nitrogen transformations in freshwater wetlands. Estimating nitrogen retention and removal in natural wetlands in relation to their hydrology and nutrient loadings. Ecol. Model. 1994, 75–76, 409–420. [Google Scholar] [CrossRef]
- Chen, H. Impacts of exotic plant invasions on soil biodiversity and ecosystem processes. Biodivers. Sci. 2005, 13, 555–565. [Google Scholar] [CrossRef]
- Liu, X.; Zhao, Y.; Zhang, X.; Kong, H.; Lin, Y. Plant community diversity in Dengbeiqiao constructed wetland and ecological revetment of Yonganjiang River in Erhai Region in 2012. Wetland Sci. 2018, 16, 45–50. [Google Scholar] [CrossRef]
- Li, J.; Chen, J.; Xia, F. A pollutant removal rule of constructed wetland on the Dianchi Lake lakeshore. Environ. Sci. Technol. 2012, 35, 98–101. [Google Scholar]
- Parde, D.; Patwa, A.; Shukla, A.; Vijay, R.; Killedar, D.J.; Kumar, R. A review of constructed wetland on type, treatment and technology of wastewater. Environ. Technol. Innov. 2021, 21, 101261. [Google Scholar] [CrossRef]
- Li, Y.; Zhu, S.; Zhang, Y.; Lv, M.; Kinhoun, J.J.R.; Qian, T.; Fan, B. Constructed wetland treatment of source separated washing wastewater in rural areas of southern China. Sep. Purif. Technol. 2021, 272, 118725. [Google Scholar] [CrossRef]
- Wang, Y.; Li, Q.; Zhang, W.; Wang, S.; Peng, H. Pollutants removal efficiency assessment of constructed subsurface flow wetlands in lakes with numerical models. J. Hydrol. 2021, 598, 126289. [Google Scholar] [CrossRef]
- Wu, H.; Gao, X.; Wu, M.; Zhu, Y.; Xiong, R.; Ye, S. The efficiency and risk to groundwater of constructed wetland system for domestic sewage treatment—A case study in Xiantao, China. J. Clean. Prod. 2020, 277, 123384. [Google Scholar] [CrossRef]
- Jiang, M.; Chen, H.; Chen, Q.; Wu, H.; Chen, P. Wetland ecosystem integrity and its variation in an estuary using the EBLE index. Ecol. Indic. 2015, 48, 252–262. [Google Scholar] [CrossRef]
- Zhang, H.; Cui, B.; Ou, B.; Lei, X. Application of a biotic index to assess natural and constructed riparian wetlands in an estuary. Ecol. Eng. 2012, 44, 303–313. [Google Scholar] [CrossRef]
- Su, F.; Liu, H.; Zhu, D.; Li, L.; Wang, T. Sustainability assessment of the Liaohe Estuary wetland based on emergy analysis. Ecol. Indic. 2020, 119, 106837. [Google Scholar] [CrossRef]
- Ghosh, A.; Maiti, R. Development of new Ecological Susceptibility Index (ESI) for monitoring ecological risk of river corridor using F-AHP and AHP and its application on the Mayurakshi river of Eastern India. Ecol. Inform. 2021, 63, 101318. [Google Scholar] [CrossRef]
- Chan, F.T.; Chan, M.; Tang, N. Evaluation methodologies for technology selection. J. Mater. Process. Technol. 2000, 107, 330–337. [Google Scholar] [CrossRef]
- Feng, L.; Zhu, X.; Sun, X. Assessing coastal reclamation suitability based on a fuzzy-AHP comprehensive evaluation framework: A case study of Lianyungang, China. Mar. Pollut. Bull. 2014, 89, 102–111. [Google Scholar] [CrossRef] [PubMed]
- Zhang, D.; Ge, W.; Zhang, Y. Evaluating the vegetation restoration sustainability of ecological projects: A case study of Wuqi County in China. J. Clean. Prod. 2020, 264, 121751. [Google Scholar] [CrossRef]
- Zhang, R.; Liu, C.; Gu, Y.; Sun, D.; Qi, F. Evaluation method of water ecological restoration technologies in urban river and lake supplied by reclaimed water established by analytical hierarchy: Establishing and application. Chin. J. Environ. Eng. 2017, 11, 3545–3554. [Google Scholar] [CrossRef]
- Chen, Z.-Y.; Dai, Z.-H. Application of group decision-making AHP of confidence index and cloud model for rock slope stability evaluation. Comput. Geosci. 2021, 155, 104836. [Google Scholar] [CrossRef]
- Lu, Y.; Xu, H.; Wang, Y.; Yang, Y. Evaluation of water environmental carrying capacity of city in Huaihe River Basin based on the AHP method: A case in Huai’an City. Water Resour. Ind. 2017, 18, 71–77. [Google Scholar] [CrossRef]
- Tung, S.; Tang, S. A comparison of the Saaty’s AHP and modified AHP for right and left eigenvector inconsistency. Eur. J. Oper. Res. 1998, 106, 123–128. [Google Scholar] [CrossRef]
- Yang, W.; Yan, J.; Wang, Y.; Zhang, B.-T.; Wang, H. Seasonal variation of aquatic macrophytes and its relationship with environmental factors in Baiyangdian Lake, China. Sci. Total Environ. 2020, 708, 135112. [Google Scholar] [CrossRef]
- Zhang, Y.; Cui, B.; Lan, Y.; Han, Z.; Wang, T.; Guo, A. Four terrestrialization characteristics of Baiyangdian Lake, China. Procedia Environ. Sci. 2012, 13, 645–654. [Google Scholar] [CrossRef]
- Xu, F.; Yang, Z.; Chen, B.; Zhao, Y. Development of a structurally dynamic model for ecosystem health prognosis of Baiyangdian Lake, China. Ecol. Indic. 2013, 29, 398–410. [Google Scholar] [CrossRef]
- Hu, G.; Xu, Z.; Dai, J.; Mai, B.; Cao, H.; Wang, J.; Shi, Z.; Xu, M. Distribution of polybrominated diphenyl ethers and decabromodiphenylethane in surface sediments from Fuhe River and Baiyangdian Lake, North China. J. Environ. Sci. 2010, 22, 1833–1839. [Google Scholar] [CrossRef]
- Zhou, Z.; Zhang, P.; Zhang, G.; Wang, S.; Cai, Y.; Wang, H. Vertical microplastic distribution in sediments of Fuhe River estuary to Baiyangdian Wetland in Northern China. Chemosphere 2021, 280, 130800. [Google Scholar] [CrossRef]
- Reina, M.; Espinar, J.; Serrano, L. Sediment phosphate composition in relation to emergent macrophytes in the Doñana Marshes (SW Spain). Water Res. 2006, 40, 1185–1190. [Google Scholar] [CrossRef] [PubMed]
- Guo, W.; Yang, F.; Li, Y.; Wang, S. New insights into the source of decadal increase in chemical oxygen demand associated with dissolved organic carbon in Dianchi Lake. Sci. Total Environ. 2017, 603–604, 699–708. [Google Scholar] [CrossRef] [PubMed]
- Lee, M.S.; Drizo, A.; Rizzo, D.M.; Druschel, G.; Hayden, N.; Twohig, E. Evaluating the efficiency and temporal variation of pilot-scale constructed wetlands and steel slag phosphorus removing filters for treating dairy wastewater. Water Res. 2010, 44, 4077–4086. [Google Scholar] [CrossRef] [PubMed]
- Barco, A.; Borin, M. Treatment performance and macrophytes growth in a restored hybrid constructed wetland for municipal wastewater treatment. Ecol. Eng. 2017, 107, 160–171. [Google Scholar] [CrossRef]
Publisher’s Note: MDPI stays neutral with regard to jurisdictional claims in published maps and institutional affiliations. |
© 2021 by the authors. Licensee MDPI, Basel, Switzerland. This article is an open access article distributed under the terms and conditions of the Creative Commons Attribution (CC BY) license (https://creativecommons.org/licenses/by/4.0/).