
Effect of Salinity on Evaporation from Water Surface in Bench-Scale Testing


Abstract
1. Introduction
2. Research Methodology
3. Results and Discussion
4. Summary and Conclusions
Author Contributions
Funding
Institutional Review Board Statement
Informed Consent Statement
Data Availability Statement
Acknowledgments
Conflicts of Interest
References
- Hammer, U.T. Saline lake resources of the Canadian Prairies. Can. Water Resour. J. 1986, 11, 43–57. [Google Scholar] [CrossRef][Green Version]
- Last, W.M.; Slezak, L.A. The salt lakes of western Canada: A paleolimnological overview. Hydrobiologia 1988, 158, 301–316. [Google Scholar] [CrossRef]
- Salhotra, A.M.; Adams, E.E.; Harleman, D.R.F. Effect of salinity and ionic composition on evaporation: Analysis of Dead Sea evaporation pans. Water Resour. Res. 1985, 21, 1336–1344. [Google Scholar] [CrossRef]
- Finch, J.W.; Calver, A. Methods for the Quantification of Evaporation from Lakes; Centre for Ecology & Hydrology: Oxfordshire, UK, 2008. [Google Scholar]
- Akridge, D.G. Methods for calculating brine evaporation rates during salt production. J. Archaeol. Sci. 2008, 35, 1453–1462. [Google Scholar] [CrossRef]
- Schulz, S.; Darehshouri, S.; Hassanzadeh, E.; Tajrishy, M.; Schüth, C. Climate change or irrigated agriculture—What drives the water level decline of Lake Urmia. Sci. Rep. 2020, 10, 236. [Google Scholar] [CrossRef] [PubMed]
- Trautz, A.C.; Illangasekare, T.H.; Howington, S. Experimental testing scale considerations for the investigation of bare-soil evaporation dynamics in the presence of sustained above-ground airflow. Water Resour. Res. 2018, 54, 8963–8982. [Google Scholar] [CrossRef]
- Lemmen, D.S.; Vance, R.E.; Campbell, I.A.; David, P.P.; Pennock, D.J.; Sauchyn, D.J.; Wolfe, S.A. Geomorphic Systems of the Palliser Triangle, Southern Canadian Prairies: Description and Response to Changing Climate; Natural Resources Canada: Ottawa, ON, Canada, 1998. [Google Scholar]
- Faurès, J.M.; Hoogeveen, J.; Winpenny, J.; Steduto, P.; Burke, J. Coping with Water Scarcity: An Action Framework for Agriculture and Food Security; Food and Agriculture Organization of the United Nations: Rome, Italy, 2012. [Google Scholar]
- Akhter, A.; Azam, S. Flood-drought hazard assessment for a flat clayey deposit in the Canadian Prairies. J. Environ. Inform. Lett. 2019, 1, 8–19. [Google Scholar] [CrossRef]
- Fang, X.; Pomeroy, J.W. Drought impacts on Canadian prairie wetland snow hydrology. Hydrol. Process. 2008, 22, 2858–2873. [Google Scholar] [CrossRef]
- Cutlac, I.; Horbulyk, T.M. Optimal water allocation under short-run water scarcity in the South Saskatchewan River Basin. J. Water Resour. Plan. Manag. 2011, 137, 92–100. [Google Scholar] [CrossRef]
- Wheater, H.; Gober, P. Water security in the Canadian Prairies: Science and management challenges. Philos. Trans. Math. Phys. Eng. Sci. 2013, 371, 1–21. [Google Scholar] [CrossRef]
- Pomeroy, J.W.; Shook, K.R. Review of Lake Diefenbaker Operations 2010–2011; Centre for Hydrology, University of Saskatchewan: Saskatoon, SK, Canada, 2012. [Google Scholar]
- Hammer, U.T. The saline lakes of Saskatchewan, I. Background and rationale for saline lakes research. Int. Rev. Gesamten Hydrobiol. Hydrogr. 1978, 63, 173–177. [Google Scholar] [CrossRef]
- Bowman, J.S.; Sachs, J.P. Chemical and physical properties of some saline lakes in Alberta and Saskatchewan. Saline Syst. 2008, 4, 3. [Google Scholar] [CrossRef] [PubMed]
- Tallin, J.E.; Pufahl, D.E.; Barbour, S.L. Waste management schemes of potash mines in Saskatchewan. Can. J. Civil. Eng. 1990, 17, 528–542. [Google Scholar] [CrossRef]
- Reid, K.W. Water use in Saskatchewan’s potash industry and opportunities for water recycling/conservation. Can. Water Resour. J. 1984, 9, 21–26. [Google Scholar] [CrossRef]
- Landine, P. Weathering and Diagenesis of Saskatchewan Potash Tailings; University of Saskatchewan: Saskatoon, SK, Canada, 1993. [Google Scholar]
- Christiansen, E.A. The Wisconsinan deglaciation, of southern Saskatchewan and adjacent areas. Can. J. Earth Sci. 1979, 16, 913–938. [Google Scholar] [CrossRef]
- Last, W.M.; Ginn, F.M. Saline systems of the Great Plains of western Canada: An overview of the limnogeology and paleolimnology. Saline Syst. 2005, 1, 10. [Google Scholar] [CrossRef]
- Bredehoeft, J.D.; Blyth, C.R.; White, W.A.; Maxey, G.B. Possible mechanism for concentration of brines in subsurface formations. Bull. Am. Assoc. Pet. Geol. 1963, 47, 257–269. [Google Scholar]
- Suchan, J.; Azam, S. Development of BAS2 for determination of evaporative fluxes. MethodsX 2021, 8, 101424. [Google Scholar] [CrossRef]
- Suchan, J.; Azam, S. Determination of Evaporative Fluxes Using a Bench-Scale Atmosphere Simulator. Water 2021, 13, 84. [Google Scholar] [CrossRef]
- İnan, M.; Özgür, S. Experimental investigation of evaporation from a horizontal free water surface. Sigma J. Eng. Nat. Sci. 2017, 35, 119–131. [Google Scholar]
- Mor, Z.; Assouline, S.; Tanny, J.; Lensky, I.M.; Lensky, N.G. Effect of water surface salinity on evaporation: The case of a diluted buoyant plume over the Dead Sea. Water Resour. Res. 2018, 54, 1460–1475. [Google Scholar] [CrossRef]
- Patel, S.S.; Rix, A.J. The impact of water surface albedo on incident solar insolation of a collector surface. In Proceedings of the 2020 International SAUPEC/RobMech/PRASA Conference, Cape Town, South Africa, 29–31 January 2020; pp. 1–6. [Google Scholar]
- Shuttleworth, W.J. Evaporation. In Handbook of Hydrology; Maidment, D.R., Ed.; McGraw-Hill Inc.: New York, NY, USA, 1993; pp. 4.1–4.53. [Google Scholar]
- Finch, J.W. A comparison between measured and modelled open water evaporation from a reservoir in south-east England. Hydrol. Process. 2001, 15, 2771–2778. [Google Scholar] [CrossRef]
- Granger, R.J.; Gray, D.M. Evaporation from natural nonsaturated surfaces. J. Hydrol. 1989, 111, 21–29. [Google Scholar] [CrossRef]
- Vázquez, O.; Thomachot-Schneider, C.; Mouhoubi, K.; Gommeaux, M.; Fronteau, G.; Barbin, V.; Bodnar, J. Study of NaCl crystallization with passive infrared thermography. In Proceedings of the SWBSS 3rd International Conference on Salt Weathering of Buildings and Stone Sculptures, Brussels, Belgium, 14–16 October 2014. [Google Scholar]
- Himus, G.W.; Hinchley, J.W. The effect of a current of air on the rate of evaporation of water below the boiling point. J. Soc. Chem. Ind. 1924, 43, 840–845. [Google Scholar] [CrossRef]
- Meyer, A.F. Evaporation from Lakes and Reservoirs; Minnesota Resources Commission: St. Paul, MN, USA, 1942. [Google Scholar]
- Penman, H.L. Natural evaporation from open water, bare soil and grass. Proc. R. Soc. Lond. 1948, 193, 120–145. [Google Scholar]
- Monteith, J.L. Evaporation and environment. Symp. Soc. Exp. Biol. 1965, 19, 205–234. [Google Scholar] [PubMed]
- De Bruin, H.; Keijman, J.Q. The Priestley-Taylor evaporation model applied to a large, shallow lake in the Netherlands. J. Appl. Meteorol. 1979, 18, 898–903. [Google Scholar] [CrossRef]
- Duan, Z.; Bastiaanssen, W.G.M. Evaluation of three energy balance-based evaporation models for estimating monthly evaporation for five lakes using derived heat storage changes from a hysteresis model. Environ. Res. Lett. 2017, 12, 024005. [Google Scholar] [CrossRef]
- Lide, D.R. CRC Handbook of Chemistry and Physics; CRC Press, Taylor & Francis Group: Boca Raton, FL, USA; London, UK; New York, NY, USA, 2004. [Google Scholar]


| Weather Scenario | Date Range (Month) | Duration (Hours) | Air Velocity (m∙s−1) | Air Humidity (g∙m−3) | Air Temperature (°C) | Solar Irradiance (W∙m−2) | Surface Temperature (°C) |
|---|---|---|---|---|---|---|---|
| Day | March–November | 3706 | |||||
| Spring | March–May | 883 | 1.7 | 5.0 | 10.0 | 325 | 12 |
| Summer | May–September | 1755 | 1.3 | 9.0 | 19.0 | 325 | 22 |
| Fall | September–November | 541 | 1.6 | 5.0 | 9.0 | 210 | 13 |
| Night | April–November | 1827 | |||||
| Spring | April–May | 206 | 1.3 | 5.0 | 9.0 | 0 | 6 |
| Summer | May–September | 761 | 1.3 | 8.5 | 13.0 | 0 | 17 |
| Fall | September–November | 277 | 1.5 | 5.5 | 9.0 | 0 | 16 |
| Parameter | Unit | Symbol | ||||||||||||
|---|---|---|---|---|---|---|---|---|---|---|---|---|---|---|
| Day | Night | |||||||||||||
| Spring | Summer | Fall | Spring | Summer | Fall | |||||||||
| W | B | W | B | W | B | W | B | W | B | W | B | |||
| Count | n | 1102 | 1988 | 1236 | 2161 | 1184 | 2161 | 1250 | 2158 | 1084 | 1777 | 1232 | 2161 | |
| Atmosphere | ||||||||||||||
| Momentum | ||||||||||||||
| Velocity | m∙s−1 | 1.7 | 1.7 | 1.3 | 1.3 | 1.6 | 1.6 | 1.3 | 1.3 | 1.3 | 1.3 | 1.5 | 1.5 | |
| Mass | ||||||||||||||
| Air Pressure | Pa | 94,294 | 95,893 | 95,397 | 95,134 | 93,414 | 95,293 | 94,484 | 95,845 | 94,407 | 93,256 | 95,060 | 92,866 | |
| Relative Humidity | ||||||||||||||
| Upwind, High | % | 50.8 | 50.7 | 51.3 | 52.0 | 55.1 | 53.9 | 54.4 | 54.5 | 75.2 | 76.0 | 60.7 | 64.8 | |
| Downwind, High | % | 53.5 | 53.0 | 51.9 | 52.9 | 57.5 | 56.4 | 55.5 | 55.7 | 80.5 | 76.6 | 61.2 | 66.1 | |
| Upwind, Low | % | 52.7 | 53.2 | 55.0 | 55.3 | 56.5 | 56.4 | 56.6 | 56.7 | 75.1 | 74.9 | 62.3 | 62.2 | |
| Downwind, Low | % | 55.7 | 56.2 | 57.6 | 57.8 | 59.9 | 59.6 | 59.5 | 59.5 | 80.5 | 80.3 | 66.2 | 68.4 | |
| Energy | ||||||||||||||
| Temperature | ||||||||||||||
| Upwind, High | °C | 10.8 | 11.0 | 20.7 | 20.5 | 9.5 | 9.8 | 9.7 | 9.6 | 13.7 | 13.7 | 9.7 | 9.4 | |
| Downwind, High | °C | 10.3 | 10.5 | 20.4 | 20.2 | 9.0 | 9.3 | 9.5 | 9.4 | 13.0 | 13.6 | 9.4 | 9.1 | |
| Upwind, Low | °C | 10.1 | 10.1 | 19.0 | 19.0 | 8.9 | 9.1 | 9.1 | 8.9 | 12.9 | 13.1 | 8.9 | 9.0 | |
| Downwind, Low | °C | 9.9 | 10.0 | 19.2 | 19.1 | 8.8 | 9.0 | 9.0 | 8.9 | 13.0 | 13.1 | 8.9 | 9.0 | |
| Shortwave Flux (↓) | W∙m−2 | 325 | 325 | 325 | 325 | 210 | 210 | 0 | 0 | 0 | 0 | 0 | 0 | |
| Surface | ||||||||||||||
| Mass | ||||||||||||||
| Mass Rate Change (× 10−4) | g∙s−1 | 2.17 | 1.12 | 2.79 | 1.72 | 2.39 | 1.34 | 0.93 | 0.34 | 1.60 | 0.59 | 2.68 | 1.54 | |
| Energy | ||||||||||||||
| Shortwave Flux (↑) | W∙m−2 | 2 | 2 | 2 | 2 | 1 | 2 | 0 | 0 | 0 | 0 | 0 | 0 | |
| Temperature | °C | 12 | 12 | 22 | 22 | 13 | 13 | 6 | 6 | 17 | 17 | 16 | 16 | |
| Parameter | Unit | Symbol | ||||||||||||
|---|---|---|---|---|---|---|---|---|---|---|---|---|---|---|
| Day | Night | |||||||||||||
| Spring | Summer | Fall | Spring | Summer | Fall | |||||||||
| W | B | W | B | W | B | W | B | W | B | W | B | |||
| Atmosphere | ||||||||||||||
| Momentum | ||||||||||||||
| Aero. Resistance | s∙m−1 | 41.4 | 41.4 | 46.6 | 46.8 | 42.6 | 42.6 | 46.6 | 46.6 | 46.6 | 46.6 | 43.9 | 43.9 | |
| Mass | ||||||||||||||
| Vapor Density | g∙m−3 | 5.0 | 5.0 | 9.0 | 9.0 | 5.0 | 5.0 | 5.0 | 5.0 | 8.5 | 8.5 | 5.5 | 5.5 | |
| Vapor Pressure | ||||||||||||||
| Partial | Pa | 650 | 658 | 1209 | 1215 | 646 | 651 | 652 | 648 | 1117 | 1126 | 712 | 715 | |
| Saturated | Pa | 1234 | 1211 | 2198 | 2152 | 1144 | 1131 | 1153 | 1121 | 1488 | 1473 | 1144 | 1125 | |
| Deficit | Pa | 584 | 554 | 989 | 938 | 498 | 480 | 501 | 473 | 371 | 347 | 431 | 411 | |
| Energy | ||||||||||||||
| Longwave Flux (↓) | J∙s−1∙m−2 | 284 | 284 | 340 | 340 | 279 | 280 | 280 | 280 | 313 | 314 | 282 | 283 | |
| Surface | ||||||||||||||
| Mass | ||||||||||||||
| Vapor Pressure | ||||||||||||||
| Saturated | Pa | 1402 | 1375 | 2646 | 2593 | 1498 | 1468 | 936 | 927 | 1938 | 1899 | 1820 | 1784 | |
| Deficit | Pa | 752 | 717 | 1437 | 1379 | 852 | 817 | 284 | 279 | 821 | 773 | 1108 | 1069 | |
| Energy | ||||||||||||||
| Longwave Flux (↑) | J∙s−1∙m−2 | 367 | 367 | 422 | 422 | 373 | 373 | 337 | 338 | 394 | 394 | 389 | 388 | |
| Net Radiant Heat Flux | J∙s−1∙m−2 | 241 | 241 | 241 | 242 | 117 | 118 | −58 | −59 | −80 | −79 | −107 | −106 | |
| Evaporative Heat Flux | J∙s−1∙m−2 | 359 | 189 | 464 | 291 | 398 | 226 | 160 | 57 | 258 | 97 | 432 | 258 | |
| Sensible Heat Flux | J∙s−1∙m−2 | 46 | 24 | 47 | 29 | 112 | 60 | −114 | −39 | 74 | 28 | 167 | 100 | |
| Ground Heat Flux | J∙s−1∙m−2 | −164 | 28 | −270 | −78 | −393 | −168 | −104 | −77 | −412 | −204 | −706 | −464 | |
| Available Energy | J∙s−1∙m−2 | 405 | 213 | 511 | 320 | 509 | 286 | 46 | 19 | 332 | 125 | 599 | 358 | |
| Evaporative Flux (×10−4) | J∙s−1∙m−2 | 1452 | 764 | 1856 | 1187 | 1591 | 915 | 613 | 230 | 1059 | 394 | 1790 | 1048 | |
| Type and Reference | Vapor Flux Equation (g∙m−2∙s−1) |
|---|---|
| Mass-Transfer | |
| [32] | |
| [33] | |
| [34] | |
| Combination | |
| [35] | |
| [36] | |
| [37] |
| Method | Best Fit | Coefficient of Determination (R2) | Residual Sum of Squares (SSE) | Regression Sum of Squares (SSR) | Total Sum of Squares (TSS) |
|---|---|---|---|---|---|
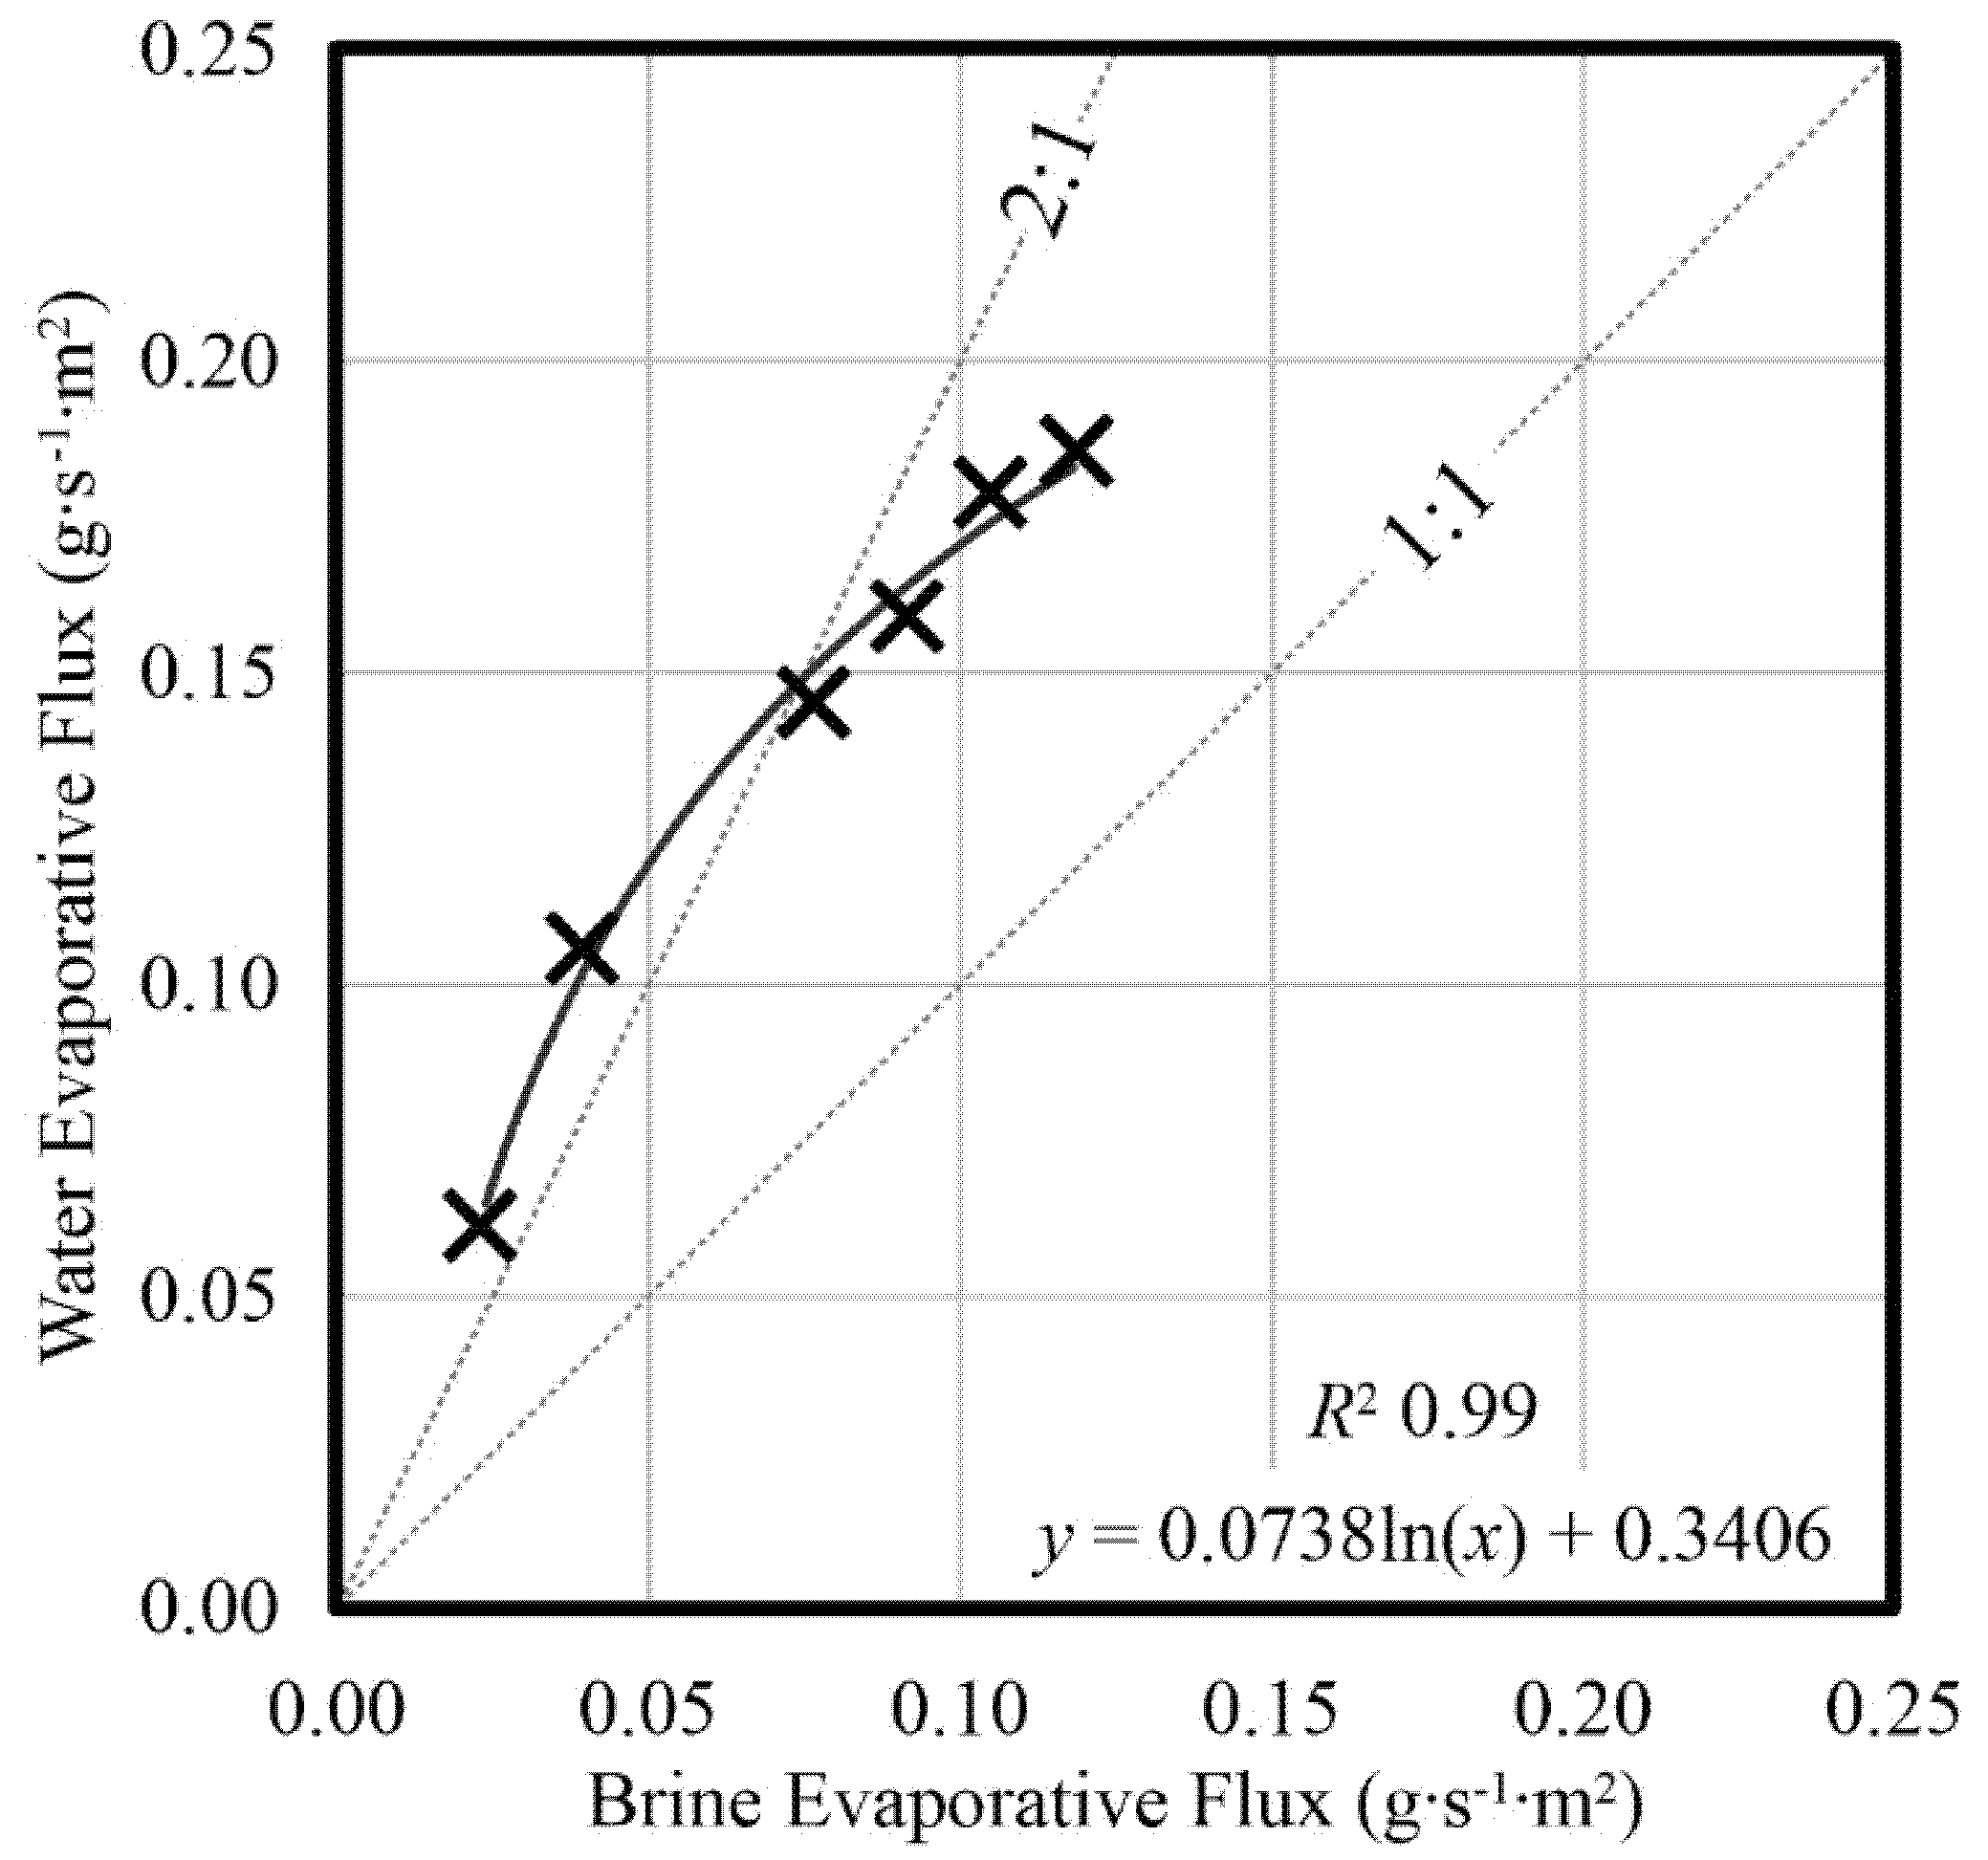
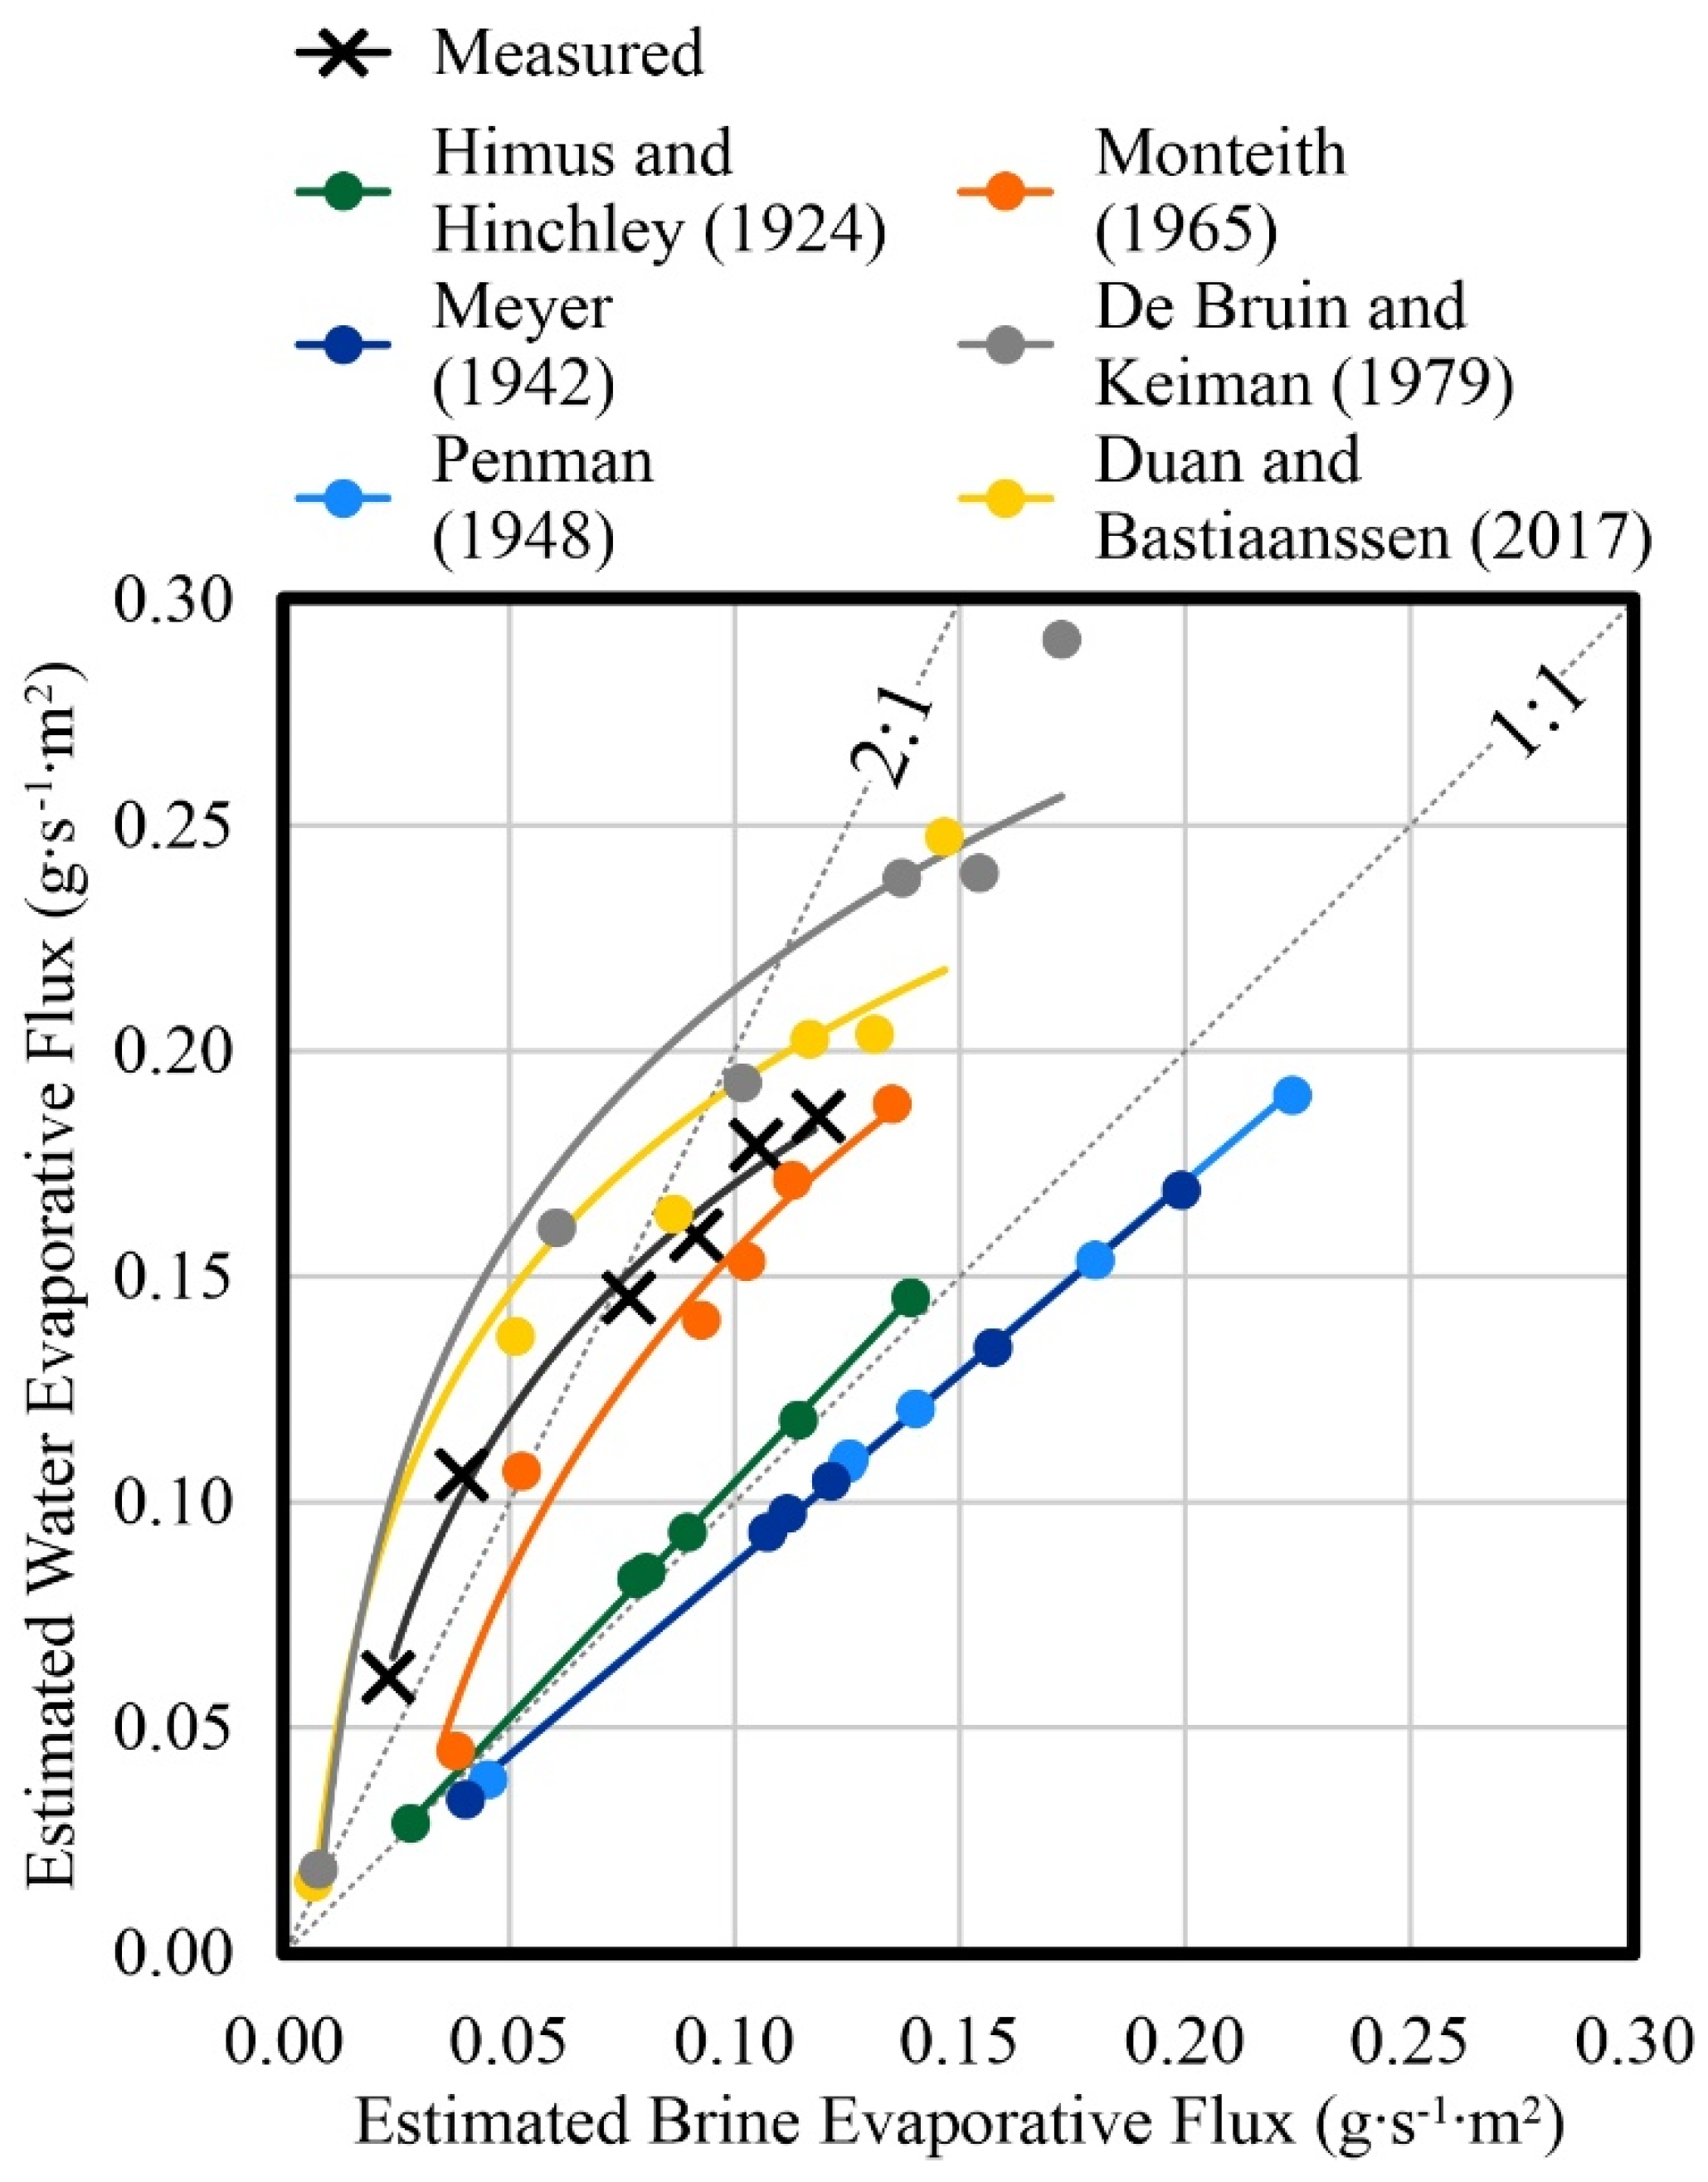
| BAS2 | Logarithmic | 0.9910 | 1 × 10⁻⁴ | 0.0112 | 0.0113 |
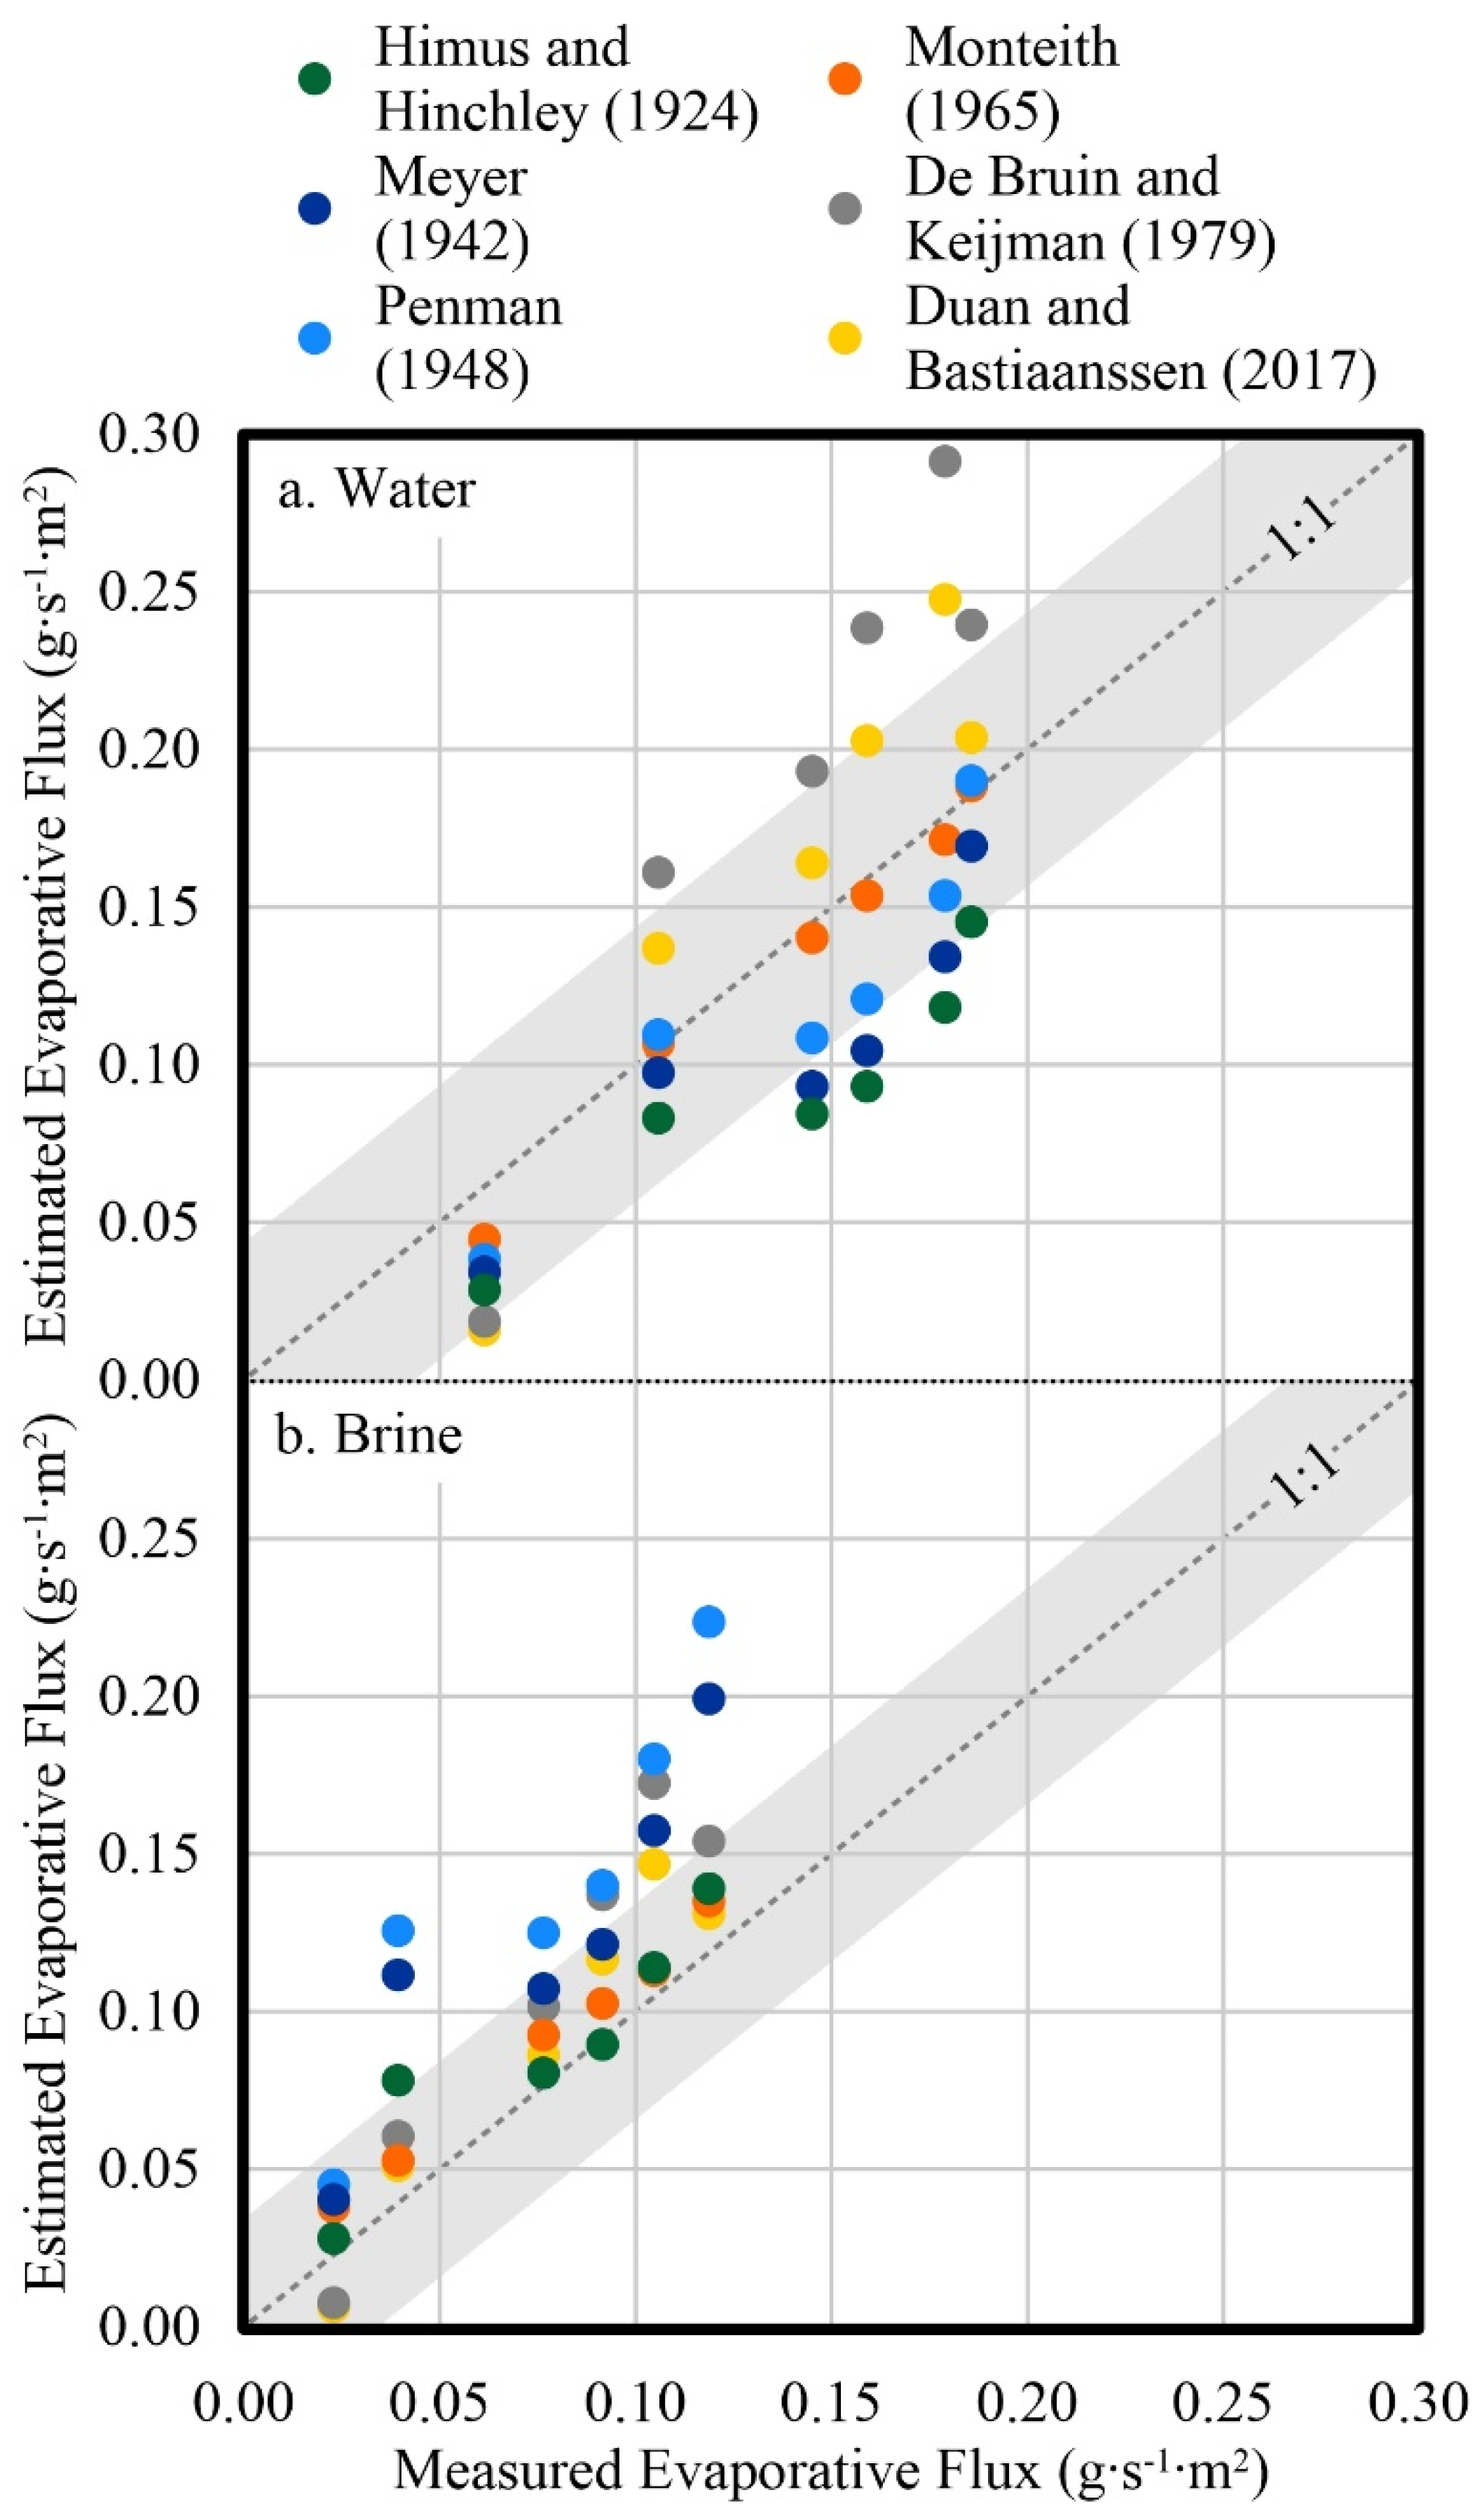
| [32] | Linear | 0.9997 | 3 × 10⁻⁶ | 0.0080 | 0.0080 |
| [33] | Linear | 0.9994 | 6 × 10⁻⁶ | 0.0102 | 0.0102 |
| [34] | Linear | 0.9997 | 8 × 10⁻⁶ | 0.0129 | 0.0129 |
| [35] | Logarithmic | 0.9616 | 5 × 10⁻⁴ | 0.0129 | 0.0134 |
| [36] | Logarithmic | 0.9778 | 2 × 10⁻³ | 0.0433 | 0.0453 |
| [37] | Logarithmic | 0.9559 | 1 × 10⁻³ | 0.0313 | 0.0327 |
Publisher’s Note: MDPI stays neutral with regard to jurisdictional claims in published maps and institutional affiliations. |
© 2021 by the authors. Licensee MDPI, Basel, Switzerland. This article is an open access article distributed under the terms and conditions of the Creative Commons Attribution (CC BY) license (https://creativecommons.org/licenses/by/4.0/).
Share and Cite
Suchan, J.; Azam, S. Effect of Salinity on Evaporation from Water Surface in Bench-Scale Testing. Water 2021, 13, 2067. https://doi.org/10.3390/w13152067
Suchan J, Azam S. Effect of Salinity on Evaporation from Water Surface in Bench-Scale Testing. Water. 2021; 13(15):2067. https://doi.org/10.3390/w13152067
Chicago/Turabian StyleSuchan, Jared, and Shahid Azam. 2021. "Effect of Salinity on Evaporation from Water Surface in Bench-Scale Testing" Water 13, no. 15: 2067. https://doi.org/10.3390/w13152067
APA StyleSuchan, J., & Azam, S. (2021). Effect of Salinity on Evaporation from Water Surface in Bench-Scale Testing. Water, 13(15), 2067. https://doi.org/10.3390/w13152067