Article

Contrasting Evolution Patterns of Endorheic and Exorheic Lakes on the Central Tibetan Plateau and Climate Cause Analysis during 1988–2017

1
Research Institute of Forestry, Chinese Academy of Forestry, Beijing 100091, China
2
Key Laboratory of Land Surface Pattern and Simulation, Institute of Geographic Sciences and Natural Resources Research, Chinese Academy of Sciences, Beijing 100101, China
3
College of Management, Chongqing University of Technology, Chongqing 400054, China
4
Beijing Research Center for Science of Science, Beijing Academy of Sciences and Technology, Beijing 100089, China
5
School of Ethnology and Sociology, Yunnan University, Kunming 650091, China
*
Author to whom correspondence should be addressed.
Water 2021, 13(14), 1962; https://doi.org/10.3390/w13141962
Submission received: 13 May 2021 / Revised: 7 July 2021 / Accepted: 15 July 2021 / Published: 17 July 2021
(This article belongs to the Section Hydrology)

Abstract

:
The alpine lakes on the Tibetan Plateau (TP) are indicators of climate change. The assessment of lake dynamics on the TP is an important component of global climate change research. With a focus on lakes in the 33° N zone of the central TP, this study investigates the temporal evolution patterns of the lake areas of different types of lakes, i.e., non-glacier-fed endorheic lakes and non-glacier-fed exorheic lakes, during 1988–2017, and examines their relationship with changes in climatic factors. From 1988 to 2017, two endorheic lakes (Lake Yagenco and Lake Zhamcomaqiong) in the study area expanded significantly, i.e., by more than 50%. Over the same period, two exorheic lakes within the study area also exhibited spatio-temporal variability: Lake Gaeencuonama increased by 5.48%, and the change in Lake Zhamuco was not significant. The 2000s was a period of rapid expansion of both the closed lakes (endorheic lakes) and open lakes (exorheic lakes) in the study area. However, the endorheic lakes maintained the increase in lake area after the period of rapid expansion, while the exorheic lakes decreased after significant expansion. During 1988–2017, the annual mean temperature significantly increased at a rate of 0.04 °C/a, while the annual precipitation slightly increased at a rate of 2.23 mm/a. Furthermore, the annual precipitation significantly increased at a rate of 14.28 mm/a during 1995–2008. The results of this study demonstrate that the change in precipitation was responsible for the observed changes in the lake areas of the two exorheic lakes within the study area, while the changes in the lake areas of the two endorheic lakes were more sensitive to the annual mean temperature between 1988 and 2017. Given the importance of lakes to the TP, these are not trivial issues, and we now need accelerated research based on long-term and continuous remote sensing data.

1. Introduction

Lakes are sensitive to climate change in terms of several aspects of hydrology, meteorology, biology, and limnology [1,2,3,4,5,6]. Lake area is one of the most important indicators of changes in the water resources, which play a pivotal role in the eco-environment and human society, especially for lakes in semi-arid regions and cold regions [5,6,7]. Although lake area records are available for some lakes, fieldwork is difficult for most lakes in remote regions [6]. Remote sensing has been widely used to monitor lake area changes on a large scale [8,9]. It can be used to depict lake dynamics and to evaluate the influences of climate change and human activities [9,10].
The Tibetan Plateau (TP) is known as the world’s third pole [2,6] and as the Asian Water Tower [11]. The distribution of many lakes is a major feature of the TP, and its total lake area accounted for 59.14% of China’s total lake area in 2015 [12,13]. Studies have reported that lake expansion since the late 1990s is one of the most outstanding environmental change events on the TP [14]. Moreover, the lake expansion has been accelerated in the 2000s, and has mainly occurred in the endorheic TP [14,15,16,17]. However, researches on whether the area changes of exorheic lakes have a period of rapid expansion in the 2000s on the TP, and contrasting the differences of evolution patterns between endorheic lakes and exorheic lakes are still lacking. Compared to lakes in other parts of the world, the lakes on the TP are relatively uninfluenced by anthropogenic activities. Thus, they are considered to be an indicator of climatic change [2,15,16,18]. Amplified climate changes of polar and cold climate environments, especially of the TP, are important components of global change research [19]. In recent years, precipitation and temperature have contributed to the lake change on the TP [14,16,17,20,21,22]. However, the differences of driving mechanisms of lake dynamics among endorheic lakes and exorheic lakes on the TP are still under debate.
Because the lake dynamics could be associated with lake type, it is important to differentiate lake type when analyzing the lake change [23]. Here, we chose four non-glacier-fed lakes (Lake Yagenco, Lake Zhamcomaqiong, Lake Zhamuco, and Lake Gaeencuonama) in the 33° N zone of the central TP, and these lakes are located on the northern slope of the Tanggula Mountains. The first two lakes are located within the inland basin, and the last two lakes are located within the Yangtze River Basin [24]. These four lakes are in one of the 25 National Key Ecological Function Areas in China and are also in one of the key implementation areas of the ecological conservation and restoration project in the Three-River Source Region (TRSR) [25]. In this study, we investigated the patterns of the area changes of two endorheic lakes and two exorheic lakes at similar latitudes on the central TP, examined how climatic factors affect these patterns, and explored the differences of evolution patterns and driving mechanisms among these endorheic lakes and exorheic lakes. Following the Introduction, Section 2 introduces the study area, describes the materials used, and explains the methodology in detail. Section 3 presents the lake area dynamics and their influencing factors and analyzes the relationships between the lake area and climate factors. Section 4 presents a discussion of the changes in the TP’s lakes and the influencing factors. The conclusions and further implications are presented in Section 5. As a case study, this research provides an improved understanding of lake area changes among endorheic lakes and exorheic lakes and promotes a better understanding of the environmental changes caused by global warming on the TP.

2. Materials and Methods
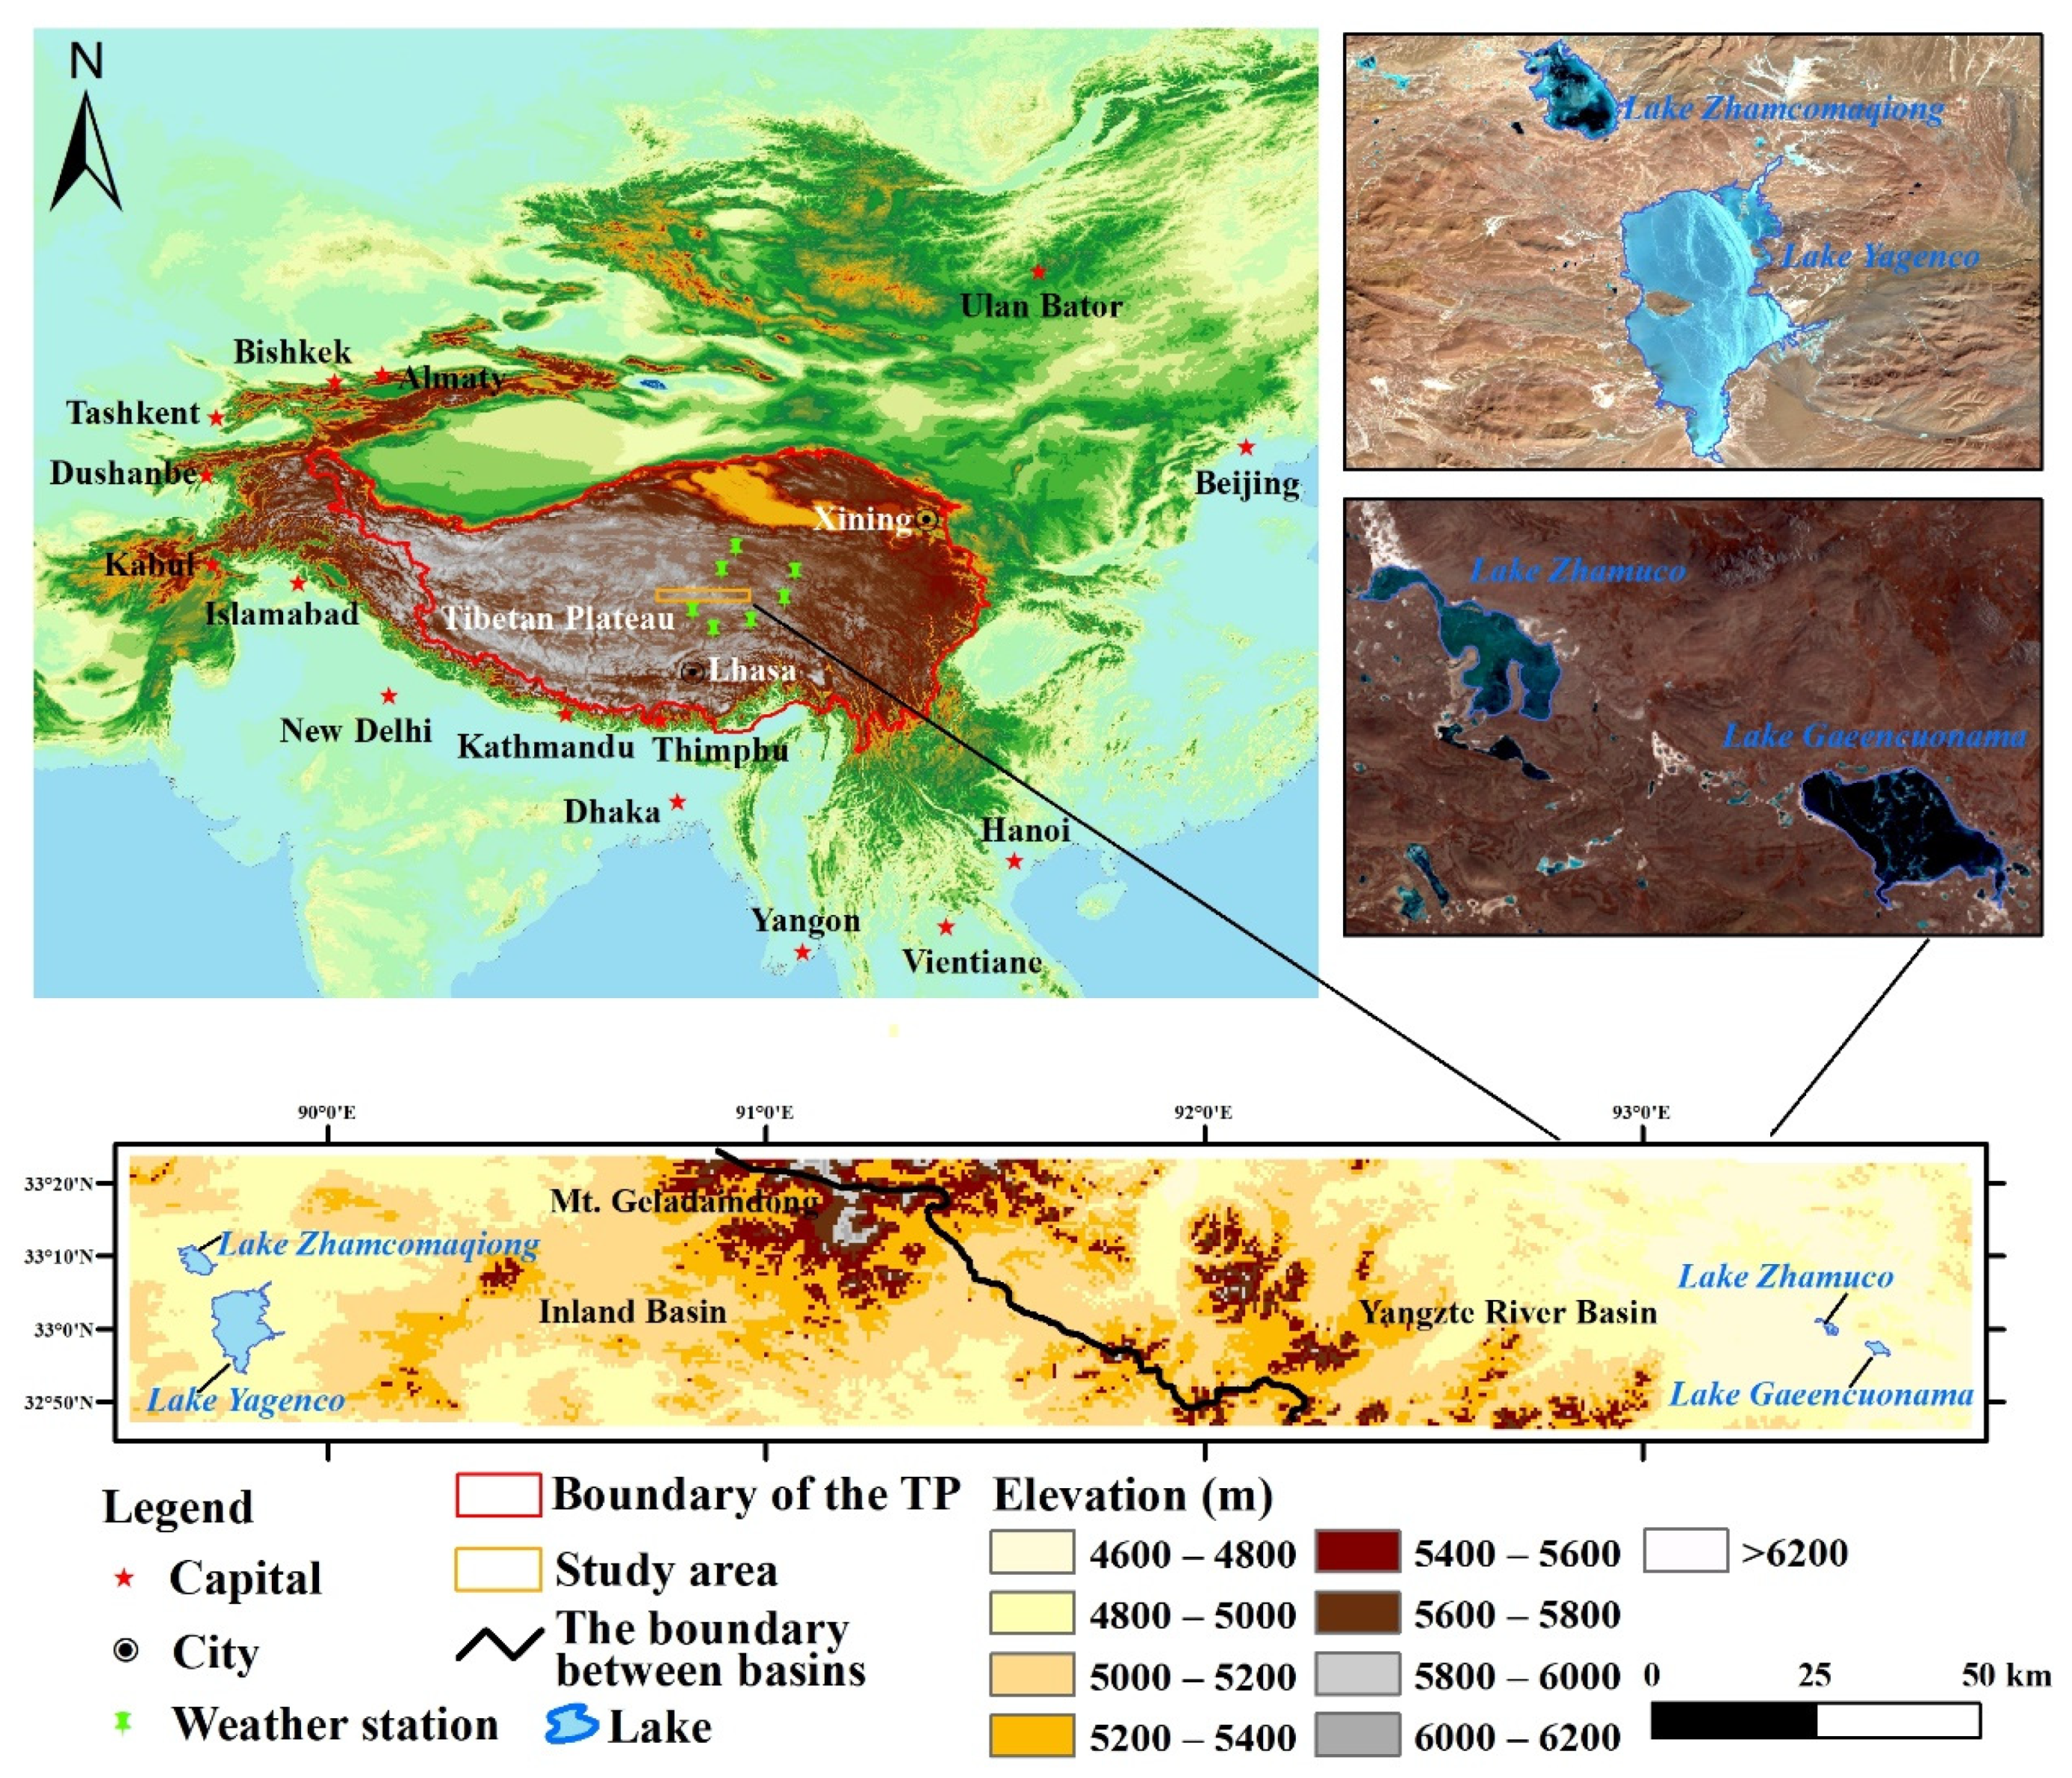
2.1. Study Area

The study area is located in the Tanggula Mountains on the central TP (Figure 1). The climate in the study area is a continental climate, with an annual mean temperature of −0.98 °C and an annual precipitation of 445.54 mm [15,26,27]. More than 70% of the total annual precipitation in the study area is concentrated from June to September (based on precipitation data from the China Meteorological Data Center for 1988–2017).
There are four non-glacier-fed lakes in the study area (Figure 1). Lake Yagenco (89°47.61′ E, 33°1.44′ N, 4869 m a.s.l), Lake Zhamcomaqiong (89°41.71′ E, 33°9.82′ N, 4889 m a.s.l), Lake Zhamuco (93°25.57′ E, 33°0.68′ N, 4691 m a.s.l), and Lake Gaeencuonama (93°32.42′ E, 32°57.82′ N, 4697 m a.s.l) had areas of 165.84 km2, 30.64 km2, 6.20 km2, and 8.97 km2 in 2017, respectively (calculated from Landsat images). Among the lakes, Lake Yagenco and Lake Zhamcomaqiong are endorheic lakes, while Lake Zhamuco and Lake Gaeencuonama are exorheic lakes [23,27]. Climate in the area containing Lake Yagenco and Lake Zhamcomaqiong is mainly influenced by the Westerlies, while that in the area containing Lake Zhamuco and Lake Gaeencuonama is mainly influenced by the East Asian Monsoon [16,23,27].

2.2. Data and Processing

2.2.1. Remote Sensing (RS) Data

A total of 41 Landsat satellite (TM, ETM, and OLI) images were used to explore the patterns of the changes in the extents of the selected lakes (i.e., Lake Yagenco, Lake Zhamcomaqiong, Lake Zhamuco, and Lake Gaeencuonama) from 1988 to 2017 (downloaded from the United States Geological Survey website, http://glovis.usgs.gov, accessed on 1 June 2018). The information related to each image is presented in Table 1. The cloud cover was less than 30% on each of the 41 Landsat RS image scenes used for the lake interpretation.
To compare the lake extents at an inter-annual scale, we selected Landsat images with acquisition dates from September to December (Table 1) each year because the maximum rate of change in the extent was less than 2% during this period [28], which was the end of the wet season or just after (June–September) [23]. In cases where several images were available for this period for a particular year, we selected the image with the least cloud cover to map the lake extent. Lake boundary extraction was not performed in cases where no high-quality images were available.

2.2.2. Meteorological Data

The meteorological data used in this study were downloaded from the China Meteorological Data Center (http://data.cma.gov.cn, accessed on 10 July 2018). The data used were the annual mean temperature and the annual precipitation records collected between 1988 and 2017 at seven weather stations (Zaduo, Naqu, Anduo, Suoxian, Wudaoliang, Qumalai, and Tuotuohe) within the vicinity of the selected lakes. The average values of the annual mean temperature and precipitation for each year across the weather stations were used in the same year for the entire study area.

2.2.3. Other Auxiliary Data

The auxiliary data used in this analysis included topographic maps, a digital elevation model (DEM), and boundary data for the TP and the relevant basins. The topographic maps were provided at 1:100,000 scale by the Institute of Geographic Sciences and Natural Resources Research, Chinese Academy of Sciences. These maps were used as a reference when geometrically correcting the Landsat images.
The DEM data used were downloaded from the Shuttle Radar Topography Mission (SRTM) website (http://srtm.csi.cgiar.org/, accessed on 12 July 2018), with a 30 m spatial resolution. The boundary of the TP used was from Zhang et al. [29]. The boundary between the Inland Basin and the Yangtze River Basin used was from Yang et al. and Zhao et al. [20,27]. These data were all used to draw Figure 1.

2.2.4. Data Preparation

The Geometric Correction/Registration/Registration: Image to Map tool in the ENVI 5.3 software was used for the geometric corrections. A topographic map was used as the base image, while Landsat provided warped images. A total of 48 ground control points were then selected within the base image and within each warped image. The polynomial method was used for the geometric correction calculations of the model, and a cubic convolution was used for the resampling. Then, the Landsat images were geometrically corrected within a root-mean-square error (RMSE) of one pixel. The Radiometric Correction/Radiometric Calibration and Radiometric Correction/Atmospheric Correction Module/FLAASH Atmospheric Correction tools in the ENVI 5.3 software were then applied for the radiometric calibration and atmospheric correction, respectively.
Based on the data preprocessing described above, the Landsat images used for the extraction of data on lakes during 1988–2017 were acquired. Then, we delineated the boundaries of the lakes manually through visual interpretation. Finally, we extracted the extents of Lake Yagenco, Lake Zhamcomaqiong, Lake Zhamuco, and Lake Gaeencuonama. A Confusion Matrix was used to assess the classification accuracy of our delineated lake boundaries [12]. In this study, a total of 179 test sample plots, from two field surveys and measurements carried out in 2015 and 2016, were used for accuracy assessment. On the whole, user accuracy of the lakes was 99.84%, producer accuracy of the lakes was 98.10%, the overall accuracy of classification was 98.64%, and the kappa statistic was 0.97, which is acceptable for lake change analysis.

2.2.5. Data Analysis

The equations used to calculate the changes in the lake area are as follows [9,30].
α = S n e x t S p r e v i o u s S p r e v i o u s × 100 %
β = S n e x t S p r e v i o u s S p r e v i o u s × 1 T × 100 %
In Equations (1) and (2), α (%) is the proportional change in the lake area; and β (%) is the annual rate of change. In other words, β (%) is the average rate of change in the lake area over a given period. Sprevious (km2) is the lake area in the previous period; Snext (km2) is the lake area in the next time slot; and T (a) is the entire time period of the study.
Then, the Pearson’s correlation coefficients of the relationships between the various factors and lake areas were calculated. The statistical significance levels were set at 0.01, 0.05, and 0.1 for the different years.
We used the least squares method to detect the trends in the lake area changes and to perform their piecewise linear fitting. This approach has been used in previous studies to identify overall trends and to identify the breakpoints between the periods with significantly different tendencies [31,32]. We applied the statistical procedure and operation code outlined by Tomé and Miranda [31] in this study using the ENVI/IDL software to identify the trend change points in the lake-area time series. These points divided the lake-area time series in this study into several sub-periods, which were used to identify the characteristics of the stages in the different sub-periods.

3. Results

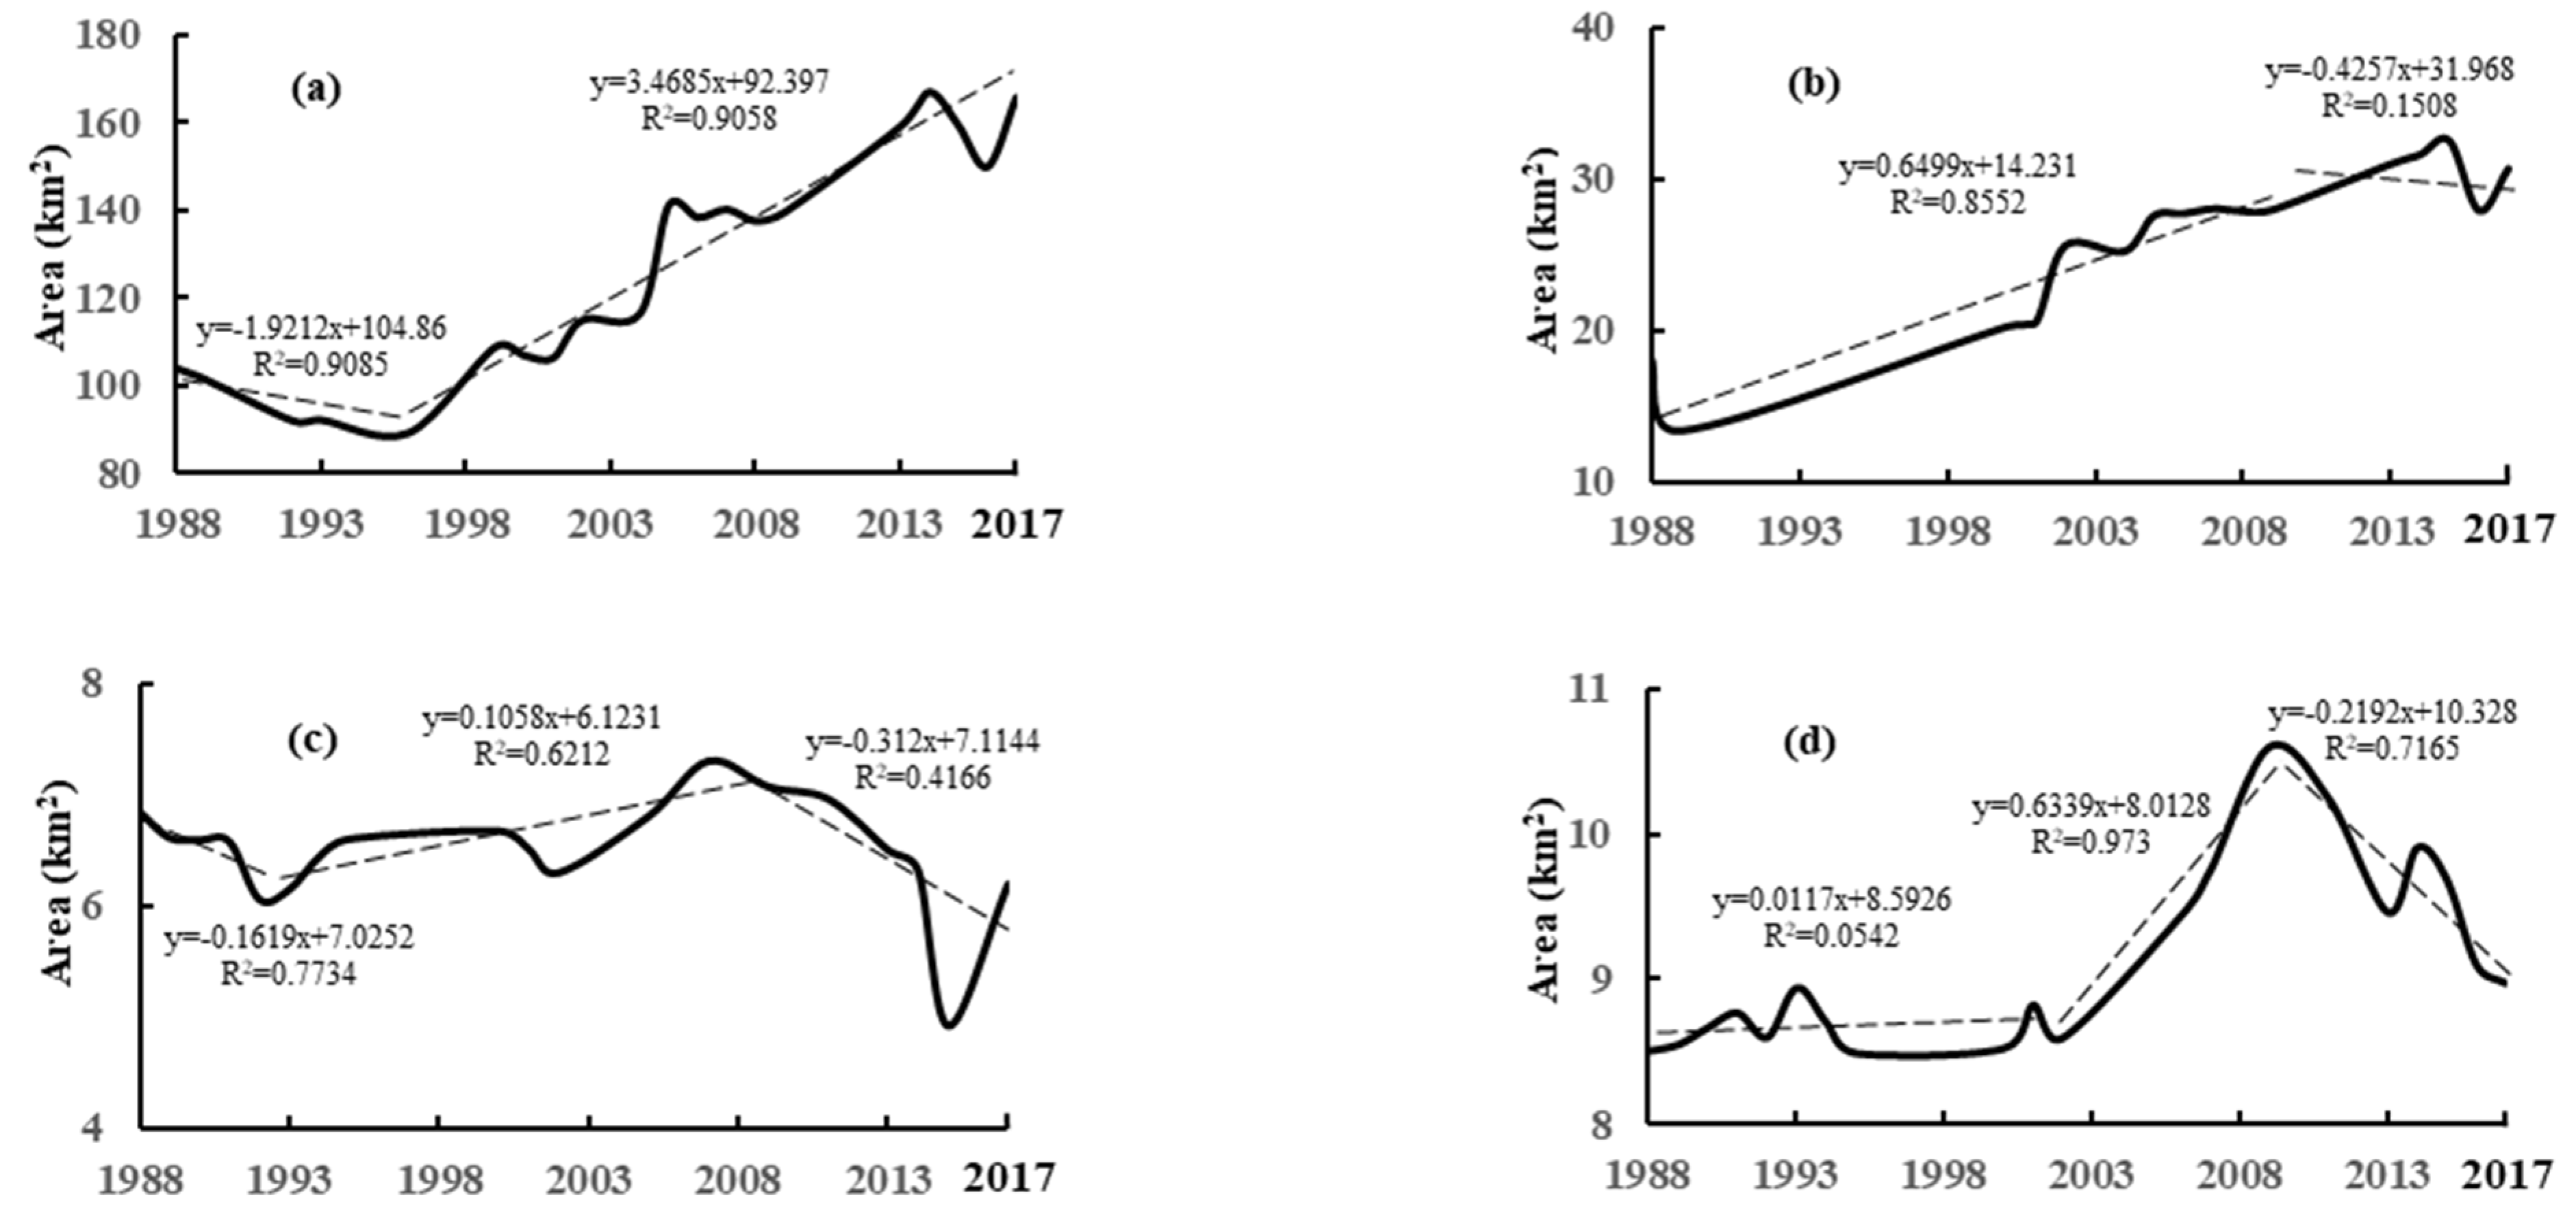
3.1. Pattern of Lake-Area Change

From 1988 to 2017, the two endorheic lakes in the study area expanded significantly, with a proportional change, α (%), of 60.73% (r = 0.923, p < 0.01) (Figure 2a,b). Over the same period, the area of Lake Yagenco significantly increased, with a proportional change, α (%), of 59.16% (r = 0.925, p < 0.01). This means that the annual rate of change in the lake area, β (%), was 1.97%/a. During 1988–1996, the area of Lake Yagenco decreased, with a β (%) of −1.57%/a (r = −0.953, p < 0.01). During 1997–2017, the area of Lake Yagenco increased, with a β (%) of 4.06%/a (r = 0.952, p < 0.01). During 1988–2017, the area of Lake Zhamcomaqiong significantly increased, with an α (%) of 69.79% (r = 0.925, p < 0.01) and a β (%) of 2.33%/a. During 1988–2009, the area of Lake Zhamcomaqiong increased, with a β (%) of 2.49%/a (r = 0.925, p < 0.01). During 2010–2017, the change in the area of Lake Zhamcomaqiong was not significant (r = −0.388, p > 0.1).
The lake area changes of the two exorheic lakes (Lake Zhamuco and Lake Gaeencuonama) in the study area between 1988 and 2017 were detected (Figure 2c,d). Over the same period, the change in the area of Lake Zhamuco was not significant, with an α (%) of −9.54% (r = −0.175, p > 0.1) and a β (%) of −0.32%/a. During 1988–1992, the area of Lake Zhamuco decreased, with a β (%) of −2.31%/a (r = −0.879, p < 0.05). During 1993–2009, the area of Lake Zhamuco increased, with a β (%) of 0.99%/a (r = 0.788, p < 0.01). During 2010–2017, the area of Lake Zhamuco decreased, with a β (%) of −1.55%/a (r = −0.645, p < 0.1). During 1988–2017, the area of Lake Gaeencuonama slightly increased, with an α (%) of 5.48% (r = 0.689, p < 0.01) and a β (%) of 0.18%/a. During 1988–2002, the change in the area of Lake Gaeencuonama was not significant, with a β (%) of 0.07%/a (r = 0.085, p > 0.1). During 2003–2009, the area of Lake Gaeencuonama significantly increased, with a β (%) of 3.34%/a (r = 0.980, p < 0.05). During 2010–2017, the area of Lake Gaeencuonama decreased, with a β (%) of −1.92%/a (r = −0.926, p < 0.01).
Figure 2 shows that there was a period of rapid expansion after 2000, with area changes in both the closed lakes and the open lakes in the study area. For instance, the areas of Lake Yagenco and Lake Zhamcomaqiong increased the most in 2004–2005 and 2001–2002, i.e., by 21.26% (Figure 2a) and 24.97% (Figure 2b), respectively. The most rapid expansions in the areas of Lake Zhamuco and Lake Gaeencuonama occurred in 2002–2007 and 2002–2009, i.e., by 16.02% (Figure 2c) and 23.35% (Figure 2d), respectively. The differences in the area changes of the lakes in the study area were that the endorheic lakes maintained the increase in lake area after the period of rapid expansion, while the exorheic lakes decreased after their significant increases. For example, the areas of Lake Yagenco and Lake Zhamcomaqiong increased by 17.23% and 19.79% during 2006–2017 and 2003–2017, respectively; whereas, the areas of Lake Zhamuco and Lake Gaeencuonama decreased by 15.20% and 15.39% during 2008–2017 and 2010–2017, respectively.

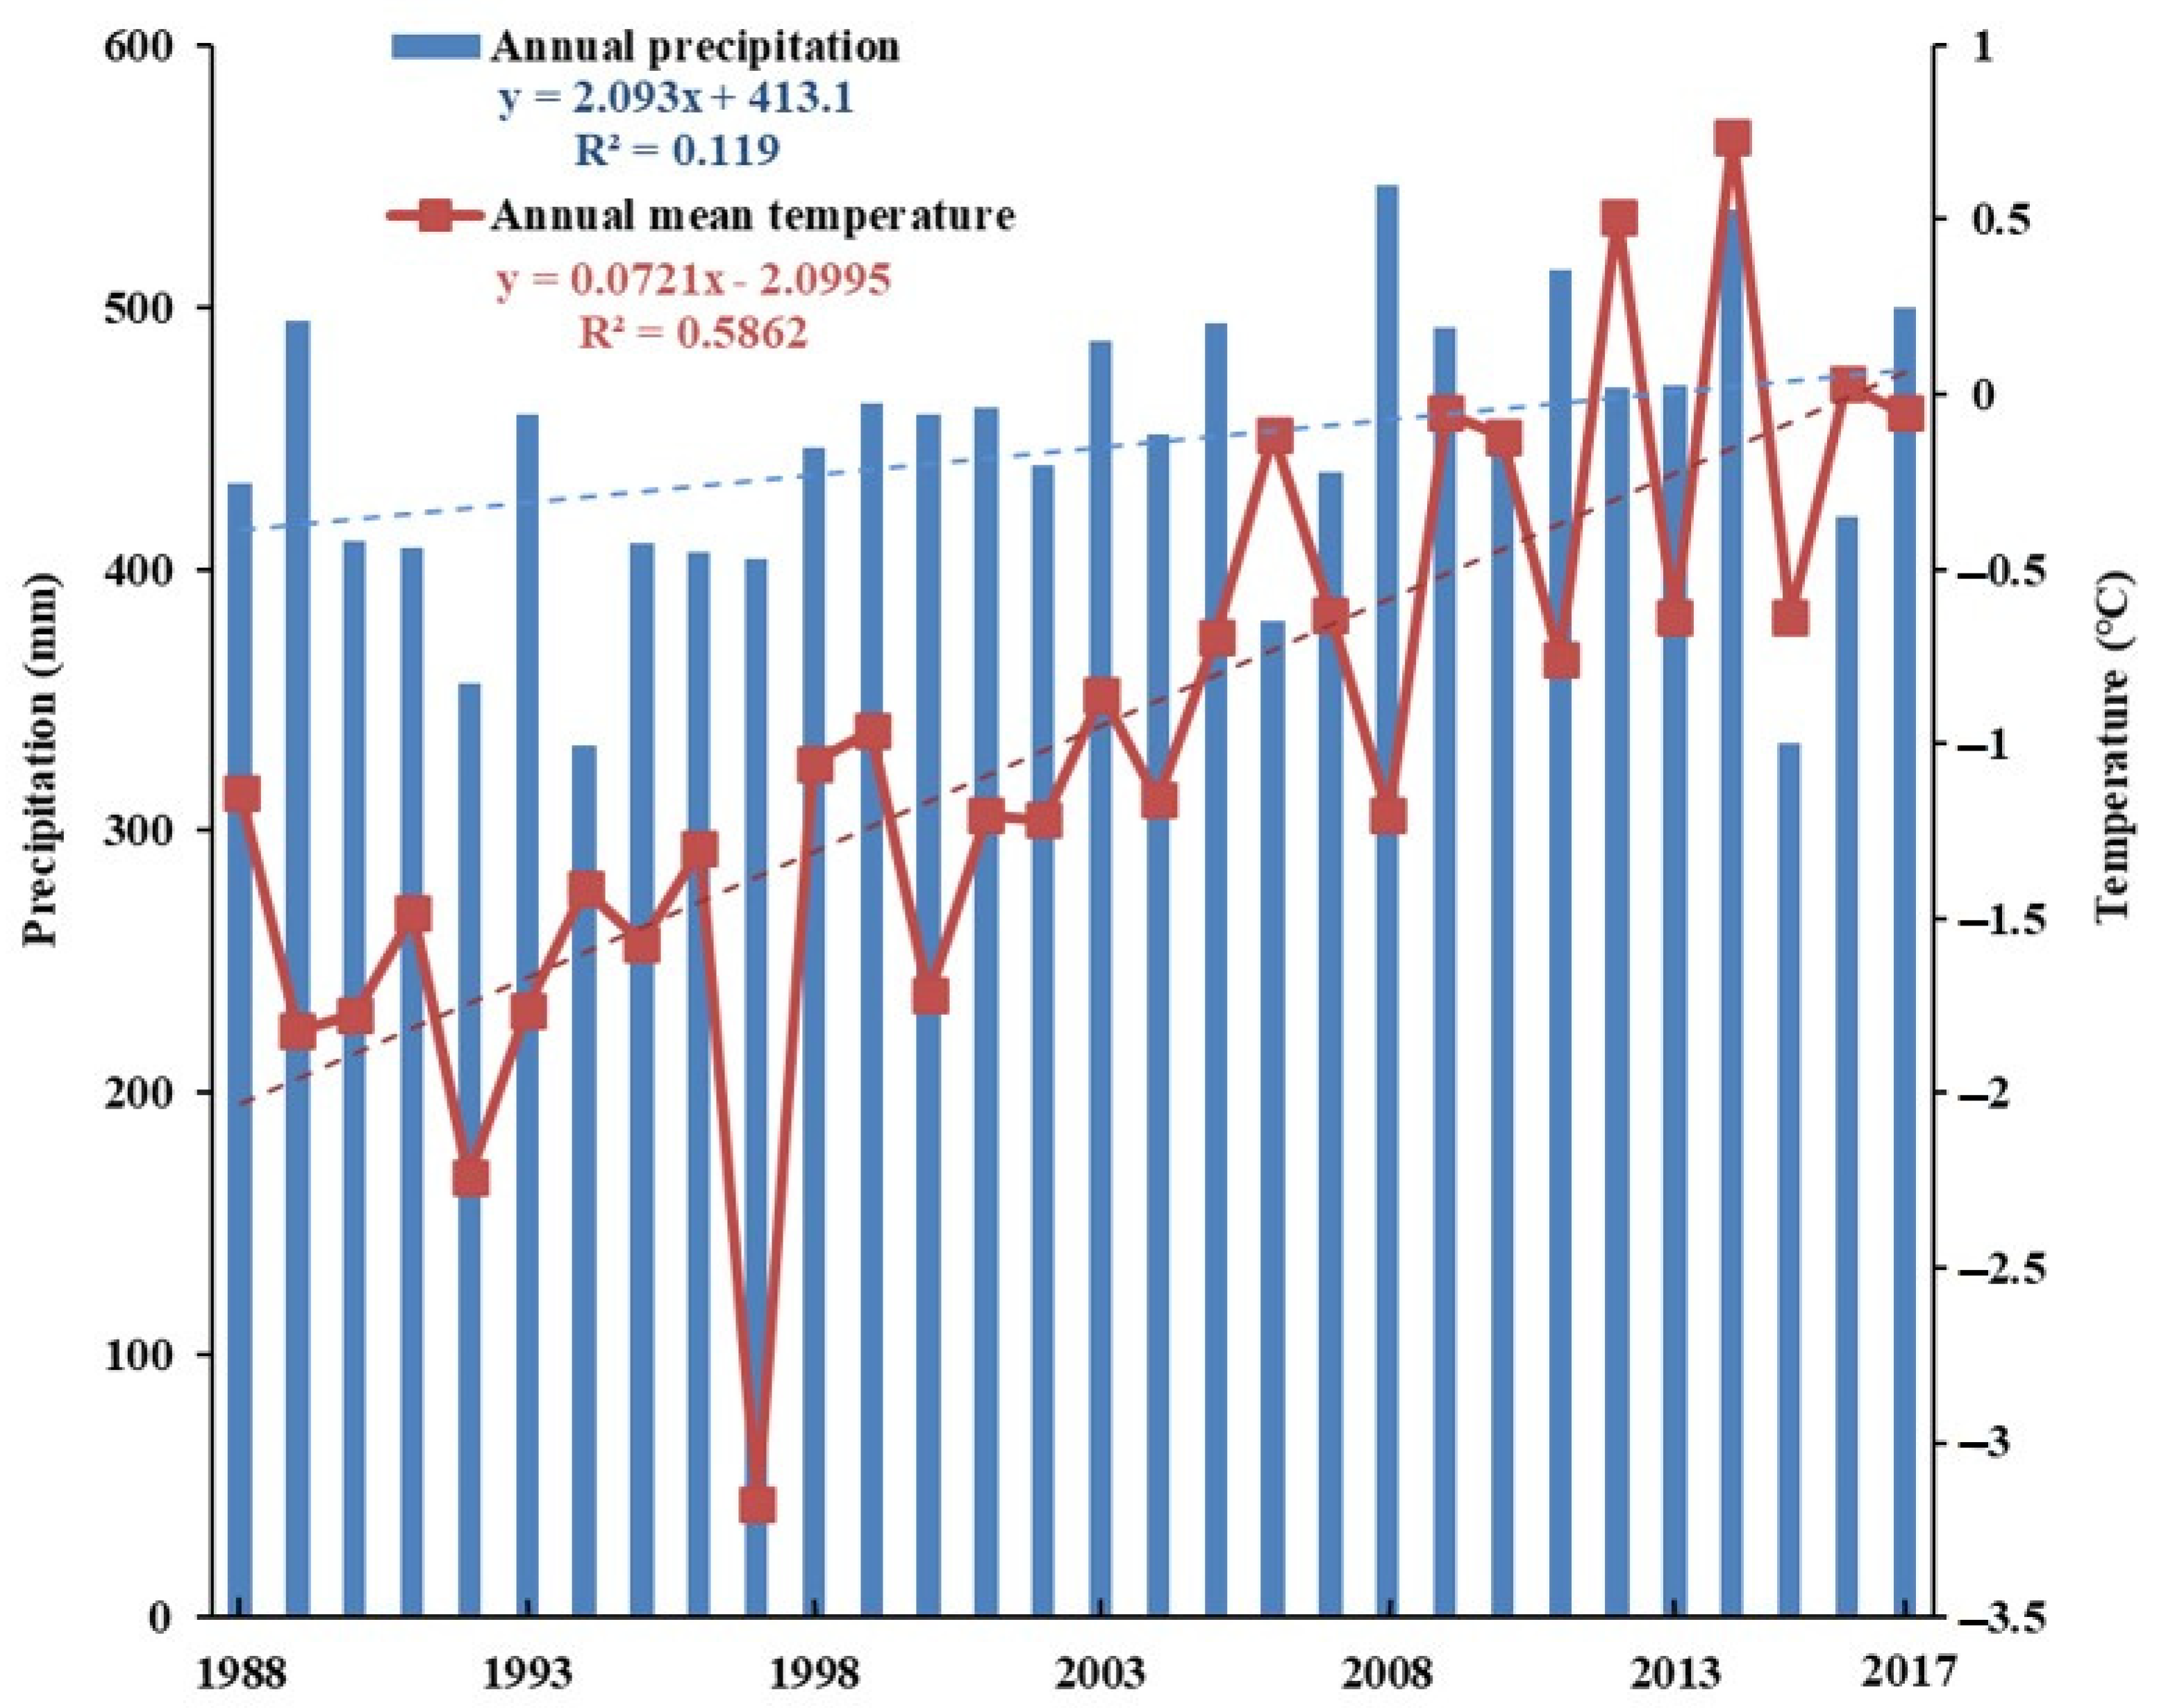
3.2. Changes in Temperature and Precipitation

The annual mean temperature increased at a rate of 0.04 °C/a (r = 0.766, p < 0.01) (Figure 3). The annual mean temperature was −1.14 °C in 1988 and rose to −0.05 °C in 2017. The average annual mean temperature was −0.98 °C throughout this period. From 1988 to 2017, the highest annual mean temperature occurred in 2014 (0.74 °C). Furthermore, the change in the temperature was not significant from 1988 to 1997 (r = −0.408, p > 0.1). During 1998–2012, the temperature rose significantly at a rate of 0.23 °C/a (r = 0.752, p < 0.01). During 2013–2017, the change in the annual mean temperature was also not significant (r = −0.203, p > 0.1).
The annual precipitation slightly increased at a rate of 2.23 mm/a (r = 0.345, p < 0.05) (Figure 3). The annual precipitation was 432.81 mm in 1988 and increased to 499.60 mm in 2017. The average annual precipitation was 445.54 mm throughout this period. From 1988 to 2017, the highest annual precipitation occurred in 2008 (546.63 mm). Furthermore, the precipitation decreased from 1988 to 1994 at a rate of −14.34 mm/a (r = −0.587, p < 0.1). During 1995–2008, the precipitation increased significantly at a rate of 14.28 mm/a (r = 0.605, p < 0.01). During 2009–2017, the change in annual precipitation was not significant (r = −0.424, p > 0.1).

3.3. Relationships between Lake-Area Change and Annual Mean Temperature and Annual Precipitation

We performed a correlation analysis on the precipitation and temperature values for each year versus the lake area values. These analyses revealed that the precipitation was positively correlated with the areas of the two exorheic lakes (Lake Zhamuco and Lake Gaeencuonama) (Table 2). Increased precipitation equates to greater hydrological lake recharge. Therefore, precipitation was responsible for the observed changes in the lake areas of the two exorheic lakes within the study area.
The analysis results also revealed positive correlations between the temperature and areas of the two endorheic lakes, reaching the 99% confidence level (Lake Yagenco and Lake Zhamcomaqiong) (Table 2). A similar relationship between the lake area and temperature occurred for Lake Gaeencuonama. The relatively higher correlation between the lake area and temperature implies that the temperature was a likely contributor to the area changes of Lake Yagenco, Lake Zhamcomaqiong, and Lake Gaeencuonama. Furthermore, these lakes are non-glacier-fed lakes, and they are located in permafrost regions [23,27,33]. It seems that permafrost thawing increased the meltwater supply during the significant warming trend in the study area [23,34], and thus, these three lakes received an increased water supply from permafrost melting.

4. Discussion

Lakes are important indicators of the Earth’s hydrological cycle and are referred to as sentinels of climate change [15,21]. Monitoring lake dynamics is of vital importance for understanding climatic change [3,20]. The alpine lakes on the TP exhibited strong spatio-temporal changes during the 1960s–2019 [14,23,35,36,37,38,39]. Since the late 1990s, the lake area on the TP has increased significantly, and about three-quarters of the alpine lakes have dramatically expanded [6,15,38]. Lake expansion has become one of the most outstanding environmental change events on the TP [14,39]. Rapid expansion occurred in glacier-fed lakes, non-glacier-fed lakes, endorheic lakes, and exorheic lakes [20,23,35]. The changes in endorheic lakes and glacier-fed lakes accounted for >90% and >80% of the substantial increase in the lake area on the TP over the past three decades, respectively [20,35,36]. In this study, we found that non-glacier-fed exorheic lakes expand dramatically in the 2000s within the 33° N zone of the central TP, while the non-glacier-fed endorheic lakes showed substantial increase in the lake area within the same region and time period. The non-glacier-fed lakes on the central TP exhibited an obvious expansion in 2002, 2005, and 2011 [23]. We also found that Lake Yagenco and Lake Zhamcomaqiong expanded most significantly in 2004–2005 and 2001–2002, respectively. On the central TP, 12 lakes exhibited the same remarkable growth between 2000 and 2005 [9,14,27,35]. We also found that Lake Zhamuco and Lake Gaeencuonama experienced a period of expansion from 2002 to 2007. Our results concerning the changes in the lake areas are consistent with the findings of previous studies of lakes on the central TP.
From the 1960s to 2019, the TP experienced significant warming and wetting trends [15,38], and the climate factors were the major cause of the lake area changes on the TP during this period [3,6,16,17,20,21,22]. We also found that the annual mean temperature and annual precipitation significantly increased in the study area during 1988–2017. In particular, after 2000, temperature in most regions of the TP increased significantly [15]. We also found that the temperature rose significantly in our study area after 1998. In previous studies, precipitation, temperature, evaporation, glacial meltwater, and permafrost degradation acted as the driving factors of lake expansion on the TP [3,6,9,14,15,23,34,35,36,37,38,39]. However, scholars have various viewpoints on the primary contributors to the lake area changes on the TP, including the following. Precipitation acted as the primary contributor to recent lake area variations on the TP over the past 60 years [14,20,21,35]. Temperature and evaporation were likely the major contributors to the changes in the lake area on the TP [3,36,38,39]. Moreover, the lakes on the Chiangtang Plateau were more sensitive to the annual mean temperature [9,38], while the lakes in the river source region were sensitive to the annual precipitation [38]. In this study, we found that climate driving factors contributing to area changes for endorheic and exorheic lakes in the 33° N zone of the central TP are different: Lake Yagenco and Lake Zhamcomaqiong on the Chiangtang Plateau were sensitive to the annual mean temperature, while Lake Zhamuco and Lake Gaeencuonama in the river source region were sensitive to the annual precipitation. Around the 33° N of the central TP, a warmer and wetter tendency in recent decades has been confirmed, and the warming-triggered glacier meltwater supply encouraged the precipitation-driven lake expansions in the 2000s [16]. In this study, we found that the temperature was a likely contributor to the area changes of three non-glacier-fed lakes in the 33° N zone of the central TP, and the water supply from the warming-triggered permafrost melting may augment the lake expansion in these areas. In addition, the glacial meltwater supply caused by warming and the precipitation may have equally contributed to the lake expansion on the TP [15,23,36], and precipitation and glacier melting were the most important contributors to the increase in lake area [2,36,37]. However, rapid expansion occurred in both glacier-fed and non-glacier-fed lakes, implying that deglaciation alone cannot fully explain the lake area changes on the TP [20,35]. Some scholars have speculated that the warming-triggered permafrost degradation is the main driver of lake evolution on the TP [34]. In the past three decades, about one-tenth of the permafrost in the TP has thawed, and there seems to be a good agreement between the spatial patterns of the permafrost degradation and lake expansion [9,34,40]. However, further investigation is required to obtain direct evidence of the impact of permafrost change on lake area change [34]. Based on the previous studies mentioned above, scholars have suggested that the lakes will probably keep expanding in the near future under the influences of continued warming and wetting [35]. Understanding the mechanisms of lake change on the TP will require comprehensive and in-depth efforts in the future [20].

5. Conclusions

On the basis of remote sensing monitoring and fieldwork, we investigated the patterns of the lake area changes of two endorheic lakes and two exorheic lakes on the central TP during 1988–2017 using Landsat image data, and we examined the relationships between these patterns and climatic factors. From 1988 to 2017, the areas of the two endorheic lakes in the study area significantly expanded. Lake Yagenco and Lake Zhamcomaqiong increased by 59.16% and 69.79%, respectively. Over the same period, the change in the area of one of the two exorheic lakes was not significant and that of the other lake slightly increased. Lake Gaeencuonama increased by 5.48%, while the change in Lake Zhamuco was not significant. The 2000s were a period of rapid expansion for both the closed lakes and open lakes in the study area. However, the endorheic lakes maintained the increase in lake area after the period of rapid expansion, while the exorheic lakes decreased after the period of significant expansion.
The annual mean temperature has been increasing since 1988 at a rate of 0.04 °C/a, while the annual precipitation slightly increased during 1988–2017 at a rate of 2.23 mm/a. Furthermore, the annual precipitation significantly increased at a rate of 14.28 mm/a from 1995 to 2008. The data presented in this study indicate that precipitation was responsible for the observed changes in the lake areas of the two exorheic lakes within the study area, while the changes in the lake areas of the two endorheic lakes were more sensitive to the annual mean temperature between 1988 and 2017. These findings provide important insights into the responses of endorheic lakes and exorheic lakes to climate changes. Research on the evolution patterns of the endorheic lakes and exorheic lakes on the TP requires continued comprehensive and in-depth efforts in the near future.

Author Contributions

Z.Z. and Z.H. conceived and designed the research; Z.H. contributed to the ideas; Z.Z. and Y.Z. contributed to the data analysis, interpretation and manuscript writing; and X.N. contributed to the discussion and paper revision. All authors have read and agreed to the published version of the manuscript.

Funding

This research was funded by the Major Program of National Social Science Foundation of China, grant number 17ZDA158”.

Data Availability Statement

Not Applicable.

Acknowledgments

We extend our sincere thanks to the editors and anonymous reviewers for their valuable time.

Conflicts of Interest

The authors declare no conflict of interest.

References

  1. Williamson, C.E.; Saros, J.E.; Schindler, D.W. Sentinels of change. Science 2009, 323, 887–888. [Google Scholar] [CrossRef] [PubMed]
  2. Mao, D.; Wang, Z.; Yang, H.; Li, H.; Thompson, J.R.; Li, L.; Song, K.; Chen, B.; Gao, H.; Wu, J. Impacts of Climate Change on Tibetan Lakes: Patterns and Processes. Remote Sens. 2018, 10, 358. [Google Scholar] [CrossRef] [Green Version]
  3. Intergovernmental Panel on Climate Change (IPCC). Working Group II Report Climate Change 2014: Impacts, Adaptation, and Vulnerability; World Meteorological Organization: Geneva, Switzerland, 2014. [Google Scholar]
  4. Gao, H.; Cathryn, M.R.; Li, C.; Sun, B. Understanding the Role of Groundwater in a Remote Transboundary Lake (Hulun Lake, China). Water 2017, 9, 363. [Google Scholar] [CrossRef]
  5. Li, H.; Gao, Y.; Li, Y.; Yan, S.; Xu, Y. Dynamic of Dalinor Lakes in the Inner Mongolian Plateau and Its Driving Factors during 1976. Water 2017, 9, 749. [Google Scholar] [CrossRef] [Green Version]
  6. Lei, Y.; Yao, T.; Yang, K.; Bird, B.W.; Tian, L.; Zhang, X.; Wang, W.; Xiang, Y.; Dai, Y.; Zhu, L.; et al. An integrated investigation of lake storage and water level changes in the Paiku Co basin, central Himalayas. J. Hydrol. 2018, 562, 599–608. [Google Scholar] [CrossRef] [Green Version]
  7. Chen, J.L.; Pekker, T.; Wilson, C.R.; Tapley, B.D.; Kostianoy, A.G.; Cretaux, J.-F.; Safarov, E.S. Long-term Caspian Sea level change. Geophys. Res. Lett. 2017, 44, 6993–7001. [Google Scholar] [CrossRef]
  8. Sheng, Y.; Song, C.; Wang, J.; Lyons, E.; Knox, B.R.; Cox, J.S.; Gao, F. Representative lake water extent mapping at continental scales using multi-temporal Landsat-8 imagery. Remote Sens. Environ. 2016, 185, 129–141. [Google Scholar] [CrossRef] [Green Version]
  9. Zhao, Z.; Liu, F.; Zhang, Y.; Liu, L.; Qi, W. The dynamic response of lakes in the Tuohepingco Basin of the Tibetan Plateau to climate change. Environ. Earth Sci. 2017, 76, 137. [Google Scholar] [CrossRef]
  10. Kleinherenbrink, M.; Lindenbergh, R.; Ditmar, P. Monitoring of lake level changes on the Tibetan Plateau and Tian Shan by retracking Cryosat SARIn waveforms. J. Hydrol. 2015, 521, 119–131. [Google Scholar] [CrossRef]
  11. Immerzeel, W.W.; Van Beek, L.P.H.; Bierkens, M.F.P. Climate change will affect the Asian Water Towers. Science 2010, 328, 1382–1385. [Google Scholar] [CrossRef]
  12. Xue, Z.; Lyu, X.; Chen, Z.; Zhang, Z.; Jiang, M.; Zhang, K.; Lyu, Y. Spatial and Temporal Changes of Wetlands on the Qinghai-Tibetan Plateau from the 1970s to 2010s. Chin. Geogr. Sci. 2018, 28, 935–945. [Google Scholar] [CrossRef] [Green Version]
  13. Zhang, G.; Yao, T.; Chen, W.; Zheng, G.; Shum, C.K.; Yang, K.; Piao, S.; Sheng, Y.; Yi, S.; Li, J.; et al. Regional differences of lake evolution across China during 1960s–2015 and its natural and anthropogenic causes. Remote Sens. Environ. 2019, 221, 386–404. [Google Scholar] [CrossRef]
  14. Yang, K.; Lu, H.; Yue, S.Y.; Zhang, G.Q.; Lei, Y.B.; La, Z.; Wang, W. Quantifying recent precipitation change and pre-dicting lake expansion in the Inner Tibetan Plateau. Clim. Chang. 2018, 147, 149–163. [Google Scholar] [CrossRef]
  15. Zhang, Z.; Chang, J.; Xu, C.-Y.; Zhou, Y.; Wu, Y.; Chen, X.; Jiang, S.; Duan, Z. The response of lake area and vegetation cover variations to climate change over the Qinghai-Tibetan Plateau during the past 30 years. Sci. Total Environ. 2018, 635, 443–451. [Google Scholar] [CrossRef] [PubMed]
  16. Song, C.Q.; Huang, B.; Keith, R.; Ke, L.H.; Vu, H.P. Accelerated lake expansion on the Tibetan Plateau in the 2000s: Induced by glacial melting or other processes? Water Resour. Res. 2014, 50, 3170–3186. [Google Scholar] [CrossRef] [Green Version]
  17. Li, Y.; Liao, J.; Guo, H.; Liu, Z.; Shen, G. Patterns and Potential Drivers of Dramatic Changes in Tibetan Lakes, 1972. PLoS ONE 2014, 9, e111890. [Google Scholar]
  18. Chang, B.; He, K.-N.; Li, R.-J.; Sheng, Z.-P.; Wang, H. Linkage of Climatic Factors and Human Activities with Water Level Fluctuations in Qinghai Lake in the Northeastern Tibetan Plateau, China. Water 2017, 9, 552. [Google Scholar] [CrossRef] [Green Version]
  19. Beylich, A.A.; Dixon, J.C.; Zwoliński, Z. Source-to-Sink Fluxes in Undisturbed Cold Environments; Cambridge University Press: Cambridge, UK, 2016. [Google Scholar]
  20. Yang, K.; Yao, F.; Wang, J.; Luo, J.; Shen, Z.; Wang, C.; Song, C. Recent dynamics of alpine lakes on the endorheic Changtang Plateau from multi-mission satellite data. J. Hydrol. 2017, 552, 633–645. [Google Scholar] [CrossRef]
  21. Yao, F.F.; Wang, J.D.; Yang, K.H.; Wang, C.; Blake, A.W.; Jean-Francois, C. Lake storage variation on the endorheic Tibetan Plateau and its attribution to climate change since the new millennium. Environ. Res. Lett. 2018, 13, 064011. [Google Scholar] [CrossRef]
  22. Madson, A.; Sheng, Y.; Song, C. ICESat-derived lithospheric flexure as caused by an endorheic lake’s expansion on the Tibetan Plateau and the comparison to modeled flexural responses. J. Asian Earth Sci. 2017, 148, 142–152. [Google Scholar] [CrossRef]
  23. Song, C.; Sheng, Y. Contrasting evolution patterns between glacier-fed and non-glacier-fed lakes in the Tanggula Mountains and climate cause analysis. Clim. Chang. 2016, 135, 493–507. [Google Scholar] [CrossRef]
  24. Zhao, Z.L.; Zhang, Y.L.; Liu, L.S.; Hu, Z.Z. The impact of drought on vegetation conditions within the Damqu River Basin, Yangtze River Source Region, China. PLoS ONE 2018, 13, e0202966. [Google Scholar] [CrossRef]
  25. Shao, Q.; Cao, W.; Fan, J.; Huang, L.; Xu, X. Effects of an ecological conservation and restoration project in the Three-River Source Region, China. J. Geogr. Sci. 2017, 27, 183–204. [Google Scholar] [CrossRef]
  26. Piao, S.; Cui, M.; Chen, A.; Wang, X.; Ciais, P.; Liu, J.; Tang, Y. Altitude and temperature dependence of change in the spring vegetation green-up date from 1982 to 2006 in the Qinghai-Xizang Plateau. Agric. For. Meteorol. 2011, 151, 1599–1608. [Google Scholar] [CrossRef]
  27. Zhao, Z.; Liu, L.; Wang, Z.; Zhang, Y.; Li, L.; Liu, F. Dynamic Changes of Plateau Wetlands in the Damqu River Basin, Yangtze River Source Region, China, 1988. Wetlands 2020, 40, 1409–1424. [Google Scholar] [CrossRef]
  28. Li, J.L.; Sheng, Y.W.; Luo, J.C.; Shen, Z.F. Remotely sensed mapping of inland lake area changes in the Tibetan plateau. J. Lake Sci. 2011, 23, 311–320, (In Chinese with English Abstract). [Google Scholar]
  29. Zhang, Y.; Li, B.; Zheng, D. Datasets of the Boundary and Area of the Tibetan Plateau. Glob. Chang. Res. Data Publ. Repos. 2014, 69, 164–168. [Google Scholar]
  30. Nie, Y.; Zhang, Y.; Ding, M.; Liu, L.; Wang, Z.; Nie, Y. Lake change and its implication in the vicinity of Mt. Qomolangma (Everest), central high Himalayas, 1970. Environ. Earth Sci. 2012, 68, 251–265. [Google Scholar] [CrossRef]
  31. Tomé, A.; Miranda, P. Piecewise linear fitting and trend changing points of climate parameters. Geophys. Res. Lett. 2004, 31, 02207. [Google Scholar] [CrossRef] [Green Version]
  32. Van, D.V.H.; Van, S.B.; De, T.R.; Hamdi, R.; Termonia, P. Modeling the scaling of short-duration precipitation extremes with temperature. Earth Space Sci. 2019, 6, 2031–2041. [Google Scholar]
  33. Phan, V.; Lindenbergh, R.; Menenti, M. Geometric dependency of Tibetan lakes on glacial runoff. Hydrol. Earth Syst. Sci. 2013, 17, 4061–4077. [Google Scholar] [CrossRef] [Green Version]
  34. Li, L.; Li, J.; Yao, X.J.; Luo, J.; Huang, Y.S.; Feng, Y.Y. Changes of the three holy lakes in recent years and quantitative analysis of the influencing factors. Quat. Int. 2014, 349, 339–345. [Google Scholar] [CrossRef]
  35. Zhang, G.; Bolch, T.; Chen, W.; Crétaux, J.-F. Comprehensive estimation of lake volume changes on the Tibetan Plateau during 1976–2019 and basin-wide glacier contribution. Sci. Total Environ. 2021, 772, 145463. [Google Scholar] [CrossRef]
  36. Qiao, B.; Zhu, L. Difference and cause analysis of water storage changes for glacier-fed and non-glacier-fed lakes on the Tibetan Plateau. Sci. Total Environ. 2019, 693, 133399. [Google Scholar] [CrossRef] [PubMed]
  37. Nie, Y.; Pritchard, H.D.; Liu, Q.; Hennig, T.; Wang, W.; Wang, X.; Liu, S.; Nepal, S.; Samyn, D.; Hewitt, K.; et al. Glacial change and hydrological implications in the Himalaya and Karakoram. Nat. Rev. Earth Environ. 2021, 2, 91–106. [Google Scholar] [CrossRef]
  38. Dong, S.; Peng, F.; You, Q.; Guo, J.; Xue, X. Lake dynamics and its relationship to climate change on the Tibetan Plateau over the last four decades. Reg. Environ. Chang. 2017, 18, 477–487. [Google Scholar] [CrossRef]
  39. Liang, B.; Qi, S.; Li, Z.Y.; Li, Y.T.; Chen, J.H. Dynamic change of lake area over the Tibetan Plateau and its response to climate change. Mt. Res. 2018, 36, 206–216, (In Chinese with English Abstract). [Google Scholar]
  40. Yao, T.D.; Li, Z.G.; Yang, W.; Guo, X.J.; Zhu, L.P.; Kang, S.C.; Wu, Y.H.; Yu, W.S. Glacial distribution and mass balance in the Yarlung Zangbo River and its influence on lakes. Chin. Sci. Bull. 2010, 55, 2072–2078. [Google Scholar] [CrossRef]
Figure 1. Map of the study area showing the spatial distribution of the lakes and the surrounding topography of the central Tibetan Plateau.
Water 13 01962 g001
Figure 2. Changes of area in Lake Yagenco (a); Lake Zhamcomaqiong (b); Lake Zhamuco (c) and Lake Gaeencuonama (d) during 1988–2017.
Water 13 01962 g002
Figure 3. Changes of the annual mean temperature and annual precipitation around the study area during 1988–2017.
Water 13 01962 g003
Table 1. RS data used to derive lake extents.
PathRowDateNameSensor SourceResolution (m)Cloud Cover (%)
137371988/9/14LT51370371988258BJC01Landsat TM301.65
137371989/9/17LT51370371989260BJC00Landsat TM3015.84
137371990/9/4LT51370371990247BJC00Landsat TM3013.44
137371991/10/9LT51370371991282BJC00Landsat TM300.75
137371992/11/12LT51370371992317BJC00Landsat TM3019.58
137371993/11/15LT51370371993319ISP00Landsat TM3011.16
137371994/10/1LT51370371994274ISP00Landsat TM305.66
137371995/9/2LT51370371995245BJC00Landsat TM3013.14
137372000/10/1LT51370372000275BJC00Landsat TM3010.59
137372001/10/12LE71370372001285SGS01Landsat ETM308.52
137372002/10/31LE71370372002304SGS01Landsat ETM305.08
137372005/10/15LT51370372005288BKT02Landsat TM309.94
137372006/12/5LT51370372006339BKT00Landsat TM308.00
137372007/9/19LT51370372007262IKR00Landsat TM300.00
137372009/10/26LT51370372009299KHC00Landsat TM3010.87
137372011/9/14LT51370372011257IKR00Landsat TM300.55
137372013/12/8LC81370372013342LGN01Landsat OLI307.57
137372014/12/11LC81370372014345LGN00Landsat OLI302.27
137372015/12/14LC81370372015348LGN00Landsat OLI301.93
137372016/11/14LC81370372016319LGN00Landsat OLI305.45
137372017/12/19LC81370372017353LGN00Landsat OLI300.60
139371988/9/28LT51390371988272BKT00Landsat TM301.53
139371989/10/1LT51390371989274BJC01Landsat TM301.99
139371992/11/10LT51390371992315ISP00Landsat TM3011.46
139371993/11/13LT51390371993317ISP00Landsat TM302.02
139371996/10/20LT51390371996294ISP00Landsat TM3017.15
139371999/11/6LE71390371999310SGS00Landsat ETM3018.62
139372000/10/7LE71390372000281SGS00Landsat ETM301.03
139372001/9/24LE71390372001267SGS01Landsat ETM301.05
139372002/12/16LE71390372002350SGS00Landsat ETM303.08
139372004/10/10LT51390372004284BJC00Landsat TM3010.73
139372005/11/14LT51390372005318BKT00Landsat TM3015.00
139372006/9/14LT51390372006257IKR00Landsat TM3020.00
139372007/10/3LT51390372007276IKR00Landsat TM300.00
139372008/10/5LT51390372008279BKT00Landsat TM302.46
139372009/11/25LT51390372009329KHC00Landsat TM3024.66
139372013/12/6LC81390372013340LGN01Landsat OLI303.68
139372014/12/9LC81390372014343LGN00Landsat OLI302.58
139372015/11/26LC81390372015330LGN01Landsat OLI302.06
139372016/9/9LC81390372016253LGN00Landsat OLI300.67
139372017/12/17LC81390372017351LGN00Landsat OLI300.37
Table 2. The Pearson’s correlation coefficients for lake-area and precipitation/temperature values.
PeriodLakeAnnual Mean TemperatureAnnual Precipitation
1988–2017Yagenco0.845 **0.226
1988–2017Zhamcomaqiong0.745 **−0.081
1988–2017Zhamuco0.0400.529 **
1988–2017Gaeencuonama0.705 **0.349 *
Notes: ** p < 0.01, * p < 0.05.
Publisher’s Note: MDPI stays neutral with regard to jurisdictional claims in published maps and institutional affiliations.

