Article

Analysis of Hydrologic Regime Changes Caused by Small Hydropower Plants in Lowland Rivers

by
Diana Šarauskienė
*,
Gintaras Adžgauskas
,
Jūratė Kriaučiūnienė
and
Darius Jakimavičius
Laboratory of Hydrology, Lithuanian Energy Institute, Breslaujos St. 3, LT–444003 Kaunas, Lithuania
*
Author to whom correspondence should be addressed.
Water 2021, 13(14), 1961; https://doi.org/10.3390/w13141961
Submission received: 8 June 2021 / Revised: 9 July 2021 / Accepted: 16 July 2021 / Published: 17 July 2021
(This article belongs to the Section Hydrology)

Abstract

:
Hydropower remains the most important and largest source of renewable energy. However, besides many additional benefits, such as dams for water supply, irrigation, flood control, recreation, navigation, etc., hydropower generation has a negative impact on the environment. This study aimed to investigate the hydrologic changes in Lithuanian lowland rivers caused by small hydropower plants (HPPs). Thirty-two indicators of hydrologic alteration (IHA) were studied in 11 rivers downstream of hydropower plants in the post-impact and pre-impact periods. The findings showed that HPPs and reservoirs considerably disturbed the primary flow of river ecosystems downstream. The largest changes in mean IHA values were found for low and high pulse characteristics (up to 57%) and the number of reversals (up to 44%). Only small or no deviations of the timing of annual extreme flows were found. The number of reversals, a low pulse count, and a fall rate were the flow characteristics that fell outside their historical ranges of variability most often. Six (out of 11) hydropower plants were identified that provoked hydrologic alterations of a moderate degree.

1. Introduction

Hydropower (or hydroelectric power) is one of the oldest sources of energy used by humans. To date, it remains the most important and largest source of renewable energy. In addition, hydropower dams are useful for water supply, irrigation, flood control, recreation, navigation, and more. Unfortunately, besides the aforementioned benefits, hydropower production also has a negative impact on the environment. Frequent and sudden changes in water level and temperature, disturbed sediment transport, and blockage of fish migration routes are just a few of the many consequences that threaten the river ecosystem after constructing a dam. The EU Member States have identified hydropower and dams as major contributors to the deterioration of the aquatic environment [1]. The use of rivers for energy production is a topic that does not lose relevance among politicians, environmental NGOs, hydropower professionals, hydrologists, ecologists, ichthyologists, and many others.
Balancing human (energy production) and environmental (suitable conditions for aquatic ecosystem communities) needs is complex and difficult. This raises awareness of the need to care for aquatic ecosystems and resources to ensure long-term economic viability [2,3,4]. Naturally variable flows create and maintain the dynamics of in-channel and floodplain conditions and habitats essential to aquatic and riparian species [5]. River flow is regarded as the fundamental process determining the size, shape, structure, and dynamics of riverine ecosystems [6]. The influence of artificial flow regulation has attracted worldwide attention from the research community. To represent biologically relevant streamflow attributes, Olden and Poff [7] examined a total of 171 hydrologic indices, analyzed in 13 published papers, trying to find out how many indices are necessary to characterize flow regimes adequately. Poff and Zimmerman [8] reviewed 165 papers on ecological responses to altered flow regimes. Most of the studies included in their review investigated changes of flow magnitude; however, studies on changes of other important components of the natural flow regime, including frequency, duration, timing, and rate-of-change, were identified as well.
The total installed capacity of hydropower plants in Lithuania is 128 MW. According to the International Hydropower Association [9], Lithuania ranks 29th among 43 European countries in terms of this capacity. Although Lithuania belongs to the humid climate zone and is rich in rivers and lakes, it is a lowland country, not very favorable for hydropower development. Lithuanian rivers are mostly used to build dams and generate electricity in small hydropower plants (HPP). It is considered [10] that these hydropower plants (HPPs) do not significantly alter the hydrological regime of a river and, therefore, have a lower environmental impact than larger HPPs. Even though some researchers have stated that a large untapped potential of small hydropower remains [10], most available studies devoted to the impact of HPP on the hydrologic regime and certain components of the impounded river ecosystem are not in favor of such optimism. Ždankus et al. [11] showed that the operation of HPP turbines is subject to frequent and sudden fluctuations in river flow and depth. Punys et al. [12] examined deviations of the hydrologic regime and identified downstream river flow (stage) ramping. Gailiušis et al. [13] discussed HPP impact on the flow regime of the impounded rivers and proved that the environmental flow, set by the law, is the reason for the considerably transformed frequency of minimum flows. There have been studies [14,15] demonstrating that dams changed the regimes of suspended solids, fine particles, and nutrients, as well as the composition of macroinvertebrates. The results obtained by Virbickas et al. [16] revealed that hydrologic changes caused by the low-head HPPs might have a significant impact on fish habitats in the lowland rivers of Lithuania and presented the ecological effectiveness of calculated environmental flow.
However, so far, previous studies have mainly focused on some particular aspects of the impact and/or specific indices of flow changes due to the operation of small hydropower plants; besides, none of the analyses performed were based on flow observation data before and after the installation of HPP in the river. The authors of the present study intended to contribute to a deeper understanding of the changes in the key components of the natural flow regime by quantifying the dam-induced changes.
The method of the Indicators of Hydrologic Alteration (IHA, proposed by Richter et al. [17]) chosen in the present study is based on the natural flow paradigm. The IHA tool covers the full range of natural intra- and inter-annual variation of hydrologic regimes and associated characteristics of timing, duration, frequency, and rate of change critical to sustaining the full native biodiversity and the integrity of aquatic ecosystems [5]. This method has gained wide international recognition in the scientific community. In its native U.S., the IHA method was applied to quantify the hydrologic alteration of the rivers following impoundments [18,19], to set [20] and restore [21] environmental flow. In China, which is the leader among hydroelectricity producers, based on the IHA application, a broad analysis of environmental effects of HPP dams was made [22,23], and a multi-objective reservoir optimization model incorporating ecological adaption was proposed [24]. The same methodology was used for similar purposes in Brazil [25,26,27], Sudan [28], India [29], Vietnam [30], etc. In Europe as well, flow estimates using IHA were employed for a variety of water management purposes. The flow alteration in the selected catchments was described by the IHA in the studies of Bizzi et al. [31], De Girolamo et al. [32], Stefanidis et al. [33], Halleraker et al. [34], and Gierszewski et al. [35]. In three catchments from three European ecoregions (Central Plains, Central Highlands, and Alpine), climate change impacts on ecologically relevant hydrological indicators were investigated by Kiesel et al. [36]. Flow regime projections, using the IHA, were made for the whole of Europe by Schneider et al. [37]. However, no European studies have been identified that provide a country-wide assessment on the hydrologic regime of the lowland rivers modified by hydropower plants.
The article aimed to evaluate the potential impact of HPP dams on the flow of lowland rivers in Lithuania by comparing the pre- and post-impact flow regimes using a set of 32 hydrologic parameters of the IHA software.

2. Materials and Methods

2.1. Data

The study was dedicated to Lithuanian rivers modified by the development of hydropower plants. Lithuania is a country (of over 65,000 sq. km) in the south-eastern part of the Baltic Sea region. All 22,000 local and transboundary Lithuanian rivers and streams belong to the category of lowland rivers due to the low height of their catchments (215 m above sea level). According to the Köppen-Geiger climate classification system, this country belongs to a humid continental climate. It falls within the excess water zone because the annual precipitation to evaporation ratio is 1.47. The macroclimatic conditions of the area are almost the same [38].
Today, the total installed capacity of hydroelectric power plants is 128 MW; 101 MW belongs to the large Kaunas Hydropower Plant, and the remaining part (27 MW) belongs to 99 small hydropower plants, which in total make up about 0.5–0.7% of the total electric energy demand for the national economy.
Eleven small hydropower plants (HPPs), i.e., about 10% of all small HPPs operating in the country, were selected to analyze changes in the hydrologic regime in downstream river reaches (Figure 1). The selected HPPs are distributed throughout the territory of Lithuania. These HPPs met the length-of-record criteria, as recommended by the developers of the software Indicators of Hydrologic Alteration [39], which was applied in this study.
The characteristics of HPPs and water gauging stations (WGS) are presented in Table 1 and Table 2. The length of the data series was chosen based on the year of construction of the hydropower plant. First, the post-impact period, which began in the construction year and ended in 2018 (i.e., latest available observation data), was selected. The period of the same duration before the construction of the HPP was then chosen and used as the pre-impact period. The studied HPPs were installed in 1999–2005. Thus, the analyzed periods ranged from 14 to 20 years (17 years on average). The daily flow data were taken from the hydrologic yearbooks of the Lithuanian Hydrometeorological Service [40].

2.2. Methods

An easy-to-use open-access tool, called the Indicators of Hydrologic Alteration (IHA) and proposed by Richter et al. in 1996 [17], was used to calculate the characteristics of natural and altered hydrologic regimes. The IHA method estimates 33 ecologically relevant, yet sensitive to human influences, statistics divided into five major groups (Table 3; [39]).
In the first step of the research, using daily discharge data, the IHA software was applied to calculate the annual means of all analyzed flow characteristics and then evaluate the deviation between the modified and natural regime values. The deviation factor (in %) of each IHA parameter was calculated using the following equation:
F i = M p o s t M p r e M p r e × 100 %
where Mpost indicates IHA mean value in the post-impact period, and Mpre is the pre-impact mean value. A positive sign shows an increase, while a negative sign shows a decrease in the post-impact IHA mean value.
In the second step, the Range of Variability Approach (RVA) [39,41] was applied to compare the variation in the IHA parameters before and after the installation of HPP on the river. The RVA uses the pre-development natural variation of IHA parameter values as a reference to define the extent to which natural flow regimes have been altered. Richter et al. [41] suggest that water managers should strive to keep the distribution of annual values of the IHA parameters as close to the pre-impact distributions as possible. In this study, the suggested RVA target range of ±1 standard deviation from the mean was selected. A measure of hydrologic alteration is the degree to which the RVA target range is not attained [42]. This measure of hydrologic alteration expressed as a percentage can be calculated as:
D i = N o b s N e x p N e x p × 100 %   ,
wherein Nobs is the count of years in which the observed value of the hydrologic parameter fell within the targeted range; Nexp is the count of years for which the value is expected to fall within the targeted range. Hydrologic alteration is zero when the observed frequency of post-development annual values falling within the RVA target range equals the expected frequency. A positive deviation indicates that the annual values fell inside the RVA target window more often than expected; negative values indicate that the annual values fell within the target window less often than expected. The absolute value of the hydrologic alteration degree (0–100%) can be divided into three categories: less than 33% represents little or no alteration; 33–67% represents moderate alteration; more than 67% represents high alteration.
To estimate the overall degree of hydrologic alteration regarding both the maximum and mean values of degree of alteration for each group of IHA, Xue et al. [22] have proposed the following equation:
D = D m a x     2 + D m 2 2
where Dmax and Dm are the maximum and mean values of degree of alteration for each group of indicators. The overall degree of hydrologic alteration is suggested to be classified into five groups: slight alteration (<20%), low alteration (20–40%), moderate alteration (40–60%), high alteration (60–80%), and severe alteration (>80%).
To define the relationships between the degree of established hydrologic alterations (predictands) and characteristics of HPP and reservoir (predictors: reservoir area, reservoir volume, dam head, installed power, etc.), the calculations were performed in two steps. In the first step, the correlation coefficients between all variables of both groups were calculated. In the second step, only those hydrologic variables that significantly correlated with specific HPP characteristics were selected. In this study, given the length of the data series, the following recommendations (by [43]) were used: shorter data series can be used for correlation analysis, but a higher correlation coefficient is required to establish a significant relationship between parameters. Thus, we determined that the correlation coefficient should reach or exceed 0.7. Furthermore, a multiple regression analysis was used to determine the relationships between the selected groups of parameters.

3. Results

3.1. Results of IHA Analysis

Initially, before the detailed investigation of hydrological regime variables using the IHA method, a statistical significance (at p < 0.05) of the average, maximum and minimum discharges of the pre- and post-impact periods (Table 2) was tested using a t-test. No statistically significant changes in the average discharges were identified. This confirms that the small HPP reservoirs, which were studied, are mostly daily regulated and do not considerably affect average annual flows. Conversely, the t-test results of extreme (minimum and maximum) flows in some rivers downstream of the dams showed significant changes, indicating substantial dam-induced modifications. The maximum flows changed significantly in the five studied river stretches, while the minimum flows changed significantly in the four stretches.

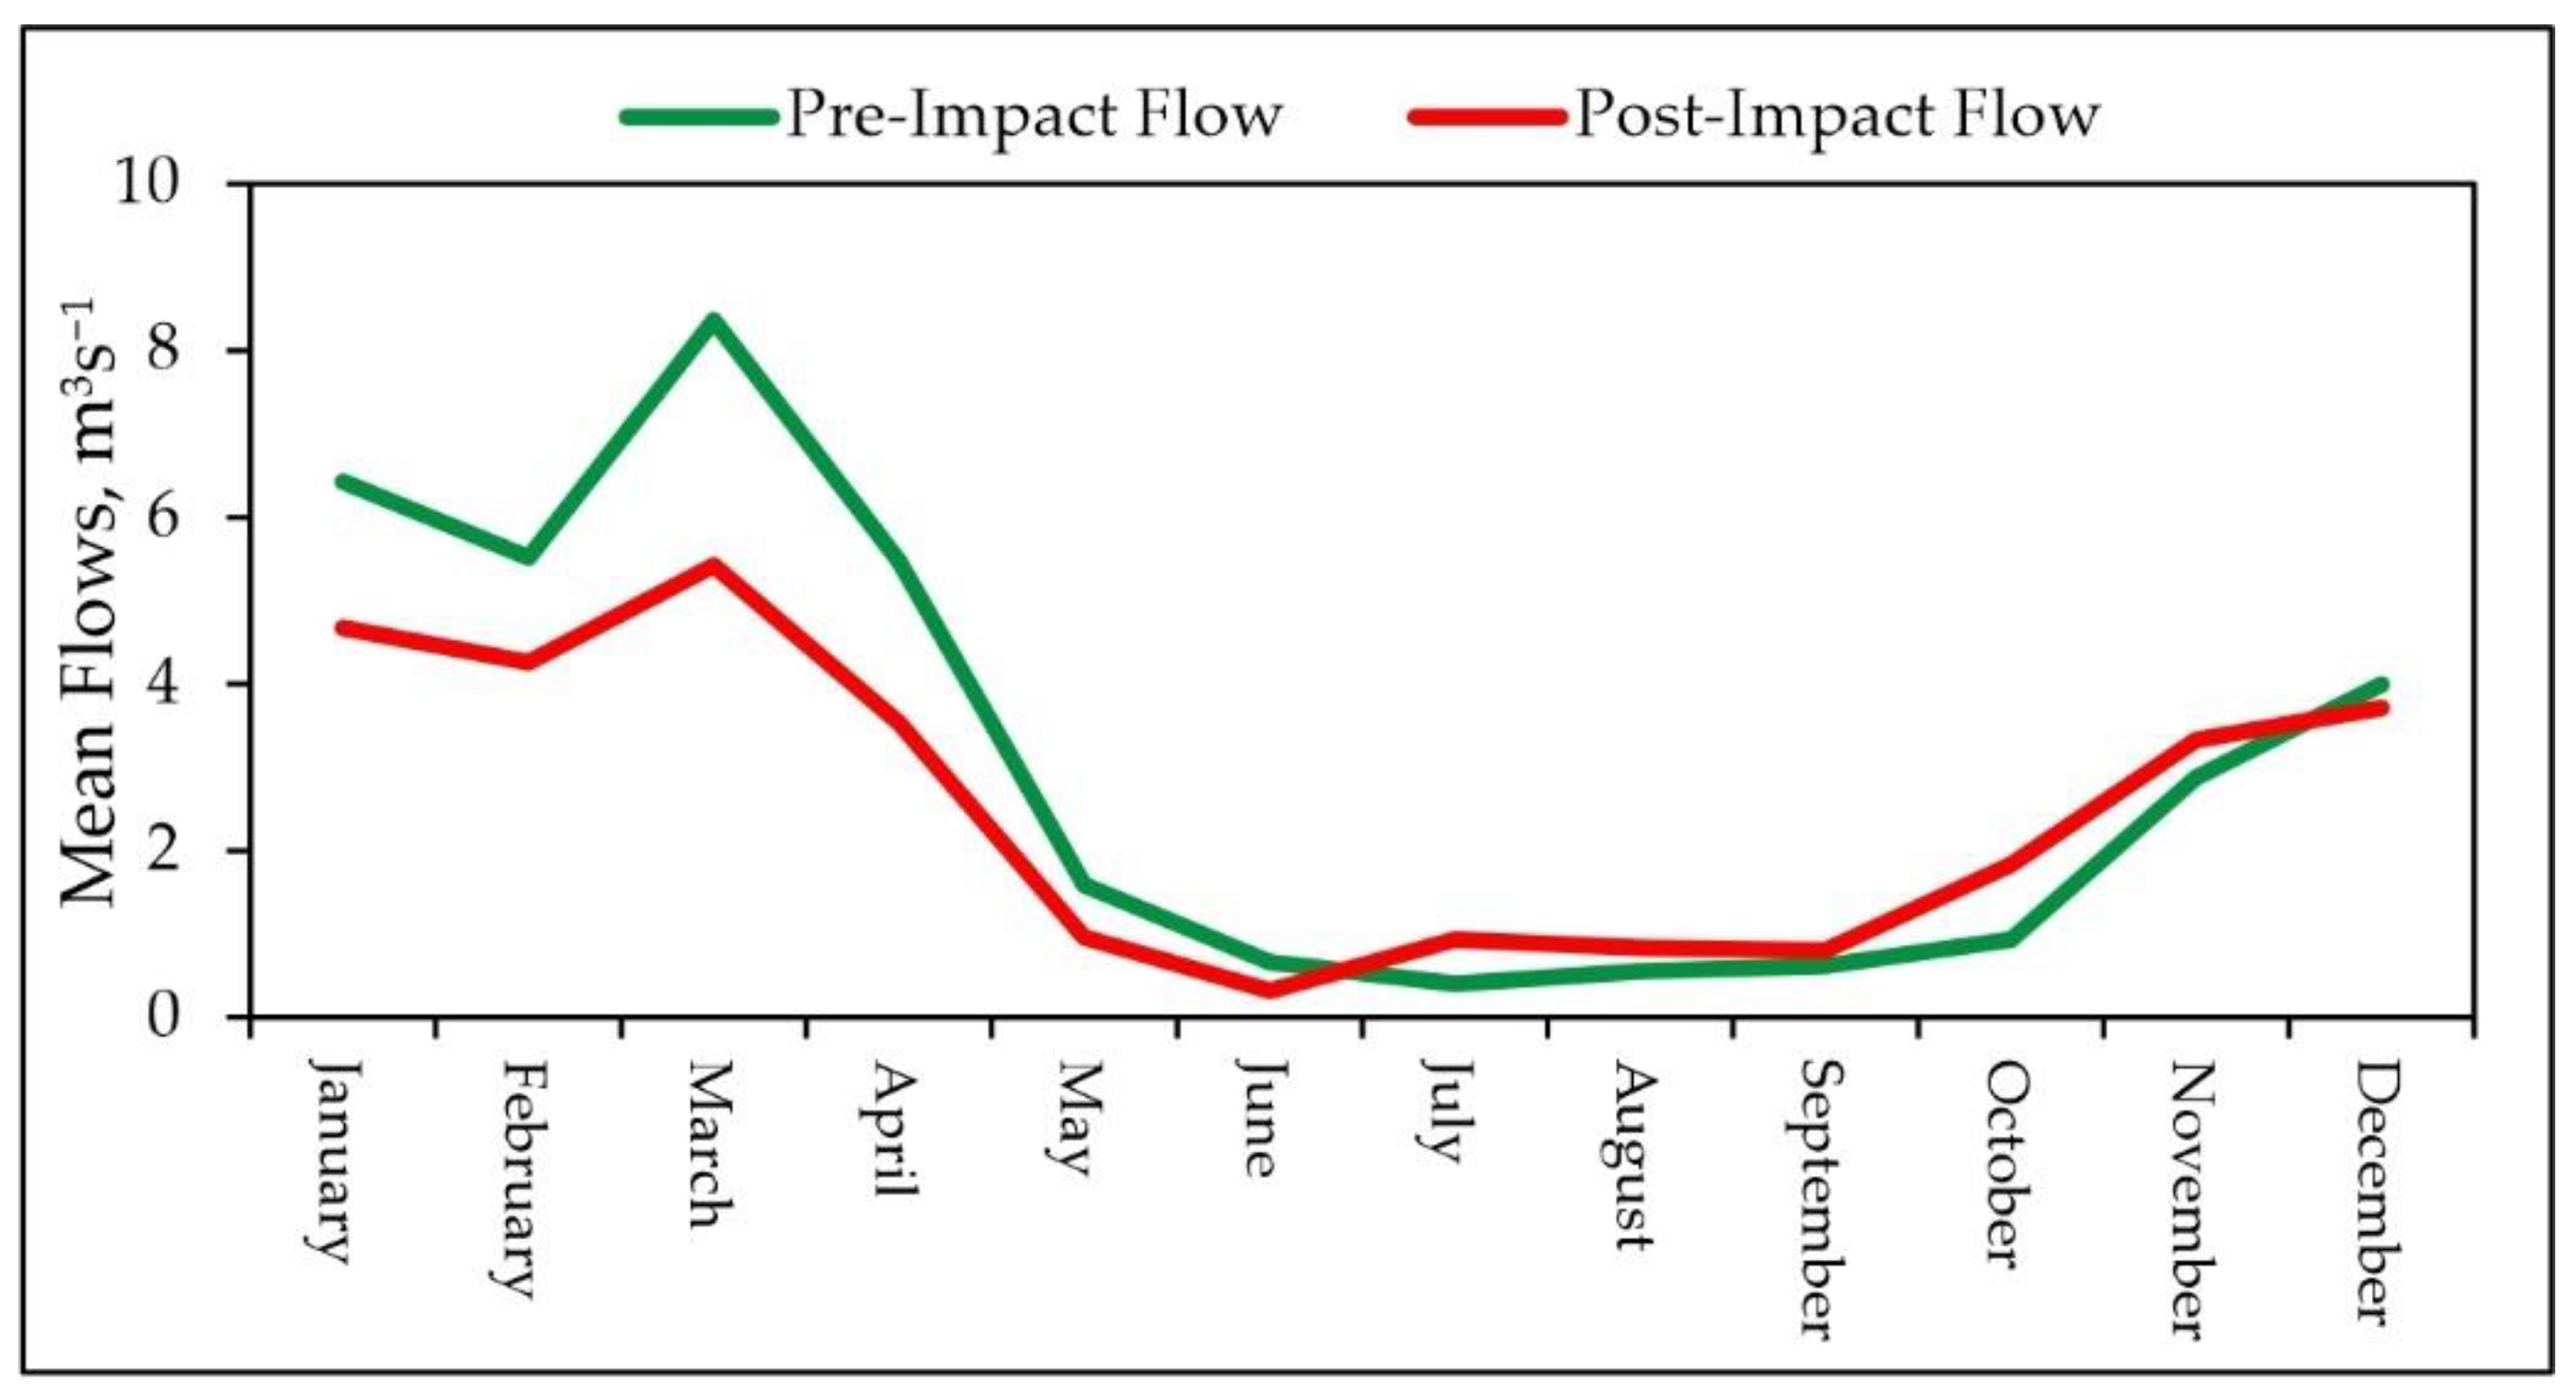
3.1.1. Magnitude of Monthly Flow Regime

The first group of results obtained using the IHA software program was deviations from the mean values of each monthly flow. In the studied rivers, the operation of HPPs caused changes of negative and positive signs of different magnitudes (Table A1). At only four WGSs, all changes between the post-impact and pre-impact monthly means were less than 33%, i.e., little or no change was estimated. At the remaining stations, considerable deviations of more than 33% were recorded for a minimum of two months or a maximum of 7 months per year. The largest mean decrease (−35%) was found for the June flow, and the largest mean increase was found for the August flow (30%) (Table 4). On average (considering absolute values of the changes), the smallest changes occurred in January and the largest in June. In general, there were more negative values of the analyzed parameters at the top of the table (January–June) and more positive deviation values at the bottom of the table (July–December). The greatest effect at monthly scales was mainly concentrated in April–August.
The most significant average monthly flow changes were estimated in the Mituva and Šušvė rivers downstream of the HPPs, 45.4% and 30%, respectively. Records of the most affected WGS (Mituva-Žindaičiai) show (Table A1) that by the early summer, the post-impact flows are generally lower than natural (before impact) flows, whereas in July–November, the artificially modified flows become higher than in the pre-impact period (Figure 2). Due to the Girdžiai HPP operation, the post-impact flows were distinguished by significantly smaller values from January to June, while from July to October, the changes of alarming magnitude were of the opposite direction, in which the flow reached high (96% in October) and even critical (132% in July) values.

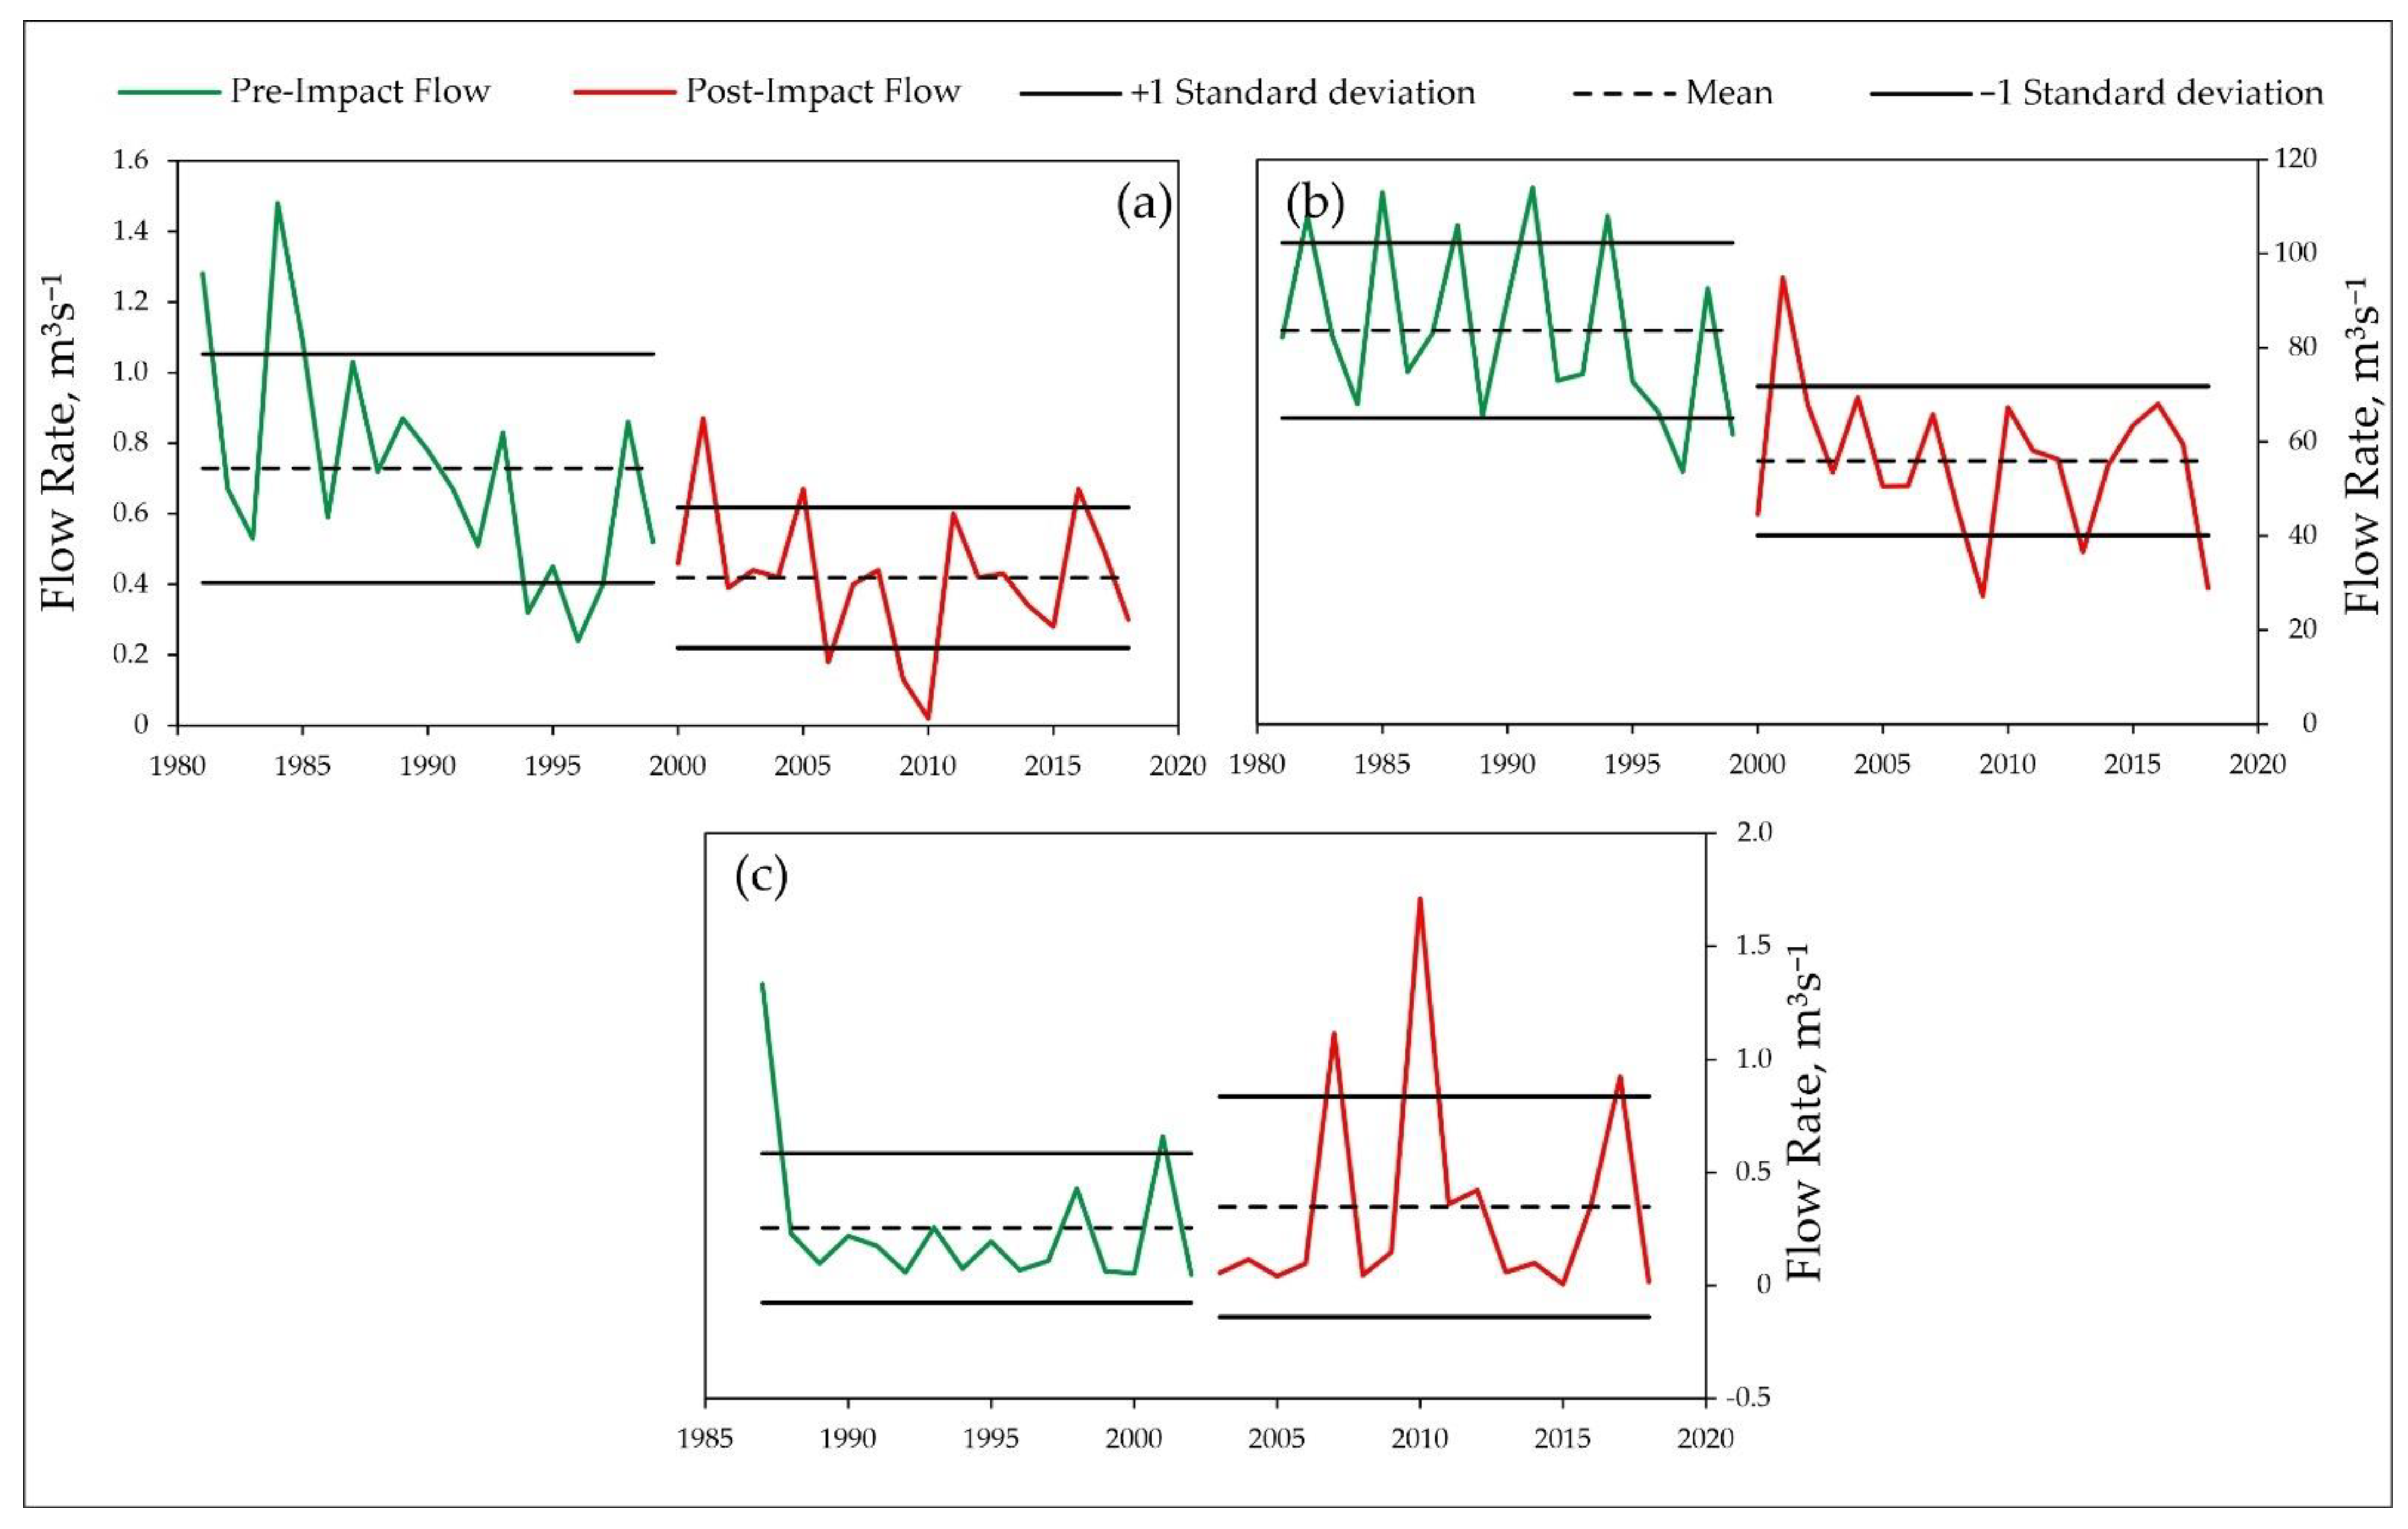
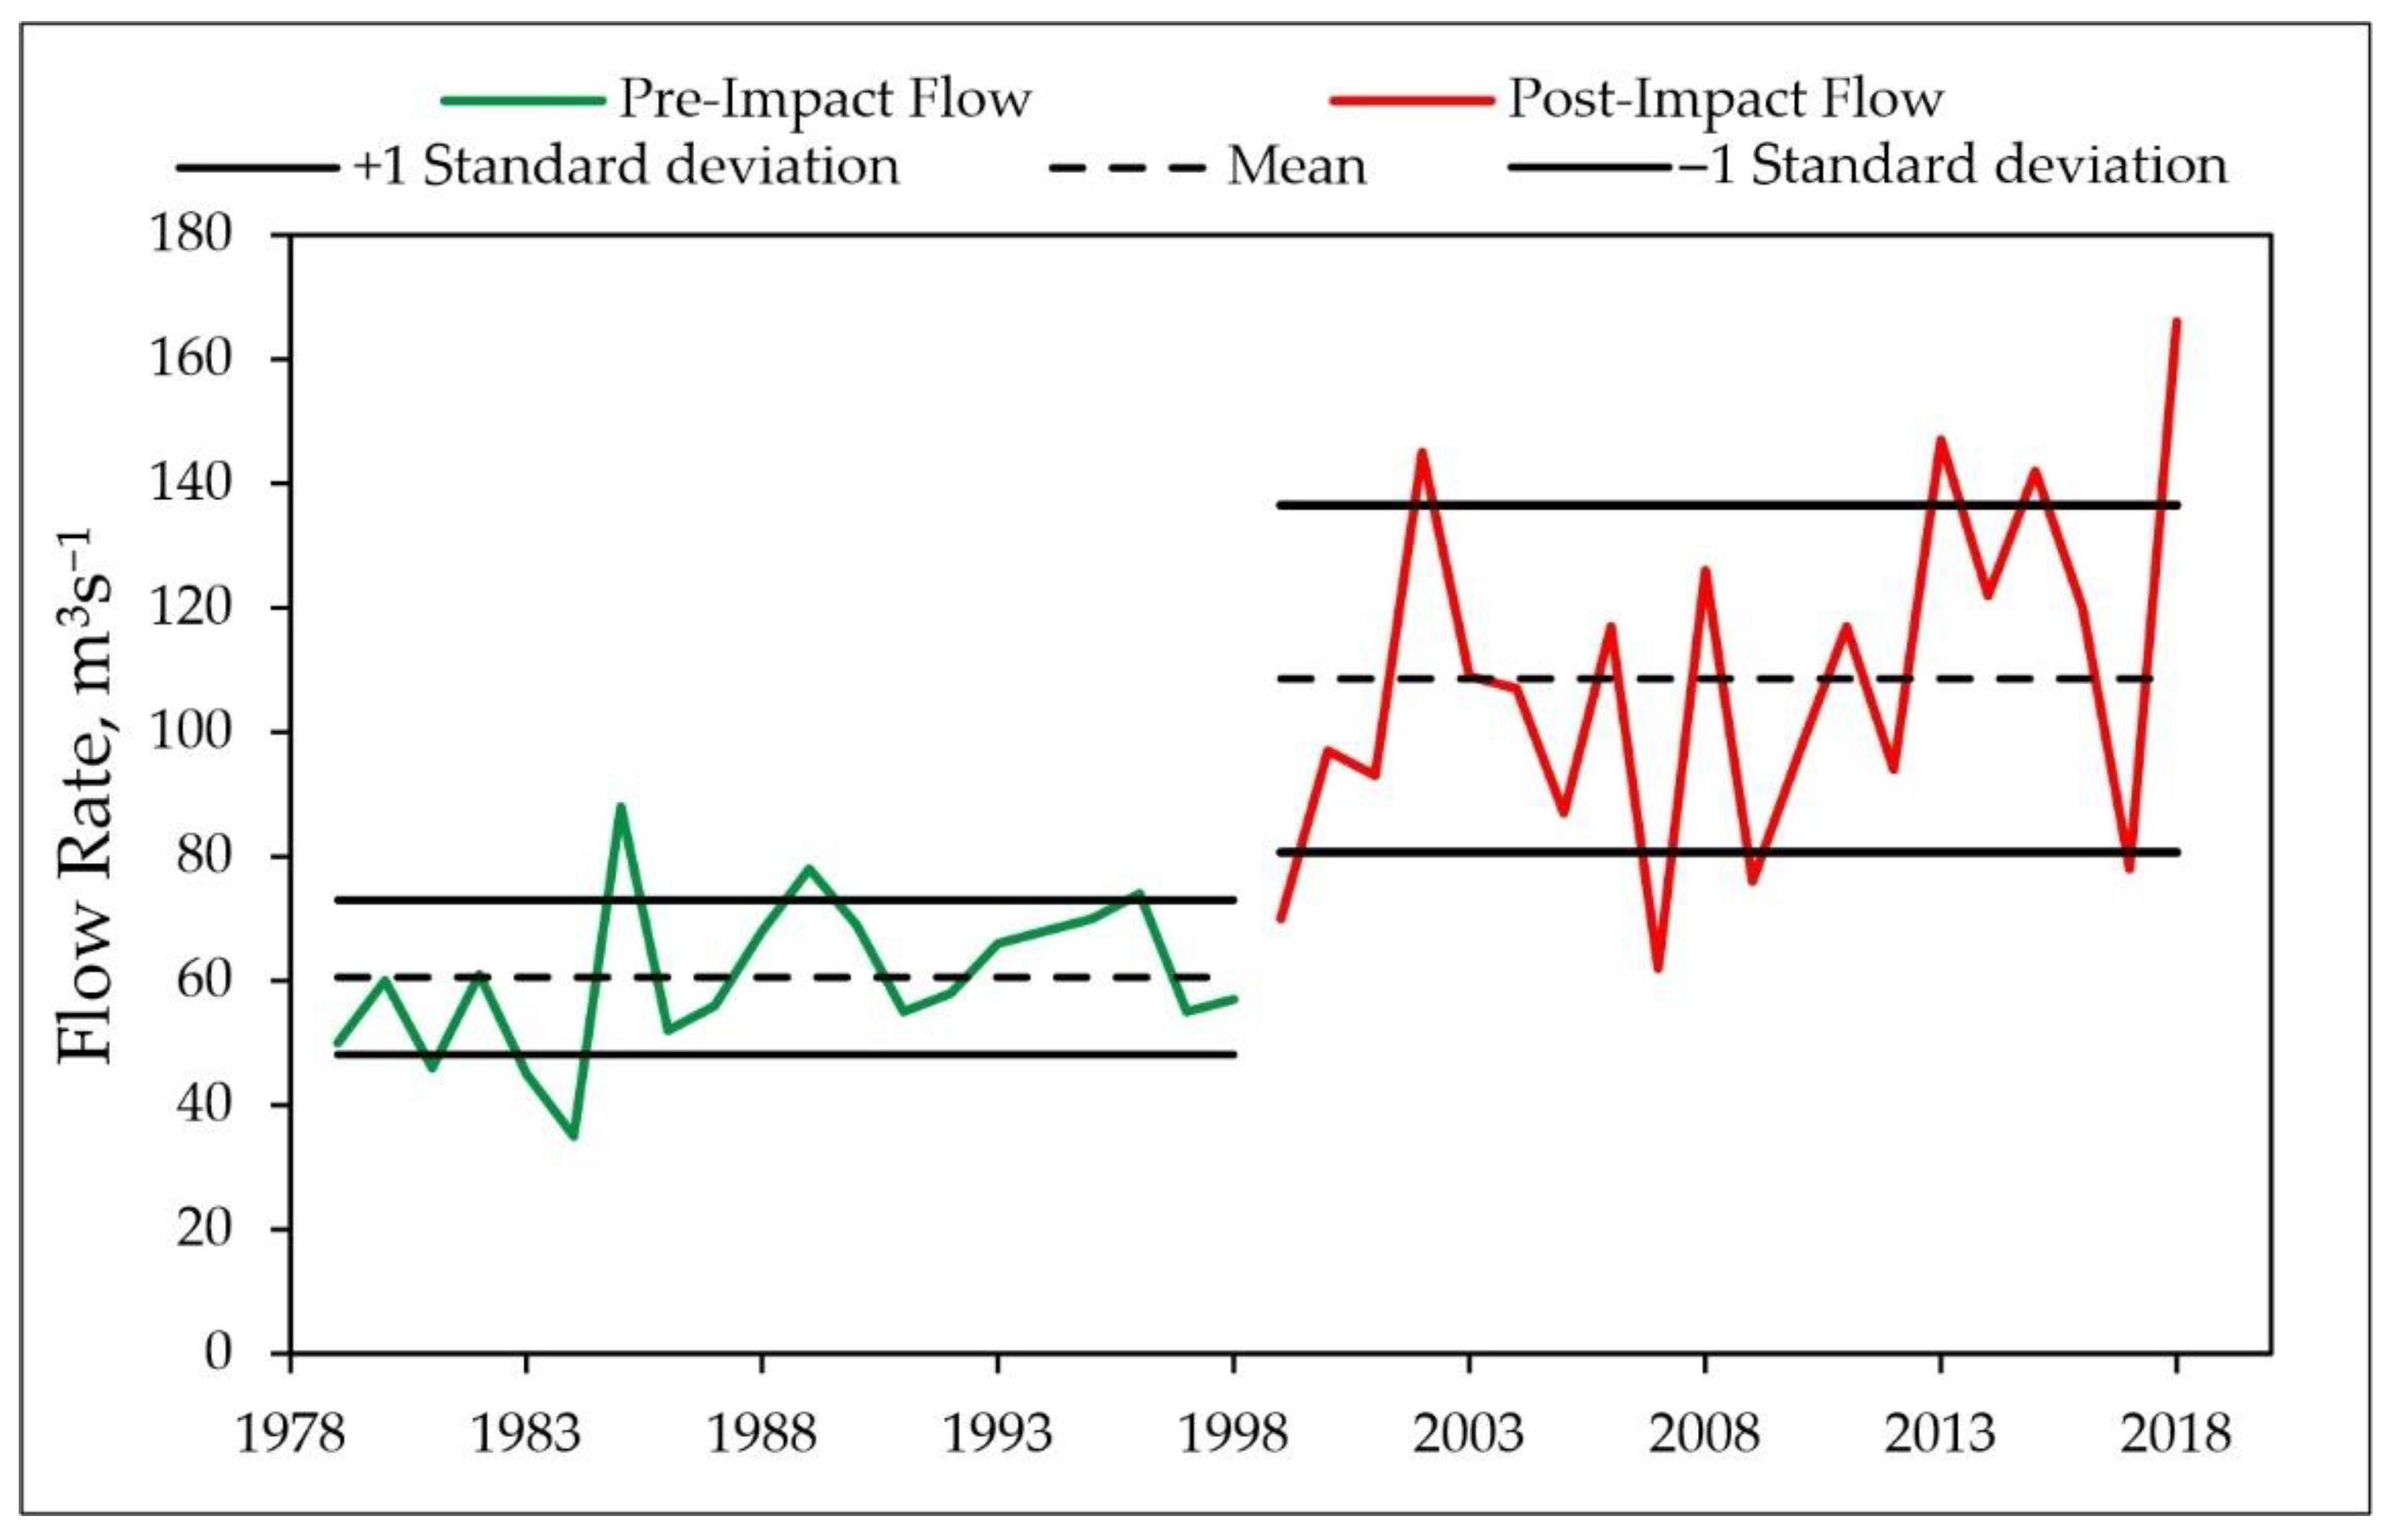
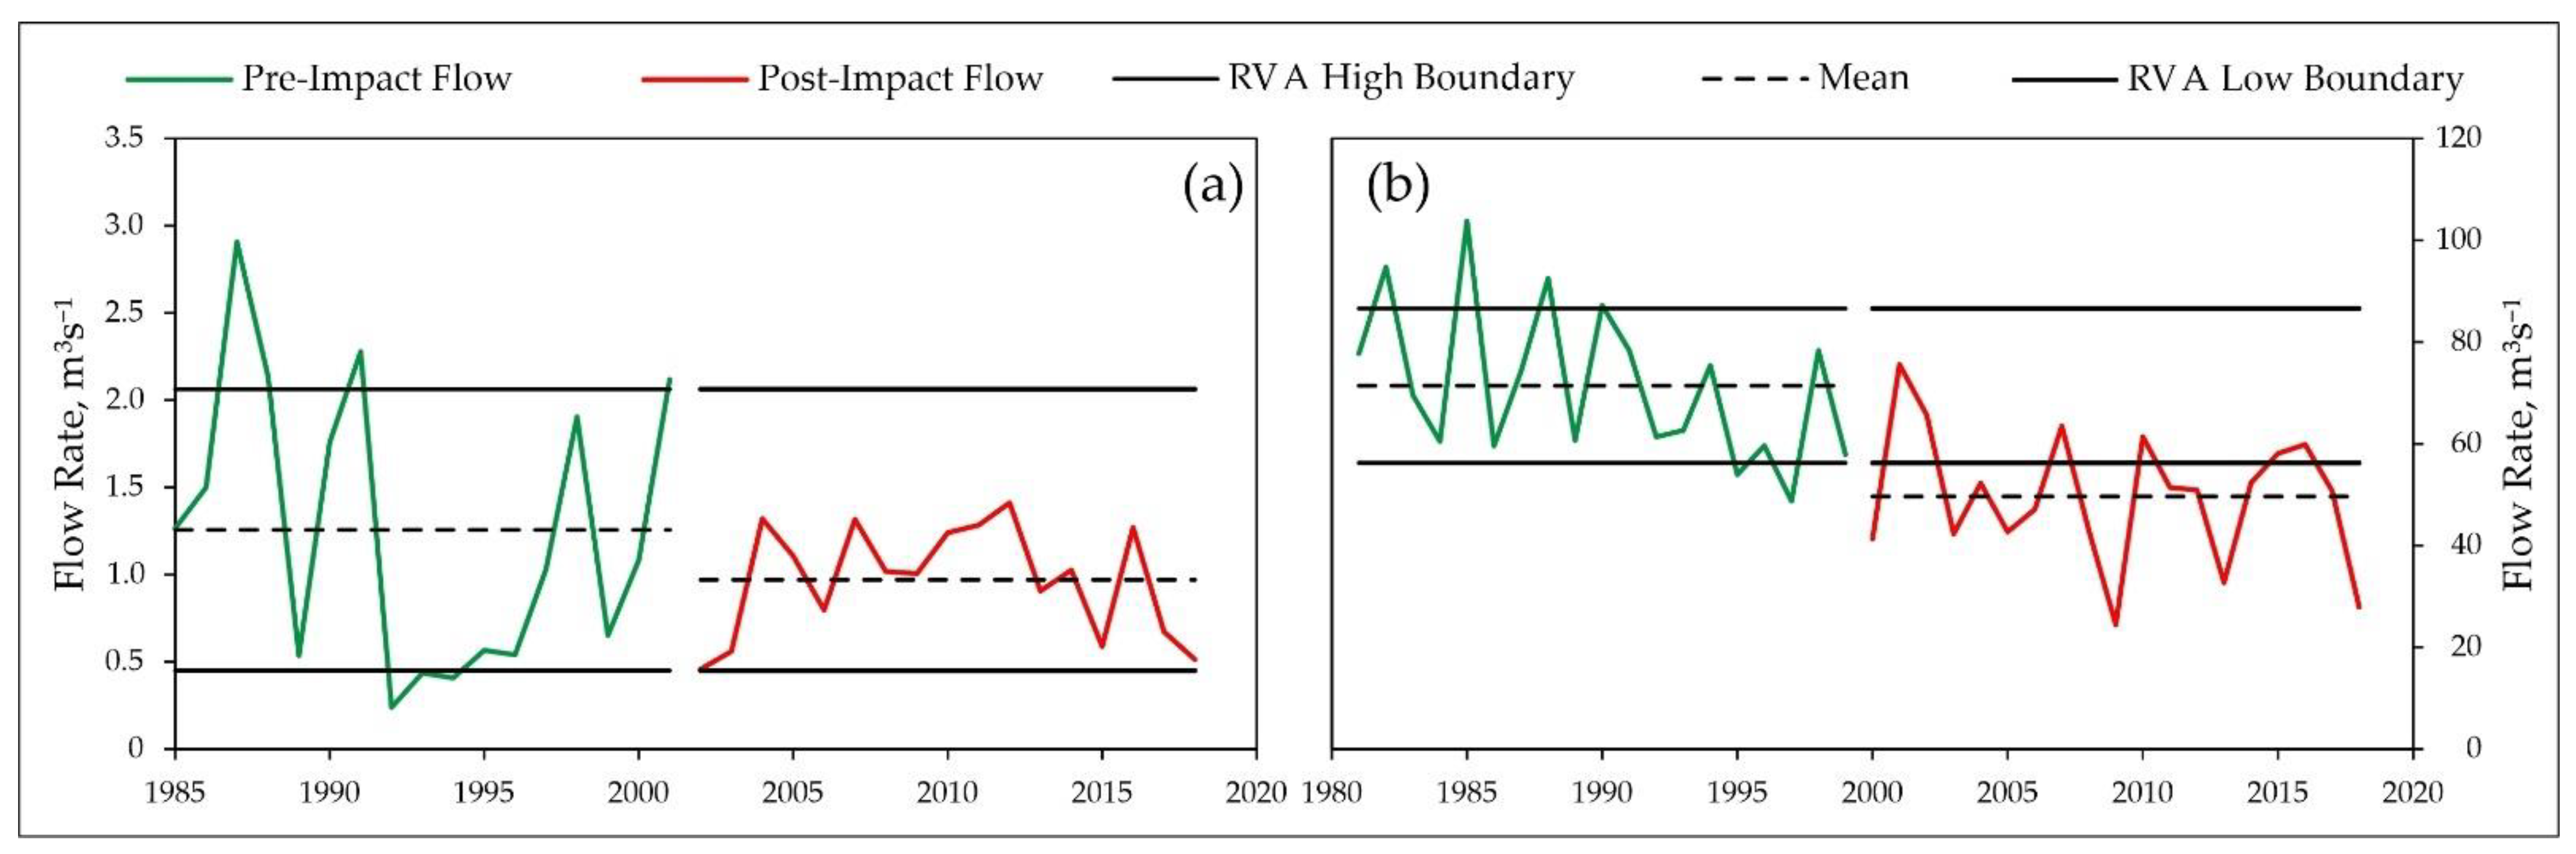
3.1.2. Magnitude and Duration of Annual Extreme Flow Conditions

Table A1 provides the results of obtained changes in magnitude and duration of annual extreme flows (group 2 of IHA parameters) downstream of HPPs. The studied WGS data demonstrated a high annual extreme minimum flow variation, with an average change of 17% (absolute values). However, generalizing tendencies of these parameters is complicated. In some impacted rivers, they substantially decreased, while in others, their values slightly increased or had mixed tendencies. Most of the estimated deviations had a negative trend. The average of the negative deviations in the minimum flows was 20.6%, while the positive changes were 9.6% (Table 5). The 1-day minimum flow changed the most, by 22% on average, and in most cases, they were negative deviations. The analysis revealed that, in contrast, the post-impact maximum flows of different duration diminished in all studied rivers. The most substantial changes occurred in the case of the 1-, 3-, 7-day maximum flows. These parameters were reduced by more than 20% on average. In general, the shorter duration extreme events tended to be modified more considerably. The response of the base flow index (i.e., the 7-day minimum flow/mean flow per year) to HPP operation varied in magnitude and sign.
It was obvious (Table A1) that the extreme flow conditions in the Bartuva River were most significantly affected by HPP operation (Figure 3a,b). In this river, all parameters indicating extreme flow conditions were reduced by 26.5% on average, in some cases as much as −42.5% (1-day minimum) or −37% (3-day minimum). Considerable changes (especially in the case of extreme minimum flows) were also recorded at Jūra-Tauragė, Mūša-Ustukiai, and Venta-Papilė WGSs. The Mituva River was distinguished for an increased 90-day minimum value, reaching 37% (Figure 3c). For the Šventoji and Verknė rivers, all extreme minimum flows increased slightly.

3.1.3. Timing of Annual Extreme Flows

In the post-impact period, the date of 1-day minimum flows was shifted from −25 to 43 days (16 days on average), while the date of maximum flows was shifted from −66 to 21 days (18 days on average) (Table 6). The timing of minimum flow was advanced at six WGSs and delayed at five WGSs. More often (eight cases out of 11), the maximum flow values were observed earlier (by 21 days on average) than pre-impact.
Due to the regulation, the largest deviation of the mean timing of extreme flows was recorded at Šušvė-Josvainiai WGS, where the 1-day minimum flow was delayed by an average of 43 days, while the 1-day maximum flow occurred 66 days (equivalent to a two-month duration) earlier on average. Only slight changes in this parameter group were observed at Venta-Leckava and Verknė-Verbyliškės WGSs. In general, the observed changes were moderate: the date of minimum shifted by 9% and the date of maximum by 10% (in absolute values). The timing of annual extreme flows is likely to be a quite random variable that depends on the human (HPP manager or the owner) need to produce energy at a particular time rather than on the operation of the HPP itself.

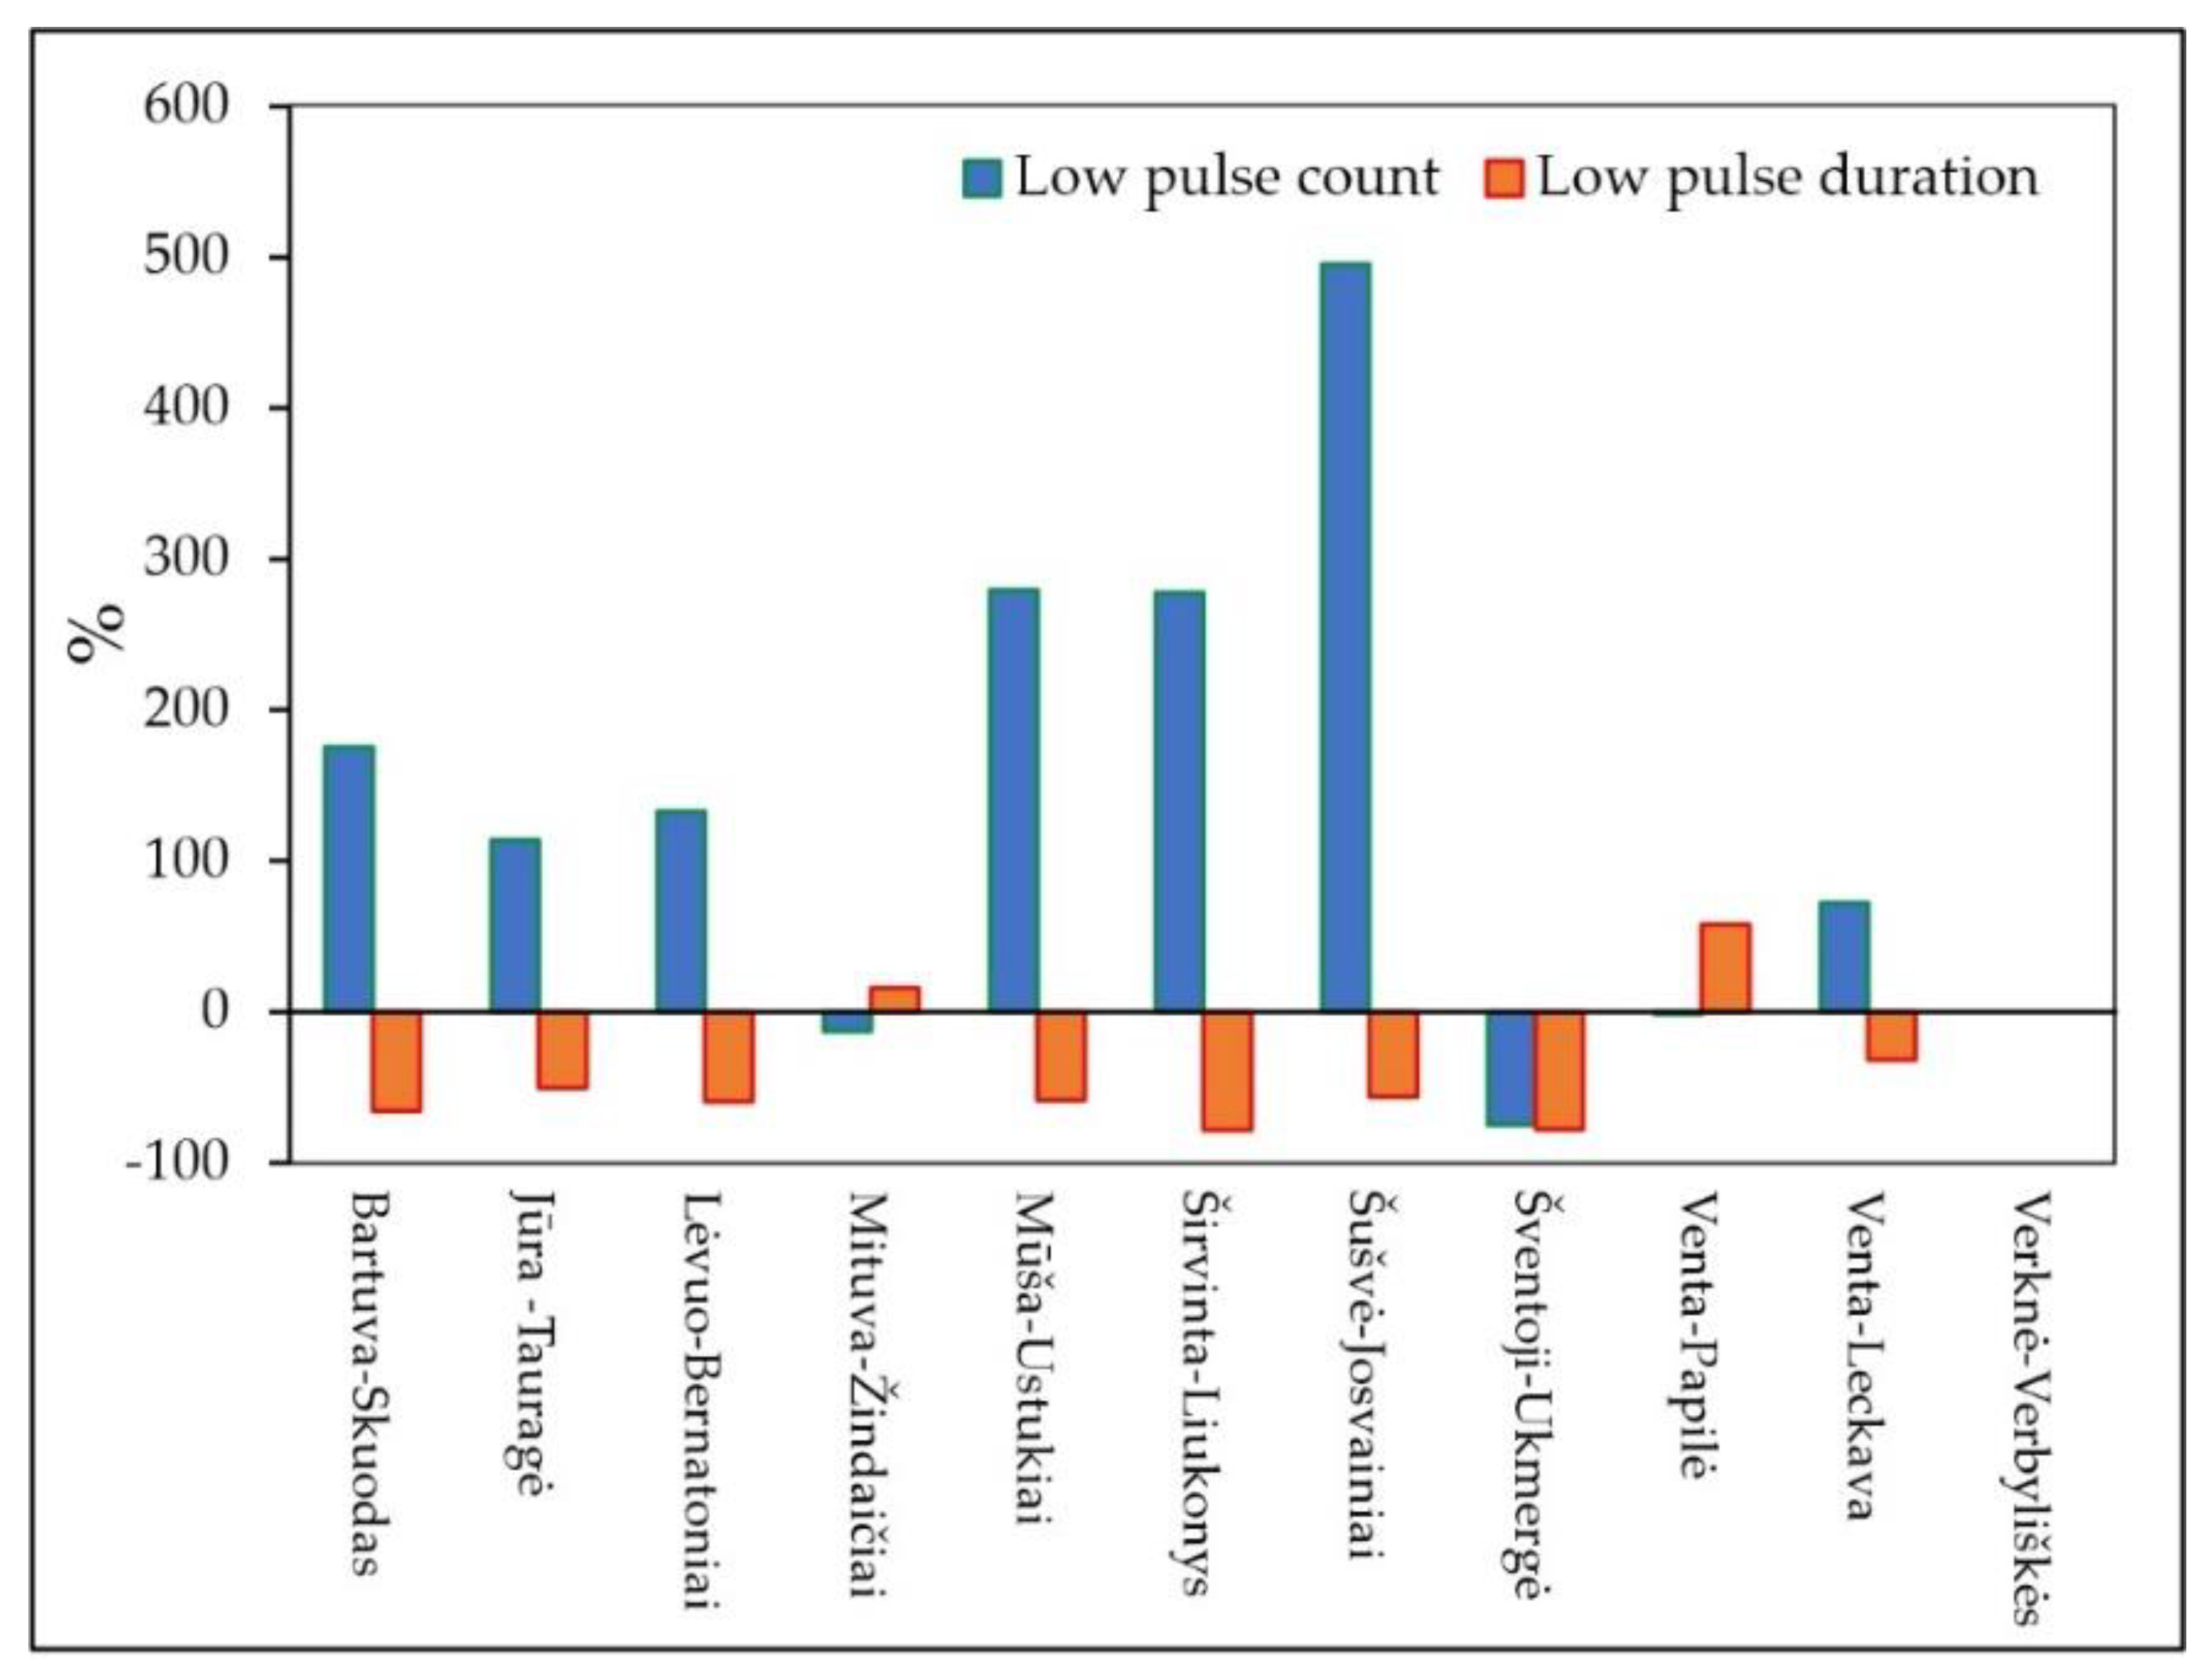
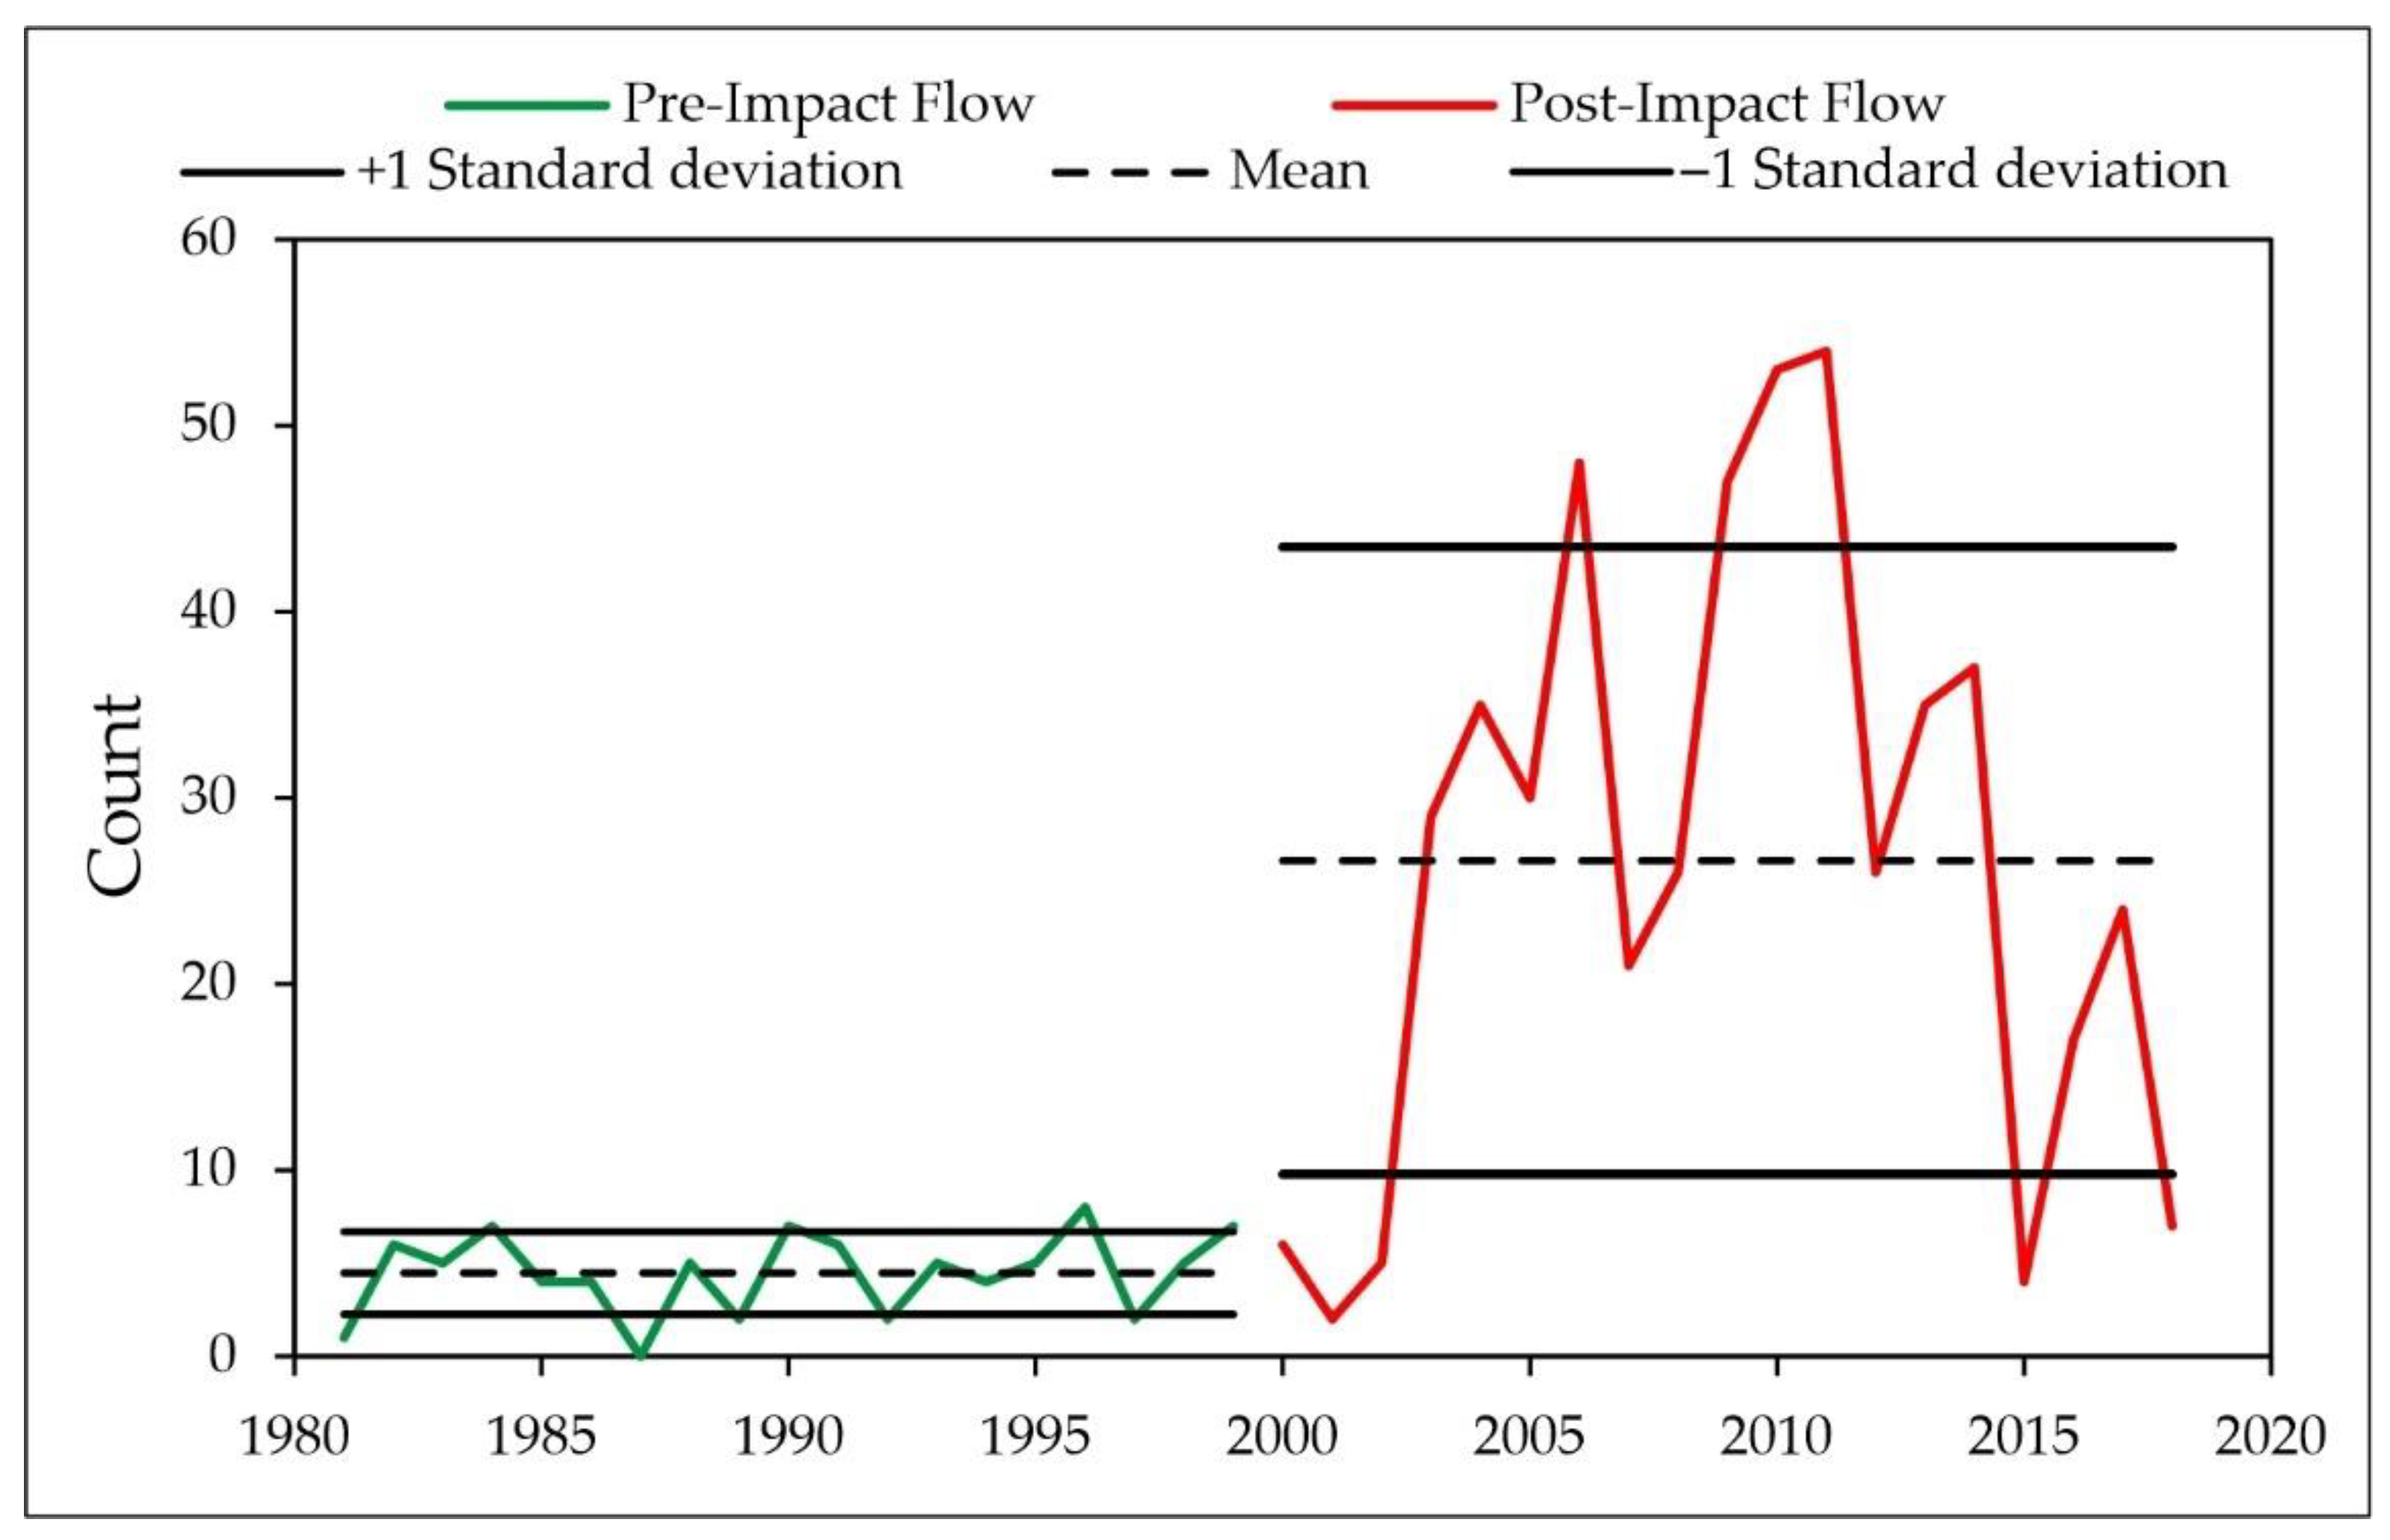
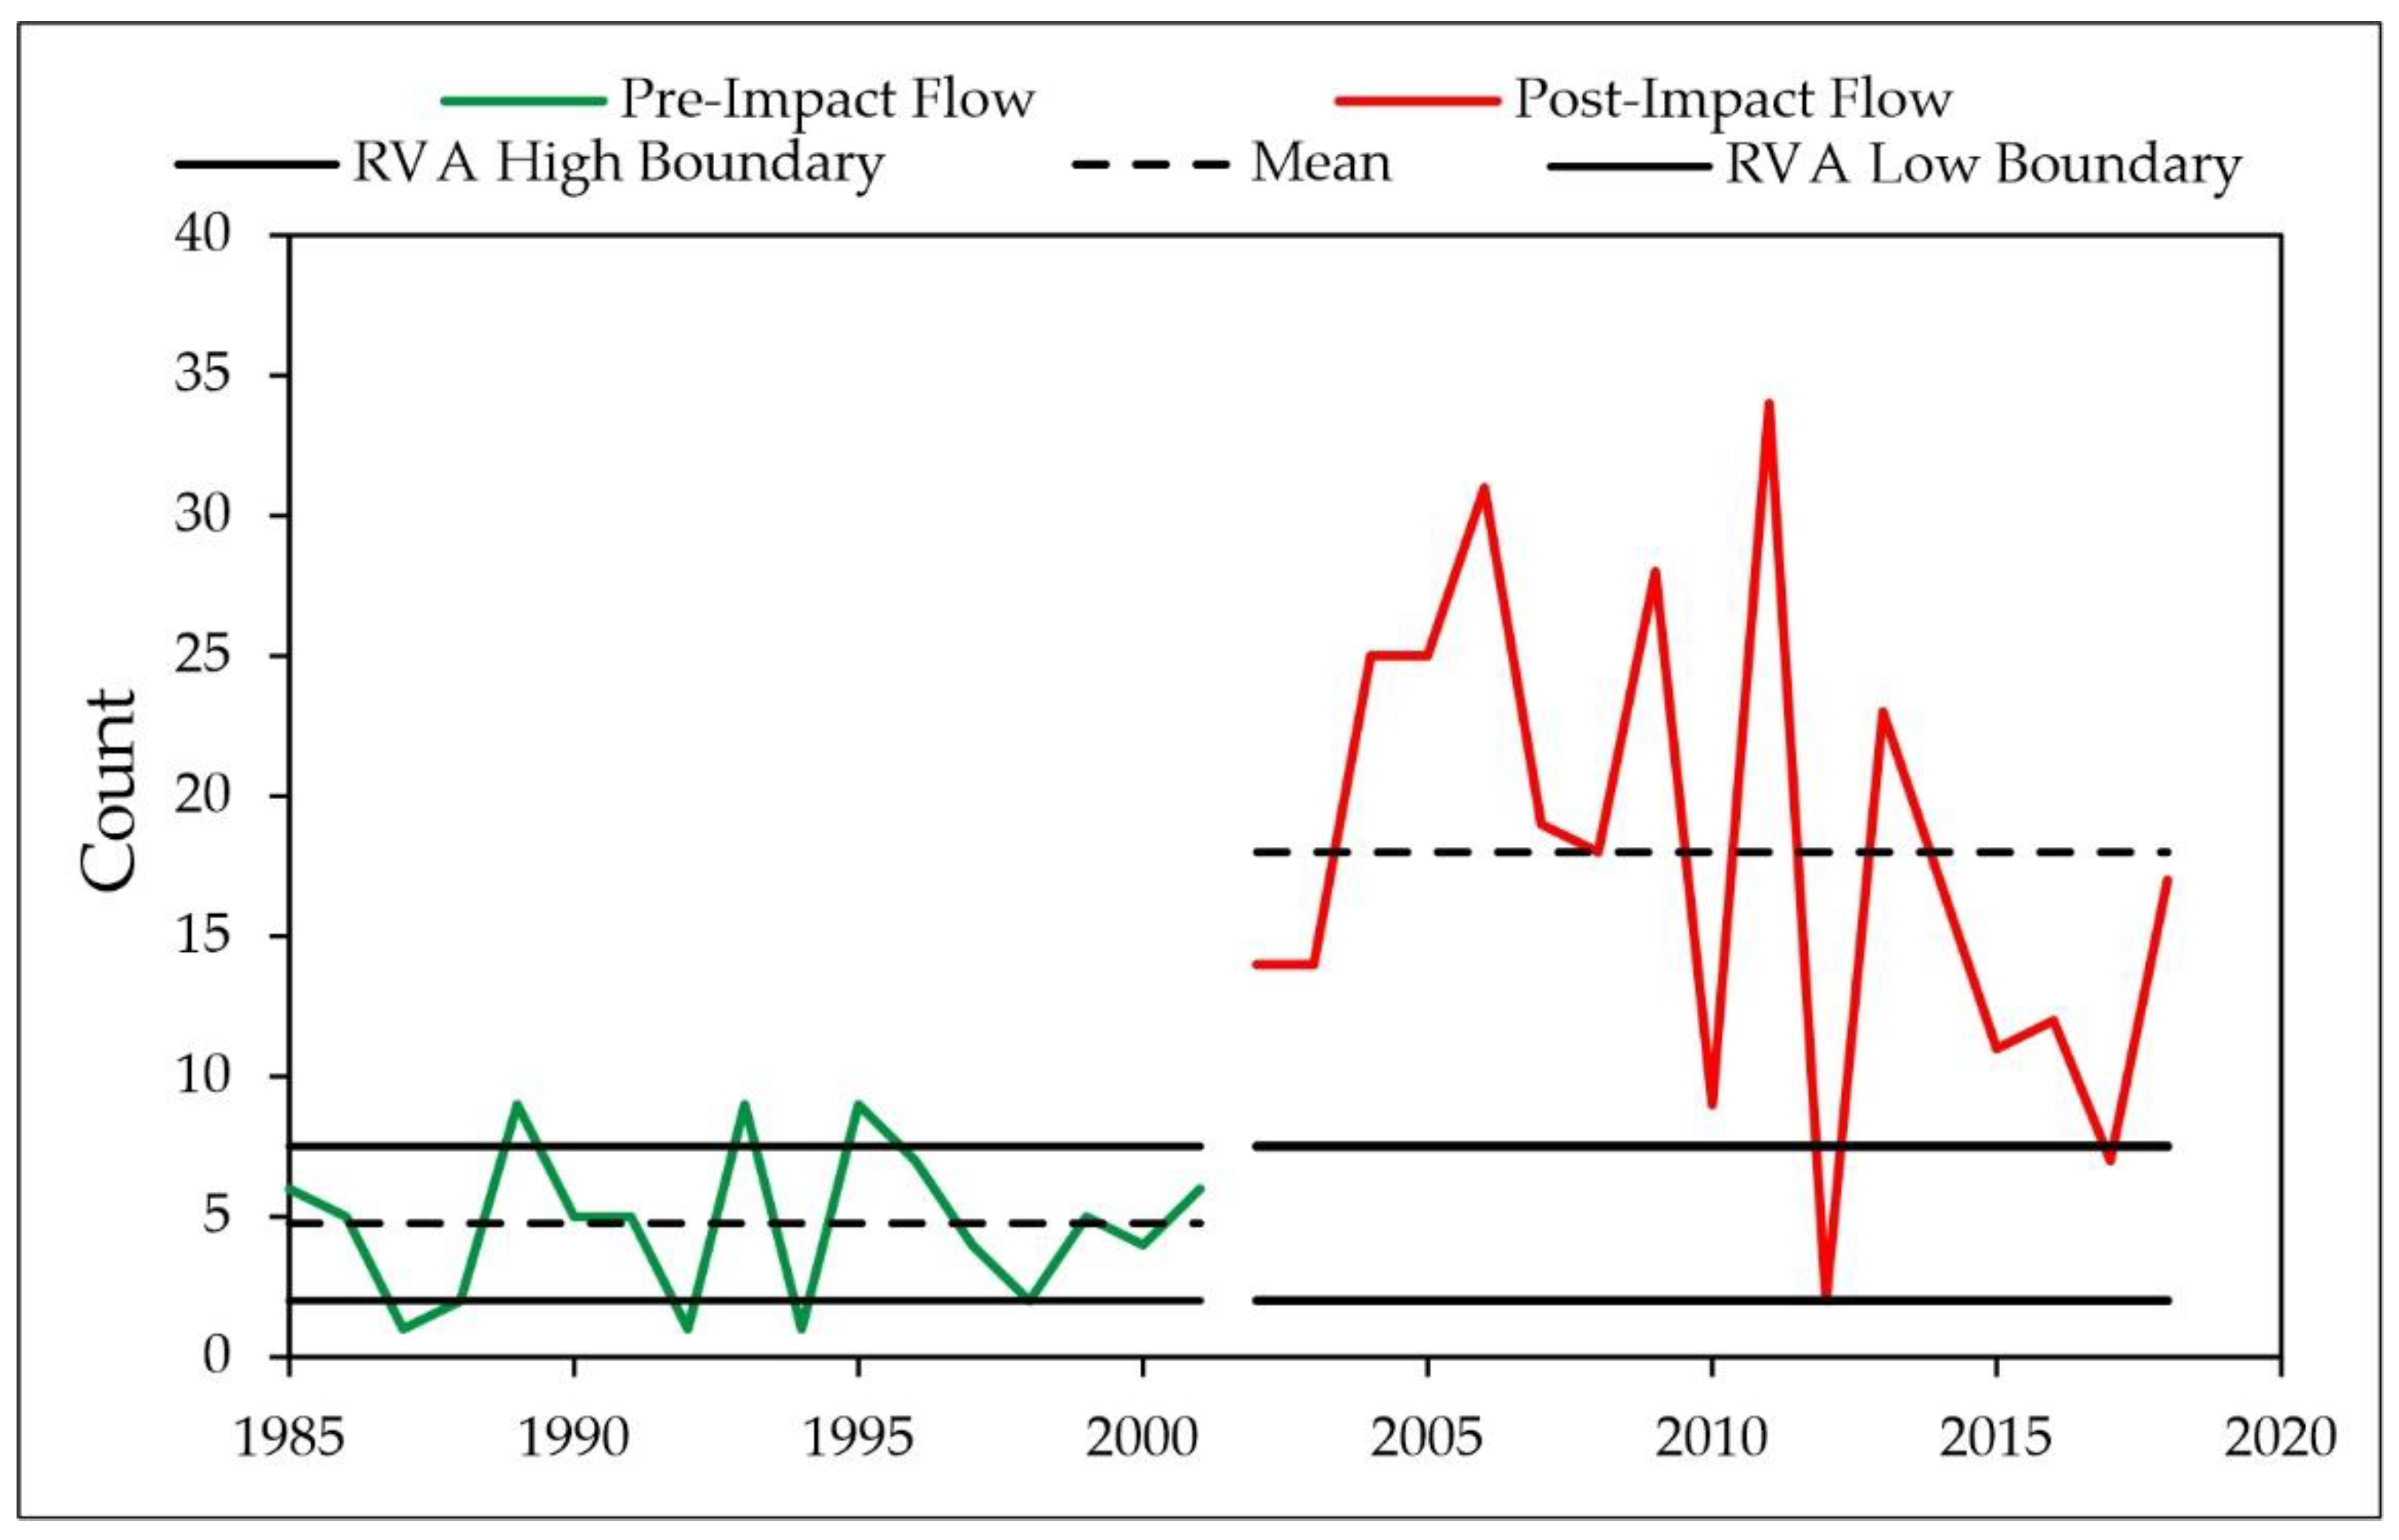
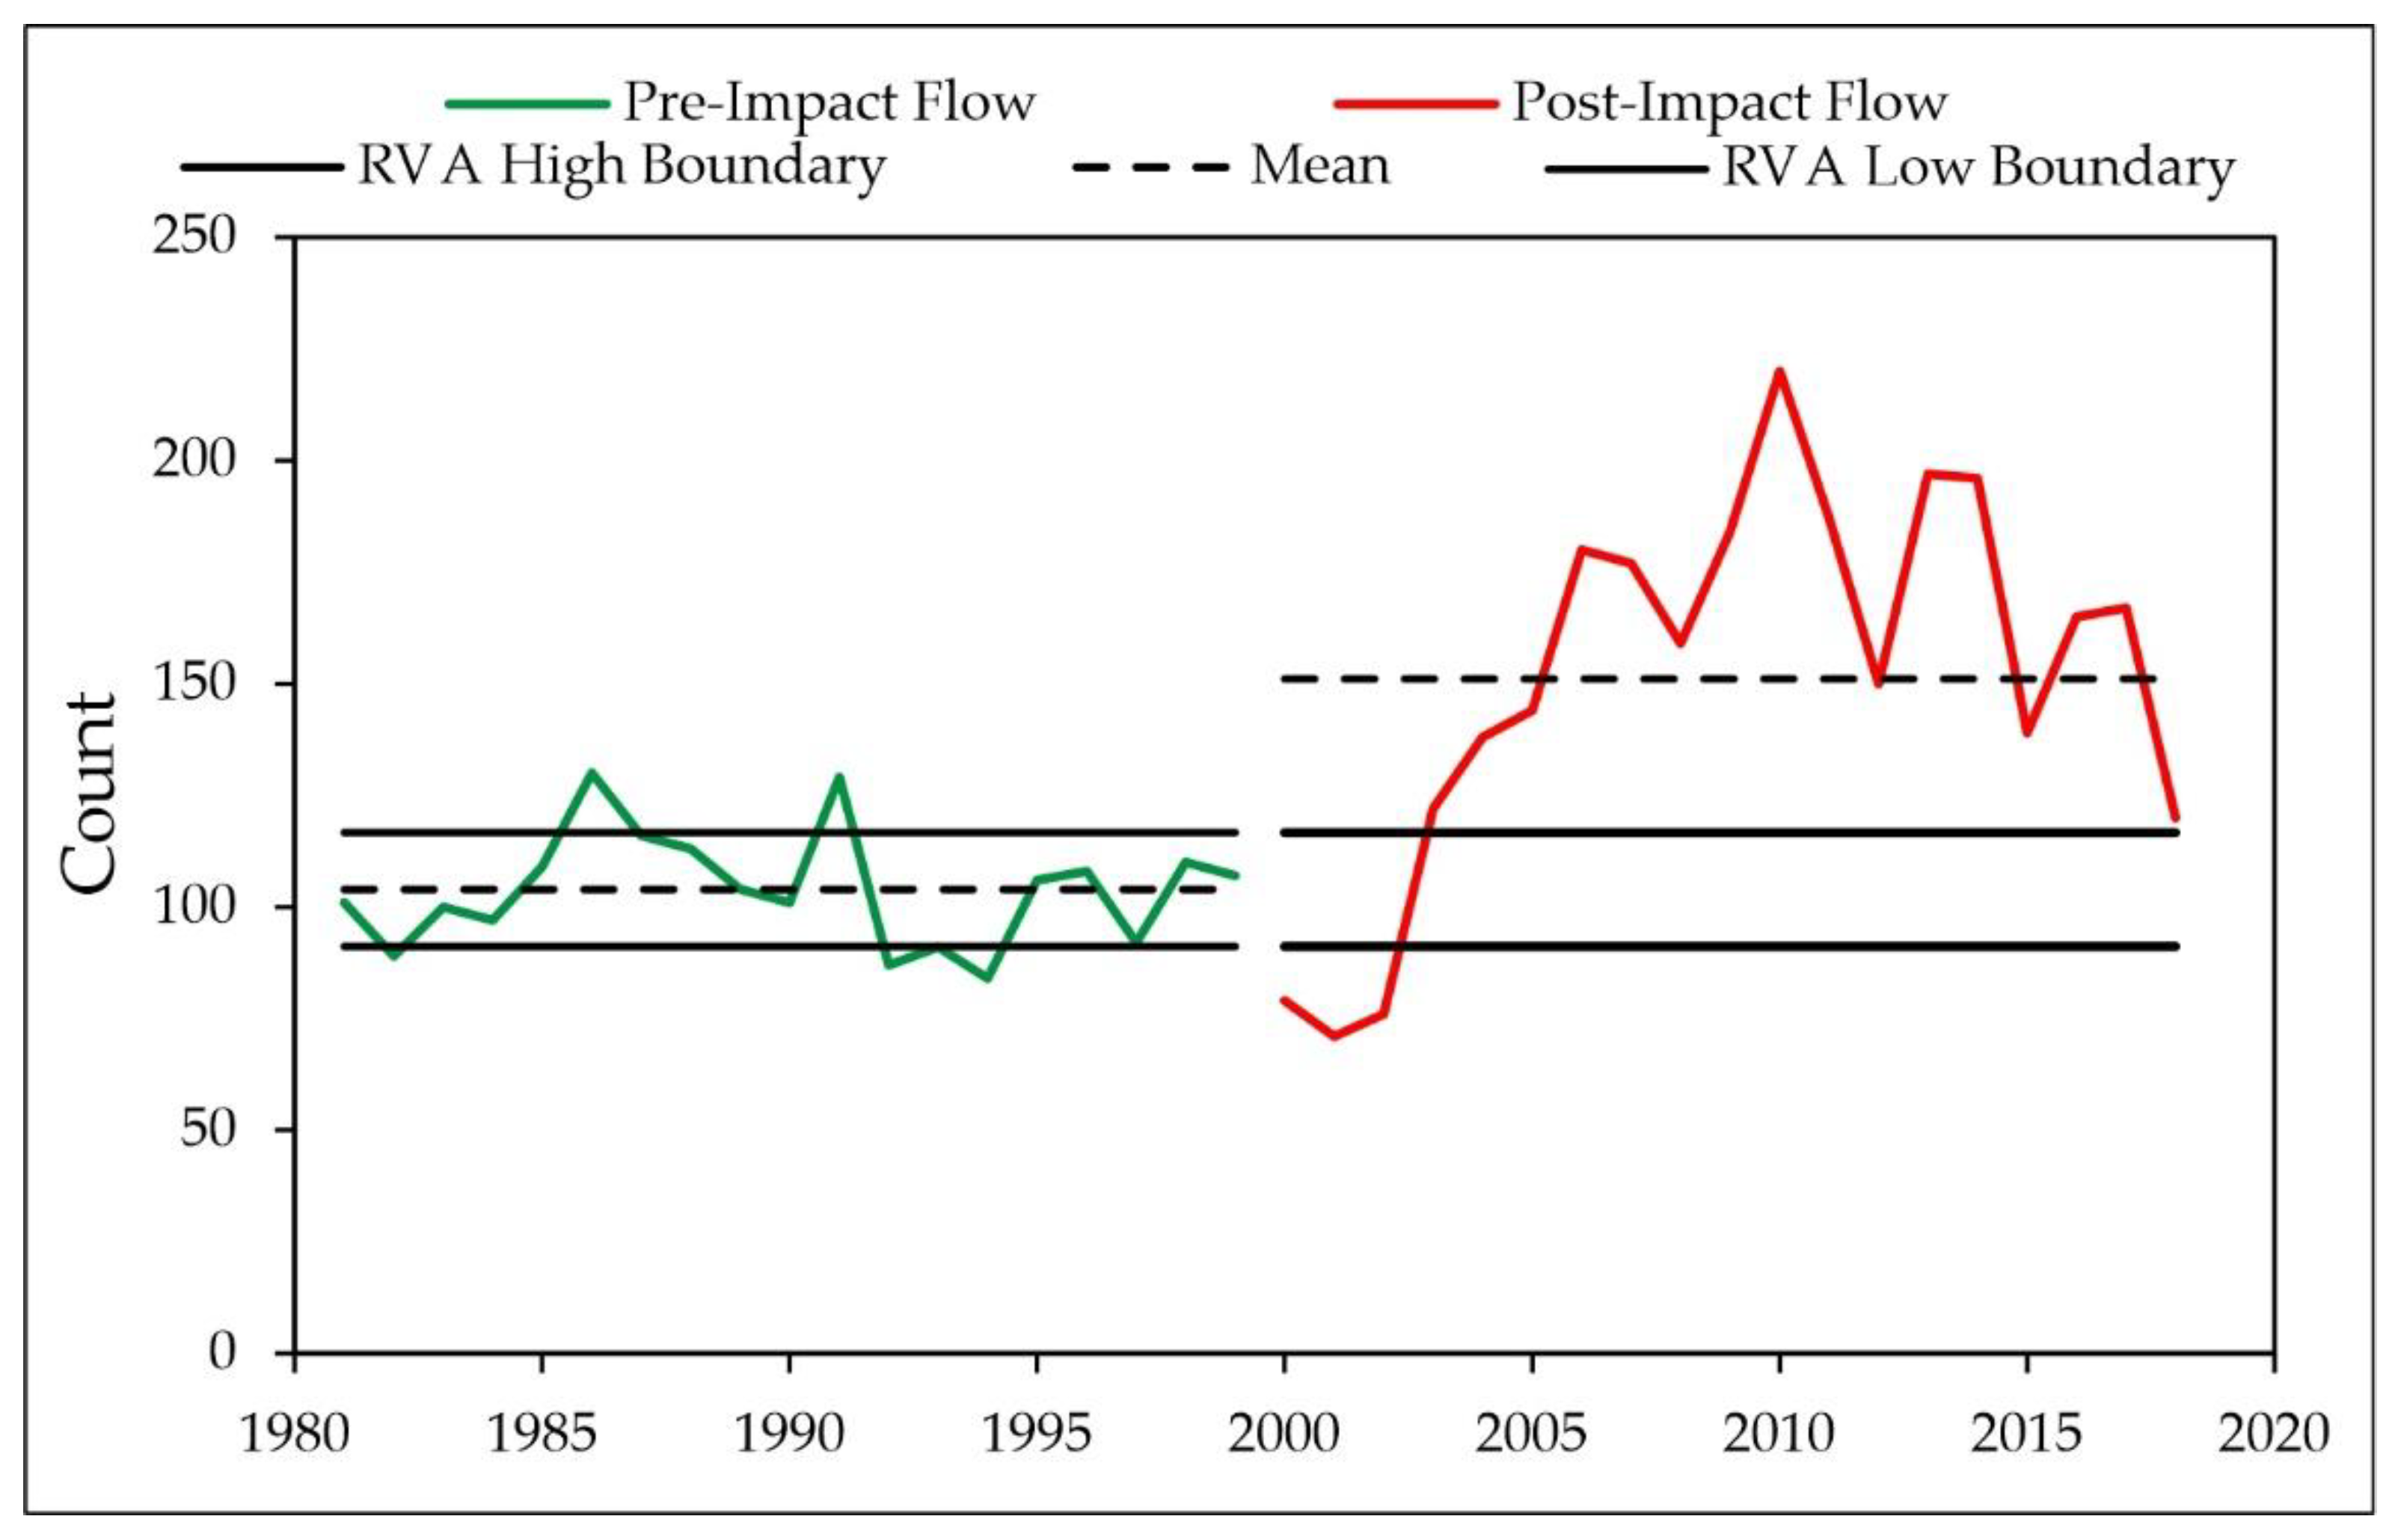
3.1.4. Frequency and Duration of High and Low Pulses

Group 4 of IHA parameters was particularly sensitive to HPP provoked flow regime modifications (Table A1). In our analysis, high and low pulses were considered as periods when daily flows were above or below the mean pre-impact value plus or minus 1.0 standard deviation. Especially large changes were indicated in the number of post-impact low pulses (Figure 4). On average, it deviated by almost 164% (the mean increase reached 220%), getting much higher values at individual WGSs: 495% at Šušvė-Josvainiai and over 270% at Mūša-Ustukiai and Širvinta-Liukonys. In the Šušvė, the number of low pulses ranged from one to eight times a year before the impact, and after the impact, this parameter reached even 53–54 times in individual years (Figure 5). That is the greatest estimated change of the IHA parameter in this study. Duration of low pulses was the parameter that experienced the second largest change in this group and among all IHA parameters. Although it increased at two WGSs, at other stations, this parameter was markedly reduced by an average of −59% (Figure 4). The high pulse frequency and duration changed considerably less (but in some cases still more than 20%); they had mixed signs (Table 6), indicating that flows exceeding the defined threshold did not have consistent patterns.
At five stations, the mean change in group 4 parameters was greater than 50%. Šušvė-Josvainiai WGS recorded an average of 150% deviations. At the remaining four WGSs of Širvinta-Liukonys, Mūša-Ustukiai, Bartuva-Skuodas, and Lėvuo-Bernatoniai, the average changes were 90.1%, 89.7%, 70.2%, and 54.1%, respectively.

3.1.5. Rate and Frequency of Hydrologic Changes

Changes in the rates of discharge (group 5 of IHA parameters) are presented in Table A1. In the IHA analysis, the rise rate is the mean of all positive differences between consecutive daily values, and the fall rate is the mean of all negative differences between consecutive daily values. The reversals are calculated by dividing the hydrologic record into “rising” and “falling” periods, which correspond to the periods during which the daily changes in flows are either positive or negative, respectively. The rise and fall rates at all stations tended to decrease on average by −27% (Table 6), except for Šušvė-Josvainiai, where all recorded parameters of this group increased. The largest observed change between the pre- and post-impact rise rates reached −39.7% (at Bartuva-Skuodas); the smallest reached 5.4% (at Šušvė-Josvainiai). The fall rate deviations fluctuated from −31.8% (at Verknė-Verbyliškės) to 15.3% (at Šušvė-Josvainiai). At 10 stations, the number of reversals increased by an average of 47%. The number of reversals was one of the most affected IHA parameters in the studied rivers. At Lėvuo-Bernatoniai, this variable was artificially elevated by 79% (Figure 6).
On average, Lėvuo-Bernatoniai and Bartuva-Skuodas stations manifested the most significant changes in the positive and negative differences between the consecutive daily means and the number of changeovers/reversals, of 45.5% and 43.3%, respectively. The data of Mituva-Žindaičiai showed the least response. The operation of Angiriai HPP invoked an increase in all parameters of this group in the Šušvė River.

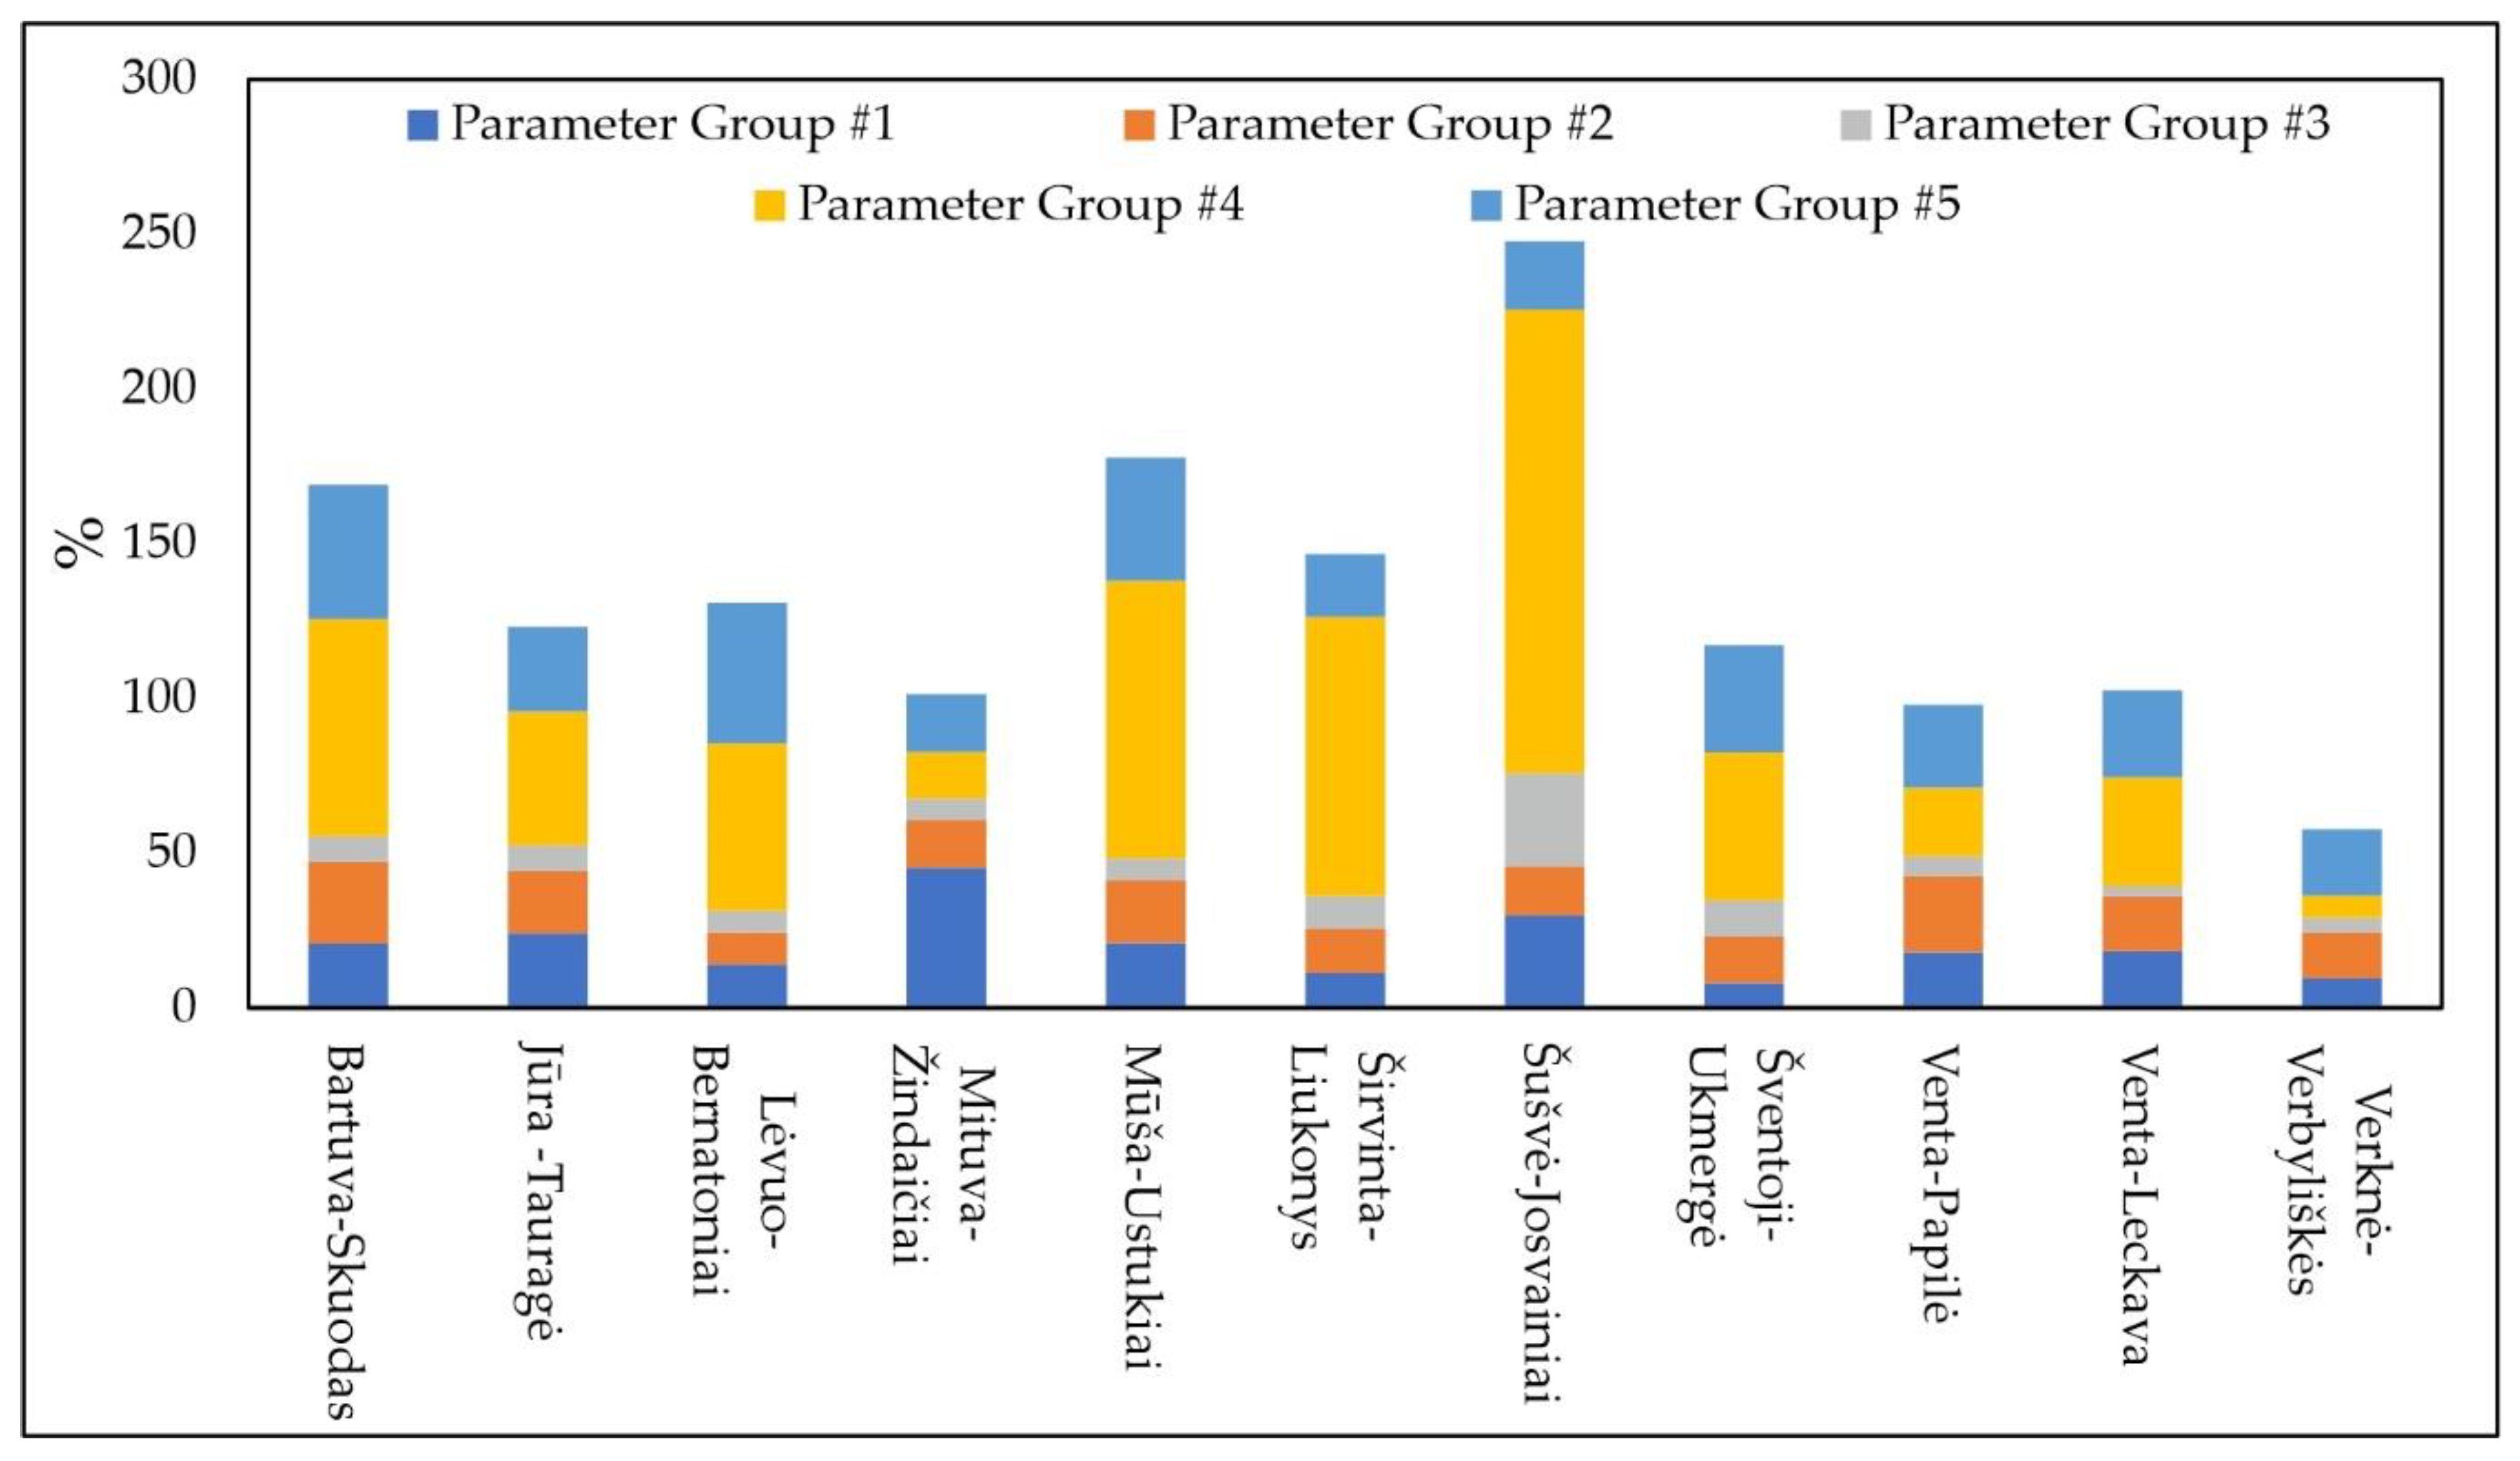
3.1.6. Overall Parameter Group Changes

The results of deviations of the IHA parameter values are presented in Figure 7. They show that among the studied parameter groups, the most dramatic changes occurred in the frequency and duration of high and low pulses, i.e., in group 4. In contrast, IHA parameters indicating the timing of extreme flows were the least impacted hydrologic variable. The analysis revealed the most affected rivers downstream of the hydropower plants: the Šušvė, Mūša, and Bartuva, where the average of parameter groups exceeded 33%, indicating moderate changes. A possible explanation for the most significant changes in IHA parameters downstream of Angiriai HPP in the Šušvė River is the ratio of installed and multiannual discharges (Qinst/Qma), which is the highest—(1.87) among the studied HPPs (Table 1). The turbines installed in this HPP leak a large amount of water and are not regulated; therefore, their activation causes hydropeaking phenomena in the river reach below.

3.2. Results of IHA Analysis

In the second step of our study, the range of variability approach (RVA) was applied to calculate the alteration in a variation of the IHA parameters after installation of HPP on the river or, in other words, to estimate the degree to which the defined RVA target range (±1 SD from the mean) was not attained. In the post-impact period, the calculated degree of inter-annual variation of the monthly flows (group 1 of IHA parameters) in the defined range was mostly low, i.e., it mostly equaled the expected frequency. Only low range (0-33%) alterations were identified for February flows. In January, April, July, August, and November, several cases of moderate alterations (33–67%) were estimated. In general, the most noticeable alterations in the post-impact monthly flows at Mituva-Žindaičiai and Jūra-Tauragė WGSs were observed: 22% (ranging from −40% to 44%) and 21% (from −36% to 36%) in absolute values, respectively. At the remaining WGSs, the monthly flow alterations varied from 12.5% to 18.5%.
Considerably higher degrees of hydrologic alteration were estimated for the extreme flow conditions (group 2 of IHA parameters). The frequency of minimum flows of different duration had a moderate alteration degree more often than in the case of maximum flow durations. The largest alteration was found in the extreme minimum flows for the 7-day minimum flow (from −54.6% to 70%), and in the group of the extreme maximum flows, it was found for the 7-day maximum flow (from −56.3% to 44.4%). Mūša-Ustukiai WGS data showed the largest positive moderate alteration of the extreme minimum flows (except for the 7-day minimum, where its range of 70% indicated a high alteration degree; Figure 8a). However, at Bartuva-Skuodas WGS, the greatest negative alterations of the extreme maximum flows of the moderate range were estimated (e.g., −53.9% in case of the 3-day maximum, Figure 8b). The highest alteration degree in the extreme flow data was established at Mituva-Žindaičiai WGS (on average 34.5%).
The alteration in parameter group 3 that refers to the timing of 1-day minimum and 1-day maximum flows was, in most cases, the smallest (of low degree). For individual WGS, the alteration in the minimum flow date ranged from −45.5% to 21.4%, and in the maximum flow date, it ranged from −50% to 18.2%. The moderate alteration degrees for the date of the maximum flow (−50%) were identified at Bartuva-Skuodas WGS, and at Mituva-Žindaičiai WGS they were identified for the date of the minimum flow (−45.5%). At other WGSs, the timing parameters failed to fall within the target range slightly in most cases, and the dates of the extreme flows recorded at Jūra-Tauragė WGS maintained the same variability patterns.
Large changes of inter-annual variation of post-impact values were estimated for group 4 parameters. Due to the operation of HPP, the natural frequency of the low pulse and its duration was highly reduced, on average by 35% and 27%, respectively. The values of hydrologic alteration at individual WGS ranged from −88.9% to 12.5% for the low pulse count and from −100% to 0% for its duration; it ranged from −46.7% to 33.3% for high pulse count and from −25% to 44.4% for its duration. A high degree of hydrologic alteration of the low pulses at Bartuva-Skuodas (−83%), Širvinta-Liukonys (−89%, Figure 9) and Šušvė-Josvainiai (−70%) WGSs was calculated. In contrast, no changes in the variation were estimated for the low pulse count at Mituva-Žindaičiai and Verknė-Verbyliškės WGSs; for the low pulse duration at Jūra-Tauragė, Mūša-Ustukiai, and Verknė-Verbyliškės WGSs; and the high pulse count at Mūša-Ustukiai and Šventoji-Ukmergė WGSs. Overall, the most considerable alterations were identified at Širvinta-Liukonys (42.7%) and Bartuva-Skuodas (42.4%) WGSs.
The parameters of group 5 experienced the largest alterations. Variation of the rise rate values was from −61.5% (at Bartuva-Skuodas WGS) to 22.2% (at Mūša-Ustukiai), the fall rate was from −66.7% (at Verknė-Verbyliškės) to 8.3% (at Šušvė-Josvainiai), and the number of reversals was from −100% to 9.1%. The values of the number of reversals fell outside the defined RVA ranges in 90% of the years in the post-impact period (at Bartuva-Skuodas, Jūra-Tauragė, Širvinta-Liukonys); all of these values fluctuated outside the target range at Mūša-Ustukiai and Šušvė-Josvainiai WGSs (i.e., alteration of −100%, Figure 10). In this study, the number of reversals was identified as an indicator of the most dramatic change in hydrologic alteration. The alterations of the rise and fall rate values were low to moderate. In general, the variation of parameters of group 5 was the most shifted at Bartuva-Skuodas (by 65%), Mūša-Ustukiai (by 56%), and Lėvuo-Bernatoniai WGS (by 54%), in absolute values.
Figure 11 indicates the percentage of hydrologic indicators in each category of hydrologic alteration: low, moderate, and high. Records in the Bartuva and Jūra downstream of the HPPs show the largest percentage of flow indicators in the range of moderate and high alterations. Thirty-one hydrologic indicators fell in the low and only one of them was in the moderate alteration range at Venta-Papilė WGS downstream of the HPP.
Figure 12 presents the overall degree (in %, according to Equation (3)) of hydrologic alteration, taking into account both the mean and maximum values of the degree of alteration for each indicator group. At six WGSs, this degree was rated as moderate (higher than 40%), i.e., the rivers of Bartuva, Širvinta, Šušvė, and Mūša were identified as the most hydrologically modified by HPP operation. The applied concept of hydrologic variability revealed that Rudikiai HPP modified the Venta River the least.

3.3. Influence of Hydropower Plants and Reservoir Characteristics on Hydrologic Changes in Rivers

In the previous sections, it has been established that the changes in the hydrologic regime took place after the construction of the HPPs. It is important to determine which HPP or reservoir characteristics had the greatest impact on the river reaches below. The following HPP and reservoir characteristics were selected for this analysis: reservoir volume and surface area, water retention coefficient, dam head, HPP installed power, and Qinst/Qma ratio (Table 1). It was investigated whether there was a relationship between the mentioned HPP characteristics and the hydrologic alterations (%) of 32 flow parameters in all 5 groups (Table 3) due to the HPP construction. For this purpose, a correlation analysis was performed. However, when calculating the relationships between the two groups of parameters, only a few significant relations were detected when the correlation coefficient was equal to or greater than 0.7 (Table 7).
The alteration degree of the 7-day maximum flows was found to be the most dependent on three characteristics (Table 7): reservoir volume, surface area, and Qinst/Qma. A regression equation with a correlation coefficient of 0.80 was estimated:
Y = 40.40 + 3.73 × 1 0.15 × 2 + 25.85 × 3
Most of the studied HPPs (8 out of 11) significantly affected the hydrologic alteration of the 7-day maximum flows, i.e., values of these extreme flows fell outside the boundaries of natural river functioning (Figure 13a). This means that during spring or flash floods, the reservoir can accumulate a certain amount of water and, due to such regulation (HPP operation), reduce the maximum flows in the lower reaches of rivers. Furthermore, the fate of maximum flow depends on the ratio Qinst/Qma. These ratios were highest (1.51–1.87) for the three HPPs, leading to the opposite alteration in the 7-day maximum flows (Figure 13b), i.e., the post-impact values of these flows tended to fluctuate in the defined range more often than before the impact. These ratios indicate that the installed flow in these HPPs is the largest compared to the multiannual flow rates. In addition, in these three HPPs, turbines do not regulate flow and not adapt to river flow rate. They release the maximum discharges out of the reservoir without reducing them (i.e., they do not perform the runoff regulation function).
Likely, the study of more hydropower plants and the possibility to assess the lower correlations as significant would reveal more significant relationships between the characteristics of HPP and reservoir and the degree of hydrologic alterations.

4. Discussion

The findings of the performed analysis revealed that the damming of rivers and the construction of reservoirs for hydropower production affected the hydrologic regime of the studied lowland rivers. To the best of our knowledge, this is the first study in Lithuania and the Baltic States to examine the full range of natural hydrologic regime variables, including size, time, frequency, duration, and change rates that play a key role in maintaining the aquatic ecosystem.
The environmental consequences of river flow alteration are well documented in literature [8,18,23,27,44]. The power of the method of Indicators of Hydrologic Alteration applied in the present study is that it can summarize long periods of daily hydrologic data into a much more manageable series of ecologically relevant hydrologic parameters [39]. In addition, the proposed 33 IHA parameters are considered to be robust in the ability to quantify alterations peculiar to specific human influences [17]. Since this method is widely used, comparing the findings with other studies was convenient and efficient.
In the post-impact period, smaller or larger changes of both positive and negative signs of the mean values of studied hydrologic indicators downstream of all dams were identified. Monthly flow changes did not have clear tendencies; the largest mean decrease was estimated in the June flow, and the largest increase was in the August flow. The greatest effect of flow modification was observed in April–August. In general, due to river exploitation by HPP, flows were reduced during the flood period and increased during the low flow period. Studies of dams’ hydrological impacts [45] have indicated that such redistribution of the flooding regime, directly and indirectly, affects fish populations.
However, flow regulation by HPP dams does not always result in reduced high flows and enlarged low flows. A significant increase in the mean extreme minimum flows and a significant decrease in the extreme maximum flows over different durations following impoundment across the studied sites was estimated by Magilan and Nislow [18] and Costigan and Daniels [19]. Very similar outcomes were presented by Song et al. [23]. Conversely, there were recorded cases of different (mixed) tendencies [27,46]. In the present study, the maximum flows diminished in all rivers, and the tendency of more considerable changes in the shorter maximum flow events was detected. However, no clear trends in the changes of minimum flows were identified. Virbickas et al. [16] analyzed the impact of three HPPs (Skuodas, Kuodžiai, and Dvariūkai, i.e., the same as in the present study) on fish habitats in downstream river stretches in the warm period. The analysis revealed that at the extremely low flows, the studied stretches became unsuitable or only partly suitable for studied fish species. In a dry year, when a suitable habitat area falls below the threshold area, the number of stress days may increase even more significantly.
The post-impact dates of 1-day extreme flows demonstrated low changes. No patterns in modified extreme flows were detected; this could be attributed to different regulation modes at the selected HPPs.
In contrast, in the case of low pulses, huge differences between pre- and post-impact characteristics were estimated. However, the mean high pulse number and duration changed slightly (in most cases decreased). These measures of frequency and duration of high and low water conditions together show the pulsating behavior of environmental variation over a year and provide measures of the shape of these environmental pulses [17]. Their role in the aquatic ecosystem is listed in Table 3. In the present study, the identified considerably increased frequency of low pulses and their reduced duration may be attributed to both decreasing river flows due to climate change [47] and artificial flow regime regulation. Despite the naturally lower flows, HPP owners have to release the environmental flow and still need to generate electricity. A considerable increase in low pulse number and a decrease in their duration were detected by Zhang et al. [46] and Song et al. [23]. The frequency and duration of high and low pulses were identified as the most affected elements of the hydrologic regime by Ely et al. [27].
The estimated means of rise and fall rates decreased in most cases studied, and the number of reversals got considerably greater. Costigan and Daniels [19] discovered a dramatic increase in the number of reversals and a faster rise and fall rate. The studies of Magilan and Nislow [18], Song et al. [23], and Zhang et al. [46] also revealed an increasing number of reversals following impoundment. The changes in the rates of flow variation were mentioned among most common and noticeable by Magilan and Nislow [18] and Ely et al. [27]. Since the present study was based on daily flow data, it was not possible to compare the results with those of Punys et al. [12] and Česonienė et al. [48], which used sub-daily (hourly) flow data and identified a significant flow hydrograph ramping downstream from some studied HPP dams. However, the findings of [48] showed that the ramping did not correlate to a significant impact on the biological indices. Still, such a rapid and frequent flow and stage fluctuation certainly indicate a high undesirable, unnatural modification of the flow regime. In [12], causes of flow ramping and measures to reduce the effects of HPPs by adapting turbines to the river natural flow were proposed.
River flow regulation by HPPs modified not only the post-impact mean values, but also a variation of the studied hydrologic parameters at a different rate. Not always, a variation of hydrologic indicators met the defined RVA targets. The degree of inter-annual variation of monthly flows mostly equaled the expected frequency. The hydrologic alteration of extreme flows was more pronounced: it had a low degree in most cases. However, minimum flows of different durations, more often than maximum flows, had a moderate degree of the alteration as well. Low pulse count and duration in a number of cases had moderate or high alterations, while the majority of high pulse parameters experienced alterations of a low degree. A group of hydrologic parameters that describe a rate and frequency of changes in conditions (rise and fall rates and the number of reversals) experienced the largest alterations. Estimated hydrologic alteration of the number of reversals was the most dramatic in the present study. In many cases, its values were greatly outside the boundaries of natural variation. In general, the number of reversals, low pulse count, and fall rate were the flow characteristics that fell outside their historical ranges of variability most often and strongly. Fall rate ranked first of all hydrologic alteration values by Zuo and Liang [49]. Song et al. [23] stated that the number of reversals had the largest alteration, followed by rise and fall rates, among others. Even the study by Gierszewski et al. [35], which analyzed flow regime changes in the periods of different operating conditions of HPP, estimated that in the entire analyzed period, the average values of the rise rate, the fall rate, and the number of discharge reversals significantly exceeded RVA ranges. Richter et al. [41] also indicated the considerably higher non-attainment rates for the post-dam period for high and low pulse counts and durations, numbers of hydrograph falls and rises, and the hydrograph rise rate. The same study found that the computation of rise and fall rates and rise/fall counts in the IHA method does a reasonably good job of detecting hydropower-induced change. The study of Zhang et al. [46] reported that the three indicators of the rate and frequency of the daily streamflow (i.e., rise rate, fall rate and, the number of reversals) were informative to delineate the critical role of dam construction on streamflow change. Therefore, the results of this study appear to be almost consistent with other results of a similar nature obtained by other researchers. In general, the sensitivity of the IHA parameters to flow modifications was very similar in most of the reviewed studies. If there were any differences, they might be attributed to a variety of climatic and geographical conditions, reservoir size, installed power of HPP, environmental legislation determining the more or less environmentally friendly mode for exploiting a river, etc. Table 3 indicates what kind of ecological response might follow the revealed hydrologic alterations. Larger changes in flow alteration are associated with a greater risk of ecological change from pre-management conditions [8].
According to the overall degree of hydrologic alterations, exploitation of six (out of 11) HPPs caused moderate alterations of investigated flow indicators. In some cases, hydrologic parameters were altered unexpectedly strongly. The IHA tool is based on mean daily flow data; therefore, if hourly data were available, it would likely be possible to capture even greater hydrologic alterations. The findings showed that HPP and reservoirs considerably disturbed the primary flow of downstream river ecosystems. Nevertheless, regression analysis of HPP or reservoir characteristics provoking such changes was not successful, likely due to a short sample of affected river reaches; thus, we could not determine which specific HPP attributes led to the largest alterations. It is possible that the study of a larger number of modified river reaches and the opportunity to assess the lower correlations as significant would reveal more noteworthy relationships between the characteristics of HPP and reservoir and the degree of hydrologic alterations. Regressing IHA response variables against HPP and reservoir attributes may be complicated because of different HPP operation modes due to specific management objectives. Magillan and Nislow [18], trying to explain the difference and direction of the hydrograph properties, discovered that dam characteristics emerge as important variables generally in combination with climatic variables. Timpe and Kaplan [25] detected that reservoir area and volume and dam elevation were consistently significant predictors of the observed hydrologic alterations. By scaling hydrologic alteration by electricity production capacity, they established that lowland dams with large reservoirs affected the hydrologic regime more than higher elevation dams with smaller reservoirs. The outsized impact of small dams has been demonstrated by other studies [50,51] as well.
Taken together, these findings suggest that the proposed hydrologic indicators may help to find solutions for how to mitigate the dam-induced changes. The severity of certain alterations results from the hydropeaking mode that should not be allowed, especially during the low flow periods. In the exploitation schemes of the small HPPs, the requirement to operate in a run-of-river mode during the low flow period should be defined and emphasized [13]. The use and results of the RVA approach are designed for ecologically-minded management of water resources to balance human and ecosystem needs. It can help to set the requirements for a more environment-friendly range of river flow.

5. Conclusions

The aim of this study was to investigate the hydrologic changes caused by small hydropower plants in Lithuanian lowland rivers. Thirty-two indicators of hydrologic alteration (IHA) were studied in 11 rivers downstream of hydropower plants in the post-impact and pre-impact periods.
The largest changes in mean IHA values were found for group 4 parameters (low and high pulse characteristics) of 57%. The low pulse rate changed by 164%, and its duration averaged 55%. Only small or no deviations of group 3 parameters (timing of annual extreme flows) were found.
The most considerable hydrologic alterations were established in group 5 parameters (rate and frequency of hydrologic changes) of 41%. The post-impact number of reversals altered from the natural range by 64%. The other two most altered parameters were low pulse number and fall rate (from group 4), which altered by 35% and 30%, respectively.
By applying the Indicators of Hydrologic Alteration method, six hydropower plants were identified that provoked hydrologic alterations of a moderate degree in downstream river flows.

Author Contributions

Conceptualization, D.Š. and J.K.; methodology, D.Š.; database creation, G.A., software, D.Š. and G.A.; formal analysis, G.A., D.J. and G.A.; discussion, D.Š.; writing—original draft preparation, D.Š. and G.A.; writing—review and editing, J.K.; visualization, D.J.; supervision, J.K. All authors have read and agreed to the published version of the manuscript.

Funding

This research was funded by RESEARCH COUNCIL OF LITHUANIA, grant number S-SIT-20-3.

Data Availability Statement

The used data are not shared.

Acknowledgments

This research was funded under the National Research Programme ‘Sustainability of agro-, forest and water ecosystems (2015–2021)’, scientific study ‘Impact assessment of hydrotechnical structures on river runoff and sustainable water management for conservation and restoration of water ecosystems’ (Project No. S-SIT-20-3).

Conflicts of Interest

The authors declare no conflict of interest.

Appendix A

Table A1. Change (%) in the mean values of IHA parameters.
ParametersRiver-WGS *
1.2.3.4.5.6.7.8.9.10.11.
Group #1 of IHA Parameters
January−8.69.11.4−27.3−5.8−11.30.7−19.4−1.2−2.9−8.4
February−7.3−18.823.4−22.8−5.717.345.5−1.6−2.8−31.020.4
March−28.6−3.57.1−35.2−7.8−10.3−11.5−11.0−8.5−25.1−14.4
April−51.614.9−31.9−35.5−33.3−19.6−34.6−24.0−33.0−4.0−16.6
May−23.5−12.6−19.5−39.7−36.114.7−43.4−9.3−31.0−15.5−1.9
June−39.6−31.2−14.3−51.9−49.9−1.2−60.0−5.4−58.1−40.92.5
July5.521.3−2.6132.3−51.83.517.02.210.72.115.7
August5.589.619.451.414.4−8.616.46.0−17.954.617.4
September6.18.21.629.7−30.8−3.648.84.1−43.05.3−1.4
October−37.7−0.2−6.796.57.612.534.3−9.9−0.110.72.3
November−22.916.828.115.7−6.218.036.61.0−6.4−1.13.7
December−12.565.013.9−7.0−2.615.011.43.9−3.327.7−10.7
Group #2 of IHA Parameters
1-day minimum−42.5−37.6−1.3−10.4−32.9−24.6−17.88.7−31.8−21.412.5
3-day minimum−37.1−35.10.1−7.9−28.1−16.2−16.412.3−28.7−17.39.8
7-day minimum−32.2−30.22.4−2.5−22.8−8.0−12.513.6−27.4−14.98.2
30-day minimum−26.3−19.7−2.40.7−20.8−1.7−15.811.3−28.0−10.88.2
90-day minimum−12.43.29.137.1−26.810.8−10.29.3−30.42.313.0
1-day maximum−33.2−16.1−21.2−9.3−17.0−24.3−28.0−16.5−29.3−27.8−25.8
3-day maximum−30.5−15.3−19.3−16.4−17.8−22.5−24.3−16.3−27.9−27.6−27.1
7-day maximum−28.6−11.6−19.8−26.0−18.0−21.0−20.8−16.4−22.4−23.3−25.1
30-day maximum−22.6−11.1−19.4−29.2−19.9−16.8−17.6−18.7−16.8−20.4−16.8
90-day maximum−16.7−6.1−10.5−26.7−16.5−5.0−7.6−14.4−13.2−19.8−5.6
Base flow index−10.0−35.67.53.1−2.4−5.7−2.726.9−15.2−9.09.3
Group #3 of IHA Parameters
Date of minimum3.113.98.57.65.58.323.611.79.34.02.9
Date of maximum13.32.55.66.38.612.936.411.93.62.57.0
Group #4 of IHA Parameters
Low pulse count175.5113.9132.6−12.7279.6277.8495.3−75.0−1.372.2-
Low pulse duration−65.6−50.2−59.515.7−58.3−78.4−56.4−77.857.8−31.6-
High pulse count−28.21.1−4.1−2.2−11.40.0−24.1−20.3−24.216.7−13.3
High pulse duration−11.67.8−20.2−29.3−9.24.223.5−18.05.5−19.9−0.8
Group #5 of IHA Parameters
Rise rate−39.7−26.1−33.4−13.8−28.5−5.05.4−33.5−36.6−30.0−26.3
Fall rate−25.2−10.8−23.7−17.3−18.2−5.815.3−26.6−28.4−15.9−31.9
Number of reversals65.145.079.425.172.550.045.443.615.238.2−6.5
* Indicated in Table 2.

References

  1. Arcadis. Hydropower Generation in the Context of the EU WFD; EC DG Environment: Brussels, Belgium, 2011; p. 168. [Google Scholar]
  2. Moran, E.F.; Lopez, M.C.; Moore, N.; Müller, N.; Hyndman, D.W. Sustainable hydropower in the 21st century. Proc. Natl. Acad. Sci. USA 2018, 115, 11891–11898. [Google Scholar] [CrossRef] [Green Version]
  3. Ali, R.; Kuriqi, A.; Abubaker, S.; Kisi, O. Hydrologic Alteration at the Upper and Middle Part of the Yangtze River, China: Towards Sustainable Water Resource Management Under Increasing Water Exploitation. Sustainability 2019, 11, 5176. [Google Scholar] [CrossRef] [Green Version]
  4. Simonov, E.A.; Nikitina, O.I.; Egidarev, E.G. Freshwater Ecosystems versus Hydropower Development: Environmental Assessments and Conservation Measures in the Transboundary Amur River Basin. Water 2019, 11, 1570. [Google Scholar] [CrossRef] [Green Version]
  5. Poff, N.L.; Allan, J.D.; Bain, M.B.; Karr, J.R.; Prestgaard, K.L.; Richter, B.D.; Sparks, R.E.; Stromberg, J.C. The natural flow regime: A paradigm for river conservation and restoration. BioScience 1997, 47, 769–784. [Google Scholar] [CrossRef]
  6. Zeiringer, B.; Seliger, C.; Greimel, F.; Schmutz, S. River Hydrology, Flow Alteration, and Environmental Flow. In Riverine Ecosystem Management; Schmutz, S., Sendzimir, J., Eds.; Aquatic Ecology Series; Springer: Cham, Germany, 2018; Volume 8, pp. 67–89. [Google Scholar] [CrossRef]
  7. Olden, J.; Poff, N. Redundancy and the Choice of Hydrologic Indices for Characterizing Stream Flow Regimes. River Res. Appl. 2003, 19, 101–121. [Google Scholar] [CrossRef]
  8. Poff, N.; Zimmerman, J. Ecological Responses to Altered Flow Regimes: A Literature Review to Inform the Science and Management of Environmental Flows. Freshw. Biol. 2010, 55, 194–205. [Google Scholar] [CrossRef]
  9. The International Hydropower Association. Hydropower Status Report; IHA: London, UK, 2020; p. 54. [Google Scholar]
  10. Kasiulis, E.; Punys, P.; Kvaraciejus, A.; Dumbrauskas, A.; Jurevičius, L. Small Hydropower in the Baltic States-Current Status and Potential for Future Development. Energies 2020, 13, 6731. [Google Scholar] [CrossRef]
  11. Zdankus, N.; Vaikasas, S.; Sabas, G. Impact of a hydropower plant on the downstream reach of a river. J. Environ. Eng. Landsc. Manag. 2008, 16, 128–134. [Google Scholar] [CrossRef]
  12. Punys, P.; Dumbrauskas, A.; Kasiulis, E.; Vyčienė, G.; Šilinis, L. Flow Regime Changes: From Impounding a Temperate Lowland River to Small Hydropower Operations. Energies 2015, 8, 7478–7501. [Google Scholar] [CrossRef] [Green Version]
  13. Gailiušis, B.; Adzgauskas, G.; Tomkevičienė, A.; Meilutyte-Lukauskiene, D. Assessment of the ecological flow of the Lithuanian rivers. Power Eng. 2018, 64, 196–205. (In Lithuanian) [Google Scholar] [CrossRef]
  14. Vaikasas, S.; Palaima, K.; Pliūraitė, V. Influence of hydropower dams on the state of macroinvertebrates assemblages in the Virvyte river, Lithuania. J. Environ. Eng. Landsc. Manag. 2013, 21, 305–315. [Google Scholar] [CrossRef]
  15. Vaikasas, S.; Bastiene, N.; Pliuraite, V. Impact of small hydropower plants on physicochemical and biotic environments in flatland riverbeds of Lithuania. J. Water Secur. 2015, 1, 1–13. [Google Scholar] [CrossRef] [Green Version]
  16. Virbickas, T.; Vezza, P.; Kriaučiūnienė, J.; Akstinas, V.; Šarauskienė, D.; Steponėnas, A. Impacts of low-head hydropower plants on cyprinid-dominated fish assemblages in Lithuanian rivers. Sci. Rep. 2020, 10, 21687. [Google Scholar] [CrossRef] [PubMed]
  17. Richter, B.D.; Baumgartner, J.F.; Powell, J.; Braun, D. A method for assessing hydrologic alteration with ecosystems. Conserv. Biol. 1996, 10, 1163–1174. [Google Scholar] [CrossRef] [Green Version]
  18. Magilligan, F.J.; Nislow, K.H. Changes in Hydrologic Regime by Dams. Geomorphology 2005, 71, 61–78. [Google Scholar] [CrossRef]
  19. Costigan, K.H.; Daniels, M.D. Damming the prairie: Human alteration of Great Plains river regimes. J. Hydrol. 2012, 444, 90–99. [Google Scholar] [CrossRef]
  20. Mathews, R.; Richter, B.D. Application of the indicators of hydrologic alteration software in environmental flow setting. J. Am. Water Resour. Assoc. 2007, 43, 1400–1413. [Google Scholar] [CrossRef]
  21. Richter, B.D.; Thomas, G.A. Restoring environmental flows by modifying dam operations. Ecol. Soc. 2007, 12, 12. [Google Scholar] [CrossRef]
  22. Xue, L.; Zhang, H.; Yang, C.; Zhang, L.; Sun, C. Quantitative Assessment of Hydrological Alteration Caused by Irrigation Projects in the Tarim River basin, China. Sci. Rep. 2017, 7, 4291. [Google Scholar] [CrossRef] [Green Version]
  23. Song, X.; Zhuang, Y.; Wang, X.; Li, E.; Zhang, Y.Z.; Lu, X.; Yang, J.; Liu, X. Analysis of Hydrologic Regime Changes Caused by Dams in China. J. Hydrol. Eng. 2020, 25, 05020003. [Google Scholar] [CrossRef]
  24. Li, F.F.; Qiu, J. Incorporating ecological adaptation in a multi-objective optimization for the Three Gorges Reservoir. J. Hydroinform. 2016, 18, 564–578. [Google Scholar] [CrossRef]
  25. Timpe, K.; Kaplan, D. The changing hydrology of a dammed Amazon. Sci. Adv. 2017, 3, e1700611. [Google Scholar] [CrossRef] [Green Version]
  26. Souza-Cruz-Buenaga, F.V.A.; Espig, S.A.; Castro, T.; Santos, M.A. Environmental impacts of a reduced flow stretch on hydropower plants. Braz. J. Biol. 2019, 79, 470–487. [Google Scholar] [CrossRef]
  27. Ely, P.; Fantin-Cruz, I.; Tritico, H.M.; Girard, P.; Kaplan, D. Dam-Induced Hydrologic Alterations in the Rivers Feeding the Pantanal. Front. Environ. Sci. 2020, 8, 579031. [Google Scholar] [CrossRef]
  28. Alrajoula, M.T.; Zayed, I.S.A.; Elagib, N.A.; Hamdi, M.R. Hydrological, socio-economic and reservoir alterations of Er Roseires Dam in Sudan. Sci. Total Environ. 2016, 566, 938–948. [Google Scholar] [CrossRef]
  29. Palmate, S.S.; Pandey, A.; Jadhao, V.G.; Chandrakar, A. Assessment of historical hydrologic alteration due to dam construction in upper Godavari River basin. Geophys. Res. Abstr. 2019, 21, EGU2019-1614-2. [Google Scholar]
  30. Babel, M.S.; Dinh, C.N.; Mullick, M.R.A.; Nanduri, U. Operation of a hydropower system considering environmental flow requirements: A case study in La Nga River basin, Vietnam. J. Hydro-Environ. Res. 2012, 6, 63–73. [Google Scholar] [CrossRef]
  31. Bizzi, S.; Pianosi, F.; Soncini-Sessa, R. Valuing hydrological alteration in multi-objective water resources management. J. Hydrol. 2012, 472, 277–286. [Google Scholar] [CrossRef]
  32. De Girolamo, A.M.; Barca, E.; Pappagallo, G.; Porto, A.L. Simulating ecologically relevant hydrological indicators in a temporary river system. Agric. Water Manag. 2017, 180, 194–204. [Google Scholar] [CrossRef]
  33. Stefanidis, K.; Panagopoulos, Y.; Psomas, A.; Mimikou, M. Assessment of the natural flow regime in a Mediterranean river impacted from irrigated agriculture. Sci. Total Environ. 2016, 573, 1492–1502. [Google Scholar] [CrossRef] [PubMed]
  34. Halleraker, J.H.; Sundt, H.; Alfredsen, K.T.; Dangelmaier, G. Application of multiscale environmental flow methodologies as tools for optimized management of a Norwegian regulated national salmon watercourse. River Res. Appl. 2007, 510, 493–510. [Google Scholar] [CrossRef]
  35. Gierszewski, P.J.; Habel, M.; Szmańda, J.; Luc, M. Evaluating effects of dam operation on flow regimes and riverbed adaptation to those changes. Sci. Total Environ. 2020, 710, 136202. [Google Scholar] [CrossRef] [PubMed]
  36. Kiesel, J.; Gericke, A.; Rathjens, H.; Wetzig, A.; Kakouei, K.; Jähnig, S.C.; Fohrer, N. Climate change impacts on ecologically relevant hydrological indicators in three catchments in three European ecoregions. Ecol. Eng. 2019, 127, 404–416. [Google Scholar] [CrossRef]
  37. Schneider, C.; Laize, C.L.R.; Acreman, M.C.; Florke, M. How will climate change modify river flow regimes in Europe? Hydrol. Earth Syst. Sci. 2013, 17, 325–339. [Google Scholar] [CrossRef] [Green Version]
  38. Galvonaitė, A.; Valiukas, D.; Kilpys, J.; Kitrienė, Z.; Misiūnienė, M. Climate Atlas of Lithuania; Lithuanian Hydrometeorological Service: Vilnius, Lithuania, 2013; p. 176. (In Lithuanian) [Google Scholar]
  39. The Nature Conservancy. Indicators of Hydrologic Alteration Version 7.1 User’s Manual; rPurview LLC: Arlington, VA, USA, 2009; p. 81. [Google Scholar]
  40. Lithuanian Hydrometeorological Service. Hydrologic Yearbooks; Lithuanian Hydrometeorological Service: Vilnius, Lithuania, 2018. [Google Scholar]
  41. Richter, B.D.; Baumgartner, J.V.; Wigington, R.; Braun, D.P. How much water does a river need? Freshw. Biol. 1997, 37, 231–249. [Google Scholar] [CrossRef] [Green Version]
  42. Richter, B.D.; Baumgartner, J.V.; Braun, D.P.; Powell, J. A spatial assessment of hydrologic alteration within a river network. Regul. Rivers 1998, 14, 329–340. [Google Scholar] [CrossRef]
  43. Bujang, M.A.; Baharum, N. Sample Size Guideline for Correlation Analysis. World J. Soc. Sci. Res. 2016, 3, 37–46. [Google Scholar] [CrossRef]
  44. Anderson, D.; Moggridge, H.; Warren, P.; Shucksmith, J. The impacts of ‘run-of-river’ hydropower on the physical and ecological condition of rivers. Water Environ. J. 2015, 29, 268–276. [Google Scholar] [CrossRef] [Green Version]
  45. Schmutz, S.; Moog, O. Dams: Ecological Impacts and Management. In Riverine Ecosystem Management; Schmutz, S., Sendzimir, J., Eds.; Aquatic Ecology Series; Springer: Cham, Germany, 2018; Volume 8, pp. 111–127. [Google Scholar] [CrossRef] [Green Version]
  46. Zhang, Z.; Huang, Y.; Huang, J. Hydrologic Alteration Associated with Dam Construction in a Medium-Sized Coastal Watershed of Southeast China. Water 2016, 8, 317. [Google Scholar] [CrossRef] [Green Version]
  47. Kriaučiūnienė, J.; Virbickas, T.; Šarauskienė, D.; Jakimavičius, D.; Kažys, J.; Bukantis, A.; Kesminas, V.; Povilaitis, A.; Dainys, J.; Akstinas, V.; et al. Fish assemblages under climate change in Lithuanian rivers. Sci. Total Environ. 2019, 661, 563–574. [Google Scholar] [CrossRef]
  48. Česonienė, L.; Dapkienė, M.; Punys, P. Assessment of the impact of small hydropower plants on the ecological status indicators of water bodies: A case study in Lithuania. Water 2021, 13, 433. [Google Scholar] [CrossRef]
  49. Zuo, Q.; Liang, S. Effects of dams on river flow regime based on IHA/RVA. Proc. IAHS 2015, 368, 275–280. [Google Scholar] [CrossRef] [Green Version]
  50. Abbasi, T.; Abbasi, S.A. Small hydro and the environmental implications of its extensive utilization. Renew. Sustain. Energy Rev. 2011, 15, 2134–2143. [Google Scholar] [CrossRef]
  51. Premalatha, M.; Abbasi, T.; Abbasi, S.A. A critical view on the eco-friendliness of small hydroelectric installations. Sci. Total Environ. 2014, 481, 638–643. [Google Scholar] [CrossRef] [PubMed]
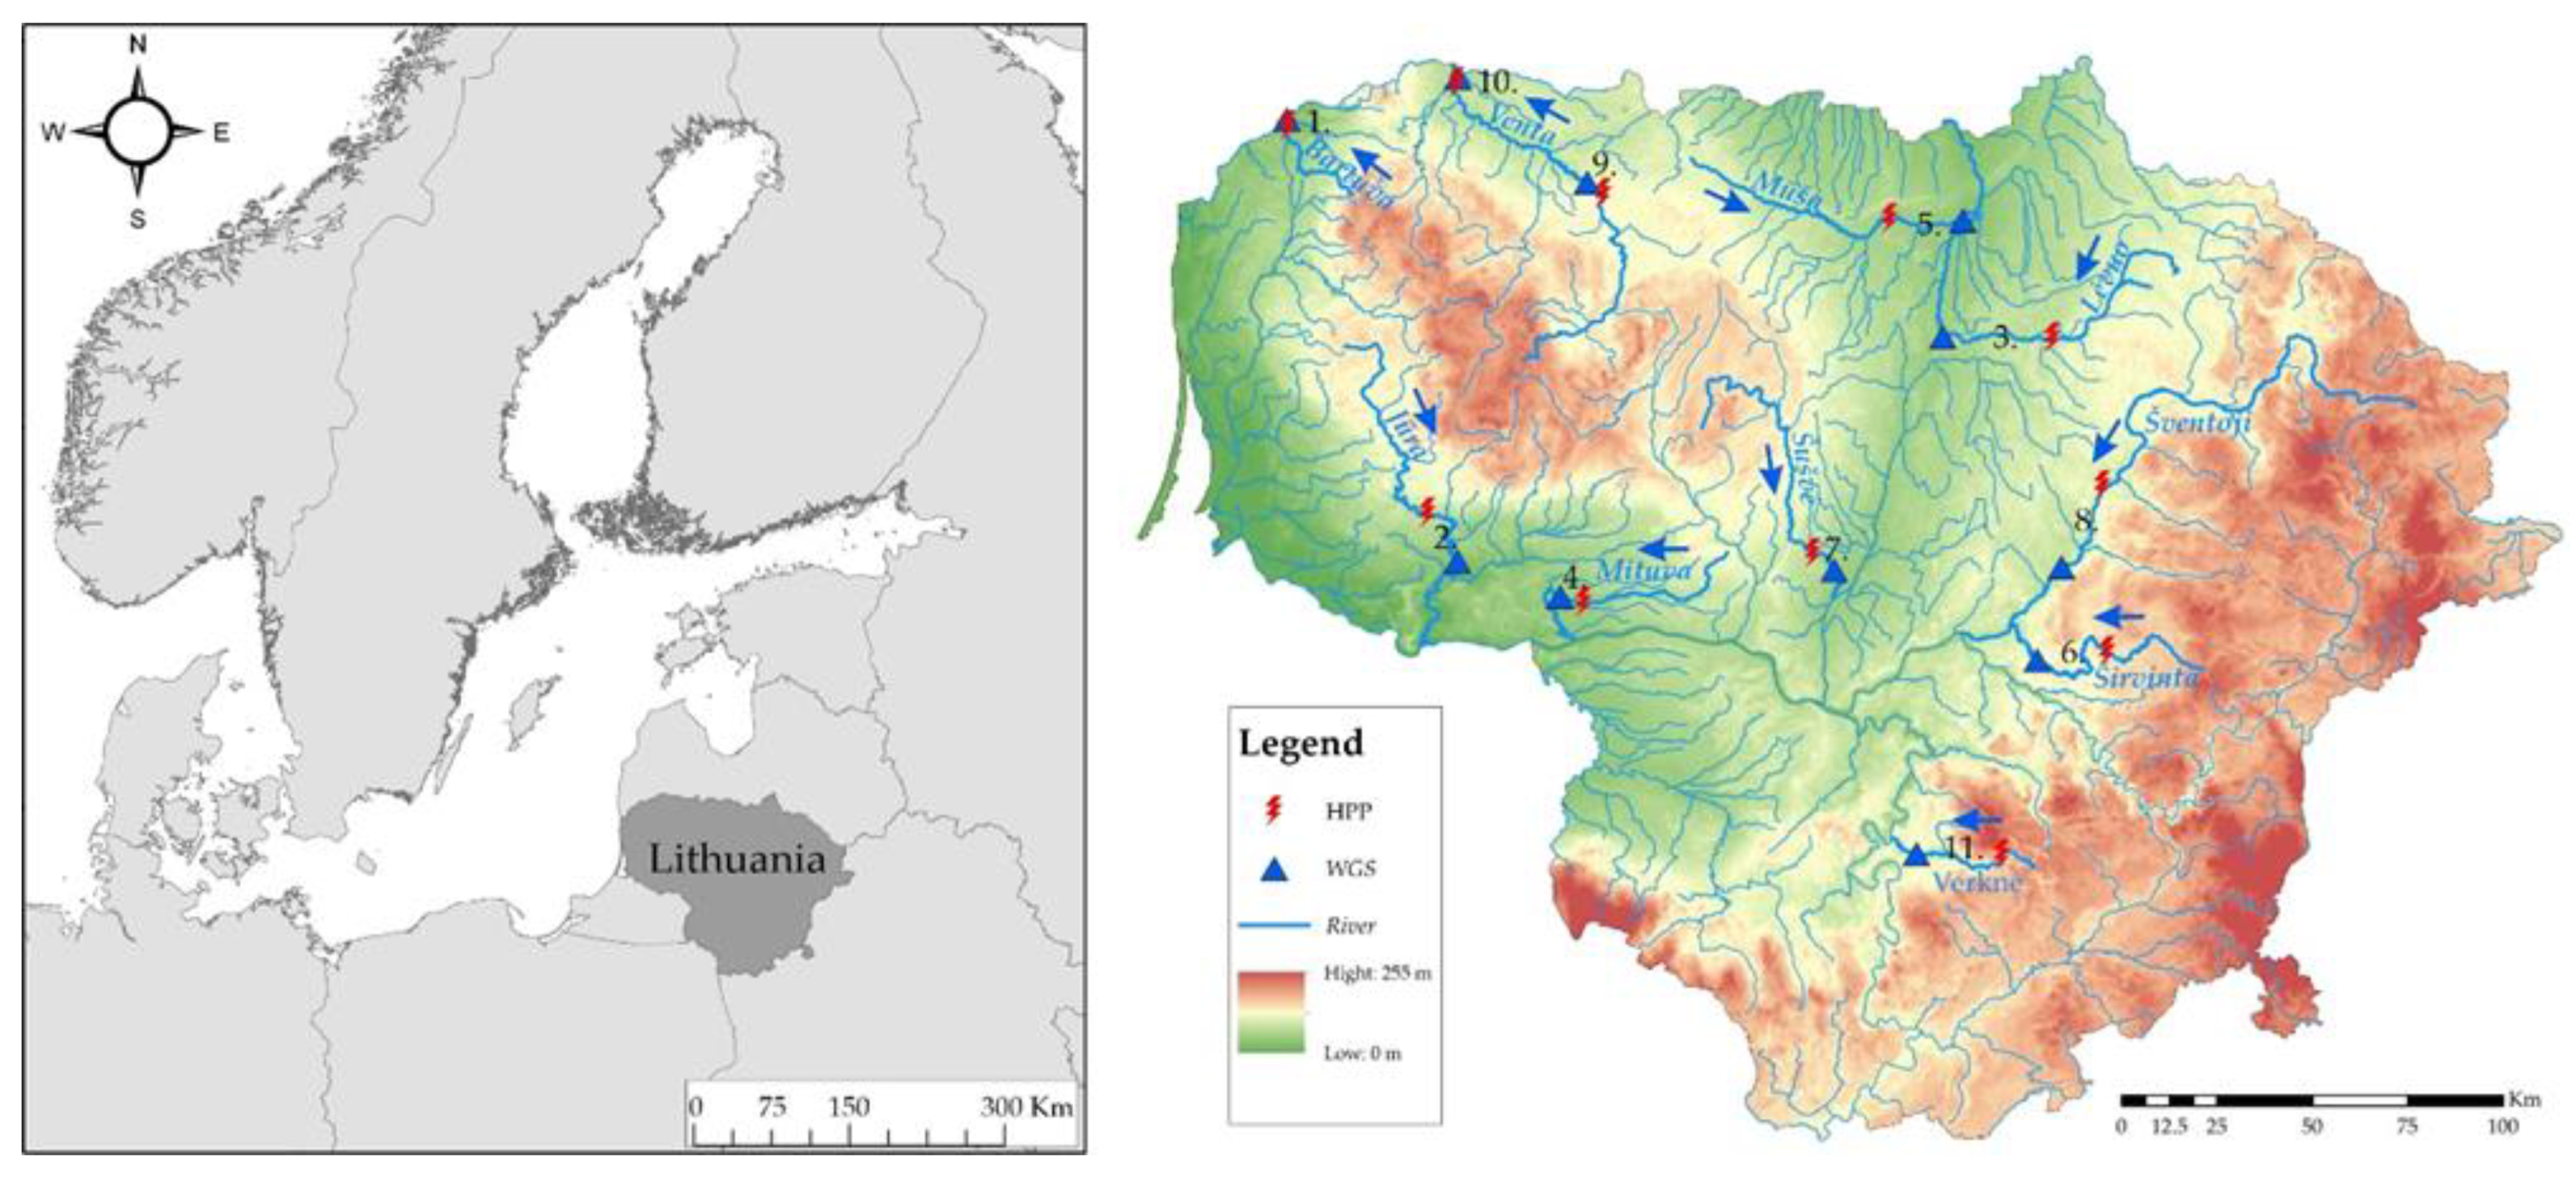
Figure 1. Study area.
Water 13 01961 g001
Figure 2. Monthly flow changes (in m3s−1) at Mituva-Žindaičiai WGS downstream of Girdžiai HPP.
Water 13 01961 g002
Figure 3. Changes (in m3 s−1) in extreme flow conditions: 1-day minimum flow (a) and 1-day maximum flow (b) recorded in the Bartuva downstream of Skuodas HPP; 90-day minimum flow (c) in the Mituva downstream of Girdžiai HPP.
Water 13 01961 g003
Figure 4. Changes in the number and duration of low pulses downstream of HPPs.
Water 13 01961 g004
Figure 5. The number of low pulses at Šušvė-Josvainiai WGS before and after construction of Angiriai HPP.
Water 13 01961 g005
Figure 6. The number of reversals at Lėvuo-Bernatoniai WGS before and after construction of Akmeniai HPP.
Water 13 01961 g006
Figure 7. Average changes of the IHA parameters groups at the studied WGSs.
Water 13 01961 g007
Figure 8. Hydrologic alteration of 7-day minimum (a) at Mūša-Ustukiai WGS and 3-day maximum (b) at Bartuva-Skuodas WGS.
Water 13 01961 g008
Figure 9. Hydrologic alteration of low pulses at Širvinta-Liukonys WGS.
Water 13 01961 g009
Figure 10. Hydrologic alteration of the number of reversals at Šušvė-Josvainiai WGS.
Water 13 01961 g010
Figure 11. The percentage of hydrologic indicators in each RVA category.
Water 13 01961 g011
Figure 12. The overall degree (%) of hydrologic alterations.
Water 13 01961 g012
Figure 13. Hydrologic alteration (in m3s−1) of extreme flow conditions (7-day maximum) in the Bartuva downstream of Skuodas HPP (a); in the Jūra downstream of Tauragė HPP (b).
Water 13 01961 g013
Table 1. Characteristics of the investigated hydropower plants.
No.RiverHPPConstruction YearInstalled Power, kWHead *, mQinst/Qma **Reservoir Surface Area, haReservoir Volume, Mm3Water
Retention
Coefficient ***
1.BartuvaSkuodas200022080.8085.92.3442.0
2.JūraBalskai20052900131.8328014.829.2
3.LėvuoAkmeniai1999352.10.639.40.159834
4.MituvaGirdžiai20032006.61.5357.51.0982.9
5.MūšaDvariukai200250051.16136.43.0586.1
6.ŠirvintaŠirvintai200218041.2451.90.882769
7.ŠušvėAngiriai2000125015.81.87248.315.512.2
8.ŠventojiKavarskas200215005.11.3978.31.42697
9.VentaRudikiai2002702.50.397.70.1023052
10.VentaKuodžiai20056004.50.5710.4841935
11.VerkneAukštadvaris200018015.51.51293.519.31.7
* The head is a vertical change in elevation between the head (reservoir) water level and the tailwater (downstream) level. ** The ratio of the installed and multiannual discharges. *** The water retention coefficient K is the ratio between the inflow into the reservoir (annual river runoff) and the reservoir volume.
Table 2. Characteristics of the water gauging stations.
No.RiverWGSInvestigation PeriodDischarge, m3s−1
Pre-Post-Qavg *Qavg **Qmin *Qmin **Qmax *Qmax **
1.BartuvaSkuodas1981–19992000–20188.796.910.7280.41983.755.9
2.JūraTauragė1991–20042005–201821.323.23.642.27237199
3.LėvuoBernatoniai1979–19981999–20183.873.770.4650.45931.224.6
4.MituvaŽindaičiai1987–20022003–20183.122.550.0750.06837.734.2
5.MūšaUstukiai1985–20012002–201812.110.11.190.79610688.3
6.ŠirvintaLiukonys1985–20012002–20186.566.461.270.95949.537.5
7.ŠušvėJosvainiai1981–19992000–20186.135.870.3870.31869.349.9
8.ŠventojiUkmergė1985–20012002–201844.840.913.815.0179150
9.VentaPapilė1985–20012002–201811.09.421.450.98786.861.4
10.VentaLeckava1991–20042005–201830.327.83.642.86217157
11.VerknėVerbyliškės1981–19992000–20185.345.201.671.8731.523.4
* The pre-impact value. ** The post-impact value.
Table 3. Analyzed IHA parameters and their role in the ecosystem (adapted from the IHA manual [39]).
IHA Parameter GroupsHydrologic ParametersEcological Role
1. Magnitude of monthly water conditionsMean value for each
calendar month
Habitat availability for aquatic organisms
Soil moisture availability for plants
Availability of water for terrestrial animals
Availability of food/cover for furbearing mammals
Reliability of water supplies for terrestrial animals
Access by predators to nesting sites
Influences on water temperature, oxygen levels, photosynthesis in water column
2. Magnitude and duration of annual extreme water conditionsAnnual minima, 1-day mean
Annual minima, 3-day means
Annual minima, 7-day means
Annual minima, 30-day means
Annual minima, 90-day means
Annual maxima, 1-day mean
Annual maxima, 3-day means
Annual maxima, 7-day means
Annual maxima, 30-day means
Annual maxima, 90-day means
Base flow index: 7-day minimum flow/mean flow for year
Balance of competitive, ruderal, and stress-tolerant organisms
Creation of sites for plant colonization
Structuring of aquatic ecosystems by abiotic vs. biotic factors
Structuring of river channel morphology and physical habitat conditions
Soil moisture stress in plants
Dehydration in animals
Anaerobic stress in plants
Volume of nutrient exchanges between rivers and floodplains
Duration of stressful conditions, such as low oxygen and concentrated chemicals, in aquatic environments
Distribution of plant communities in lakes, ponds, floodplains
Duration of high flows for waste disposal and aeration of spawning beds in channel sediments
3. Timing of annual extreme water conditionsJulian date of each annual 1-day maximum and 1-day minimumCompatibility with life cycles of organisms
Predictability/avoidability of stress for organisms
Access to special habitats during reproduction or to avoid predation
Spawning cues for migratory fish
Evolution of life history strategies, behavioral mechanisms
4. Frequency and duration of high and low pulsesNumber of low pulses within each water year
Mean duration of low pulses (days)
Number of high pulses within each water year
Mean duration of high pulses (days)
Frequency and magnitude of soil moisture stress for plants
Frequency and duration of anaerobic stress for plants
Availability of floodplain habitats for aquatic organisms
Nutrient and organic matter exchanges between river and floodplain
Soil mineral availability
Access for water birds to feeding, resting, reproduction sites
Influences on bed load transport, channel sediment textures, and duration of substrate disturbance (high pulses)
5. Rate and frequency of water condition changesRise rates: Mean of all positive differences between consecutive daily values
Fall rates: Mean of all negative differences between consecutive daily values
Number of hydrologic reversals
Drought stress on plants (falling levels)
Entrapment of organisms on islands, floodplains (rising levels)
Desiccation stress on low-mobility stream edge (varial zone) organisms
Table 4. Change (%) in the mean monthly flows (group 1 of IHA parameters).
ParametersJanFebMarAprMayJunJulAugSepOctNovDec
Mean decrease 1−10.6−12.9−15.6−28.4−23.2−35.2−27.2−13.2−19.7−10.9−9.14−7.24
Mean increase 23.7326.77.0914.914.72.5223.430.514.8227.317.122.8
Mean (IHA) 38.7517.914.827.222.532.324.127.416.619.914.215.7
1 Mean of negative values. 2 Mean of positive values. 3 Mean of absolute values given by the IHA program.
Table 5. Change (%) in the magnitude and duration of annual extreme flows (group 2 of IHA parameters).
Parameters1-Day Min3-Day Min7-Day Min30-Day Min90-Day Min1-Day Max3-Day Max7-Day Max30-Day Max90-Day MaxBase Flow Index
Mean decrease−24.5−23.3−18.8−15.7−20.0−22.6−22.3−21.2−19.0−12.9−11.5
Mean increase10.67.408.076.7412.1n/a *n/an/an/an/a11.7
Mean (IHA)22.019.015.913.215.022.622.321.219.012.911.6
* No positive values.
Table 6. Change (in days) in the means of the timing of annual extreme flows (group 3 of IHA parameters) and change (in %) in the mean frequency and duration of high and low pulses (group 4 of IHA parameters), as well as the rate and frequency of hydrologic changes (group 5 of IHA parameters).
ParametersGroup 3Group 4Group 5
Date of MinimumDate of MaximumLow Pulse CountLow Pulse DurationHigh Pulse CountHigh Pulse DurationRise RateFall RateNumber of Reversals
Mean decrease−13.9−21.2−29.7−59.7−16.00−15.6−27.3−20.442.5
Mean increase19.411.0221.036.78.8910.35.4315.347.5
Mean (IHA)16.418.4163.655.113.213.625.319.944.2
Table 7. Correlation coefficients (only greater than 0.7).
Reservoir Volume, Mm3, (X1)Reservoir Surface Area, ha (X2)Qinst/Qma (X3)
Hydrologic alteration (%) of 7-day max flow (Y)0.750.730.70
Publisher’s Note: MDPI stays neutral with regard to jurisdictional claims in published maps and institutional affiliations.

