Article

Trace Element Mobility during Corg-Enhanced Denitrification in Two Different Aquifers

1
Hydrogeology Department, Ruhr-Universität Bochum, Universitätsstraße 150, 44801 Bochum, Germany
2
School of Biological, Earth and Environmental Sciences (BEES), University College Cork, Distillery Fields, North Mall, T23 N73K Cork, Ireland
*
Author to whom correspondence should be addressed.
Water 2021, 13(11), 1589; https://doi.org/10.3390/w13111589
Submission received: 10 May 2021 / Revised: 30 May 2021 / Accepted: 1 June 2021 / Published: 4 June 2021
(This article belongs to the Section Hydrology)

Abstract

:
Nitrate (NO3)-polluted groundwater treatment by enhanced denitrification is becoming increasingly important due to rising NO3 concentrations and decreasing degradation capacities in aquifers. Besides evaluating the efficacy of substrates added to trigger denitrification, secondary reactions must be closely monitored. Biodenitrification by applied organic carbon (Corg) can lead to considerable changes in redox potential (Eh) and pH, two decisive parameters for trace element mobility. In this study, two geologically and hydrogeochemically different groundwater catchments important for drinking water production were investigated and compared. Sediments were analyzed for trace elements as well as sulfur (S) and carbon (C) contents. Ongoing hydrogeochemical reactions were evaluated with depth-specific isotope characterization, and the potential for trace element mobilization by Corg addition was determined in column experiments. Results for enhanced denitrification showed up to 3.8 times lower reaction rates with respect to comparable studies, probably due to incomplete formation of the necessary denitrifying bacteria. Concentrations of trace elements such as nickel (Ni) must also be considered when evaluating enhanced denitrification, as these can negatively affect microorganisms. Added ethanol led to Ni concentrations dropping from 0.013 mg/L to below the detection limit. Thus, Corg addition may not only induce denitrification, but also lead to the immobilization of previously released trace elements.

1. Introduction

Nitrogen (N) fertilizers are an important nutrient source for increasing agricultural productivity [1]. Excess N enters water as nitrate (NO3). This results in the global problem of NO3 pollution of surface and groundwaters and consequently in the limit values for drinking water quality in affected water bodies being exceeded [2,3]. Nitrate as well as nitrite (NO2) have been shown to have adverse effects on human health and the environment [4,5]. In addition, besides the decreasing NO3 degradation capacity of aquifers, an increase in NO3 concentrations is expected in the future due to the scarcity of water resources triggered by climate change [6]. Consequently, the development and improvement of treatment methods and strategies is of great importance. The best known and most effective treatment process is NO3 removal by biological denitrification enhanced by organic carbon (C) (e.g., [7,8]). Denitrification is the reduction of NO3 to harmless N2 gas using an electron donor [4]. In the environment, denitrification occurs when the oxygen concentration is low, an electron donor is available, and denitrifying bacteria are present for catalysis [9]. Since the geogenic NO3 degradation capacity of aquifers continues to decrease and is finite, electron donors can be added to the waters for treatment. Thus, it is possible to treat waters with the addition of pure organic C compounds such as glucose, methanol, or acetate, or to test different mixing ratios of organic carbon (Corg) such as glycerol and ethanol for their denitrification potential [3,10,11]. Furthermore, enhanced denitrification is also possible with more complex solids such as bamboo biomass, sawdust, or pine bark [12,13,14]. However, since liquid C can be more easily injected into the aquifer, the denitrification potential of wine production wastes and whey has already been investigated [15,16]. Besides the addition of an electron donor, the feeding strategy is also important for effective use [8]. When using different C for induced denitrification, the groundwater temperature must also be taken into account, as the organic substrates differ in terms of effectiveness at different temperatures [17].
To investigate natural or induced denitrification in more detail, isotope characterizations are a very useful tool. During NO3 reduction, unreacted NO3 is enriched in the heavy isotopes 15N-NO3 and 18O-NO3 [18]. If lithotrophic NO3 reduction occurs and sulfate (SO42−) is released, the light isotopes 34S-SO42− and 18O-SO42− accumulate. Likewise, the light isotopes 13C-DIC accumulate during organotrophic NO3 reduction by organic C [19].
During NO3 reduction, secondary reactions such as the mobilization of unwanted trace elements can occur. Trace metals and metalloids such as As, Ni, or Co can have an impact on ecosystems and human health, just like NO3 or NO2 [20]. These trace elements can often be incorporated into the mineral lattice of sulfides such as pyrite (FeS2) [21]. In several aquifers the mobilization of trace elements from pyrite-rich sediments has been observed (e.g., [22,23,24]). In redox transition zones, sulfides are often present in the reduced section and (hydr)oxides in the oxidized section, so trace elements may be hosted by reduced mineral phases but also sorbed to (hydr)oxide surfaces [25,26]. Redox milieu, pH, and ionic competition are crucial parameters that control the behavior (mobilization or refixation) of trace elements. Consequently, reducing conditions can lead to mobilization from (hydr)oxides, while oxidizing conditions can lead to mobilization from sulfides. This behavior can be decisively altered by pH, with the effect that pH strongly influences mobilization (e.g., [27,28]). Trace element mobilization can also occur in aquifers with re-infiltrated water where pH has been altered by CO2 application [29].
Since the redox conditions and pH in particular can be strongly influenced and changed during biological denitrification enhanced by organic C, it is of great importance for water production if trace elements which may not have caused any problems previously are also mobilized during induced NO3 reduction. Therefore, in this study, the contents of trace elements were determined in the sediments of two important water catchments in Germany. The sulfur (S) and C contents of the sediments necessary for the geogenic NO3 degradation capacity were determined, and current processes of denitrification were analyzed by isotope ratio quantification (N, S, C). Consequently, the mobilization of selected trace elements by induced NO3 reduction by addition of ethanol was explored in column experiments.

2. Materials and Methods

2.1. Study Area

Two study areas in Germany were selected to analyze the mobilization of trace elements in drinking water catchments by comparing the different conditions due to geology and agricultural influences. In this paper, sediment and water samples were analyzed in drinking water catchments located in the Lower Rhine Embayment and the Haltern Formation (Fm.), respectively.

2.1.1. Water Production in the Lower Rhine Embayment

The first study area was located in North Rhine-Westphalia near the city of Krefeld and close to the river Rhine. The Lower Rhine Embayment is a lowland plain, geologically an intraplate tectonic rift structure. Variscan Rhenish Massif erosion filled the Lower Rhine Embayment with a characteristic sequence of Tertiary marine and terrestrial sediments. The Quaternary overlies the Tertiary, with fluvial coarse sands and gravel (depositional terraces of the river Rhine). In this location, the Quaternary has a thickness of about 37 m and is in direct hydraulic contact with the underlying Tertiary. Screened at a depth of about 40 m b.g.l., water production involves 4 shallow wells, with 4 deeper wells screened at a depth of about 160 m b.g.l. Geochemically, a horizontal redox boundary was able to be detected at about 50 m b.g.l., shortly below the Quaternary–Tertiary boundary (Figure 1a). Nitrate-contaminated groundwater from the Quaternary flows into the Tertiary due to the production wells. Lithotrophic NO3 reduction has good potential in the Tertiary sands, with an average sulfide-S (Ssulf) content of 1.2 g/kg [30]. Associated is the potential of trace element-rich sulfides such as pyrite (FeS2). Consequently, the mobilization of co-hosted trace elements by NO3 reduction may be high.

2.1.2. Water Production in the Haltern Fm

The second study area was also located in North Rhine-Westphalia, in the wider surroundings of the city of Dorsten and the area of the river Lippe. The Upper Cretaceous Haltern Fm. was formed in the Münsterland Cretaceous Basin and covers an area of about 770 km2. The Haltern Fm. reaches a thickness of more than 300 m and represents a regionally important pore aquifer for drinking and industrial water supply. The predominantly fine-to-medium sandy (locally also silty-to-fine gravelly) sediments were deposited in the southwestern part of the Münsterland Cretaceous Basin by the southward progressing sea. Geochemically, the sediments of the Haltern Fm. are almost pure quartz sands (SiO2), with a proportion of iron compounds such as iron hydroxide (FeO(OH)), iron sulfide (pyrite, FeS2), or iron carbonate (siderite, FeCO3). At the near-surface, oxidized zone of groundwater oscillation, amorphous iron hydroxides can be formed as so-called “bog iron ores” [31]. The potential for mobilization of trace elements incorporated in the mineral lattice of sulfides or sorbed to hydroxides is thus also high in this area.
In contrast to the Tertiary sands in the Lower Rhine Embayment, the Haltern Fm. is overlain by Cretaceous sediments such as clay and sand marls of the Bottrop Fm. (Figure 1b) in large parts of the catchment. This marl layer has a thickness of up to 60 m and serves as a protective layer above the Haltern Fm. as there is no hydraulic contact with the Quaternary sediments above the Bottrop Fm. Consequently, the water at the edge of the Bottrop Fm. dives under it and flows towards the well gallery.

2.2. Sampling

Drilling in the Quaternary–Tertiary aquifer was carried out to a depth of about 40 m b.g.l. using the dry drilling method and core drilling in the Tertiary. From numerous samples of the entire thickness, 30 samples were selected and geochemically analyzed in greater detail. Hydrochemical data were provided by the water supplier and had already been evaluated through the first geochemical analyses by Ortmeyer et al. [30]. Sampling for isotopic analysis was conducted at a multilevel well at all 11 filter depths (with the deepest filter at 156 m b.g.l.).
In a drinking water production area located in the Haltern Fm., an observation well bundle with 5 different filter depths was created, where sediment sampling was performed during drilling of the deepest observation well (99 m). At this borehole, rotary drilling was applied. Until further processing, sediment sample bags were fumigated with argon to avoid contact with atmospheric O2. Afterwards, samples were stored at −20 °C. Twenty samples were selected and geochemically analyzed in more detail. Water analyses were also provided by the water supplier. Isotopic analysis was conducted on the water samples from all 5 filter depths.

2.3. Sediment Analysis

Prior to the geochemical analysis, sediments were ground to powder grain size (mill: TS250, Siebtechnik GmbH). Sulfur and C contents were determined using a combustion analyzer (type: G4 Icarus, Bruker; at Ruhr-University Bochum) for sediments of the Quaternary–Tertiary aquifer. Sediments of the Quaternary could not be analyzed for S and C content because sampling was not possible immediately after drilling and the sediment was in contact with atmospheric oxygen for several days. The Ssulf and Corg contents of the Quaternary–Tertiary aquifer were previously presented in Ortmeyer et al. [30]. For the comparison of these 2 study areas, the data were processed comparatively, in addition to other analyses. Determination of S and C contents of the sediments of the Haltern Fm. aquifer was carried out in a time-delayed manner with the CS 580 Carbon Sulfur Determinator (Eltra, at Westfälische Wilhelms University Münster).
Bulk geochemical analyses were performed on the grounded sediments using INAA (Instrumental Neutron Activation Analysis, Activation Laboratories Ltd., Ontario, Canada, CA) for a total of 64 elements, of which selected ones are presented in this study. Results were analyzed using the IBM SPSS Statistics 27 software by Spearman correlation analyses. Only the sediments of the Tertiary and the Haltern Fm. were included in the correlations in order to evaluate the zones of the aquifers where trace elements could be mobilized. When evaluating, it must be considered that the mill used is made out of a tungsten carbide material with Co binding. Therefore, the absolute values of Co cannot be used. Consequently, relative changes of Co in the sediment contents were evaluated in this study.
Non-ground samples were additionally investigated by a scanning electron microscope (SEM) (Zeiss Merlin Gemini 2, preparation gold coating: Cressington Sputter Coater 208 HR, Ruhr-University Bochum).

2.4. Isotopic and Water Analysis

A total of 16 water samples were analyzed for N and oxygen (O) isotopes in NO3, S and O isotopes in SO42− and C isotopes in dissolved inorganic C (Cinorg). The δ15N-NO3 and δ18O-NO3 ratios were determined at the Technical University of Dresden using the Delta V Plus mass spectrometer (Thermo Fisher Scientific). Samples were stored at −20 °C until analysis. The determination of δ15N-NO3 and δ18O-NO3 was performed with microbial conversion of NO3 to N2O according to the denitrification method of Zhu et al. [32] and further developed according to Stock et al. [33]. The international standards for calibration are USGS 34, EA-Lab. 13, and IAEA NO3 (−1.8‰ to 9.8‰).
Determination of isotope ratios in SO42− was carried out at the Westfälische Wilhelms University Münster using the Delta V Advantage mass spectrometer from Thermo Scientific. For δ34S-SO42− and δ18O-SO42− ratios, a Flash-EA-IsoLink-CN Elemental Analyzer was also used. The Vienna-Canyon Diablo Troilite (VCDT) was taken as the standard for S and the Vienna Standard Mean Ocean Water (VSMOW) was taken as the standard for O.
Carbon isotopes in Cinorg13C-DIC) were determined at Ruhr University Bochum using a mass spectrometer (ThermoFisher Scientific MAT253 with GasBench II and ConFloIV) following 2-point calibration with IAEA-603- and NBS18-certified standard. Notations are expressed in δ‰ (δ = ((Rsample − Rstandard)/Rstandard), where R is the ratio between the heavy and the light isotopes). δ13CPDB and δ18OPDB in sediment were determined with the same devices.
Hydrochemical data were provided by the water supplier and were previously evaluated for the Quaternary–Tertiary aquifer in Ortmeyer et al. [30]. The data are discussed comparatively in this study. Water analyses of the Haltern Fm. study area were analyzed by the laboratory of the local water supplier using ion chromatography (Dionex ICS–1100, Thermo Scientific) for anions.

2.5. Circulation Column Experiments

In addition to the geochemical and hydrogeochemical characterization of the 2 study areas, circulation column experiments were conducted to evaluate the NO3 degradation and to investigate the mobilization of selected trace elements.
Columns were divided into 2 parts, with the lower part for sediment (height: 35 cm, diameter: 18.3 cm, volume: 9.2 L), and the upper part for the water reservoir (height: 16.2 cm, diameter: 11 cm, volume of 1.54 L). In the lower part, sediments (remolded material) of the study areas from the depths of the redox boundaries (Quaternary–Tertiary aquifer at the site of the borehole at 38–43 m b.g.l. and Haltern Fm. 75–86 m b.g.l, respectively) were filled and slightly compacted. The hydraulic conductivity values of the sediments were 5 × 10⁻⁵ and 1 × 10⁻⁴ m/s, respectively. A 2–3 cm thick filter gravel layer was also installed. Near-surface groundwater with high NO3 concentrations from the catchment areas was used in the circulation column experiments to simulate the contact of NO3 containing groundwater with sediment which contains a NO3 degradation capacity.
The experiments were carried out in a circulation system, where the water flowed through the columns from bottom to top. The flow rate was maintained at a constant rate of 1.7 × 10⁻⁴ L/s using a piston pump (ISMATEC). At this flow rate, the water in the column was replaced about 4 times per day. Ortmeyer et al. [17] were able to prove that NO3 degradation does not always follow thermodynamics and it is therefore necessary to take temperature into account. Consequently, experiments were carried out at the average groundwater temperature in Germany (10 °C) and permanently monitored with a temperature logger. A cooling tube was directly in contact with the setup. Columns were additionally insulated with aluminum foil to avoid temperature fluctuations and to save energy. The experimental setup can be seen in Ortmeyer et al. [17].
Sampling was performed once a week and pH, redox potential (Eh), electrical conductivity (EC), and oxygen concentrations (O2) were determined in addition to anions, cations, and trace elements. Water samples were filtered (0.2 µm) before analysis, and anion concentrations (NO3, NO2, SO42−, Cl, and F) were quantified by IC (Compact pro, Metrosep column, Metrohm, Ruhr-University Bochum). In a larger interval, major cation concentrations were analyzed using ICP-OES (Optima 8300, Perkin Elmer, Fraunhofer Institute Bochum) to avoid taking too-large amounts of water out of the system. The acid and base capacities were determined by titration with 0.1 M HCl and NaOH, respectively. To investigate the mobilization of trace elements, arsenic (As) (ICP-MS, Agilent 7900), cobalt (Co), chromium (Cr), nickel (Ni), vanadium (V), and zinc (Zn) (ICP-OES, Agilent 5100) were selected and analyzed by IWW (Rheinisch-Westfälisches Institut für Wasser Beratungs- und Entwicklungsgesellschaft mgH, Mülheim an der Ruhr).
When denitrification no longer occurred in the circulation column experiments due to the geogenic degradation capacity of the sediments, 5 mmol ethanol was added to the columns to enhance NO3 degradation. Ethanol was selected as the organic C source because it is particularly suitable for groundwater temperatures of 10 °C [17].
Sediments from the column experiments were analyzed before and after the addition of organic C. The column experiments were opened carefully and very briefly. Sediment was removed over the entire length using a tubular rod (inner diameter 0.5 cm) and the sediment in the column was again compacted evenly. Using this method, the columns do not have to be opened completely and can be further used for the next experimental step with the addition of organic C. After completion of the experiment, sediment was again collected along the entire length of the column. The removed sediments were analyzed for S and C contents as described in Section 2.3 (CS 580 Carbon Sulfur Determinator, Eltra, at Westfälische Wilhelms University Münster). In addition, a further investigation of the sediment was carried out with a redox inversion in the extraction process with ammonium oxalate. In this case, amorphous and crystalline metal oxides and hydroxides possibly precipitated during column experiments were redissolved in order to quantify the trace elements sorbed to them. As described above, contents of As (ICP-MS, Agilent 7900), Cr, Co, Ni, V, and Zn (ICP-OES, Agilent 5100) were analyzed.

3. Results

Obtained results are presented in this chapter, subdivided into the study areas of the aquifer in the Quaternary–Tertiary and the aquifer in the Haltern Fm.

3.1. Sediment Analysis

3.1.1. Quaternary–Tertiary Aquifer

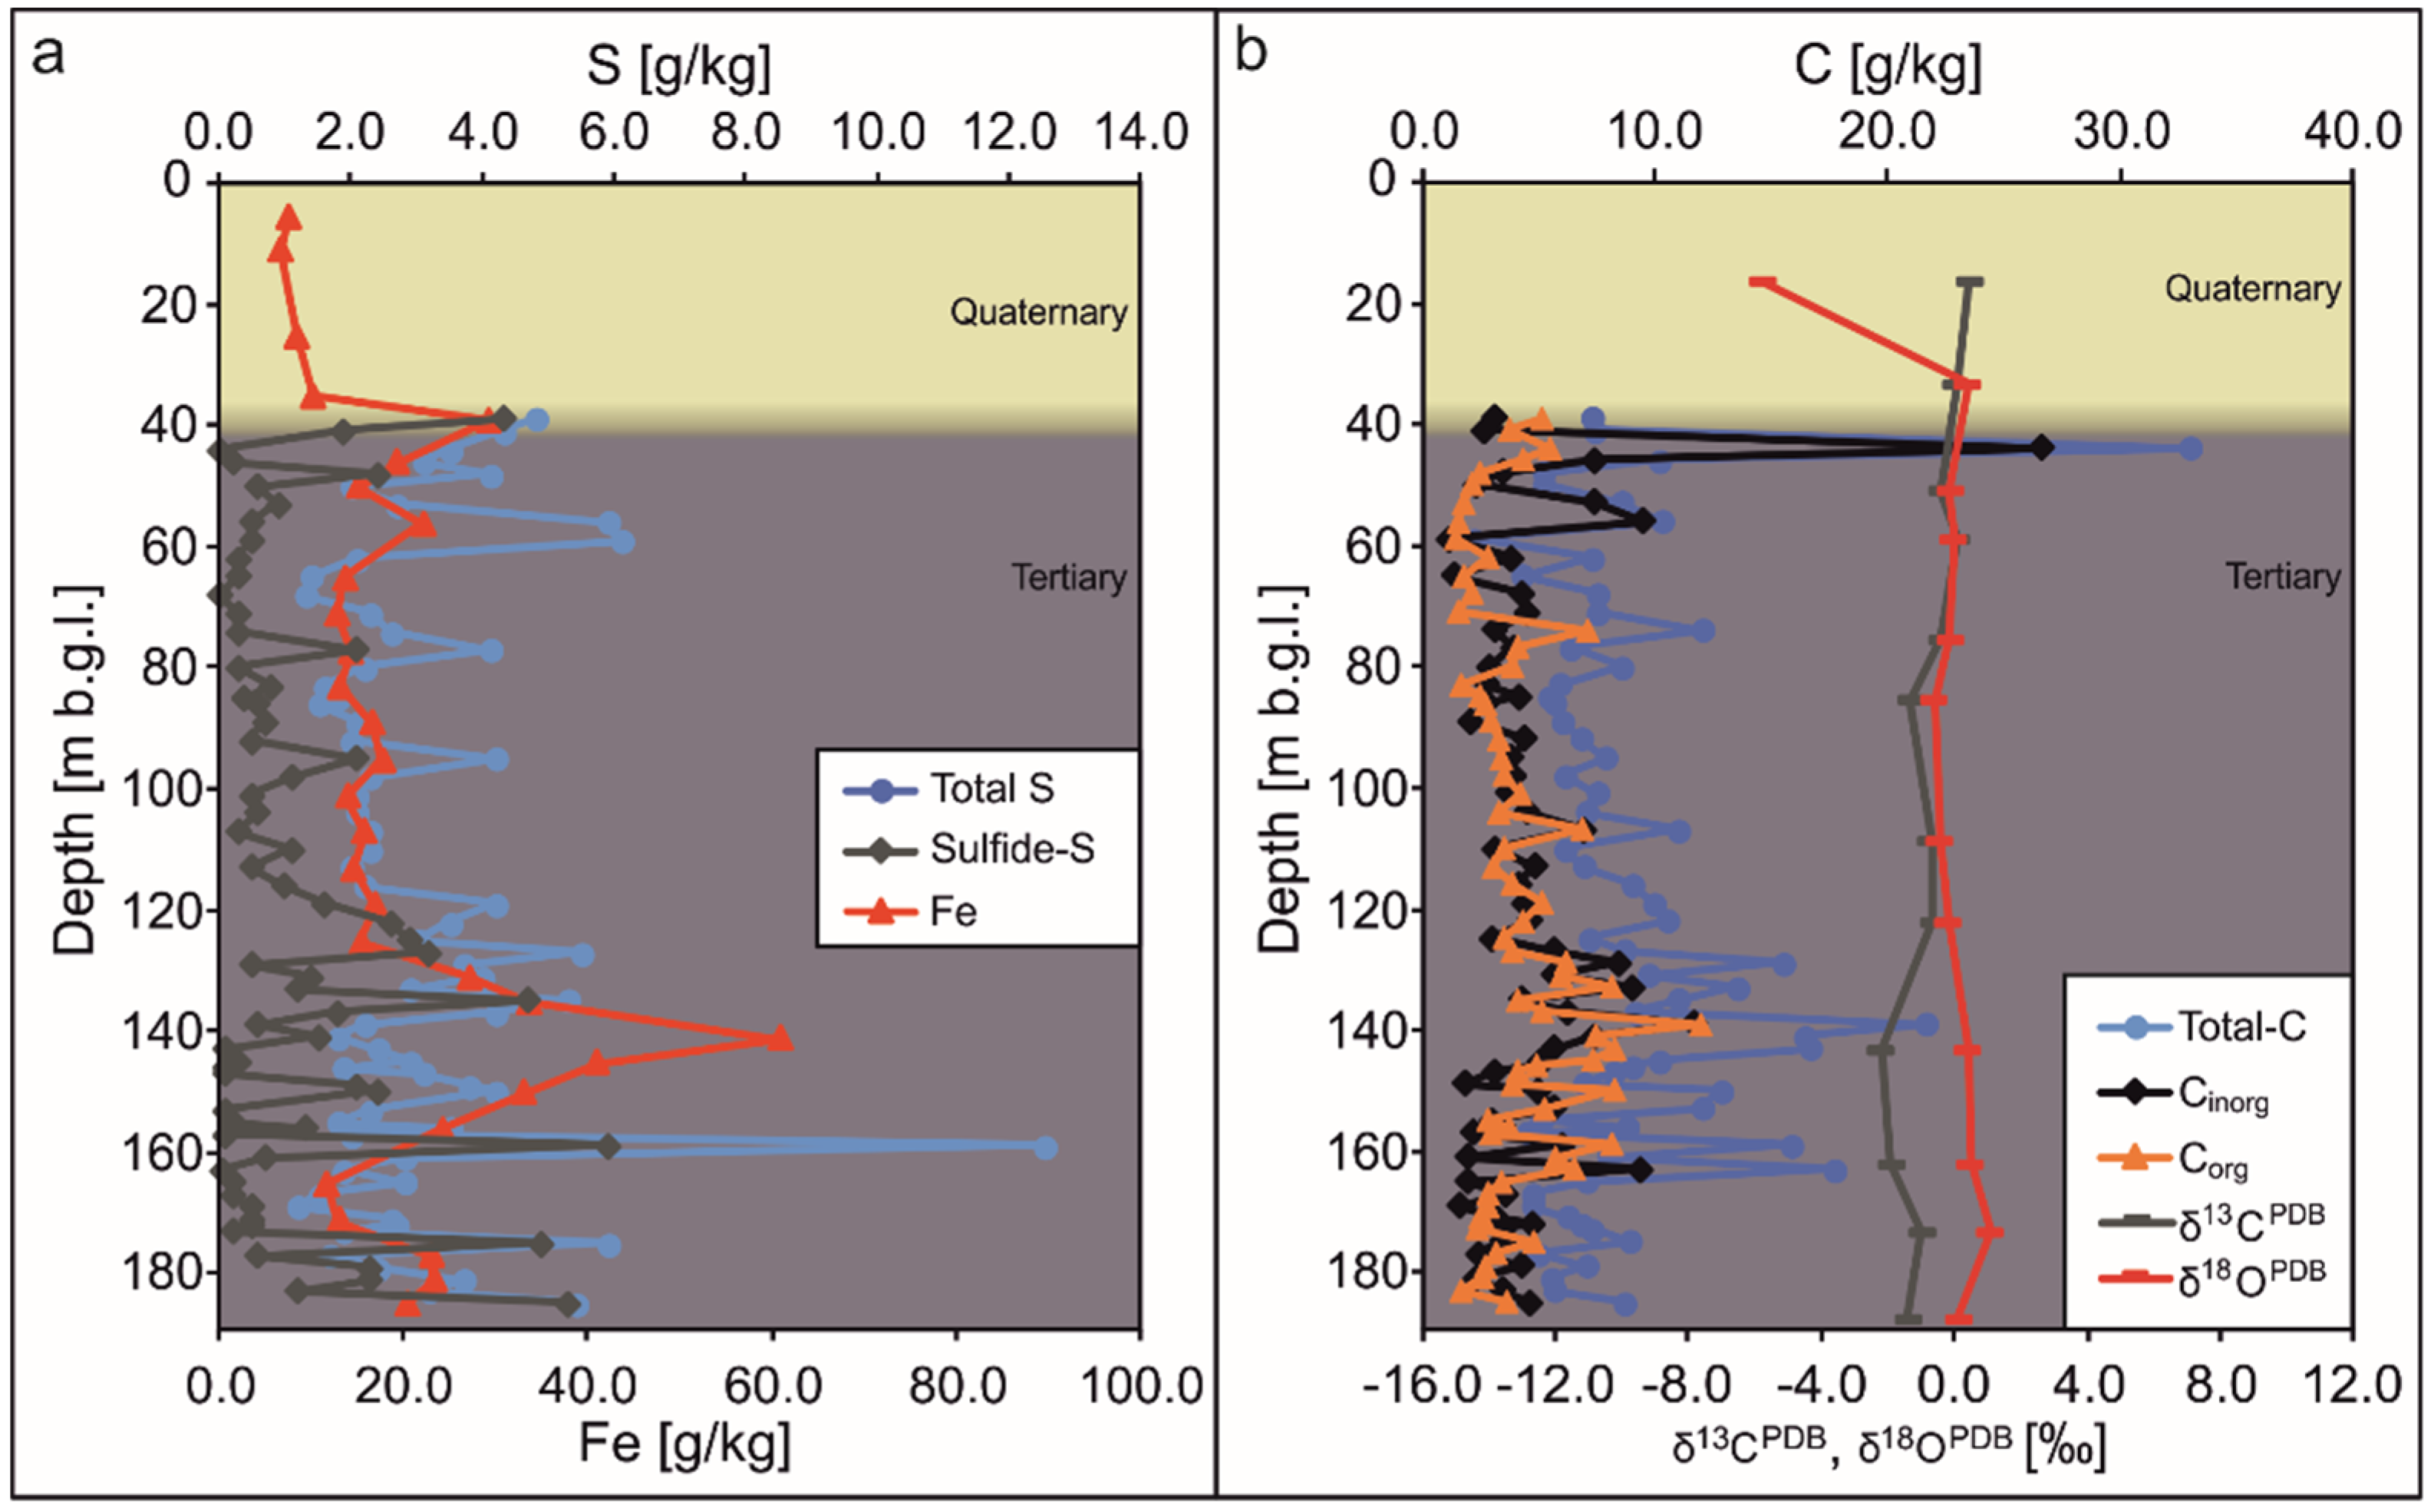
Total S (Stot) content varied over the entire thickness of the aquifer, mainly between 1.2 and 6.1 g/kg (Figure 2a). Only at 159 m b.g.l. did the Stot increase to a maximum of 12.5 g/kg. The average content was 3.1 g/kg. Ssulf showed two measurements below the detection limit (0.05 g/kg) and a maximum of 5.9 g/kg in 159 m. Thus, the maximum values of Stot and Ssulf were each found at this depth. The mean Ssulf content was 1.2 g/kg [30]. The Fe content in the Quaternary ranged from 6.6 to 10.1 g/kg, which was considerably lower than the Tertiary mean value of 21.6 g/kg. This is consistent with the observation of high NO3 concentrations in the Quaternary. Consequently, the sediments were expected to be almost completely oxidized and contain hardly any sulfide minerals such as pyrite (FeS2), resulting in a lower iron content in the Quaternary. In the Tertiary, Fe contents varied between 11.6 and 60.7 g/kg. The maximum was found to be similar to the S contents at greater depths, but was already present at 141 m.
Total C contents ranged from 2.2 to 33.0 g/kg, with the 44 m b.g.l. sample showing the maximum directly at the top of the Tertiary (Figure 2b). The average total C (Ctot) content was 8.93 g/kg. Furthermore, the content of Cinorg showed a maximum of 26.6 g/kg at the 44 m depth, with other values ranging from 1.1 to 11.7 g/kg, with a mean value of 4.67 g/kg. Corg showed no expressed maxima and ranged between 1.4 and 12.0 g/kg. On average, the Corg content was 4.2 g/kg [30]. δ13CPDB was very homogeneous down to 183 m b.g.l., and ranked between −2.7 and 0.5 ‰. Here, the Quaternary and Tertiary ratios did not deviate noticeably. The δ18OPDB ratio of 15 m (−5.7‰) differed from the rest of the samples. Further samples showed ratios for δ18OPDB between −0.57 and 1.13‰. Thus, C isotope ratios of the sediments were very uniform.
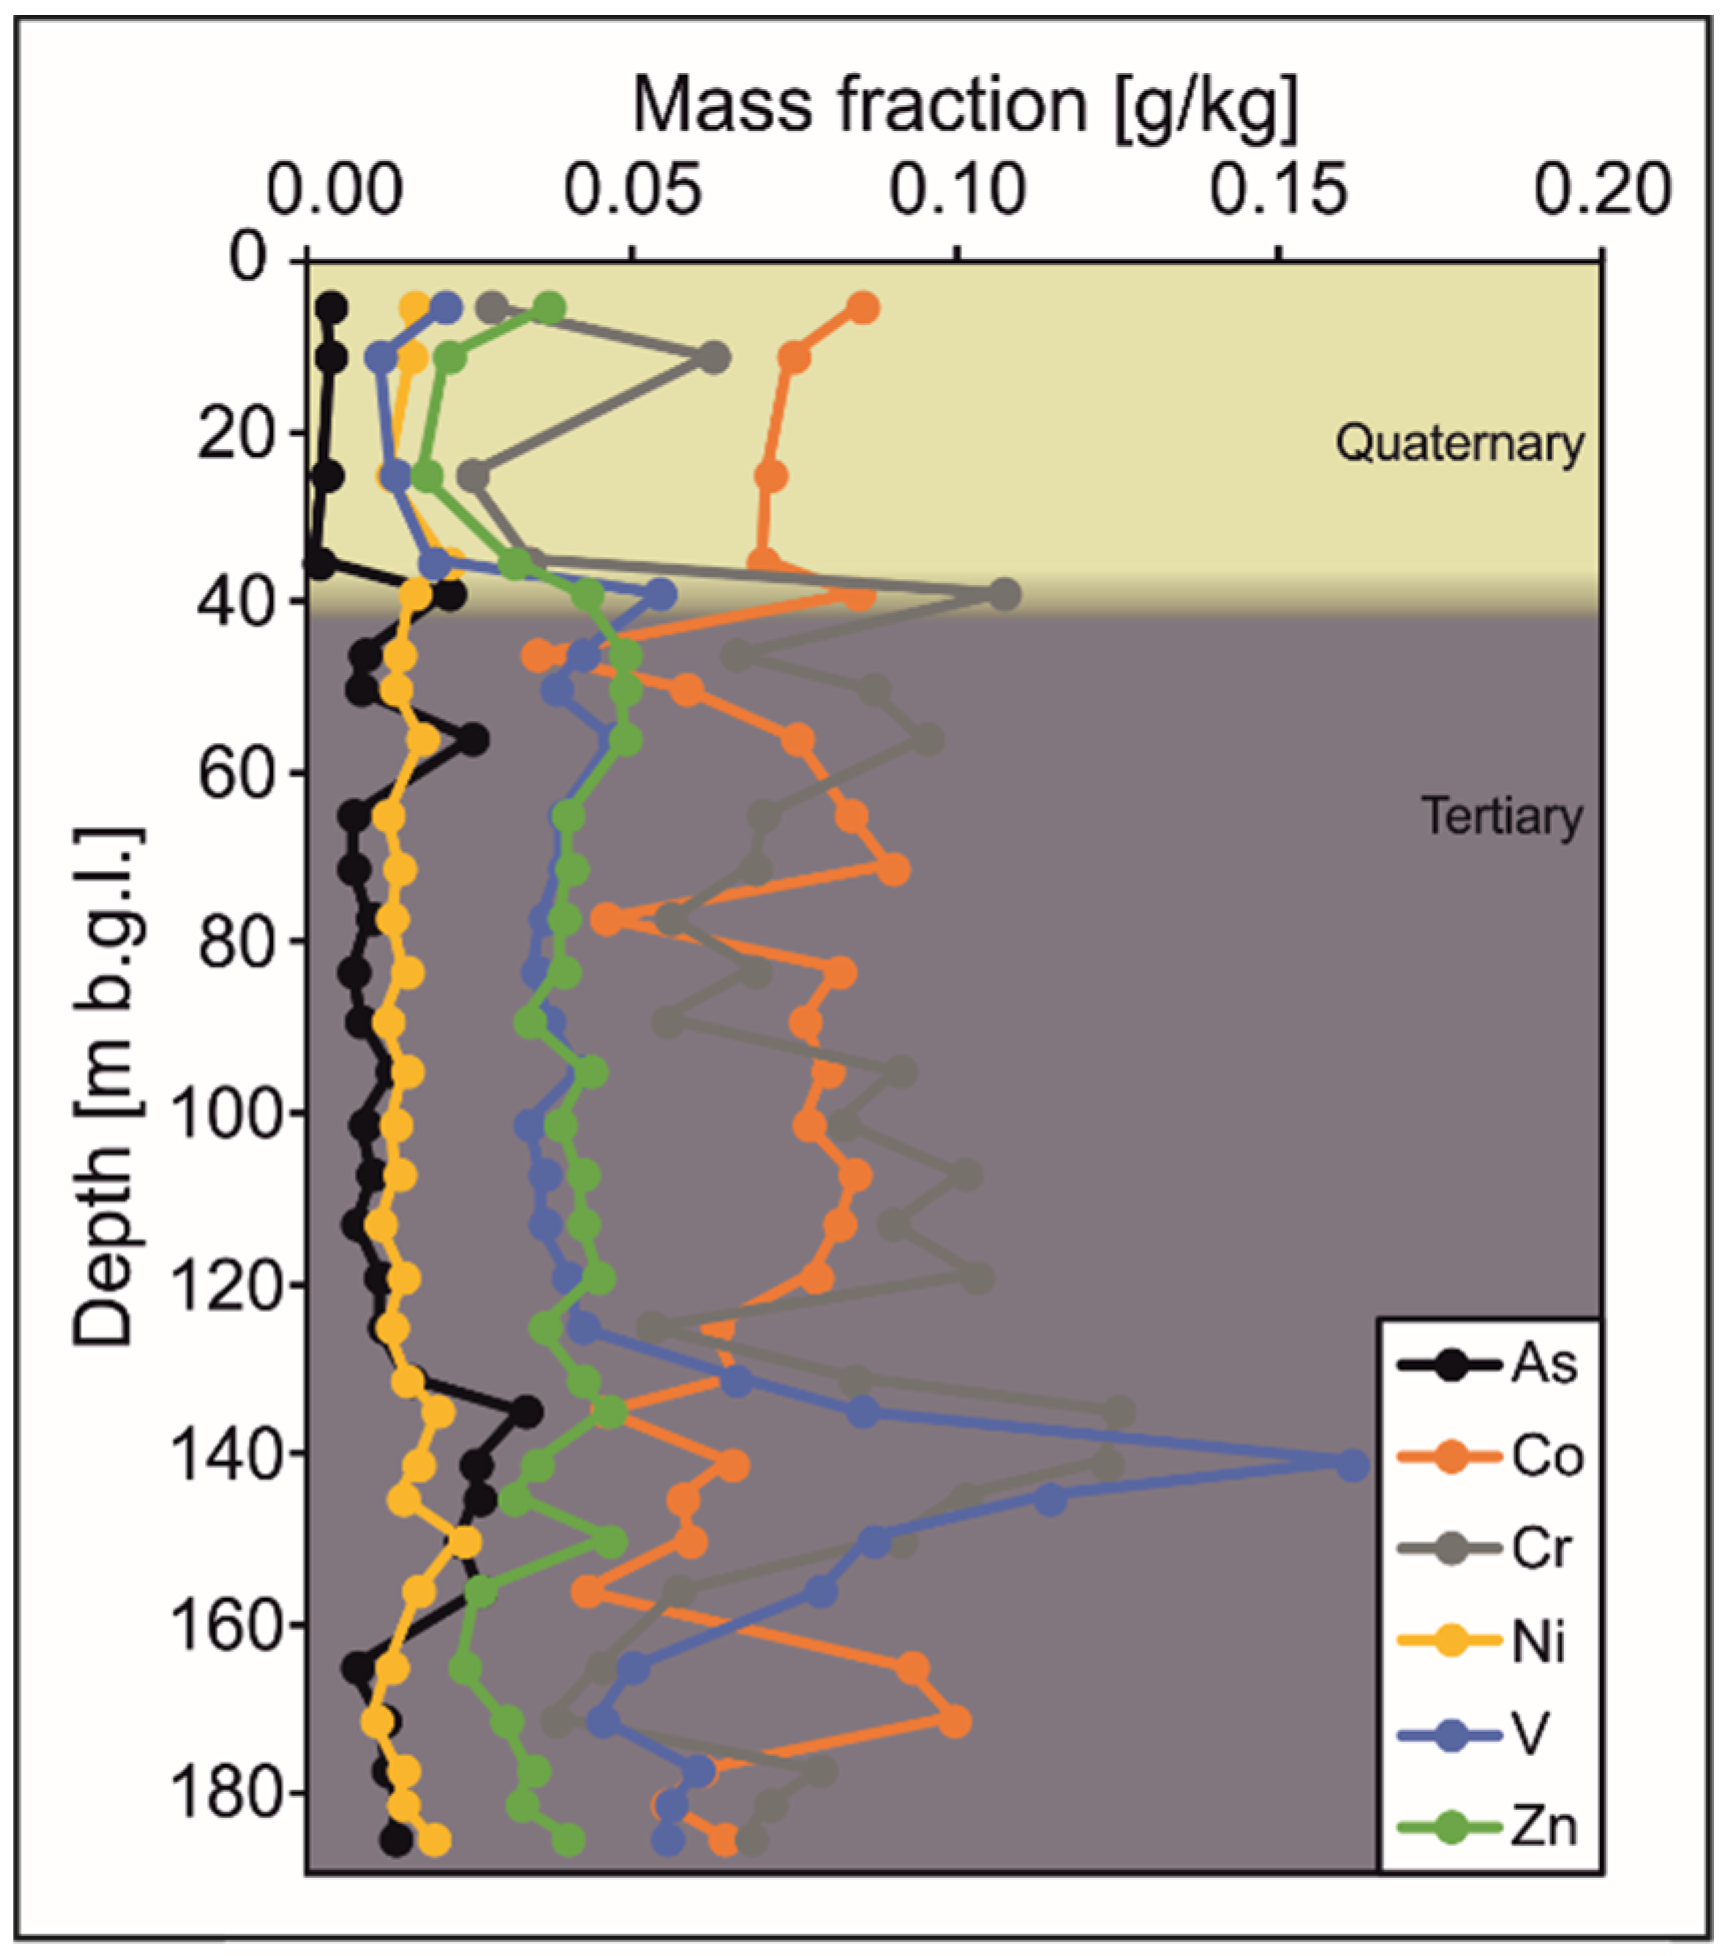
Figure 3 shows the contents of the selected trace elements As, Co, Cr, Ni, V, and Zn in the Quaternary–Tertiary aquifer. Like the S and C contents, trace element contents differed between the Quaternary and Tertiary. For most elements, higher contents were present in the Tertiary as compared to the Quaternary. Only Co contained an average of 0.077 g/kg in the Quaternary, decreasing slightly to an average of 0.069 g/kg in the Tertiary. Overall, Co content varied between 0.035 and 0.1 g/kg. As and Ni were present in the sediment in low contents, with averages of 0.013 and 0.015 g/kg. Slightly higher values were found for Zn, but these values varied as little as As and Ni. The average contents in the Quaternary (0.03 g/kg) and in the Tertiary (0.039 g/kg) differed slightly more than in the case of the trace elements mentioned above. The contents of Cr, which ranged between 0.025 and 0.125 g/kg, showed considerably more fluctuations. Values of V were very uniform but showed a sharp increase at 131 and 156 m depth, with a maximum of 0.161 g/kg. In the same depth range, an increase in Cr content and slight increases in the other trace elements were also noticeable.
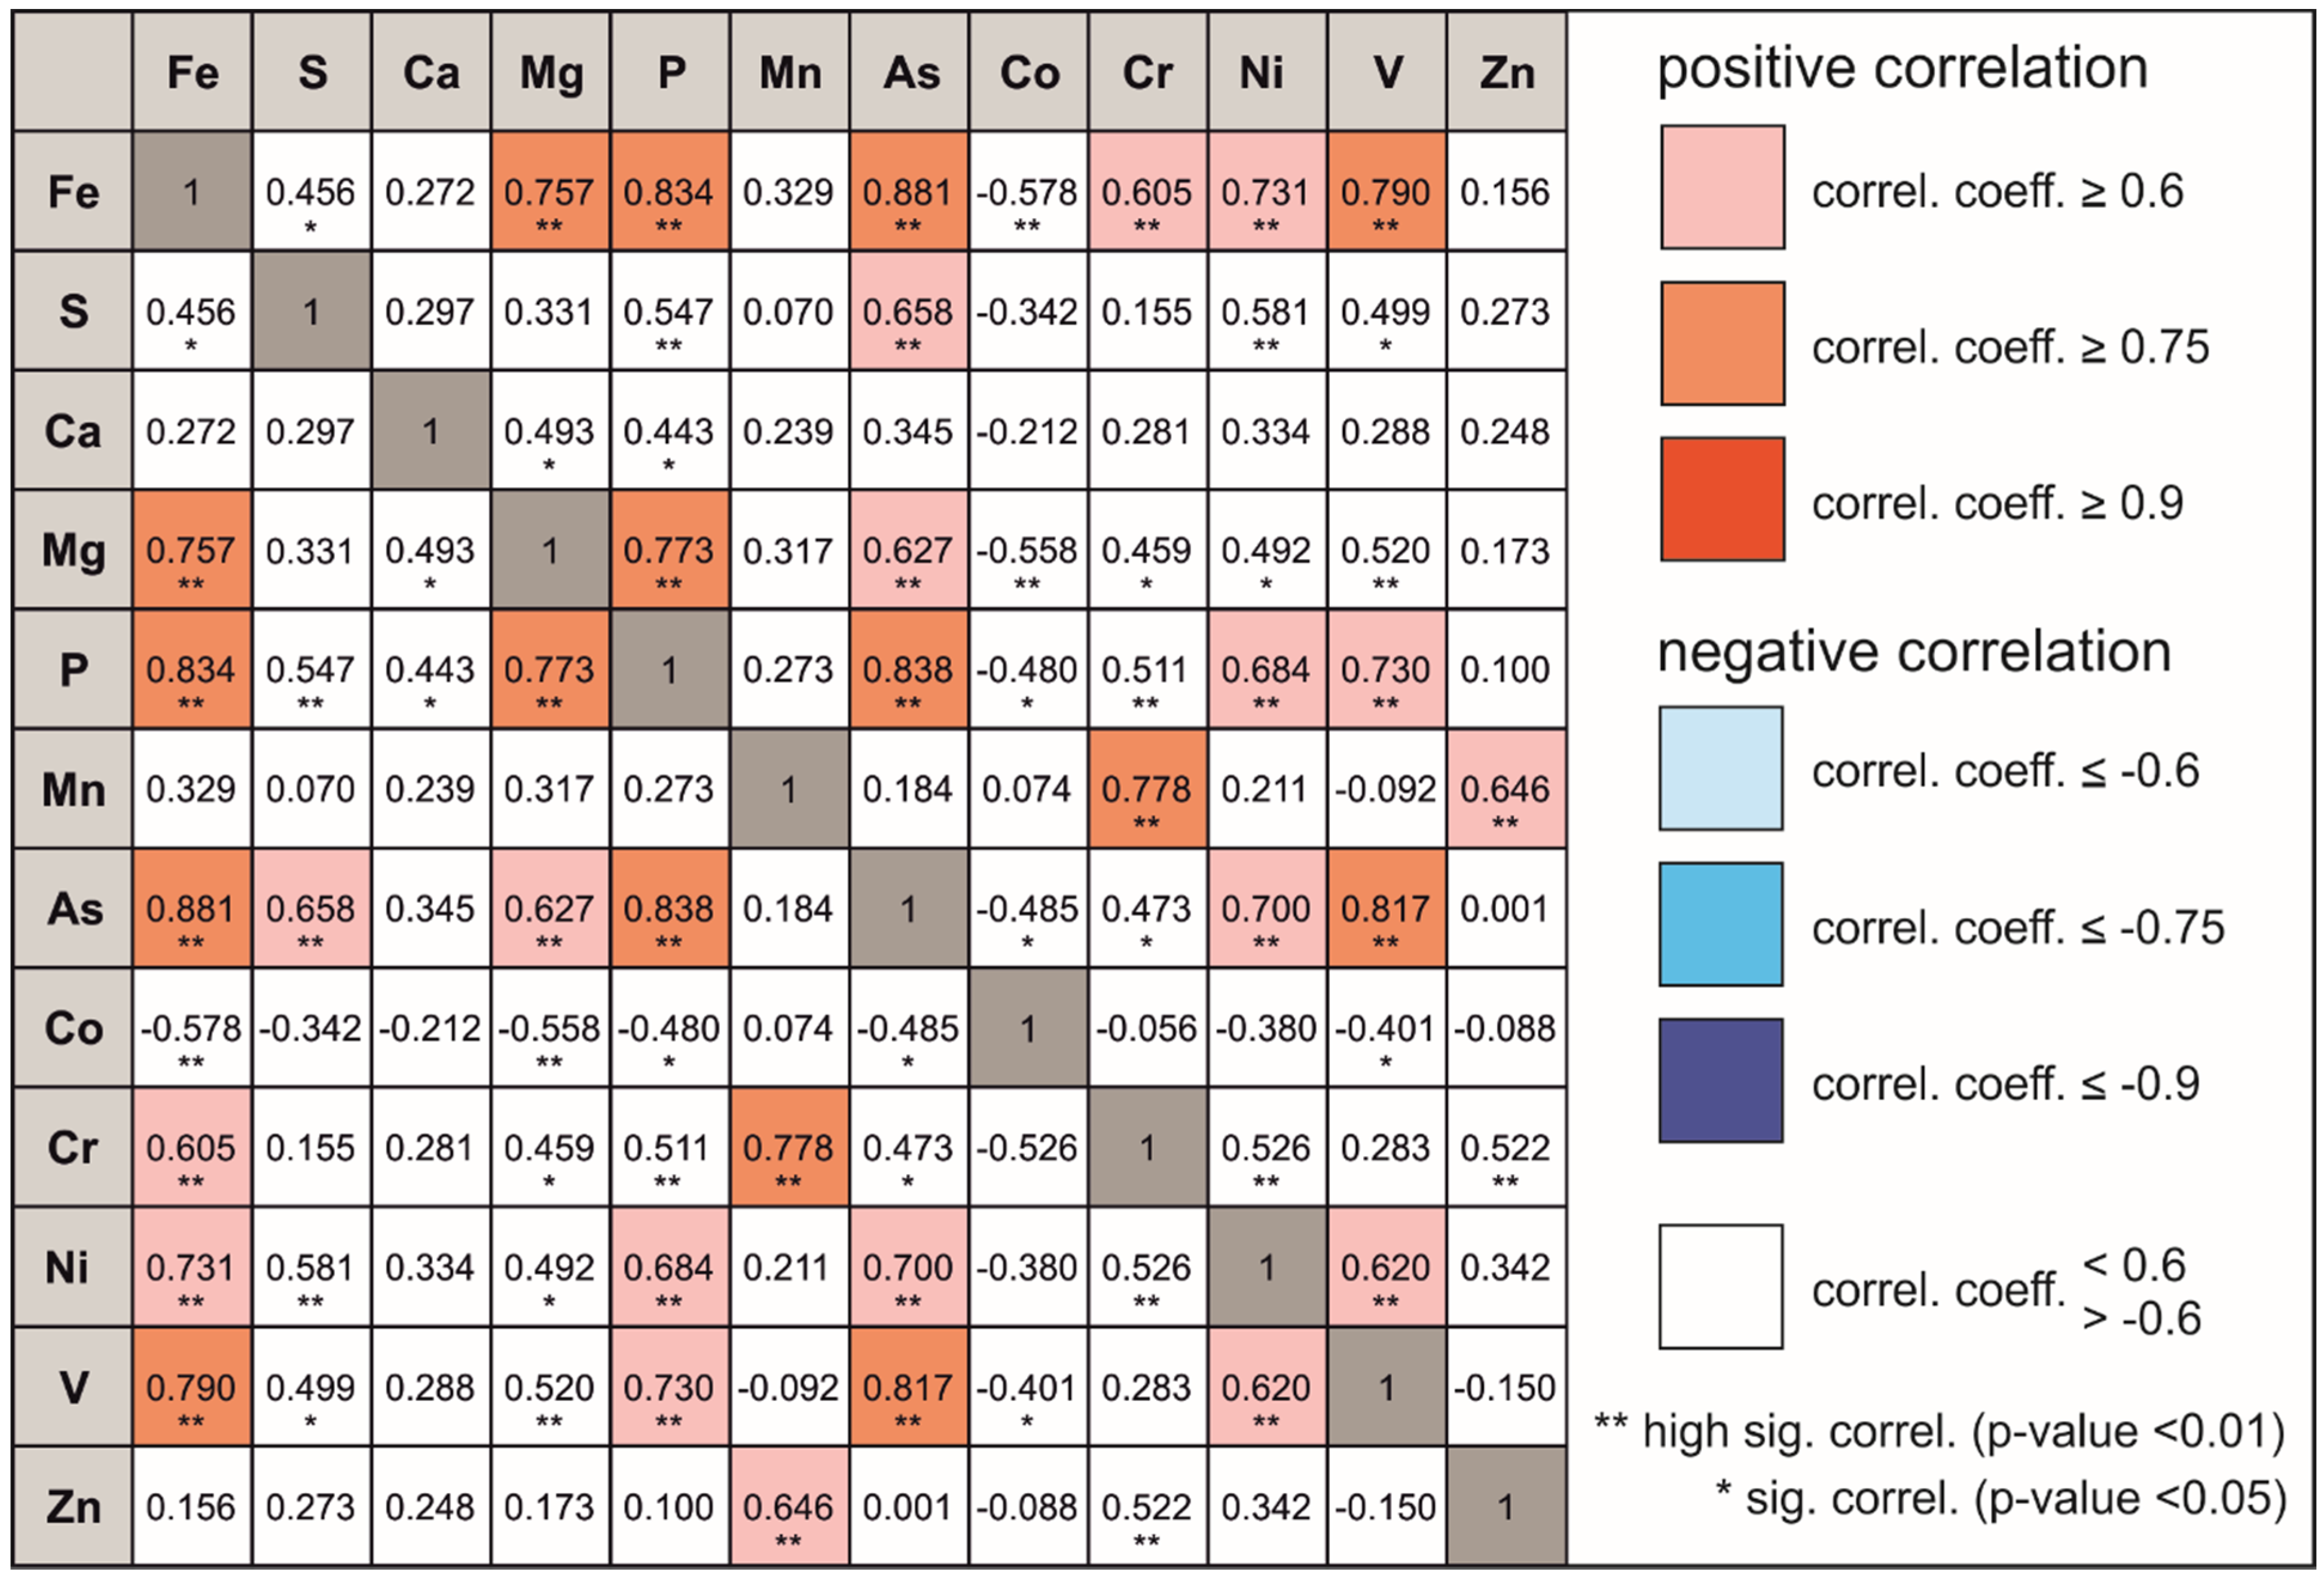
The statistical analysis of Tertiary samples was conducted using the IBM SPSS Statistics software. The Spearman correlation matrix is shown in Figure 4. The correlation coefficient R of Fe with the trace elements As and V was >0.75 (R2 = 0.60 and 0.94) and with Cr and Ni >0.6 (R2 = 0.40 and 0.29). In addition, Mg and P also showed a correlation coefficient >0.75 with Fe (R2 = 0.79 and 0.81). Since P has a high correlation with Fe, the trace elements correlate with P in a very similar way. The correlation between Fe and S was only 0.46 (R2 = 0.03). However, S also had a correlation of 0.66 with As (R2 = 0.39). Cobalt showed a negative correlation with almost all elements. These correlations were also influenced by the abrasion from the mill. All discussed correlations, except those of Co, were significant (p < 0.05), with, in most cases, a highly significant correlation (p < 0.01).

3.1.2. Haltern Fm. Aquifer

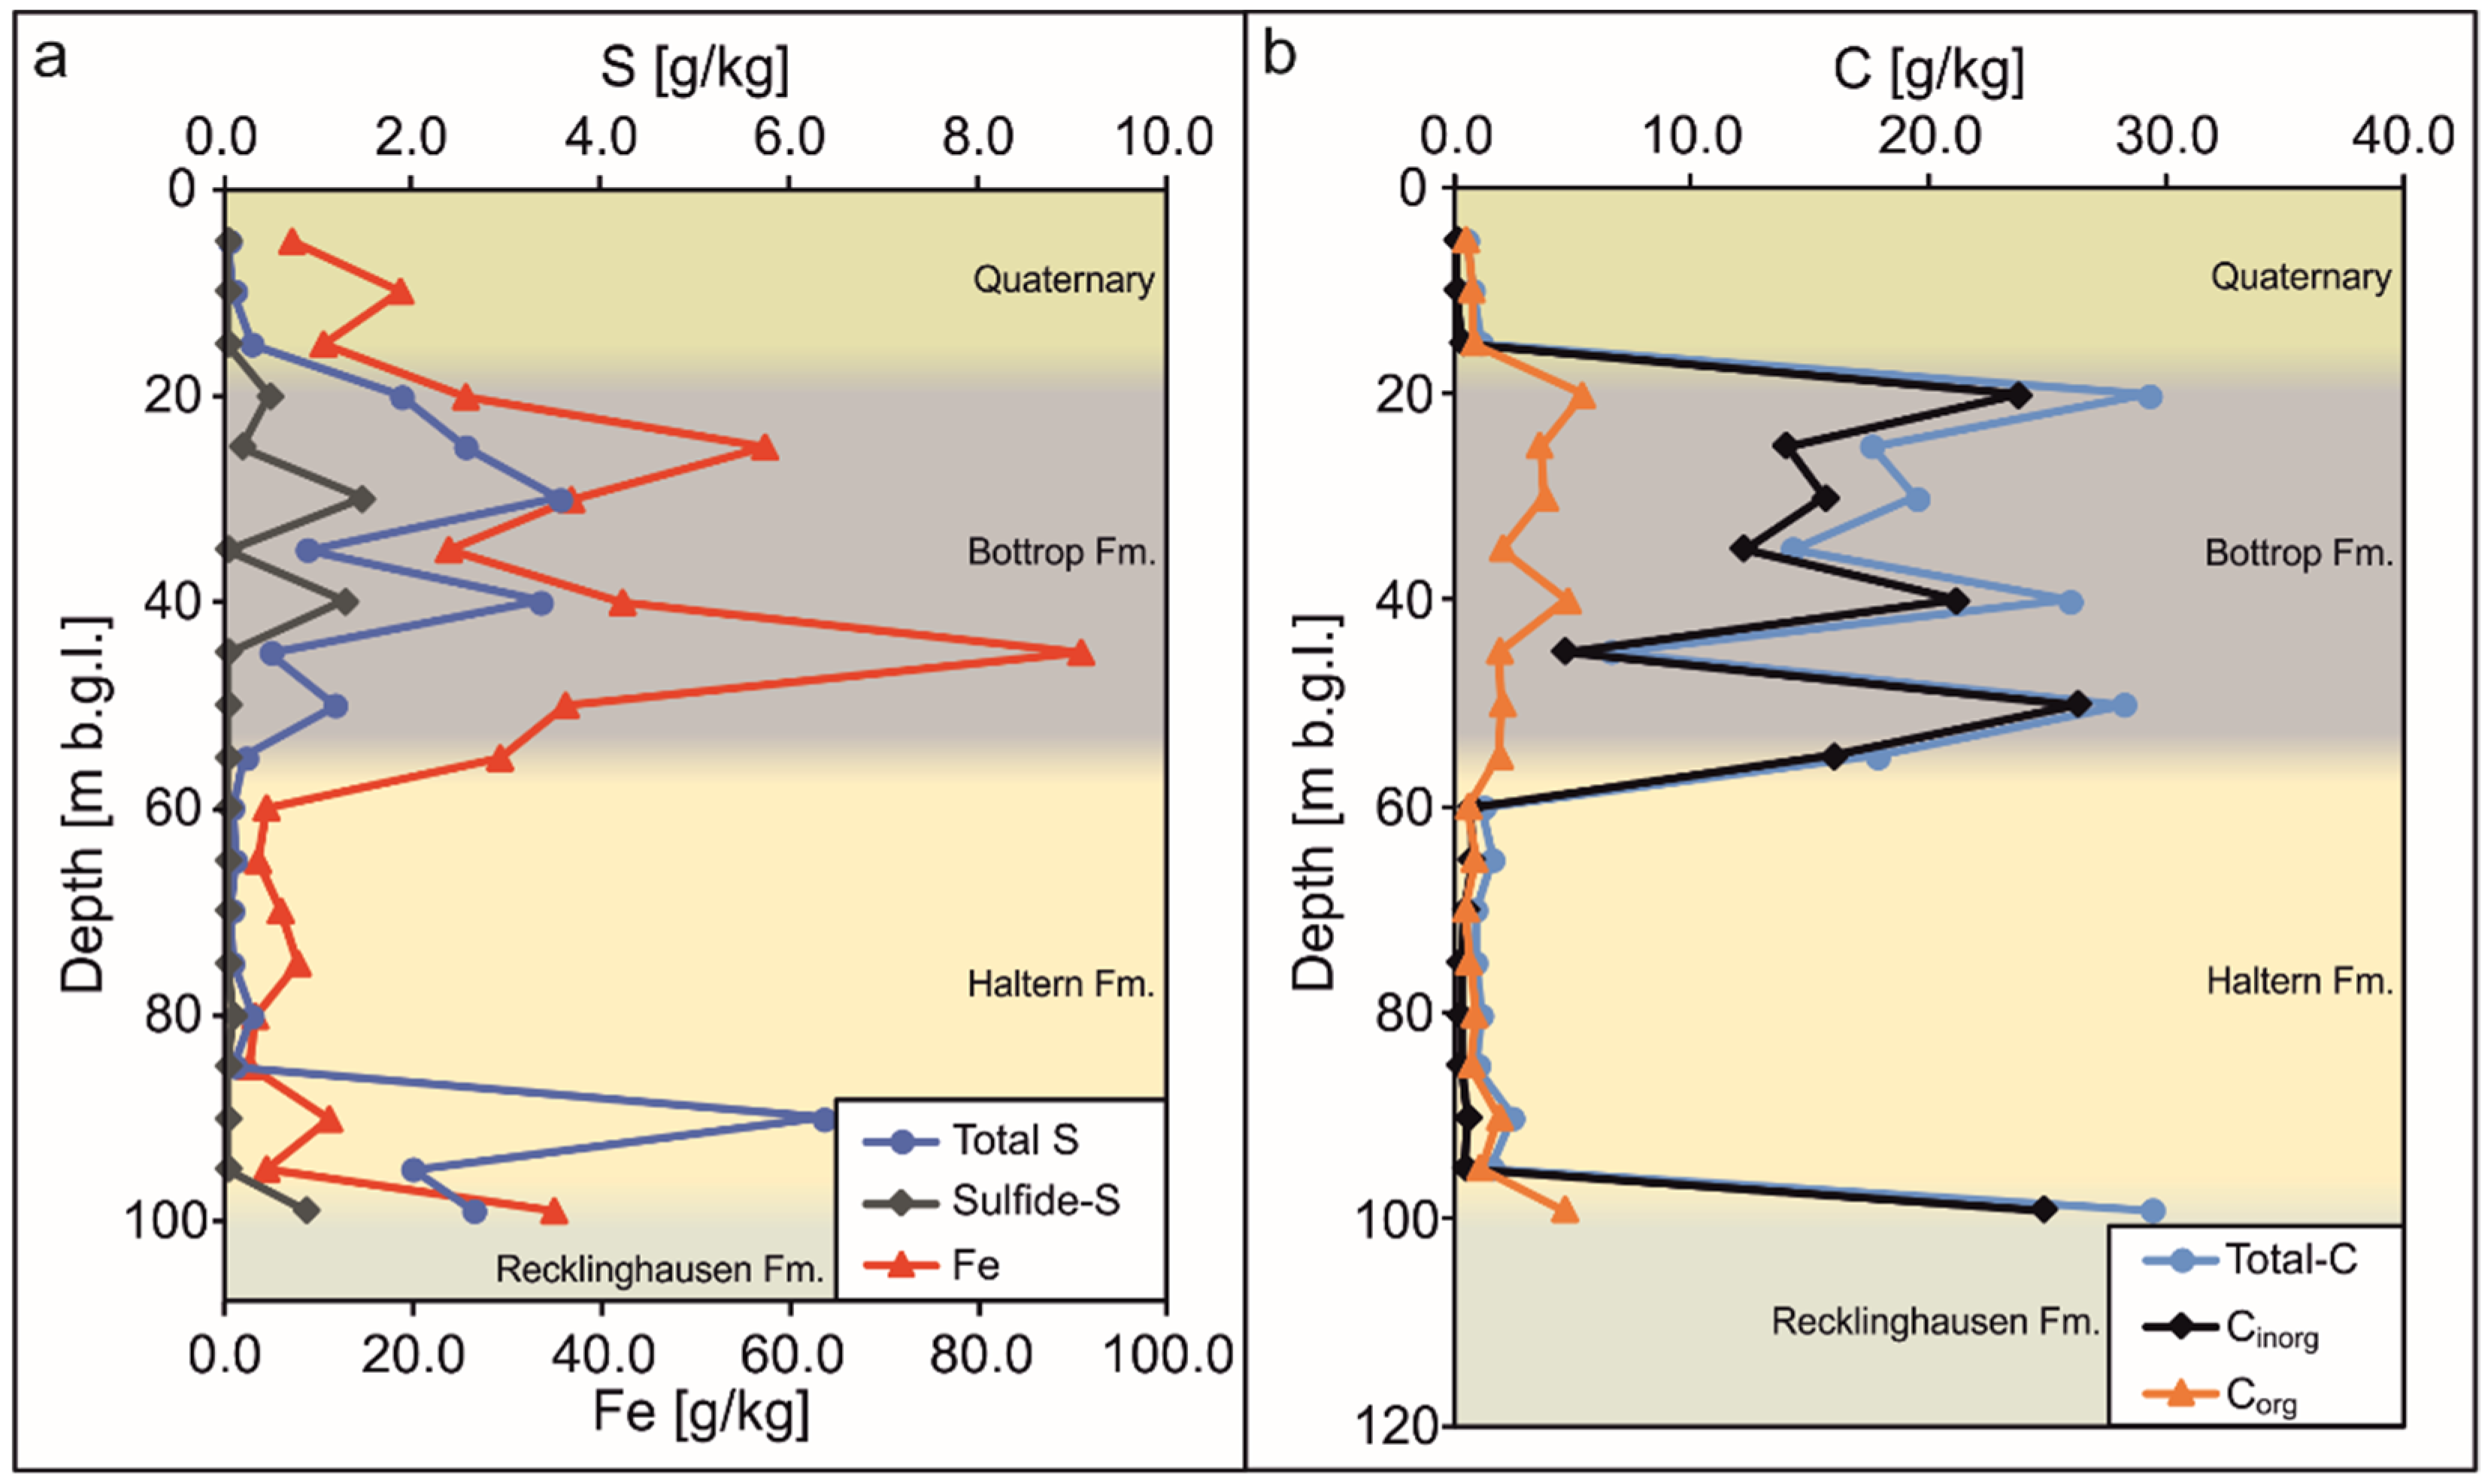
The distribution of the Stot content (Figure 5a) was low over the entire thickness. The Bottrop Fm. in particular showed higher contents. Ssulf contents were also low and represented only a part of the Stot. Within the Quaternary and the Haltern Fm., the measured values for Ssulf were below the detection limit of 0.1 g/kg. Only at a depth of 80 m was a Ssulf content of 0.1 g/kg measured. At a 90 m depth, there was an enrichment of Stot at 6.46 g/kg, but no Ssulf was present. Nevertheless, Ssulf in the form of pyrite seemed to be present in small amounts at the base of the Quaternary aquifer as well as in the Haltern Fm. as framboidal pyrites were found in SEM analyses, although in these depths the Ssulf content was below the detection limit. The highest Fe contents were also measured in the Bottrop Fm. In the Haltern Fm. in particular the Fe contents were low. The contents of Fe clearly did not follow the contents of Ssulf in most parts of the aquifer. Consequently, not all the Fe in these sections was associated with sulfide minerals such as pyrite (FeS2).
Contents of Ctot showed a similar situation (Figure 5b). The highest contents were found in the aquitard, the Bottrop Fm. In the aquifers, Quaternary, and Haltern Fm., the contents were very low. The maximum content of Ctot in the Bottrop Fm. was 29.2 g/kg and lowest value was 6.51 g/kg. In the Quaternary, the content ranged between 0.5 and 1.1 g/kg, and in the Haltern Fm., between 0.84 and 2.4 g/kg, whereby the content at the transition between Haltern and Bottrop Fm. was clearly elevated at 17.81 g/kg. In the Quaternary and Haltern Fm., C was mainly present as Corg. In the Bottrop Fm. exactly the opposite was observed; here, mainly Cinorg was present and Corg was low. Nevertheless, the content of Corg in the aquifers was low. The average content in the Quaternary was 0.67 g/kg and in the Haltern Fm. the average content was 0.97 g/kg. The content increased considerably in the Recklinghausen Fm., and Ctot reached a maximum of 29.4 g/kg.
Carbon content was too low in the aquifer parts for C isotope determination in the sediment samples at the depths of 15, 70, and 85 m. At 55 m, the ratios for δ13CPDB and δ18OPDB were 1.04 and −2.31‰, and at 99 m −1.31 and −2.76‰, respectively.
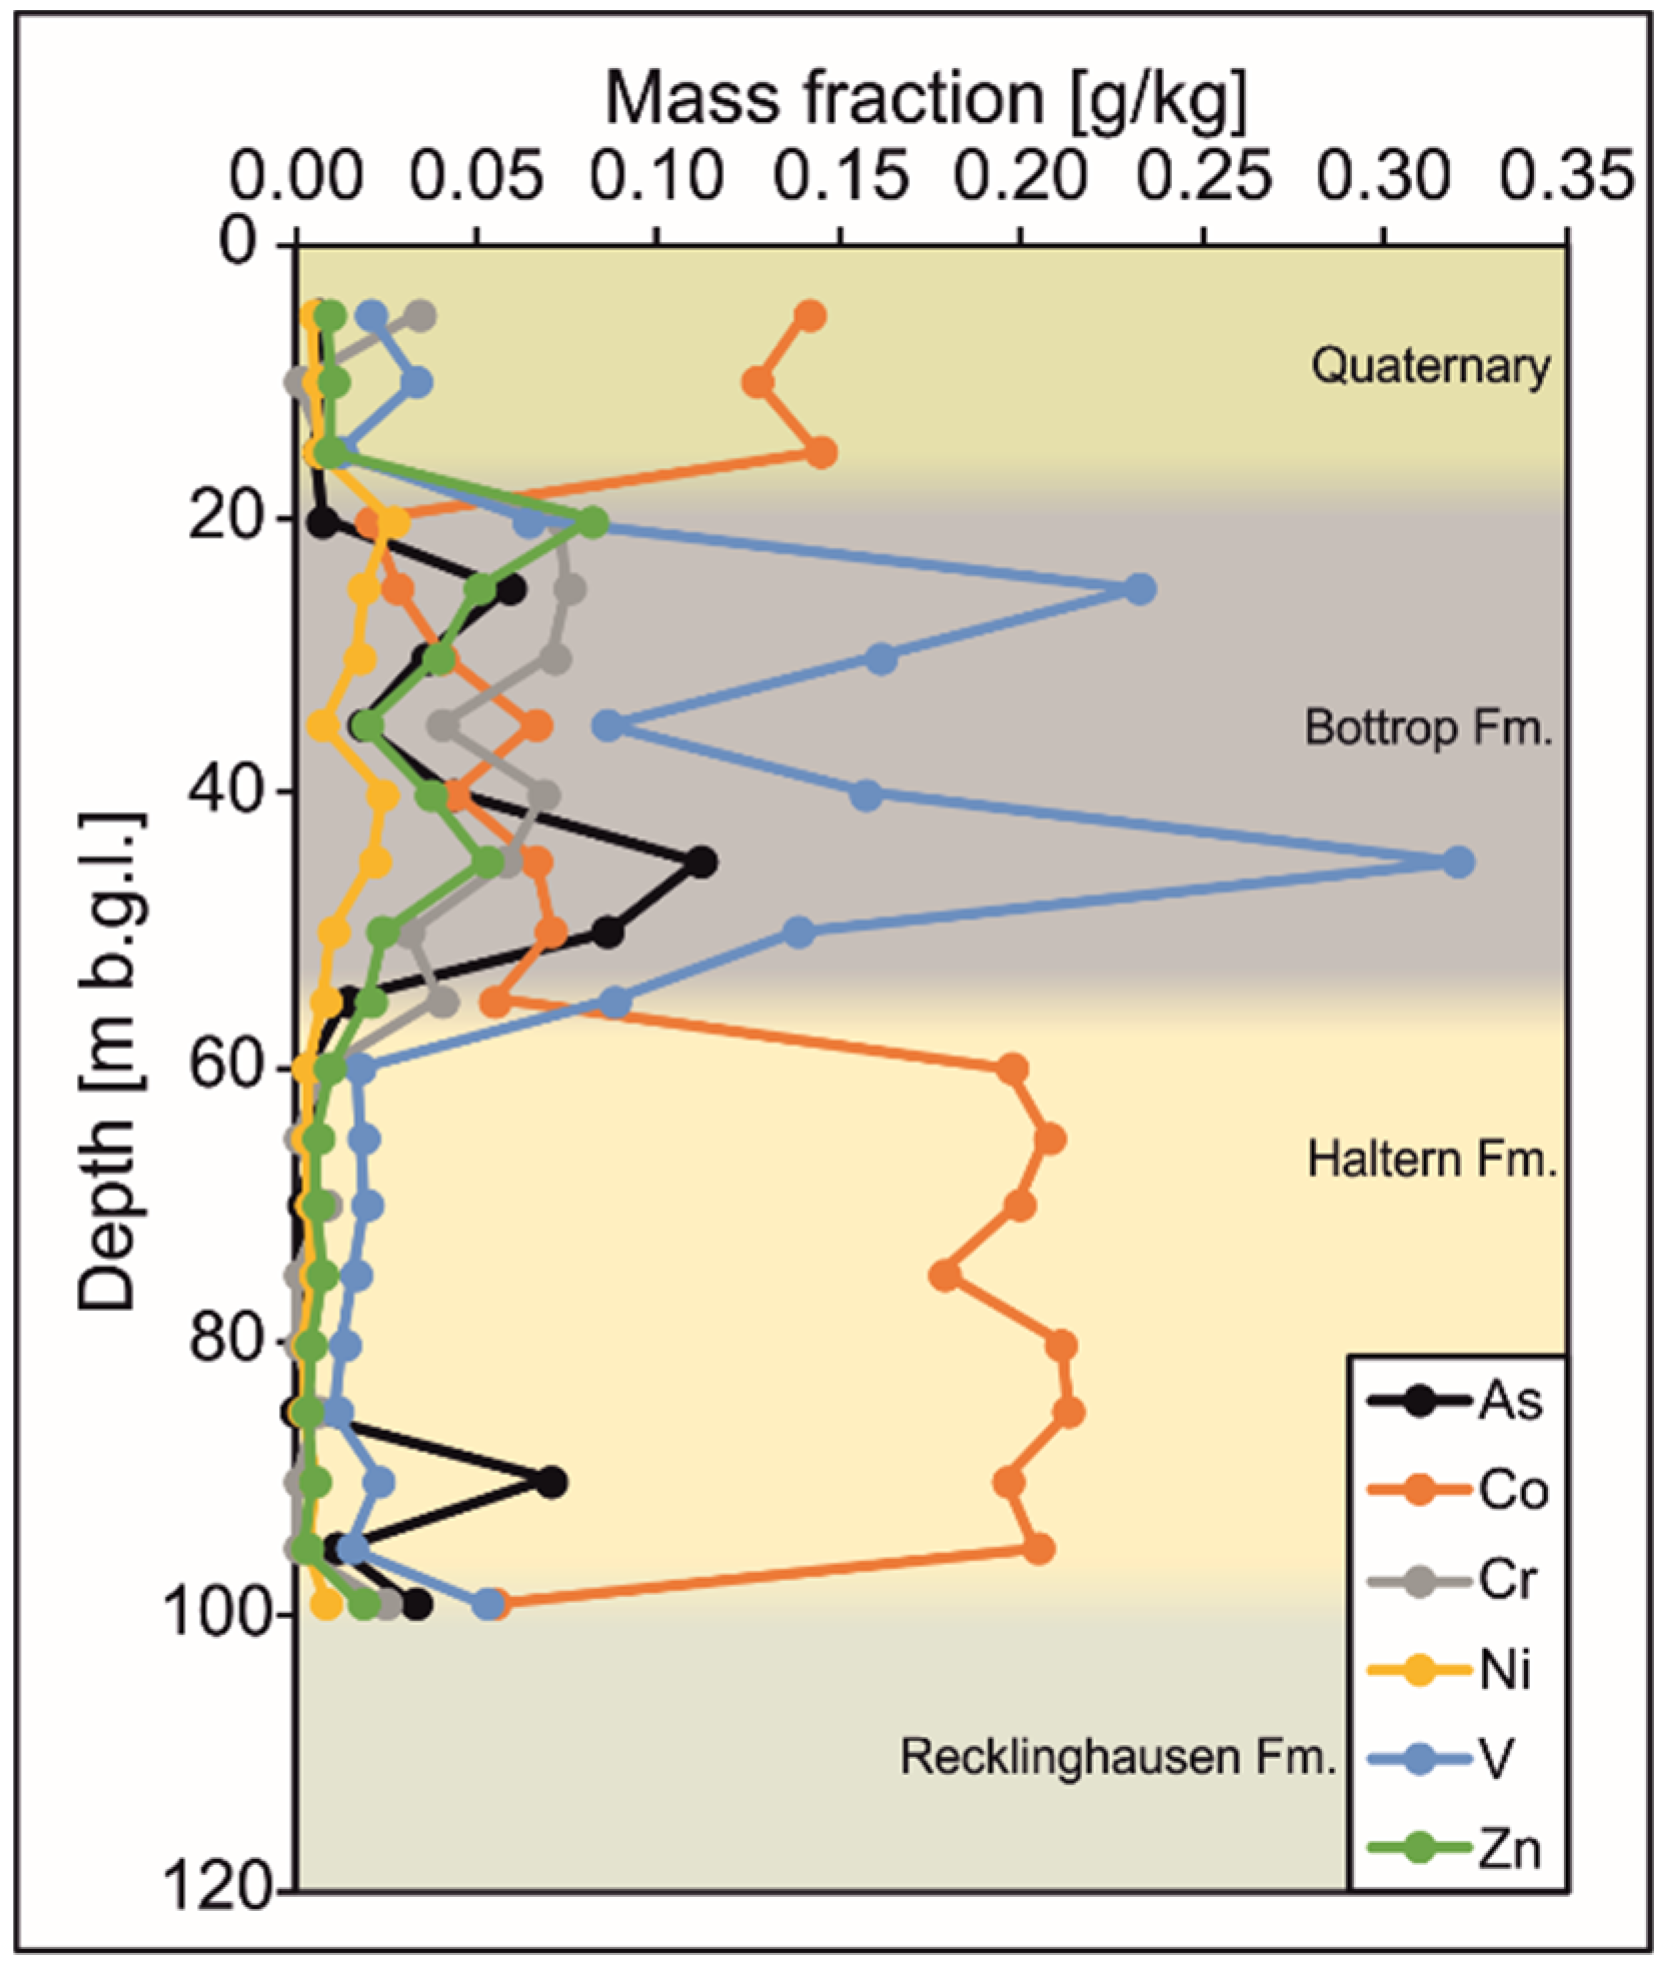
The contents of the selected trace elements of the Haltern Fm. are shown in Figure 6. Like the Quaternary–Tertiary aquifer, contents in the aquifers were clearly different from those in the aquitards. The highest contents were found in the Bottrop Fm., with the exception of Co, probably since the clayey sediments abrade less Co from the mill than the Quaternary or Haltern Fm. sands.
Contents of As showed an average value of the entire depth of 0.026 g/kg, very similar to that of Cr at 0.027 g/kg. At a depth of 90 m, the As content was higher in the Haltern Fm., at 0.07 g/kg. In the Haltern Fm. the average content was 0.014. Contents of Ni and Zn were also very low, with average contents of 0.009 and 0.021 g/kg for the entire depth, and 0.004 and 0.007 g/kg, respectively, for the Haltern Fm. In the Haltern Fm., V was also present in very low amounts (0.02 g/kg). However, in the Bottrop Fm., maximum contents of 0.32 g/kg were reached at 45 m b.g.l. Consequently, the average content across all layers was 0.075 g/kg.
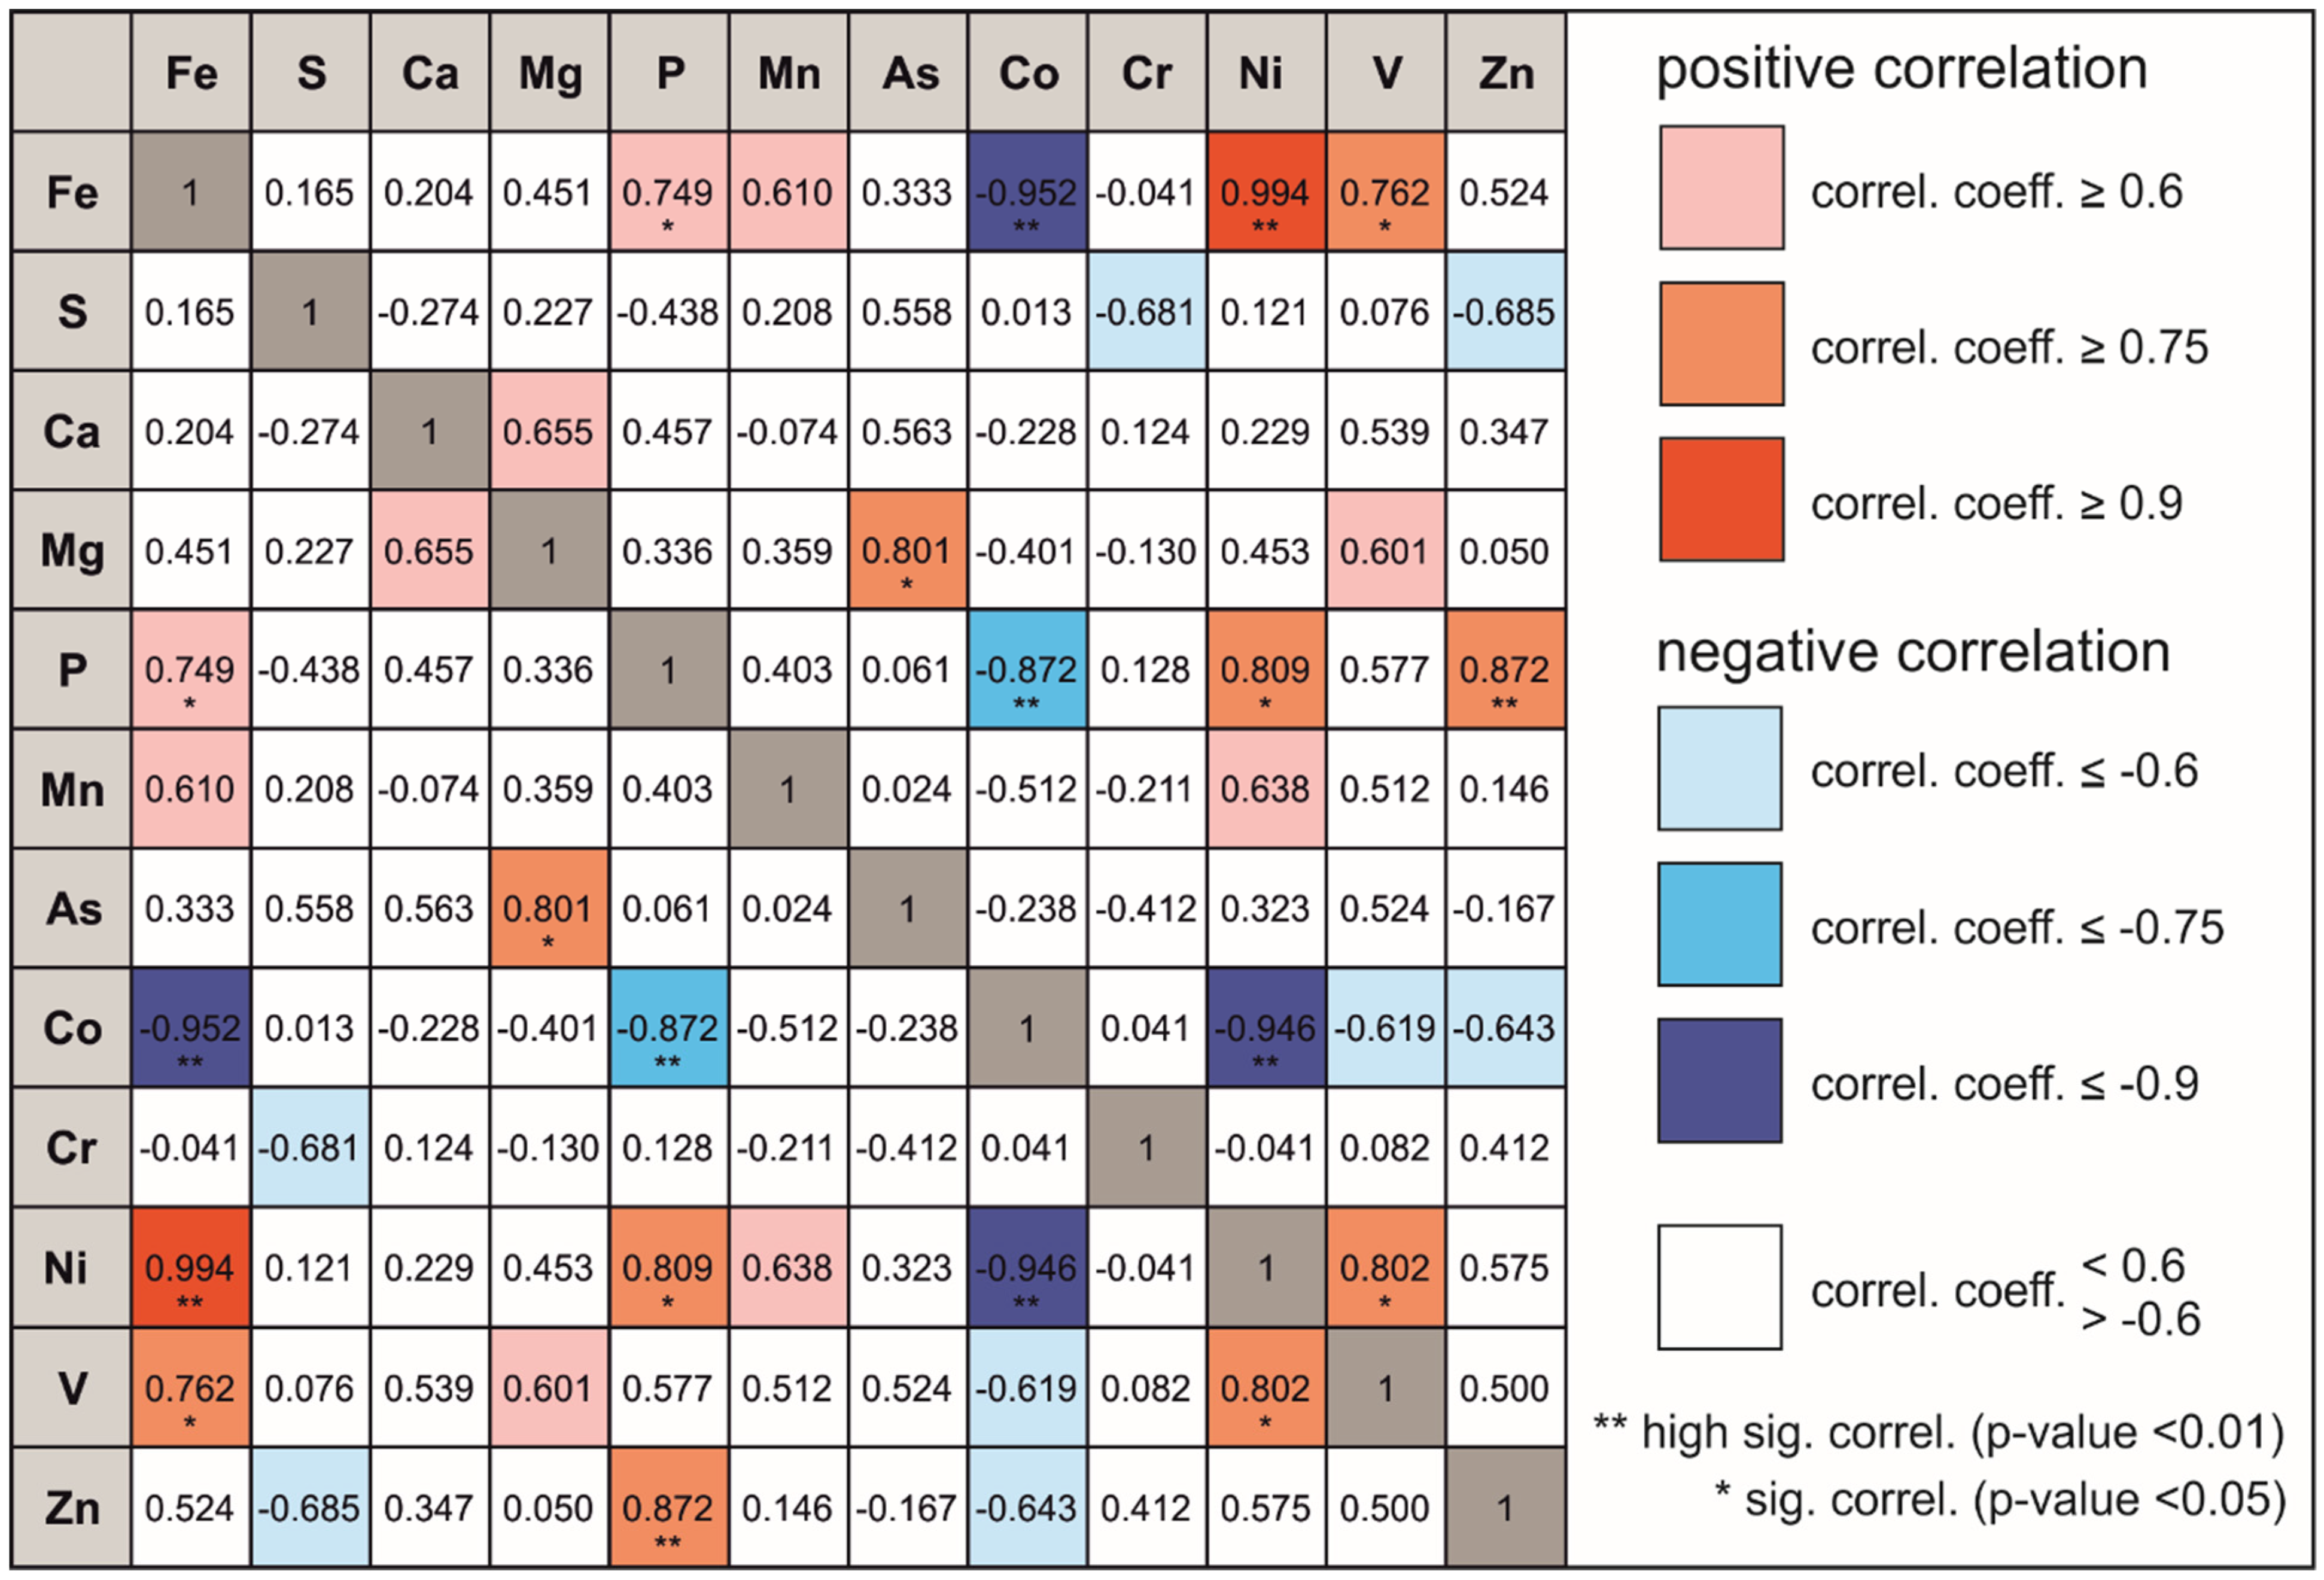
The Spearman correlation matrix of the Haltern Fm. showed a correlation of Fe with Ni of > 0.99 and an R2 = 0.92 (Figure 7). The correlation coefficient with V was >0.75 (R2 = 0.65). However, the correlations with As, Cr, P, and Mg were lower in this case compared to the Quaternary–Tertiary aquifer. The correlation coefficient of Fe and S was only 0.165 (R2 = 0.59). Since Ni and V correlate well with Fe, a correlation of 0.802 between Ni and V was also present here (R2 = 0.64). Cobalt showed even higher negative correlations compared to the Quaternary–Tertiary aquifer and thus it can be assumed that the quartz grains of the Haltern Fm. abrade more Co from the mill than the fine sands of the Tertiary. The significance level was lower in this analysis for some correlations due to the smaller number of samples. However, the discussed correlations of Fe with trace elements in particular were confirmed by a significant to highly significant correlation.

3.2. Isotopic and Water Analysis

3.2.1. Quaternary–Tertiary Aquifer

An evaluation of the hydrogeochemistry in this study area was previously performed by Ortmeyer et al. [30]. Nitrate-containing water from the Quaternary flows into the Tertiary due to pumping in production wells. Directly below the Quaternary–Tertiary boundary, a horizontal redox boundary could be determined at about 50 m b.g.l. Below this depth, the NO3 concentration was below the detection limit. The results of isotopic ratios provided further information about the proceeding NO3 reduction as well as a depth-specific interpretation of the reactions. Isotopic ratios in the Quaternary–Tertiary aquifer of δ15N ranged from −6.3 to +34‰ and for δ18O from +1.6 to +30.6‰ (Figure 8a). The upper two samples from depths of 11 and 27 m of the Quaternary part of the aquifer differed considerably from those of the Tertiary. The very positive δ15N isotope ratios indicated NO3 from agricultural fertilizers such as manure. In the Tertiary, much more negative isotope ratios were determined. At 46 m, the δ15N-NO3 value was 0.9‰, increasing to 15.8‰ by 81 m. δ18O-NO3 values also continued to increase from 46 m to 30.6‰, remaining nearly constant by 81 m. Fluctuations were observed in the following meters, but positive isotopic ratios of δ15N-NO3 and δ18O-NO3 indicated NO3 reduction. At the last two levels of 146 and 156 m, δ15N-NO3 and δ18O-NO3 values decreased considerably to −6.3 and 1.6‰, respectively.
Isotopic ratios of δ34S-SO42− and δ18O-SO42− as well as δ13C-DIC also differed considerably between the Quaternary and Tertiary (Figure 8b). The δ34S value was −14.0‰ at 11 m, increasing to −2.7‰ at 27 m. Similarly, δ18O increased from 0.2 to 4.8‰. Just below the Quaternary–Tertiary boundary at 46 m, δ34S was −8.5‰, increasing slightly to −6.1‰ at 51 m, and remained nearly constant down to the depth of 100 m. From 120 m b.g.l., δ34S values increased to 1.6‰. δ18O took a similar course, with a value of 2.0‰ at a depth of 46 m, rising to 3.4‰, and then slowly increasing to 6.6‰ at the depth of 156 m. The δ13C values in dissolved Cinorg were 11.4‰ (11 m) and 10.4‰ (27 m) in the Quaternary, rising slightly to −7.0‰ in the Tertiary, and then remaining nearly constant throughout its thickness with only slight variations.

3.2.2. Haltern Fm. Aquifer

In all water samples of the observation well bundle in the Haltern Fm. over the entire depth, NO3 concentrations were below the detection limit (Figure 9). Similarly, oxygen concentrations were very low (<2 mg/L). Only at the depth of 70 m was a value of 62.5 mg/L NO3 detected. In addition, the oxygen concentration at this depth was 7.79 mg/L. Chloride concentrations were also increased only at 70 m. The SO42− concentration was 78 mg/L at the base of the Quaternary aquifer and reached the maximum here. In the Haltern Fm., the concentration was almost constant at about 15 mg/L. The pH was neutral over the entire depth, but the electrical conductivity also showed the maximum value of 411 µS/cm at a depth of 70 m (data not shown).
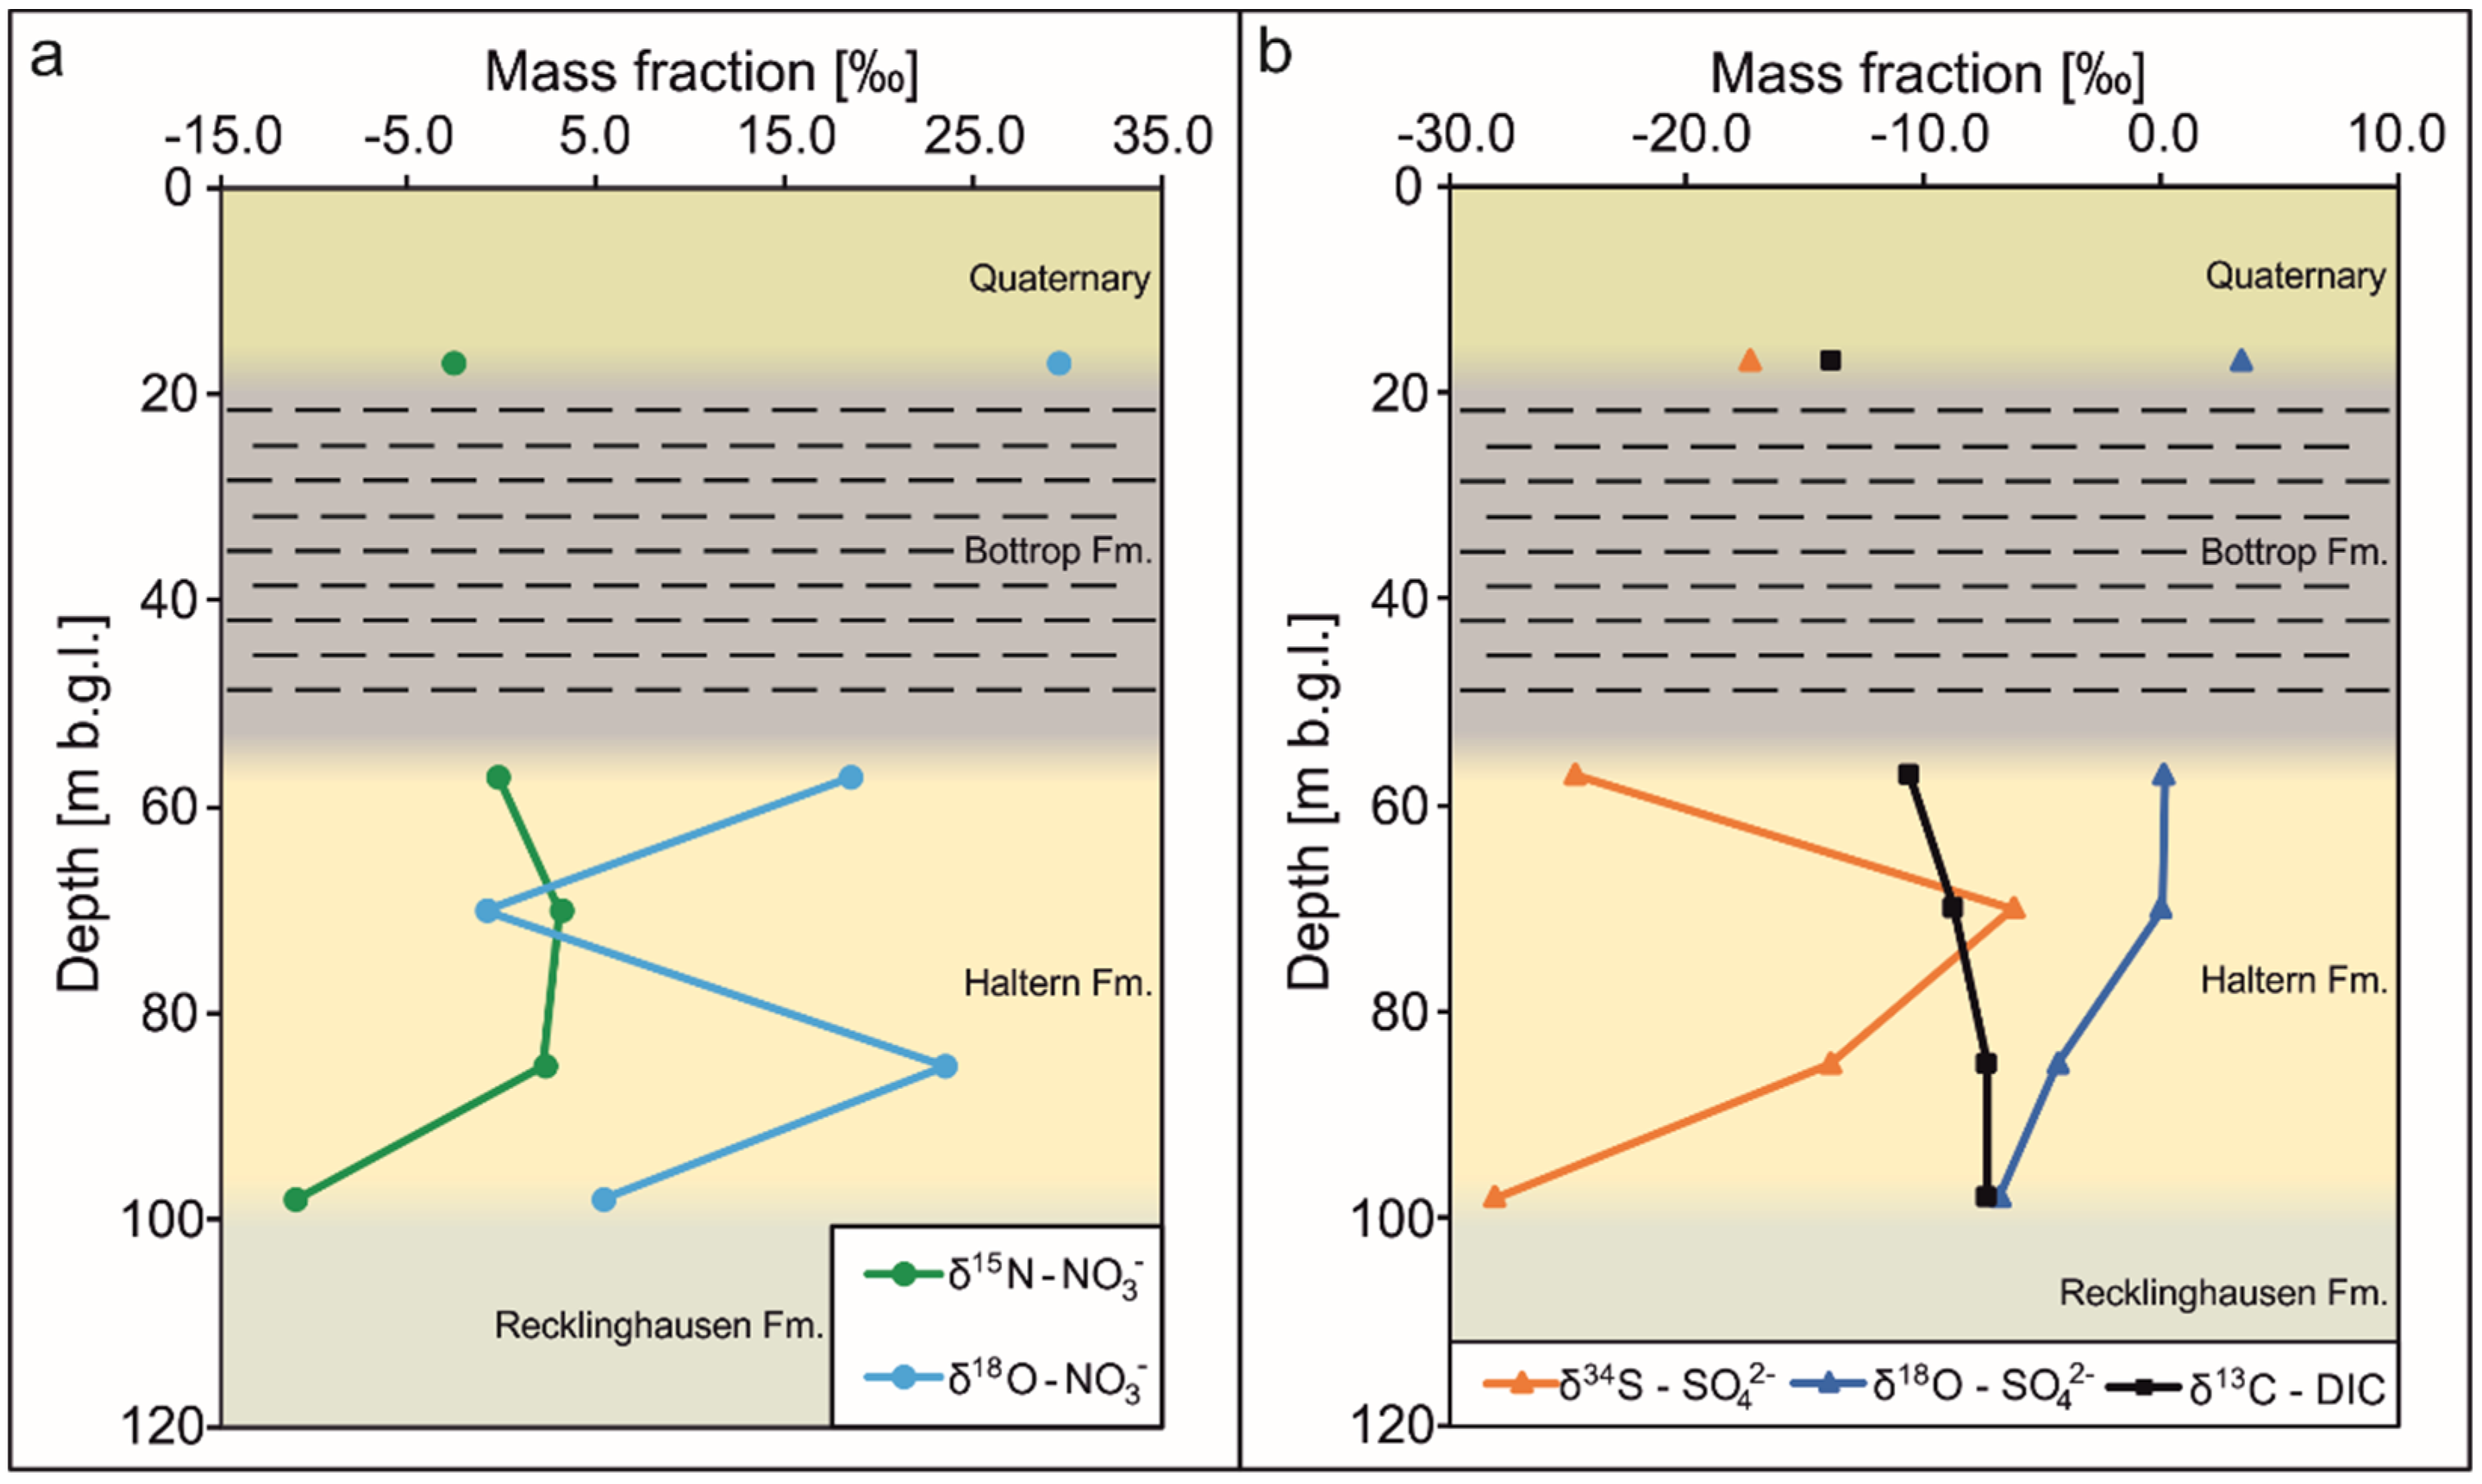
The analysis of δ15N in NO3 showed isotopic values between −11.0 and +3.1‰, and values for δ18O in NO3 were between −0.9 and 29.5‰ (Figure 10a). The sample from the 17 m depth had only a slightly negative value of −2.7‰ for δ15N-NO3 and the most positive value of 29.5‰ for δ18O-NO3. δ15N-NO3 values at depths of 57, 70, and 85 m differed only slightly and ranged from −0.3 to 3.1‰. δ18O-NO3 values were similar to those of the sample at 17 m, with positive values at depths of 56 (18.5‰) and 86 m (23.5‰). However, the sample at a depth of 70 m had a completely different and considerably more negative value of −0.9‰. Isotopic ratios at 98 m were completely different from those of the meters above, and were more negative than most samples, with a δ15N-NO3 value of −11.0‰ and δ18O-NO3 value of 5.3‰.
The δ34S-SO42− value at the base of the Quaternary was −17.4‰ and that of δ18O-SO42− was 3.5‰ (Figure 10b). In the Haltern Fm., the sample from 70 m was again conspicuous. Thus, at 56 m, the δ34S-SO42− ratio was initially negative at −24.8‰, like in the Quaternary sample, and then increased to −6.2‰ at the 70 m depth, dropping again to −14.0‰ at a depth of 86 m. A strongly negative value of −28.2‰ was determined at 98 m. At 56 and 70 m, δ18O-SO42− values were almost identical (0.3 and 0.1‰, respectively), but then dropped with depth to −6.8‰. The δ13C-DIC value in the Quaternary was −13.9‰. In the Haltern Fm., the δ13C-DIC ratio was −10.6‰ at 56 m and increased slightly to −7.4‰ by 86 m, but remained nearly unchanged at 98 m.

3.3. Circulation Column Experiments

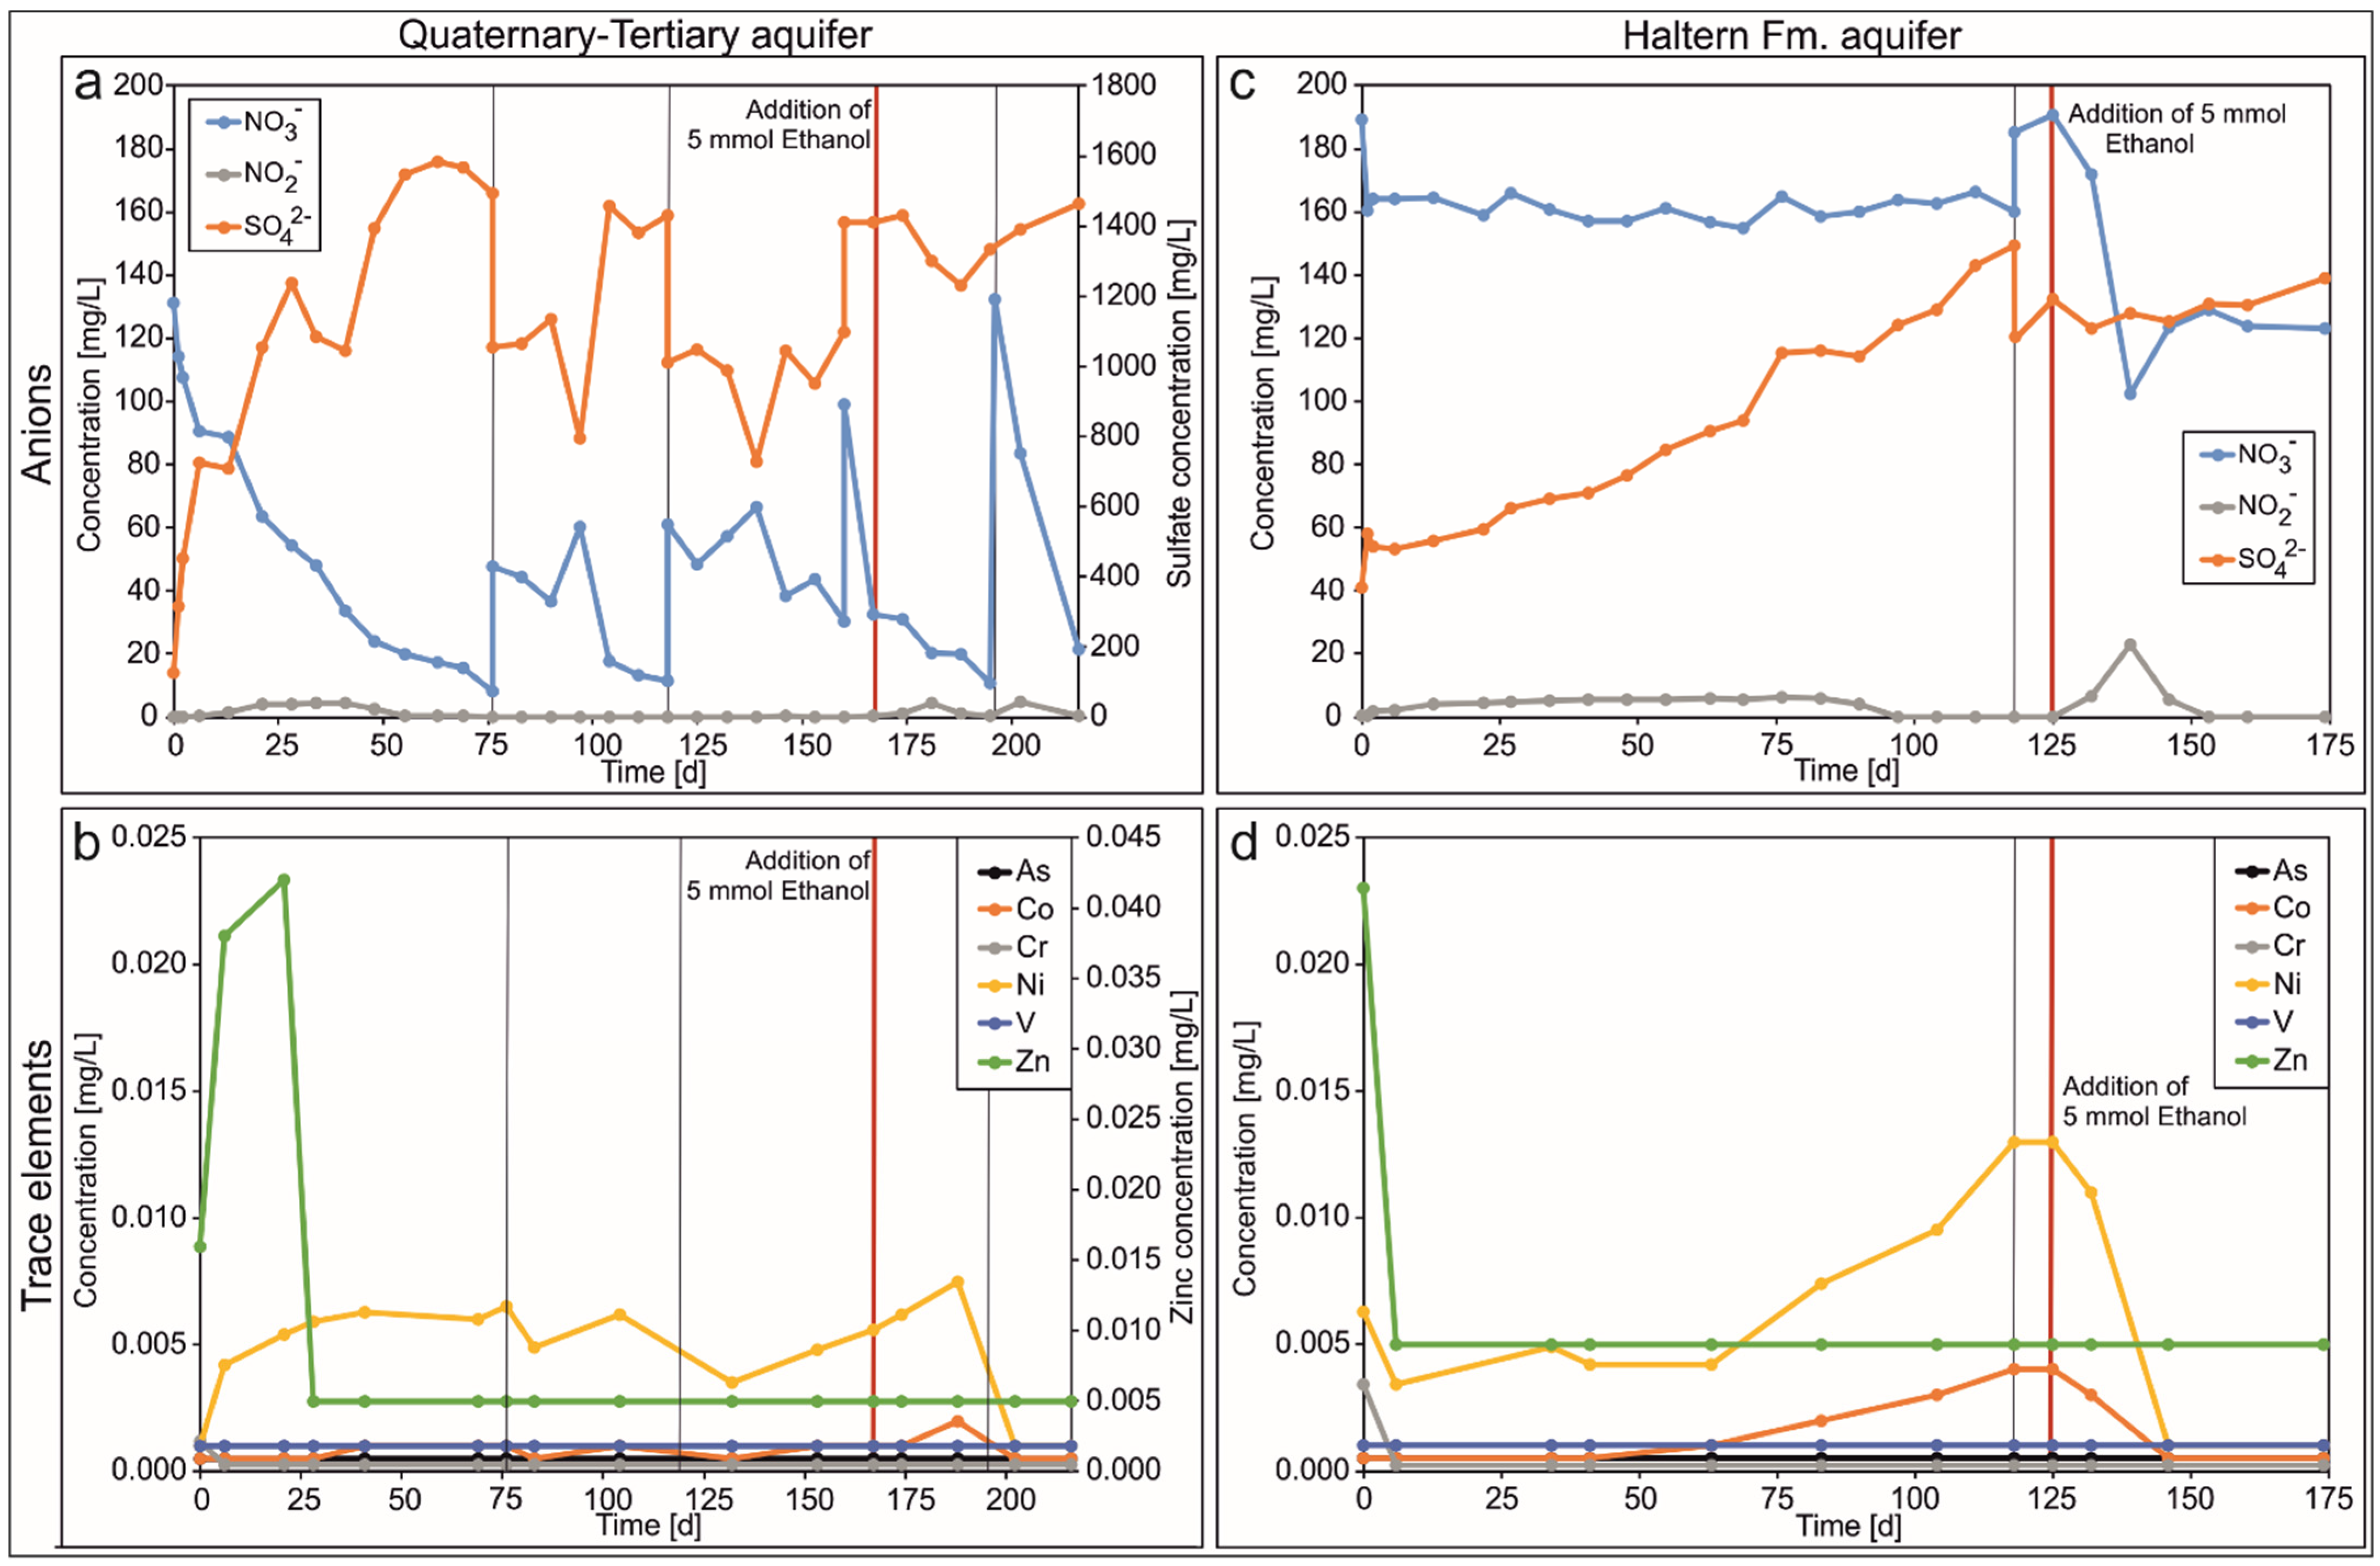
The results of the circulation column experiments showed NO3 degradation in the sediments of both aquifers. In the column experiment with sediments from the Quaternary–Tertiary aquifer, NO3 concentrations decreased continuously from initially 131 mg/L to 8.2 mg/L on day 75 (Figure 11a). During this process, the SO42− concentration increased from 125 to a maximum of 1582 mg/L. Thus, lithothrophic NO3 reduction can be assumed in this column experiment. After the addition of water, the NO3 concentration increased and the SO42− concentration decreased due to mixing with the initial water. In the days up to the second water addition on day 118, a lithotrophic NO3 reduction continued to occur. However, the measured values on day 97 deviated slightly from a constant reduction. In the period between days 118 and 160, NO3 degradation seemed to be considerably lower. After the addition of water on day 160 as well as sediment sampling prior to the addition of organic C, the NO3 concentration again decreased significantly by 66.4 mg/L. After the addition of 5 mmol ethanol, a slow decrease in the NO3 concentration was observed. After the last water refill and addition of 550 mg NaNO3, a stronger decrease was observed. Thus, after the addition of ethanol, the NO3 concentration decreased by a total of 132.7 mg/L over 49 days. This corresponded to a denitrification rate of 0.044 mmol∗L−1∗d−1, which was influenced by the initial low concentrations. Sulfate concentrations initially decreased slightly after the addition of ethanol and then increased again slightly towards the end of the observation. Up to a maximum of 4.4 mg/L NO2 was formed in the period between day 13 and 48, and thus when the NO3 concentration was high. In the following period, NO2 concentrations were very low and sometimes only just above the detection limit. After the addition of 5 mmol ethanol, 4.3 mg/L NO2 could be measured on day 181 and after the addition of NaNO3, 4.7 mg/L NO2 could be measured on day 202.
Selected trace elements of the Quaternary–Tertiary aquifer indicate low concentrations (Figure 11b). No limit value of the German Drinking Water Regulation was exceeded. Concentrations of As and V were permanently below the detection limit (0.001 and 0.0005 mg/L). Chromium had a detectable concentration of 0.001 mg/L in the first measurement only. Concentrations of Zn rose to 0.042 mg/L after the start of the experiment, but then fell permanently below the detection limit (0.01 mg/L). Nickel concentrations also rose immediately after the start of the experiment and only decreased due to the addition and consequent mixing with the initial water. After the addition of 5 mmol ethanol, an increase to the maximum of 0.0075 mg/L was observed. Nevertheless, with the addition of 550 mg NaNO3, Ni concentrations fell below the detection limit (0.002 mg/L). Cobalt content increased to 0.002 mg/L, only slightly above the detection limit (0.001 mg/L).
Nitrate degradation in the circulation column experiment with sediments from the Haltern Fm. was considerably lower (Figure 11c). Within the first 24 h, NO3 concentrations decreased by 28.8 mg/L and then remained almost constant over a long period until day 118 with only slight fluctuations. Sulfate concentrations increased during the first 24 h as well and a lithotrophic NO3 reduction could be confirmed in this circulation column experiment. Afterwards, the SO42− concentration continued to increase, although no detectable NO3 degradation occurred. The released SO42− also exceeded the amount that could be released from pyrite oxidation by the measured denitrification. After addition of 5 mmol ethanol, a clear organotrophic NO3 degradation could be observed, with a decrease in NO3 concentration of 65.2 mg/L within 21 days, resulting in a denitrification rate of 0.05 mmol∗L−1∗d−1. The sulfate concentration remained approximately constant after addition of Corg, showing some small fluctuations and then increasing slightly in the last sample. Nitrite was detectable over a considerably longer period than in the column experiment with sediment from the Quaternary–Tertiary aquifer, reaching a maximum of 6.3 mg/L prior to the addition of organic C. With the addition of 5 mmol ethanol, the NO2 concentration increased up to 22.9 mg/L. When the enhanced denitrification was completed, NO3 was reoxidized to NO3, the NO2 concentration decreased below the detection limit, and the NO3 concentration increased slightly.
Selected trace elements also showed very low concentrations in this circulation column experiment (sediments of the Haltern Fm.; Figure 11d). Again, no limit value of the German Drinking Water Regulation was exceeded. Some concentrations were very similar to those in the Quaternary–Tertiary aquifer over the observation period. Thus, concentrations of As and V remained permanently below the detection limit (0.001 and 0.0005 mg/L) and Cr had a detectable concentration of 0.003 mg/L in the first measurement only. The zinc concentration dropped from an initial value of 0.023 mg/L to directly below the detection limit (0.01 mg/L) in the next sample. Unlike in the Quaternary–Tertiary aquifer, concentrations of Ni and Co increased in this circulation column experiment continuously from day 63 until the addition of water on day 118. The nickel concentration was about 0.004 mg/L, with minor fluctuations until day 63, and increased to 0.013 mg/L afterwards. Cobalt started below the detection limit (0.001 mg/L) and increased to 0.004 mg/L. Despite the increase, no limit value of the German Drinking Water Regulation was exceeded. After the addition of water, both concentrations were constant for one week, dropping below the detection limit after the addition of 5 mmol ethanol in a period of 21 days.
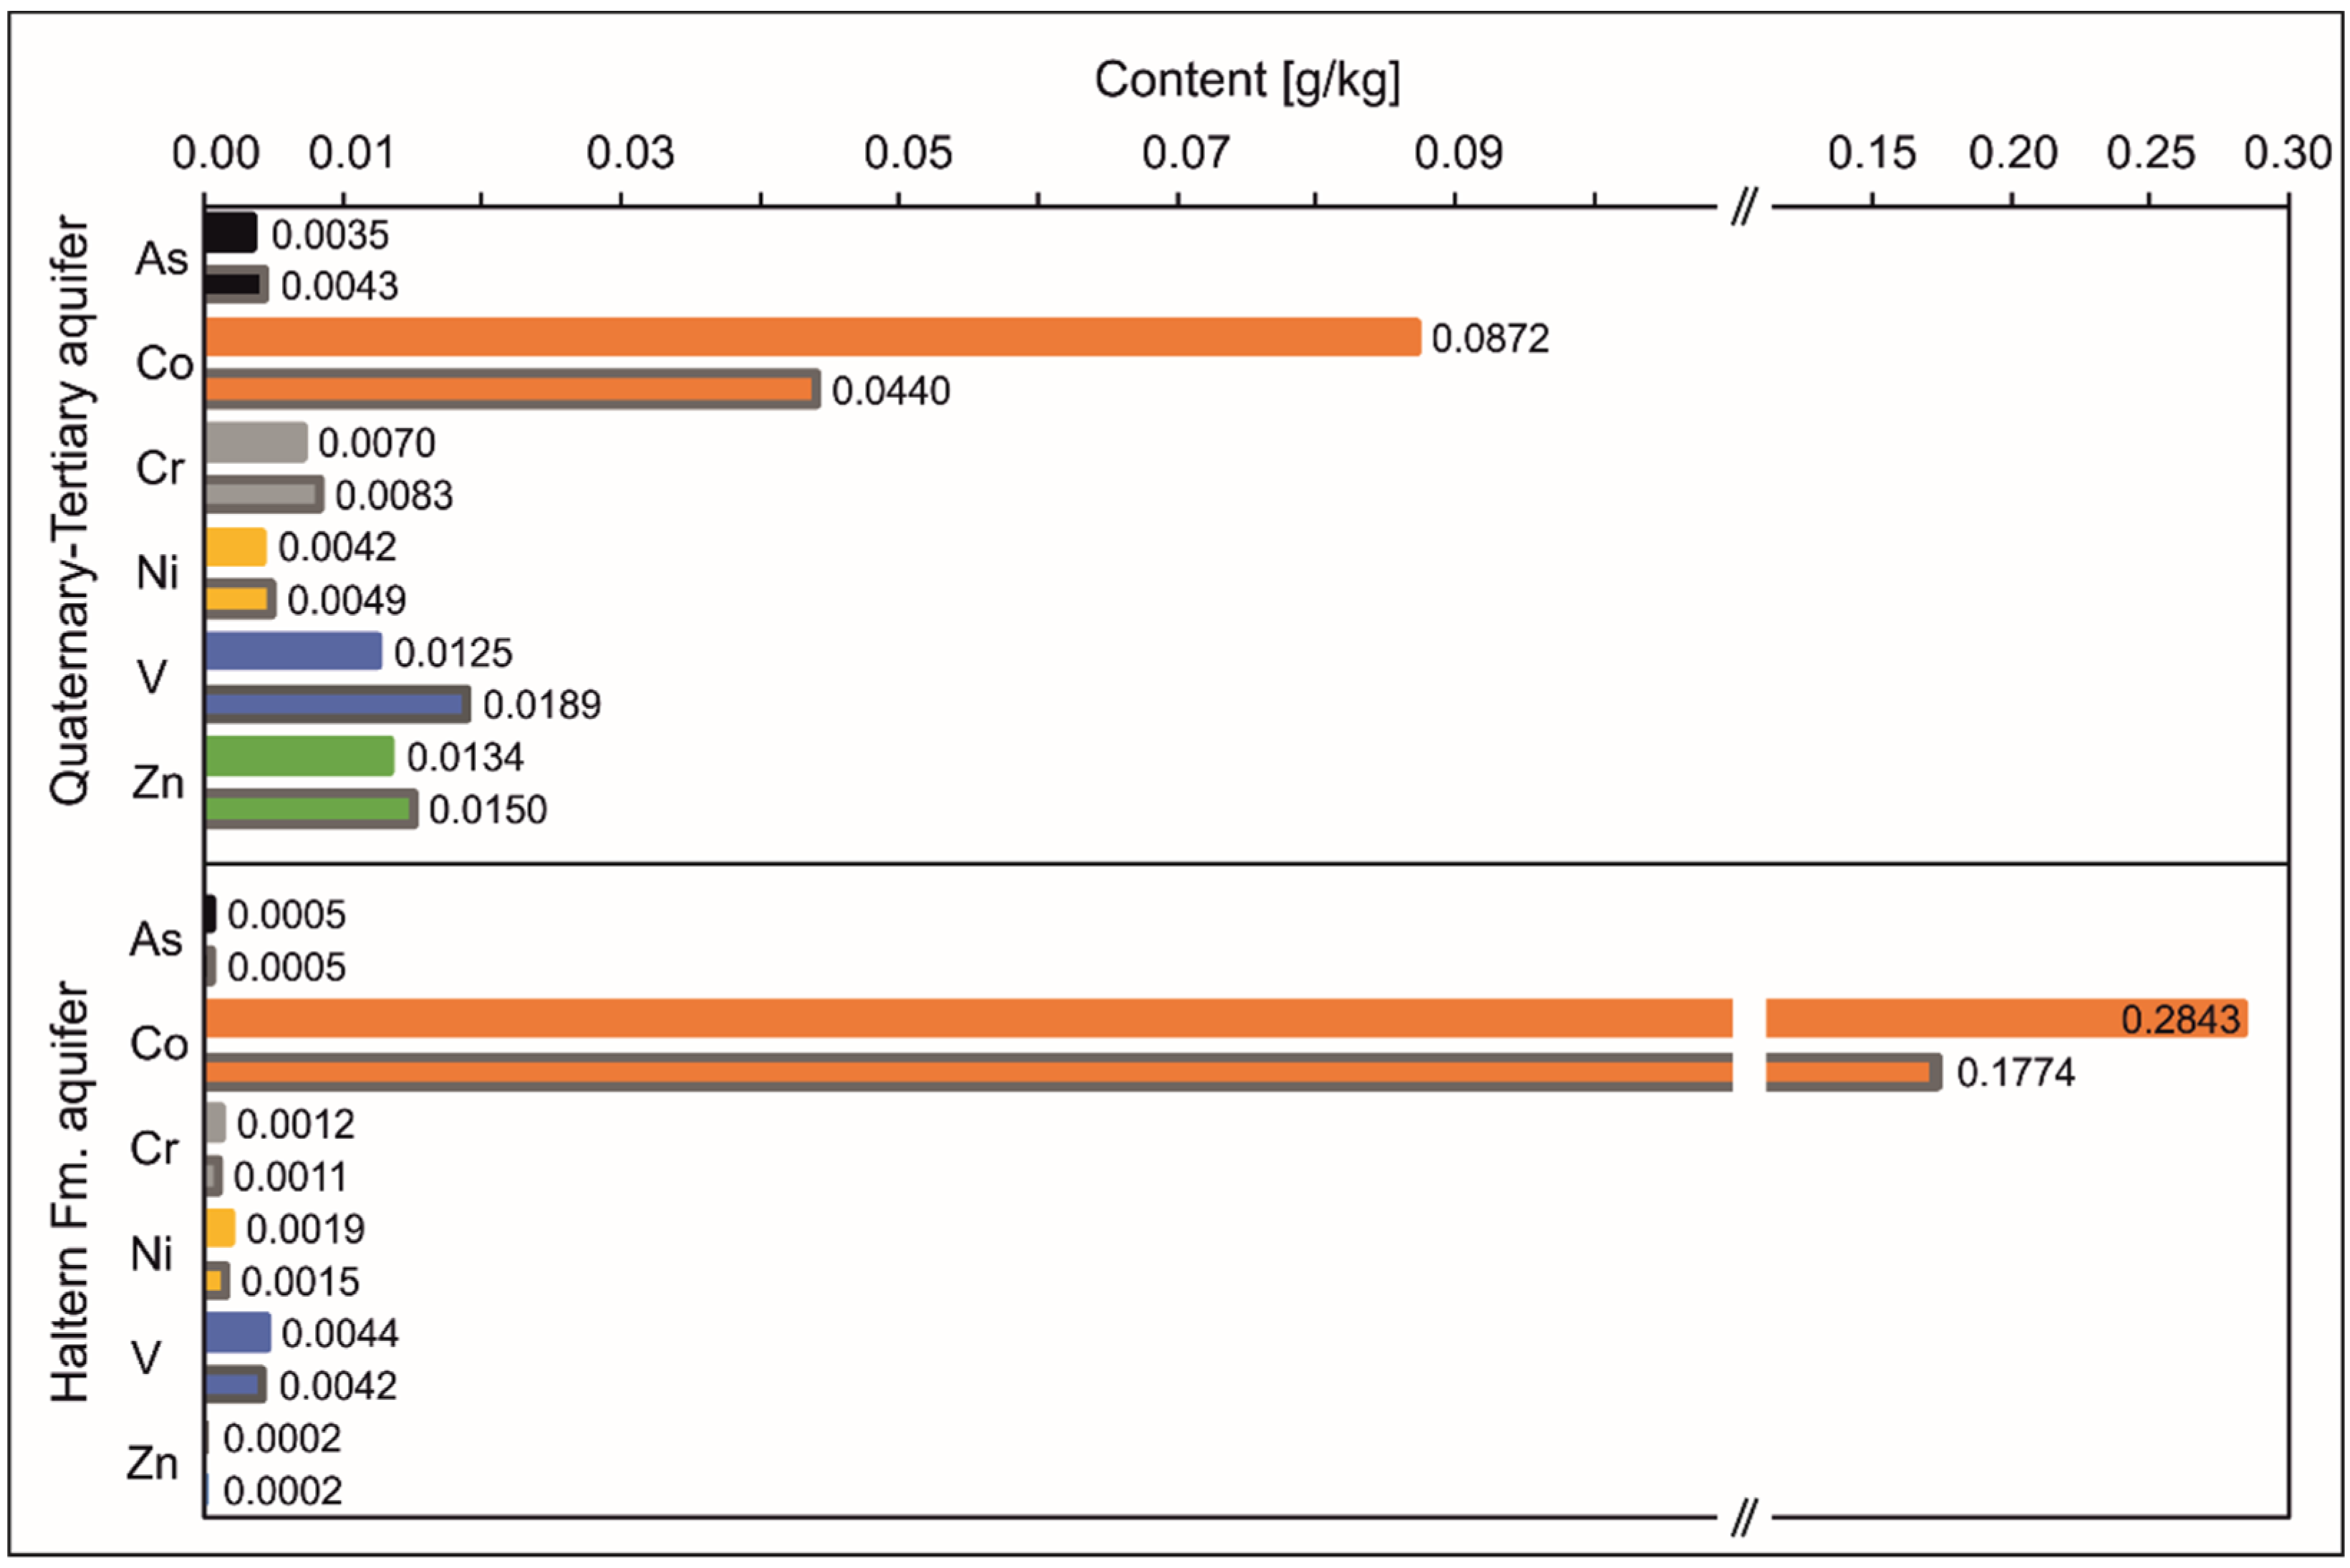
Contents of elutable trace elements from the sediments of the circulation column experiment provided further information about the trace elements mobilization potential from the sediments of the two compared study areas. At a first glance, Co contents in both sediments are immediately noticeable (Figure 12). As already explained in Section 2.3, these considerably increased contents can most likely be attributed to the used mill, in which Co is contained. Nevertheless, the sediments before as well as after the addition of 5 mmol ethanol indicated clear differences in the Co contents. Consequently, without considering the exact values, the elutable Co contents in the sediments of both study areas were lower after the addition of Corg than before.
Sediments from both study areas differed with regard to the other selected elutable trace element contents. Low contents of As, Cr, Ni, V, and Zn in Quaternary–Tertiary sediments increased after addition of organic C. As contents slightly increased from 0.0035 to 0.0043 g/kg, Cr from 0.007 to 0.0083 g/kg, and Ni from 0.0042 to 0.0049 g/kg. The fraction of mobilized Ni corresponded to 28% to 32.7% of the total Ni in the sediment. Zinc showed slightly higher contents, but values also increased only marginally from 0.0134 to 0.015 g/kg. The largest increase was observed for V, from 0.0125 to 0.0189 g/kg (this represents 26.0 to 39.4% of the total V in the sediment), although dissolved V was below the detection limit for the entire observation time in the water of the column experiments.
The contents of elutable trace elements in the sediments of the Haltern Fm. were even lower than in the sediments of the Quaternary–Tertiary aquifer. Zinc contents were below and As contents only slightly above the detection limit. Contrary to the observations of the other aquifer, contents of Cr, Ni, and V in the sediment dropped minimally after the addition of ethanol (Cr from 0.0012 to 0.0011 g/kg, Ni from 0.0019 to 0.0015 g/kg, and V from 0.0044 to 0.0042 g/kg). The fractions of Ni in the column experiment were 59.9% and 47.3% of the total Ni in the sediment.

4. Discussion

4.1. Sediment Analysis

Sediment analyses of the Quaternary–Tertiary aquifer showed a relatively high average Ssulf content of 1.2 g/kg, while Banning et al. [25] detected even higher Ssulf contents of 3.3 g/kg in other Tertiary marine sands in the Lower Rhine Embayment. According to DWA [34], a vertical NO3 breakthrough time in the deep wells of about 13,000 years could be calculated in this study area based on a Ssulf content of 1.2 g/kg. In addition, pH buffering of up to 1500 years can be expected due to the high proportions of Cinorg, which mainly consist of calcite and siderite [30]. Iron contents do not always follow those of Ssulf. Consequently, it can be assumed that Fe is present in large amounts in sulfides such as the mineral pyrite (FeS2), but partly also in other binding forms. The Ssulf content of the Haltern Fm. was below the detection limit with the exception of one measurement, and was thus considerably lower at the drilling site than the contents in the Quaternary–Tertiary aquifer. The Corg content was also low, at 0.97 g/kg. Thus, it can be assumed that the degradation capacity in the area of the observation well bundle is almost exhausted by lithotrophic NO3 reduction, and the organotrophic NO3 reduction potential is low. It is noticeable that the Fe content did not follow the Ssulf content above the redox boundary in the oxidized zone. Below the redox boundary in the reduced zone, the Fe content fit very well with the Ssulf content. Thus, the Fe below the redox boundary was mainly bound in sulfides. Above the redox boundary in the Haltern Fm., and especially in the Quaternary and the Bottrop Fm., Fe was also bound differently, for example in siderite or (hydr)oxides. An increase in the Fe content in the transition zone between the oxidized and reduced environment was also described by Banning et al. [26]. In this zone, the coexistence of reduced and oxidized Fe compounds is possible.
Selected trace elements in both study areas showed low contents. Even if, for example, Ma and Hooda [35] indicate average contents of Ni in sand-stone of 0.002 g/kg and the contents of the study areas with 0.004 (Haltern Fm.) and 0.015 g/kg (Quaternary-Tertiary aquifer) are above these contents. These values do not indicate considerable pollution. Total Ni contents in uncontaminated soils range between 0.013 to 0.040 g/kg [35]. One of the highest levels of Ni contamination was reported in topsoil in smelter in Sudbury, Canada, at 26 g/kg [36]. In addition, Smedley and Kinniburgh [28], for example, reported contents of up to 77 g/kg in sediments for As. Arsenic contents in this investigation showed values of 0.014 g/kg in both study areas. Results of the correlation analysis of Quaternary–Tertiary aquifer sediments indicated that the trace elements As and V, as well as Cr and Ni, appeared frequently with Fe. However, the correlations of the trace elements with S were much lower. Consequently, trace elements were assumed to be incorporated in sulfide mineral lattices and sorbed to (hydr)oxides. The results of the correlation analysis of the sediments from the Haltern Fm. show clearly less distinct correlations, which is partly due to the low contents in the sediment and the lower number of samples. Nevertheless, Ni and V can be assumed to be sorbed to (hydr)-oxides here as well. The even lower correlation coefficients of the trace elements with S rather do not indicate binding in sulfides.

4.2. Isotopic and Water Analysis

The mobilization of trace elements from the sediment depends on the redox milieu, pH, and ionic competition [28], which are crucial parameters. These parameters can be strongly influenced by the application of N fertilizer and the subsequent input of NO3, which acts as an oxidant. Therefore, the NO3 load and consequently the hydraulics of the aquifer play a crucial role. The characterization of the isotope ratios is an important method to evaluate the NO3 pollution and ongoing reactions more precisely. δ15N and δ18O in NO3 of the Quaternary–Tertiary aquifer showed typical values of NO3-polluted water. However, the measured values in the Quaternary differed considerably from those of the Tertiary. This is in accordance with the NO3 load, since high NO3 concentrations were found in the Quaternary, and NO3 values were found to be below the detection limit in the Tertiary. In the Quaternary, the isotopic ratios could be used to infer the presence of agricultural fertilizer. Additionally, no NO3 reduction occurred in the Quaternary. With the entry of the groundwaters into the Tertiary, a lithotrophic NO3 reduction occurred at about 50 m b.g.l. The isotopic analysis thus confirmed the conclusion of a redox boundary from Ortmeyer et al. [30]. The δ15N and δ18O ratios indicated that denitrification occurred even up to a depth of 81 m, and, in a minor form, possibly even beyond this depth. Consistent with the relatively high levels of Ssulf, the S isotopes indicated lithotrophic NO3 reduction. Overall, the δ34S ratios were in the slightly negative range (−8.5 to −5.9‰) but would have to be much more negative to clearly indicate pyrite oxidation. Otero et al. [37] observed a change in δ34S values from +10 to −20‰ during lithotrophic NO3 reduction in eastern Spain. In contrast, Schulte et al. [38] examined the isotopic ratios of pyrite–S in sediments of the Lower Rhine Embayment and found a strong variation of between −36.8 and +18.2‰. Actually, 25% of the samples analyzed there showed ratios >−10‰. This observation also explains the δ34S of this study area. Beyond 112 m b.g.l., the δ34S and δ18O signatures indicated SO42− reduction, which was also confirmed by the H2S odor during sampling. Consequently, further sulfides such as pyrite were probably formed from this depth onwards, further increasing the NO3 degradation capacity. A considerable decrease in Fe2+ concentration from 5.6 mg/L at 128 m b.g.l. to 1.2 mg/L at 156 m [30] underlines this assumption, since Fe2+ ions are bound in the sediment during the formation of pyrite (FeS2). The calculated vertical NO3 breakthrough time in the deep wells of about 13,000 years may therefore further increase due to the ongoing SO42− reduction. The δ13C isotope ratios in dissolved Cinorg also differed between Quaternary and Tertiary. These negative ratios in the Quaternary indicate the degradation of organic C, as this degradation is associated with a decrease in δ13C-DIC [19]. Since NO3 degradation did not occur in the Quaternary, the C isotopes here indicate aerobic respiration of Corg. In addition to the lithotrophic NO3 reduction by pyrite, which occurs preferentially in this aquifer, the isotope ratios in the Tertiary indicate an organotrophic NO3 reduction. Typical δ13C-DIC values range from −29 to −25‰ [19], but the δ13C-DIC ratios in the Tertiary of this study area were in the range of about −7.0‰. However, the detected pH buffering [30] resulted in dissolution of the Cinorg13CPDB between −2.7 and 0.5 ‰ and δ18OPDB between −0.57 and 1.13‰.), so the signals were affected here. A mixed signal for δ13C-DIC resulted from the organotrophic NO3 reduction as well as the dissolution of the Cinorg in the Tertiary. This observation is in agreement with those of Aravena and Robertson [39], who reported δ13C-DIC values of between −8.6 and −1.9 ‰ for carbonate-buffered waters.
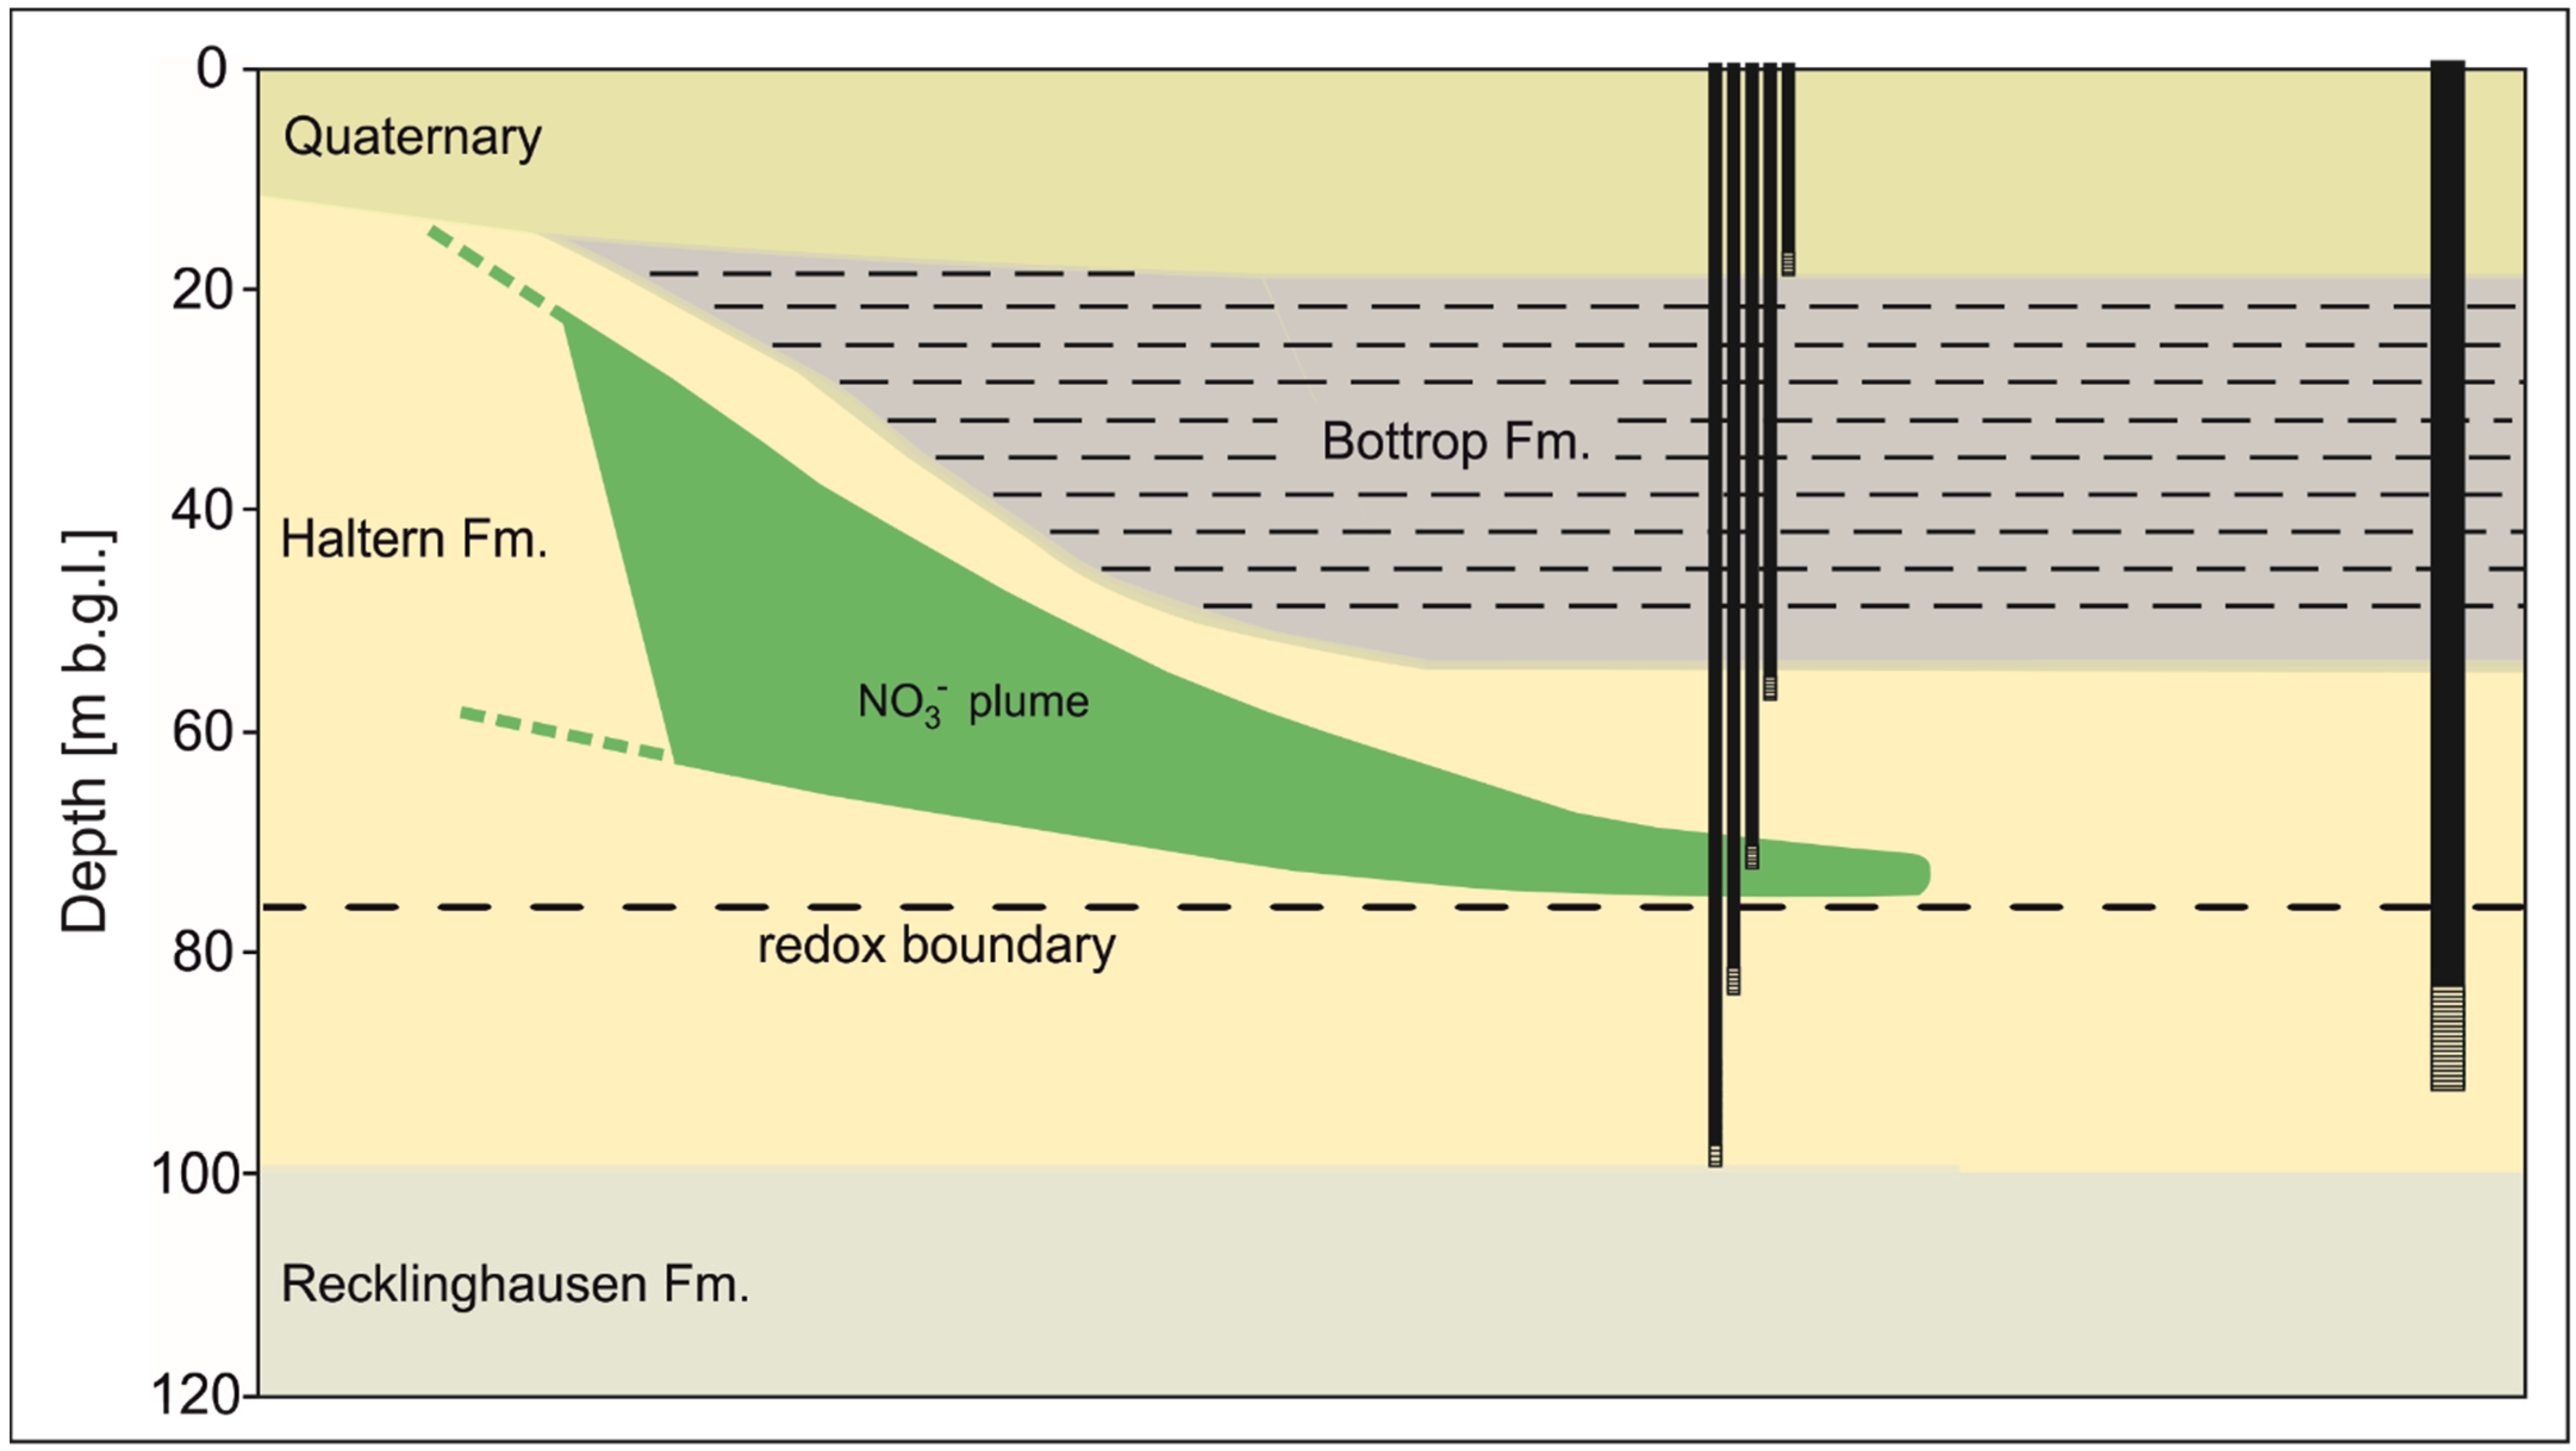
The flow regime of the groundwater in the Haltern Fm. differed from the flow regime of the Quaternary–Tertiary aquifer. While the water in the Quaternary–Tertiary aquifer flows vertically through it, due to the production wells in the Tertiary, this is not possible in the Haltern Fm. due to the protective layer of the Bottrop Fm. Thus, the groundwater dips below the Bottrop Fm. at its edge and flows towards the wells in the Haltern Fm. Since the depth-specific evaluation of the hydrochemistry showed NO3 at the location of the observation well bundle only at 70 m b.g.l. and in all other measurements NO3 was below the detection limit, the nitrate-contaminated water flowed preferentially at this depth. The increased chloride concentration at 70 m b.g.l. also underlines this assumption, since this also indicates an increased fertilizer input. The high O2 concentration at 70 m b.g.l., in addition to the NO3 concentration of 62.5 mg/L, indicates that the NO3 degradation capacity was already exhausted. Consequently, groundwater was interpreted to flow horizontally towards the wells and flow preferentially at a depth range of about 70 m b.g.l. The horizontal redox boundary at a 76 m depth was therefore not reached by the majority of the water. Consequently, in addition to the horizontal redox limit, which has already been confirmed by the sediments, there was also a vertical redox limit in this aquifer. This was located between the location of the observation well bundle and the well gallery, which is marked by the NO3 plume (Figure 13).
The isotopic characterization results also underlined the conclusion of preferential flow at about 70 m b.g.l. δ18O-NO3, for example, was considerably more negative here than at the other measurement depths. In addition, it can be assumed that low denitrification occurs in the rest of the Haltern Fm., despite low Ssulf contents, since δ15N-NO3 ratios would be even more negative without NO3 reduction. δ34S ratios also indicated lithotrophic NO3 reduction, as they exhibited negative values (consistent with the observations of Otero et al. [37]), with δ34S ratios as low as −20‰. The isotopic ratios at 70 and 86 m b.g.l. highlight the presumed preferential flow paths towards the wells, as the ratios were much less positive. At 70 m, the δ34S-SO42− ratio of −6.2‰ probably resulted from a mixture of sulfate-containing synthetic fertilizer with positive isotope ratios and very little lithotrophic NO3 reduction. At 86 m b.g.l. the same process probably occurs, but these waters are loaded with less sulfate-containing synthetic fertilizer because the preferred flow range ends here. Despite low C contents, the δ13C-DIC values of −10.6‰ to −7.4‰ also indicated low pH buffering in the Haltern Fm. The δ13C-DIC values were thus only slightly below the ratios observed by Aravena and Robertson [39] at −8.6 to −1.9‰ for carbonate-buffered waters at 56 and 70 m, respectively. Isotopic ratios at the base of the Quaternary also indicated low NO3 reduction.

4.3. Column Experiments

Results of the circulation column experiments confirmed lithotrophic NO3 reduction in Quaternary–Tertiary aquifer sediments, as there was a release of SO42− in addition to NO3 mitigation. Although it initially appeared that the geogenic NO3 degradation capacity of the Tertiary sediment was exhausted after the second refill with nitrate-containing water, a greater degradation of the NO3 concentration occurred again after sediment sampling from the column, which occurred prior to the addition of Corg. Thus, it is possible that the sediment sampling from the column caused the previously non-reactive or isolated pyrite to be in contact with the nitrate-loaded water. Jorgensen et al. [40] reported that only 50% of the Ssulf is reactive. Thus, denitrification after the addition of Corg possibly overlaps with the still geogenically available degradation capacity. Nevertheless, the reaction rate of 0.044 mmol × L−1*d−1 was 3.8 times smaller than the reaction rate with ethanol reported by Ortmeyer et al. [17]. This can be attributed firstly to the low initial NO3 concentration, which resulted from the unexpected NO3 degradation after sediment sampling from the column. Secondly, lower denitrification rates may also result from the smaller pore size of the silty fine sand, as denitrification may be inhibited by too-small pore sizes [4].
The circulation column experiment with the sediments of the Haltern Fm. showed a clearly lower NO3 degradation. In the first 24 h there was a clear reduction of NO3. Afterwards, no or only very low NO3 degradation could be observed. Even though SO42− continued to be released until the addition of ethanol, it can be assumed that in this column experiment, in contrast to the column experiment with the tertiary sands, the geogenic degradation capacity was largely exhausted. Nevertheless, the reaction rate by addition of 5 mmol ethanol was also 3.4 times smaller than the reaction rate with the same Corg reported by Ortmeyer et al. [17]. Since sediments of the Haltern Fm. were used in both experiments, an inhibition of denitrification by the pore size can be excluded. Nevertheless, since in Ortmeyer et al. [17] Corg is added in several reaction steps, the reduction potential of added electron donors should also be tested in several reaction steps in the future. In a first reaction step, denitrifying microorganisms still have to grow and proliferate. In further reaction steps, the different electron donors may also be even more effective at groundwater temperatures of 10°C if microorganisms have already grown.
Results of the trace element dynamics from column experiments showed Ni release from Tertiary sediments during lithotrophic NO3 reduction. As previously assumed by the correlation analysis, Ni was thus incorporated in the mineral lattice of pyrite. A decrease in the Ni concentration before the addition of Corg could only be observed due to the dilution when refilling the water reservoir with initial water. Compared to other studies, the release of Ni from pyrite was still very low. In an aquifer in the Netherlands, Ni concentrations from pyrite were released up to 0.65 mg/L [41]. In another aquifer in Denmark, Ni concentrations of up to 0.24 mg/L were determined and were also released from pyrite oxidation [25]. With an average of 0.005 mg/L, the Ni concentration was far below the limit value (0.02 mg/L) of the German Drinking Water Regulation [42]. In the sediments of the Haltern Fm., Ni mobilization is delayed and at the same time Co is released in an even smaller scale. The trace elements presumably also originate from sulfides, which are oxidized later due to a lower reactivity or due to a zoned oxidation. Here too, the Ni concentration is below the limit value of the German Drinking Water Regulation [42].
By adding 5 mmol ethanol to enhance NO3 reduction, the concentrations of the initially released trace elements dropped below the detection limit. The previously assumed additional mobilization of trace elements by the addition of Corg with an associated change in Eh and pH was not observed for the low trace element concentrations in sediment and water presented here. Corsini et al. [43] observed mobilization of trace elements by the addition of glucose, since As was reduced as well, resulting in increased mobility. Sediment analysis before and after addition of ethanol showed a slight increase in elutable trace elements from newly formed (hydr)oxides in the sediments of the Quaternary–Tertiary aquifer. Even if these proportions are very low, the small amounts of dissolved trace elements can be sorbed on these additional (hydr)oxides. The elutable trace elements of the sediments of the Haltern Fm. showed mainly constant contents. On the other hand, after the addition of ethanol, a Ssulf content of 0.15 g/kg, which was below the detection limit before addition, could be determined. The Eh values do not indicate particularly reduced conditions, but when 5 mmol ethanol is added undiluted to the reservoir, reducing facies and consequently the formation of sulfides can occur locally. It is assumed that the previously dissolved trace elements are incorporated into the newly formed sulfides. This assumption is also possible for the column experiment with the sediments of the Quaternary–Tertiary aquifer, since the Ssulf content decreased only slightly from 0.2 to 0.15 g/kg. Further studies are needed to investigate this process in more detail with higher trace element concentrations. With the low concentrations presented here, the addition of ethanol for enhanced denitrification showed a further advantage due to the decrease in trace element concentrations in this study. On the other hand, elevated Ni concentrations can have a negative impact on microorganisms [27]. In addition, Corsini et al. [43] described the formation of further microorganisms, which reduced trace elements and could then be in competition with the denitrifying microorganisms. Thus, the effectiveness of increased denitrification may be reduced in aquifers with elevated Ni concentrations.

5. Conclusions

Two important drinking water catchments with differing structure, formation, and geochemistry were investigated. The Quaternary–Tertiary aquifer in the Lower Rhine Embayment consists of two hydraulically directly connected layers, the coarse-grained Quaternary and the fine-sandy Tertiary. Quaternary groundwater contaminated with NO3 flows vertically through the aquifer due to deep production wells in the Tertiary. At a redox boundary at about 50 m b.g.l., NO3 is reduced due to the high NO3 degradation capacity of the Tertiary. Based on the observed SO42− reduction from a depth of 112 m b.g.l., an increase of the degradation capacity is expected. In contrast, a vertical flow of groundwater towards the production wells in the medium sands of the Haltern Fm. is not possible, since large parts of the study area are overlain by the Bottrop Fm., which acts as a protective aquitard. The groundwater thus dips below the Bottrop Fm. at its edge. It has been demonstrated that at the site of the observation well bundle, groundwater flows preferentially at a depth range of about 70 m b.g.l. Thus, unlike the Quaternary–Tertiary aquifer, a vertical redox boundary is present at the forefront of the NO3 plume.
Both study areas indicate low trace element contents in the sediments, whereas the Tertiary sands show slightly higher contents in comparison due to the higher Ssulf contents, which are nevertheless low. Consequently, the potential for trace element mobilization is also relatively low.
The column experiments using the sediments of the investigated areas showed lower reaction rates with an increased denitrification at a single addition of Corg than in previous studies. In comparison with other studies, the reduction potential of added electron donors should therefore also be tested in several reaction steps, because the actual effectiveness may only be achieved when microorganisms have already formed. Additionally, when investigating enhanced denitrification and the reduction potentials of different addition substrates, the concentrations of trace elements must also be considered, as, for example, elevated Ni concentrations have negative effects on microorganisms.
The addition of Corg in the form of ethanol does not only cause an induced denitrification in the column experiments, but also causes a decrease in low trace element concentrations. These trace elements are assumed to be fixed in newly formed sulfides or sorbed to newly formed (hydr)oxides.

Author Contributions

Conceptualization F.O. and A.B.; methodology F.O.; software F.O.; validation A.B. and S.W.; investigation F.O.; resources S.W.; data curation F.O.; writing—original draft preparation F.O.; writing—review and editing A.B.; visualization F.O.; supervision A.B.; funding acquisition F.O. and A.B. All authors have read and agreed to the published version of the manuscript.

Funding

We acknowledge support by the Open Access Publication Funds of the Ruhr-University Bochum.

Institutional Review Board Statement

Not applicable.

Informed Consent Statement

Not applicable.

Data Availability Statement

The data used in this study is presented in this paper and is additionally available from the authors on reasonable request.

Acknowledgments

We thank the water suppliers RWW (Rheinisch-Westfälische Wasserwerksgesellschaft mbH) and Stadtwerke Meerbusch for enabling this study and for providing hydrochemical data. Particular thanks are due to the water supplier’s employees Thomas Dietz and Theresa Pöhling as well as Norbert Becke. Special thanks go to Harald Strauß (Institute of Geology and Paleontology, Westfälische Wilhelms University Münster) for analysis of S isotopes as well as for detailed discussions and comments. Diana Burghardt (Faculty of Environmental Sciences, Technical University Dresden) and Sylvia Riechelmann (Sediment and Isotope Geology, Ruhr University Bochum) are thanked for the determination of N isotopes and C isotopes, respectively. We thank Thorsten Gökpinar (Hydrogeology, Ruhr-University Bochum) for his support in the precise monitoring of the cooling system of the column experiments. Special thanks belong to Kathrin Kotula and Johannes Brzeszniak who contributed to data production during their graduate theses.

Conflicts of Interest

The authors declare no conflict of interest.

References

  1. Hosono, T.; Tokunaga, T.; Kagabu, M.; Nakata, H.; Orishikida, T.; Lin, I.-T.; Shimadab, J. The use of δ15N and δ18O tracers with an understanding of groundwater flow dynamics for evaluating the origins and attenuation mechanisms of nitrate pollution. Water Res. 2013, 47, 2661–2675. [Google Scholar] [CrossRef] [PubMed]
  2. Almasri, M.N. Nitrate contamination of groundwater: A conceptual management framework. Environ. Impact Assess. Rev. 2007, 27, 220–242. [Google Scholar] [CrossRef]
  3. Carrey, R.; Otero, N.; Vidal-Gavilan, G.; Ayora, C.; Soler, A.; Gómez-Alday, J.J. Induced nitrate attenuation by glucose in groundwater: Flow-through experiment. Chem. Geol. 2014, 370, 19–28. [Google Scholar] [CrossRef]
  4. Rivett, M.O.; Buss, S.R.; Morgan, P.; Smith, J.W.N.; Bemment, C.D. Nitrate attenuation in groundwater: A review of biogeochemical controlling processes. Water Res. 2008, 42, 4215–4232. [Google Scholar] [CrossRef] [PubMed]
  5. Vitousek, P.M.; Aber, J.D.; Howarth, R.W.; Likens, G.E.; Matson, P.A.; Schindler, D.W.; Schlesinger, W.H.; Tilman, D.G. Human alteration of the global nitrogen cycle: Sources and consequences. Ecol. Appl. 1997, 7, 737–750. [Google Scholar] [CrossRef] [Green Version]
  6. Ortmeyer, F.; Mas-Pla, J.; Wohnlich, S.; Banning, A. Forecasting nitrate evolution in an alluvial aquifer under distinct environmental and climate change scenarios (Lower Rhine Embayment, Germany). Sci. Total Environ. 2021, 768, 144463. [Google Scholar] [CrossRef] [PubMed]
  7. Khan, I.A.; Spalding, R.F. Enhanced in situ denitrification for a municipal well. Water Res. 2004, 38, 3382–3388. [Google Scholar] [CrossRef] [PubMed]
  8. Vidal-Gavilan, G.; Carrey, R.; Solanas, A.; Soler, A. Feeding strategies for groundwater enhanced biodenitrification in an alluvial aquifer: Chemical, microbial and isotope assessment of a 1D flow-through experiment. Sci. Total Environ. 2014, 494–495, 241–251. [Google Scholar] [CrossRef] [PubMed]
  9. Korom, S.F. Natural denitrification in the saturated zone: A review. Water Resour. Res. 1992, 28, 1657–1668. [Google Scholar] [CrossRef]
  10. Ge, S.; Peng, Y.; Wang, S.; Lu, C.; Cao, X.; Zhu, Y. Nitrite accumulation under constant temperature in anoxic denitrification process: The effects of carbon sources and COD/ NO3–N. Bioresour. Technol. 2012, 114, 137–143. [Google Scholar] [CrossRef]
  11. Schroeder, A.; Souza, D.H.; Fernandes, M.; Rodrigues, E.B.; Trevisan, V.; Skoronski, E. Application of glycerol as carbon source for continuous drinking water denitrification using microorganism from natural biomass. J. Environ. Manag. 2020, 256, 109964. [Google Scholar] [CrossRef]
  12. Costa, D.D.; Albino, A.; Fernandes, M.; Lopes, R.; De Lourdes, M.; Magalh, B. Using natural biomass microorganisms for drinking water denitrification. J. Environ. Manag. 2018, 217, 520–530. [Google Scholar] [CrossRef]
  13. Schipper, L.A.; Vojvodic, M. Nitrate removal from groundwater and denitrification rates in a porous treatment wall amended with sawdust. Ecol. Eng. 2000, 14, 269–278. [Google Scholar] [CrossRef]
  14. Trois, C.; Pisano, G.; Oxarango, L. Alternative solutions for the bio-denitrification of landfill leachates using pine bark and compost. J. Hazard. Mater. 2010, 178, 1100–1105. [Google Scholar] [CrossRef]
  15. Carrey, R.; Rodríguez-Escales, P.; Soler, A.; Otero, N. Tracing the role of endogenous carbon in denitrification using wine industry by-product as an external electron donor: Coupling isotopic tools with mathematical modeling. J. Environ. Manag. 2018, 207, 105–115. [Google Scholar] [CrossRef] [Green Version]
  16. Margalef-Marti, R.; Carrey, R.; Soler, A.; Neus Otero, N. Evaluating the potential use of a dairy industry residue to induce denitrification in polluted water bodies: A flow-through experiment. J. Environ. Manag. 2019, 245, 86–94. [Google Scholar] [CrossRef]
  17. Ortmeyer, F.; Begerow, D.; Guerreiro, M.A.; Wohnlich, S.; Banning, A. Comparison of denitrification induced by various organic substances—Reaction rates, microbiology and temperature effect. Water Resour. Res. in revision.
  18. Böttcher, J.; Strebel, O.; Voerkelius, S.; Schmidt, H.-L. Using isotope fractionation of nitrate-nitrogen and nitrate-oxygen for evaluation of microbial denitrification in a sandy aquifer. J. Hydrol. 1990, 114, 413–424. [Google Scholar] [CrossRef]
  19. Nikolenko, O.; Jurado, A.; Borges, A.V.; Knöller, K.; Brouyère, S. Isotopic composition of nitrogen species in groundwater under agriculture areas: A review. Sci. Total Environ. 2018, 621, 1415–1432. [Google Scholar] [CrossRef] [PubMed]
  20. Houben, G.J.; Sitnikova, M.A.; Post, V.E. Terrestrial sedimentary pyrites as a potential source of trace metal release to groundwater—A case study from Emsland, Germany. Appl. Geochem. 2017, 76, 99–111. [Google Scholar] [CrossRef]
  21. Abraitis, P.K.; Pattrick, R.A.D.; Vaughan, D.J. Variations in the compositional, textural and electrical properties of natural pyrite: A review. Int. J. Miner. Process. 2004, 74, 41–59. [Google Scholar] [CrossRef]
  22. Diehl, S.; Goldhaber, M.B.; Koenig, A.E.; Lowers, H.A.; Ruppert, L.F. Distribution of arsenic, selenium, and other trace elements in high pyrite Appalachian coals: Evidence for multiple episodes of pyrite formation. Int. J. Coal Geol. 2012, 94, 238–249. [Google Scholar] [CrossRef]
  23. Karikari-Yeboah, O.; Skinner, W.; Addai-Mensah, J. The impact of preload on the mobilisation of multivalent trace metals in pyrite-rich sediment. Environ. Monit. Assess. 2018, 190, 398. [Google Scholar] [CrossRef] [PubMed]
  24. Larsen, F.; Postma, D. Nickel Mobilization in a groundwater well field: Release by pyrite oxidation and desorption from manganese oxides. Environ. Sci. Technol. 1997, 31, 2589–2595. [Google Scholar] [CrossRef]
  25. Banning, A.; Rüde, T.R. Enrichment processes of arsenic in oxidic sedimentary rocks—From geochemical and genetic characterization to potential mobility. Water Res. 2010, 44, 5512–5531. [Google Scholar] [CrossRef]
  26. Banning, A.; Rüde, T.R.; Dölling, B. Crossing redox boundaries—Aquifer redox history and effects on iron mineralogy and arsenic availability. J. Hazard. Mater. 2013, 262, 905–914. [Google Scholar] [CrossRef] [PubMed]
  27. Rinklebe, J.; Shahenn, S.M. Redox chemistry of nickel in soils and sediments: A review. Chemosphere 2017, 179, 265–278. [Google Scholar] [CrossRef] [PubMed]
  28. Smedley, P.L.; Kinniburgh, D.G. A review of the source, behaviour and distribution of arsenic in natural waters. Appl. Geochem. 2002, 17, 517–568. [Google Scholar] [CrossRef] [Green Version]
  29. Banning, A.; Pawletko, N.; Röder, J.; Kübeck, C.; Wisotzky, F. Ex situ groundwater treatment triggering the mobilization of geogenic uranium from aquifer sediments. Sci. Total Environ. 2017, 587–588, 371–380. [Google Scholar] [CrossRef]
  30. Ortmeyer, F.; Volkova, K.; Wisotzky, F.; Wohnlich, S.; Banning, A. Monitoring nitrate reduction: Hydrogeochemistry and clogging potential in raw water wells. Environ. Monit. Assess. 2021, 193, 112. [Google Scholar] [CrossRef]
  31. Banning, A.; Coldewey, W.G.; Göbel, P. A procedure to identify natural arsenic sources, applied in an affected area in North Rhine-Westphalia, Germany. Environ. Geol. 2009, 57, 775–787. [Google Scholar] [CrossRef]
  32. Zhu, J.; Yu, L.; Bakken, L.R.; Mørkved, P.T.; Mulder, J.; Dörsch, P. Controlled induction of denitrification in Pseudomonas aureofaciens: A simplified denitrifier method for dual isotope analysis in NO3. Sci. Total Environ. 2018, 633, 1370–1378. [Google Scholar] [CrossRef]
  33. Stock, P.; Order, S.; Burghardt, D. Further optimization of the denitrifier method for the rapid 15N and 18O analysis of nitrate in natural water samples. Rapid Comm. Mass Spectrom. 2020. [Google Scholar] [CrossRef]
  34. DWA—Deutsche Vereinigung für Wasserwirtschaft, Abwasser und Abfall (Ed.) DWA-Themen: Stickstoffumsatz im Grundwasser; Deutsche Vereinigung für Wasserwirtschaft, Abwasser und Abfall: Hennef, Germany, 2015; p. 87. [Google Scholar]
  35. Ma, Y.; Hooda, P.S. Chromium, nickel and cobalt. In Trace Elements in Soils, 1st ed.; Hooda, P.S., Ed.; John Wiley & Sons Ltd.: Oxford, UK, 2010; pp. 461–480. [Google Scholar]
  36. Cox, R.M.; Hutchinson, T.C. Environmental factors influencing the rate of spread of the grass Deschampsia caespitosa invading areas around the Sudbury nickel-copper smelter. Water Air Soil Pollut. 1981, 16, 83–106. [Google Scholar] [CrossRef]
  37. Otero, N.; Torrentó, C.; Soler, A.; Menció, A.; Mas-Pla, J. Monitoring groundwater nitrate attenuation in a regional system coupling hydrogeology with multi-isotopic methods: The case of Plana de Vic (Osona, Spain). Agric. Ecosyst. Environ. 2009, 133, 103–113. [Google Scholar] [CrossRef] [Green Version]
  38. Schulte, U.; Strauß, H.; Bergmann, A.; Obermann, P. Isotopenverhältnisse der Schwefel-und Kohlenstoffspezies aus Sedimenten und tiefen Grundwässern der Niederrheinischen Bucht. Grundwasser 1997, 2, 103–110. [Google Scholar] [CrossRef]
  39. Aravena, R.; Robertson, W.D. Use of multiple isotope tracers to evaluate denitrification in ground water: Study of nitrate from a large-flux septic system plume. Groundwater 1998, 36, 975–982. [Google Scholar] [CrossRef]
  40. Jorgensen, C.; Jacobsen, O.; Elberling, B.; Aamand, J. Microbial oxidation of pyrite coupled to nitrate reduction in anoxic groundwater sediment. Environ. Sci. Technol. 2009, 43, 4851–4857. [Google Scholar] [CrossRef]
  41. van Beek, C.G.E.M.; Hettinga, F.A.M.; Straatman, R. The effect of manure spreading and acid deposition upon groundwater quality at Vierlingsbeek, The Netherlands. IAHS Publ. 1989, 185, 155–162. [Google Scholar]
  42. Trinkwasserverordnung in der Fassung der Bekanntmachung vom 10. März 2016 (BGBl. I S. 459), die Zuletzt durch Artikel 1 der Verordnung vom 20. Dezember 2019 (BGBl. I S. 2934) Geändert Worden Ist. 2001. Available online: http://www.gesetze-im-internet.de/trinkwv_2001/ (accessed on 28 April 2021).
  43. Corsini, A.; Cavalca, L.; Crippa, L.; Zaccheo, P.; Andreoni, V. Impact of glucose on microbial community of a soil containing pyrite cinders: Role of bacteria in arsenic mobilization under submerged condition. Soil Biol. Biochem. 2010, 42, 699–707. [Google Scholar] [CrossRef]
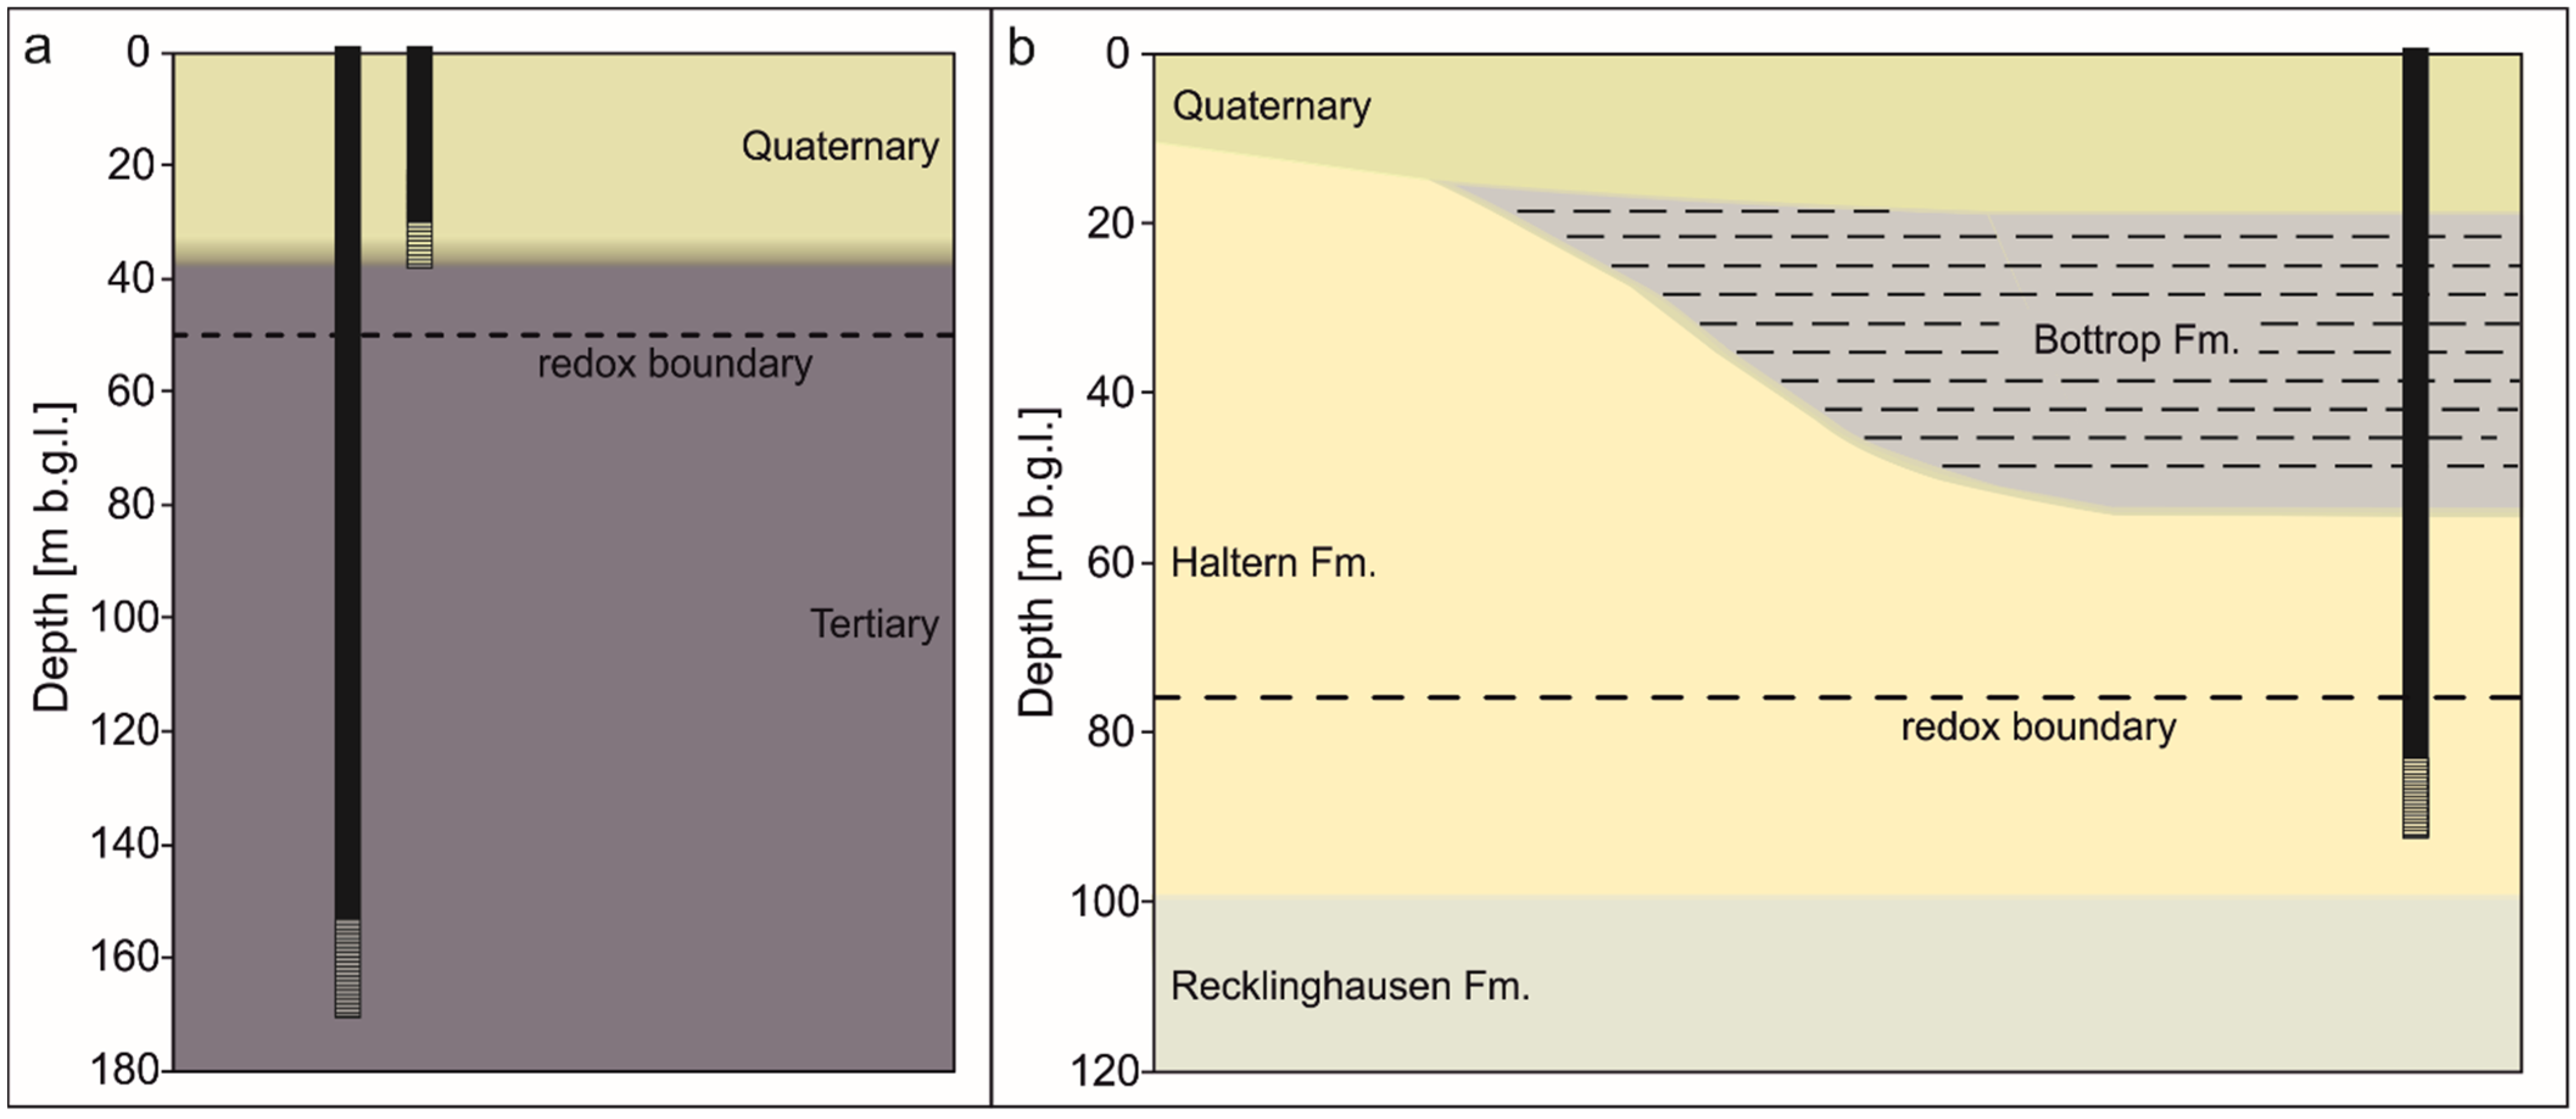
Figure 1. Schematic comparison of the 2 aquifers. (a) Quaternary–Tertiary aquifer with shallow and deeper production wells: The Quaternary and Tertiary are in direct hydraulic contact. (b) The Haltern Fm. aquifer with production wells, with the Bottrop Fm. as a protection layer.
Water 13 01589 g001
Figure 2. Sediment contents of the Quaternary–Tertiary aquifer. (a) Stot, Ssulf, and Fe content. (b) Ctot, Cinorg, and Corg content, and sediment isotope data of δ13CPDB and δ18OPDB.
Water 13 01589 g002
Figure 3. Trace element contents of the Quaternary–Tertiary.
Water 13 01589 g003
Figure 4. Spearman element correlation matrix for 25 samples of the Tertiary.
Water 13 01589 g004
Figure 5. Sediment contents of the Haltern Fm. aquifer. (a) Stot, Ssulf, and Fe content. (b) Ctot, Cinorg, and Corg.
Water 13 01589 g005
Figure 6. Trace element contents of the Haltern Fm. aquifer.
Water 13 01589 g006
Figure 7. A Spearman element correlation matrix for 8 samples of the Haltern Fm.
Water 13 01589 g007
Figure 8. Isotope ratios in the groundwater of the Quaternary–Tertiary aquifer. (a) δ15N-NO3 and δ18O-NO3. (b) δ34S-SO42−, δ18O-SO42−, and δ13C-DIC.
Water 13 01589 g008
Figure 9. Concentration of selected anions as well as O2 in the groundwater of the Haltern Fm.
Water 13 01589 g009
Figure 10. Isotope ratios in the groundwater of the Haltern Fm. aquifer. (a) δ15N-NO3 and δ18O-NO3. (b) δ34S-SO42−, δ18O-SO42−, and δ13C-DIC.
Water 13 01589 g010
Figure 11. The anion and trace element concentration of circulation column experiments. Left: (a) Anions; (b) Trace elements of the Quaternary–Tertiary aquifer. Right: (c) Anions; (d) Trace elements of the Haltern Fm. aquifer, with injection of ethanol marked by red vertical lines and water refill marked by thin black vertical lines.
Water 13 01589 g011
Figure 12. Content of elutable trace elements by redox inversion with ammonium oxalate. Before addition of Corg: without gray frame. After addition of Corg: with gray frame. Top: Quaternary–Tertiary aquifer. Bottom: Haltern Fm. aquifer. Note the change of scale on the x-axis.
Water 13 01589 g012
Figure 13. A schematic overview of the Haltern Fm. aquifer with the observation well bundle and an exemplary production well. A schematic NO3 plume is shown in green.
Water 13 01589 g013
Publisher’s Note: MDPI stays neutral with regard to jurisdictional claims in published maps and institutional affiliations.