Interaction between Surface Water and Groundwater in Yinchuan Plain


Abstract
1. Introduction
2. Methodology
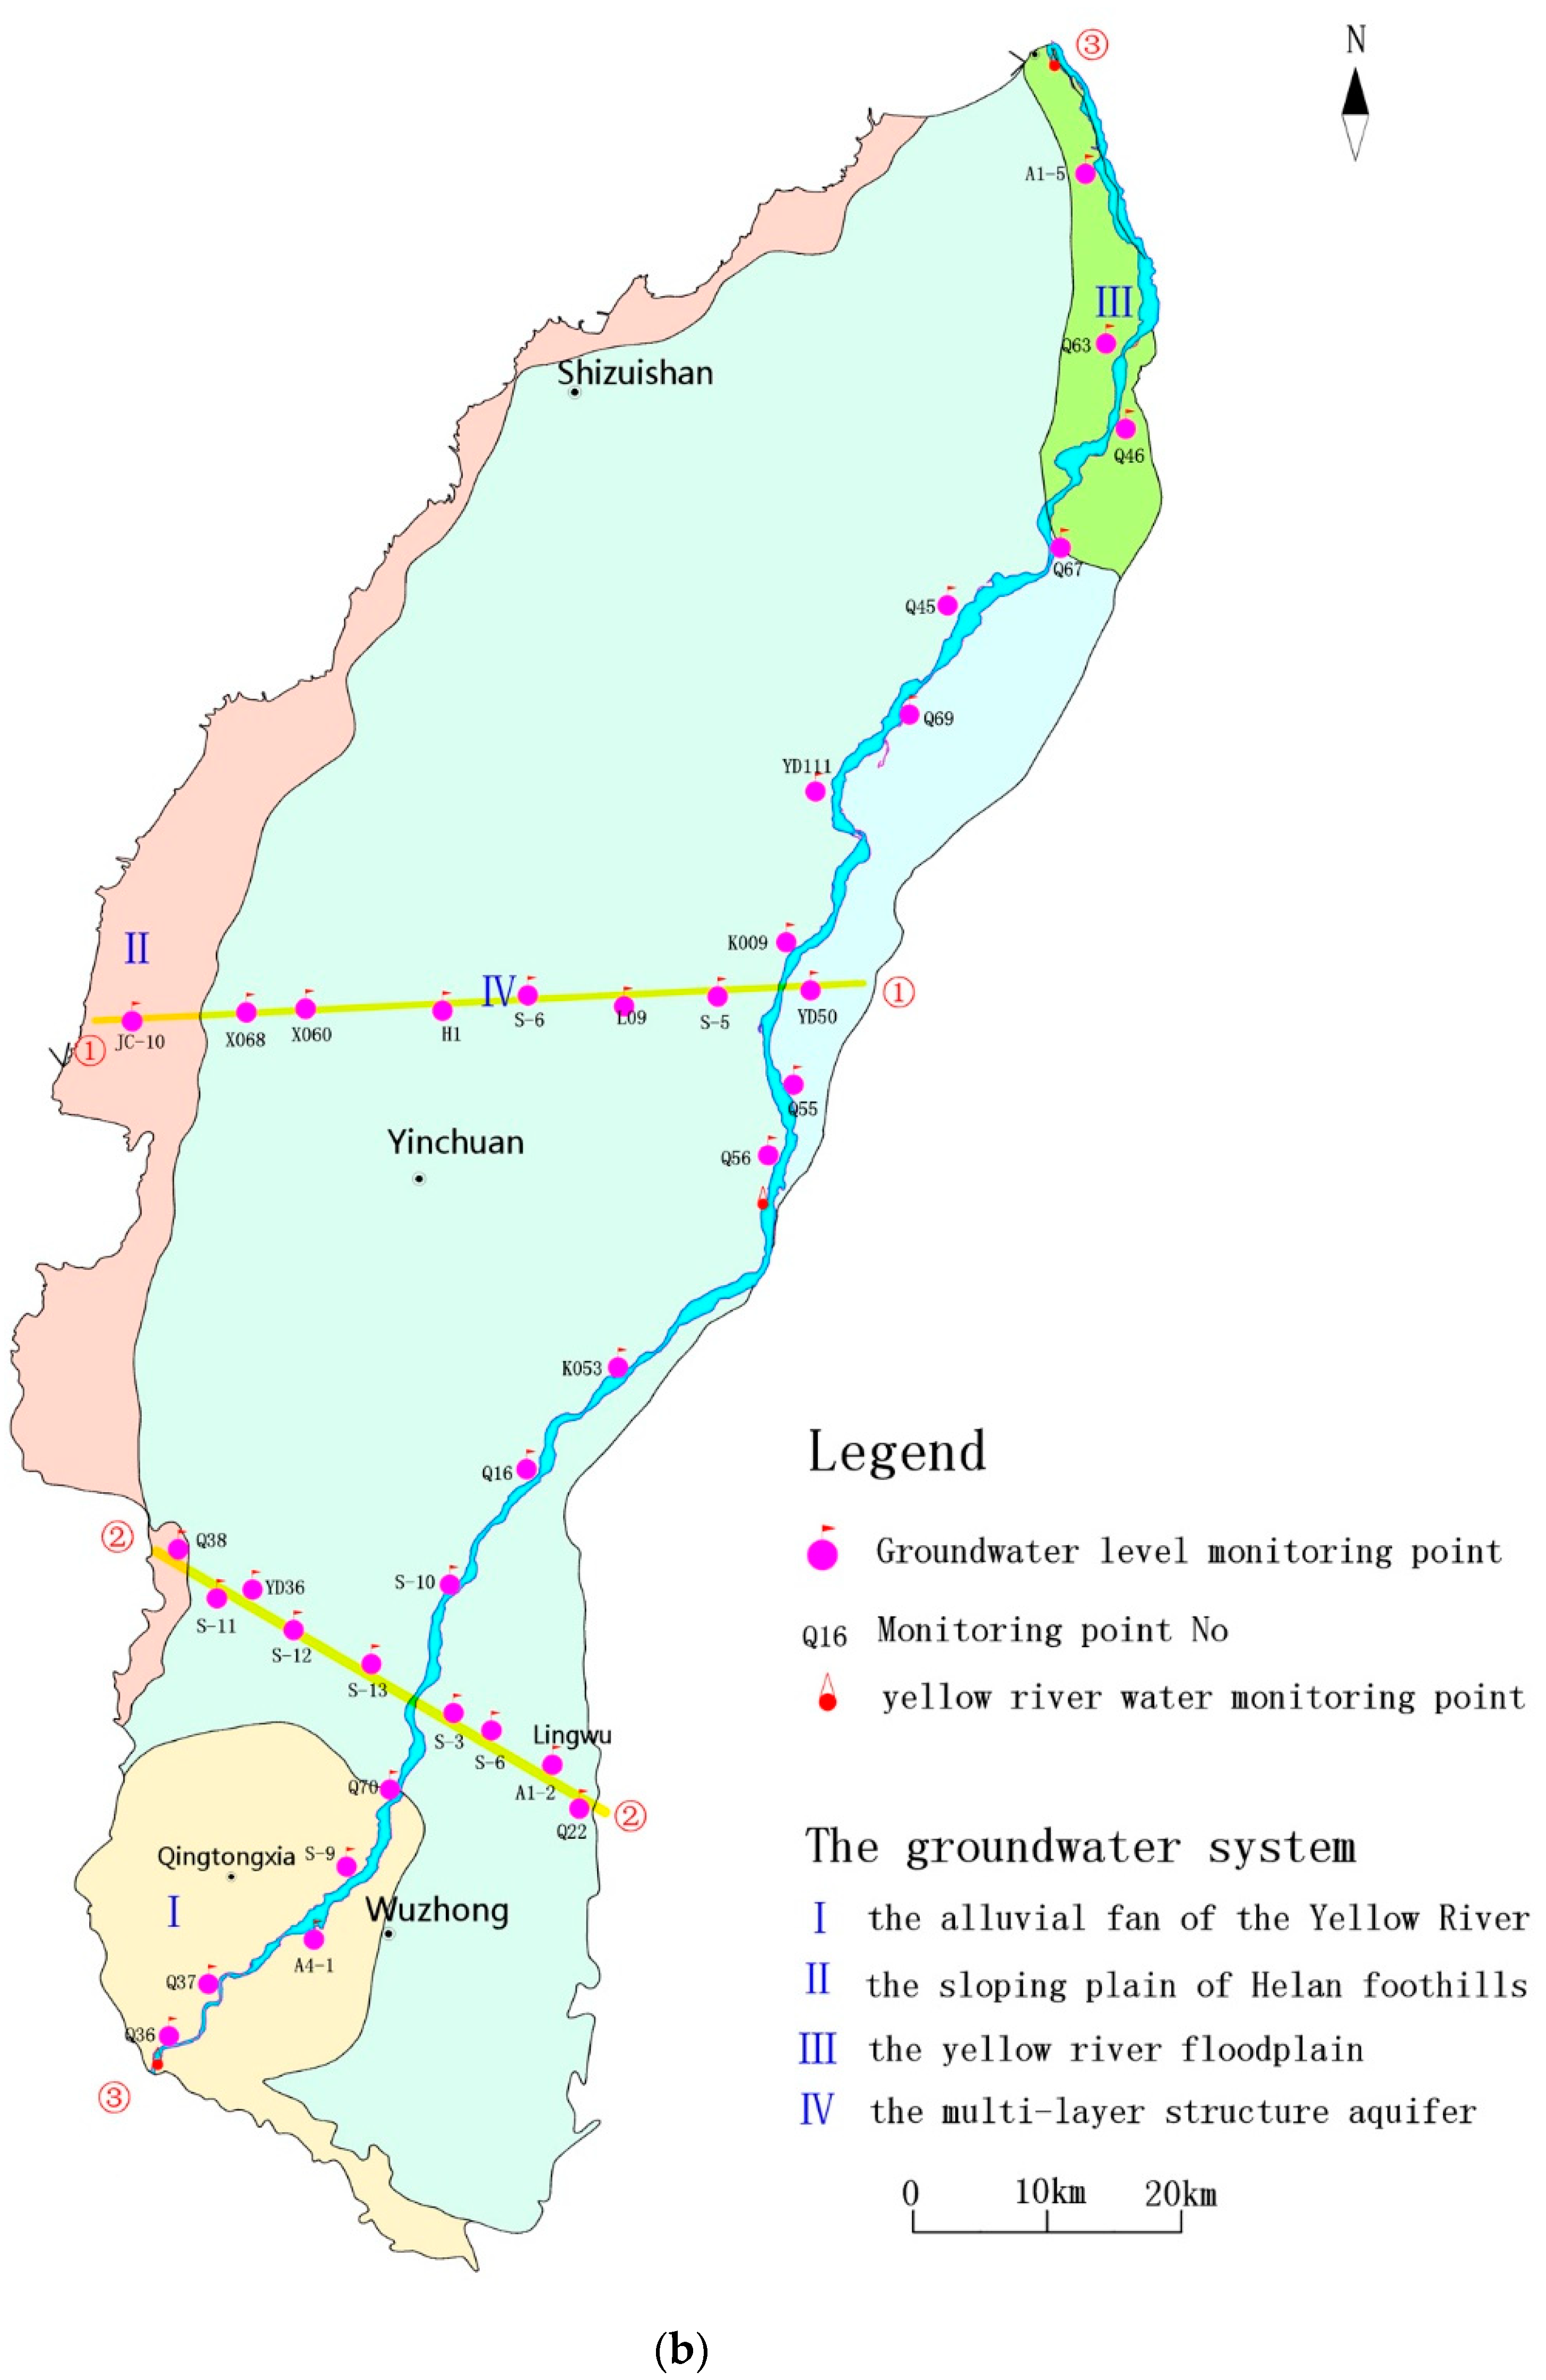
2.1. Study Area
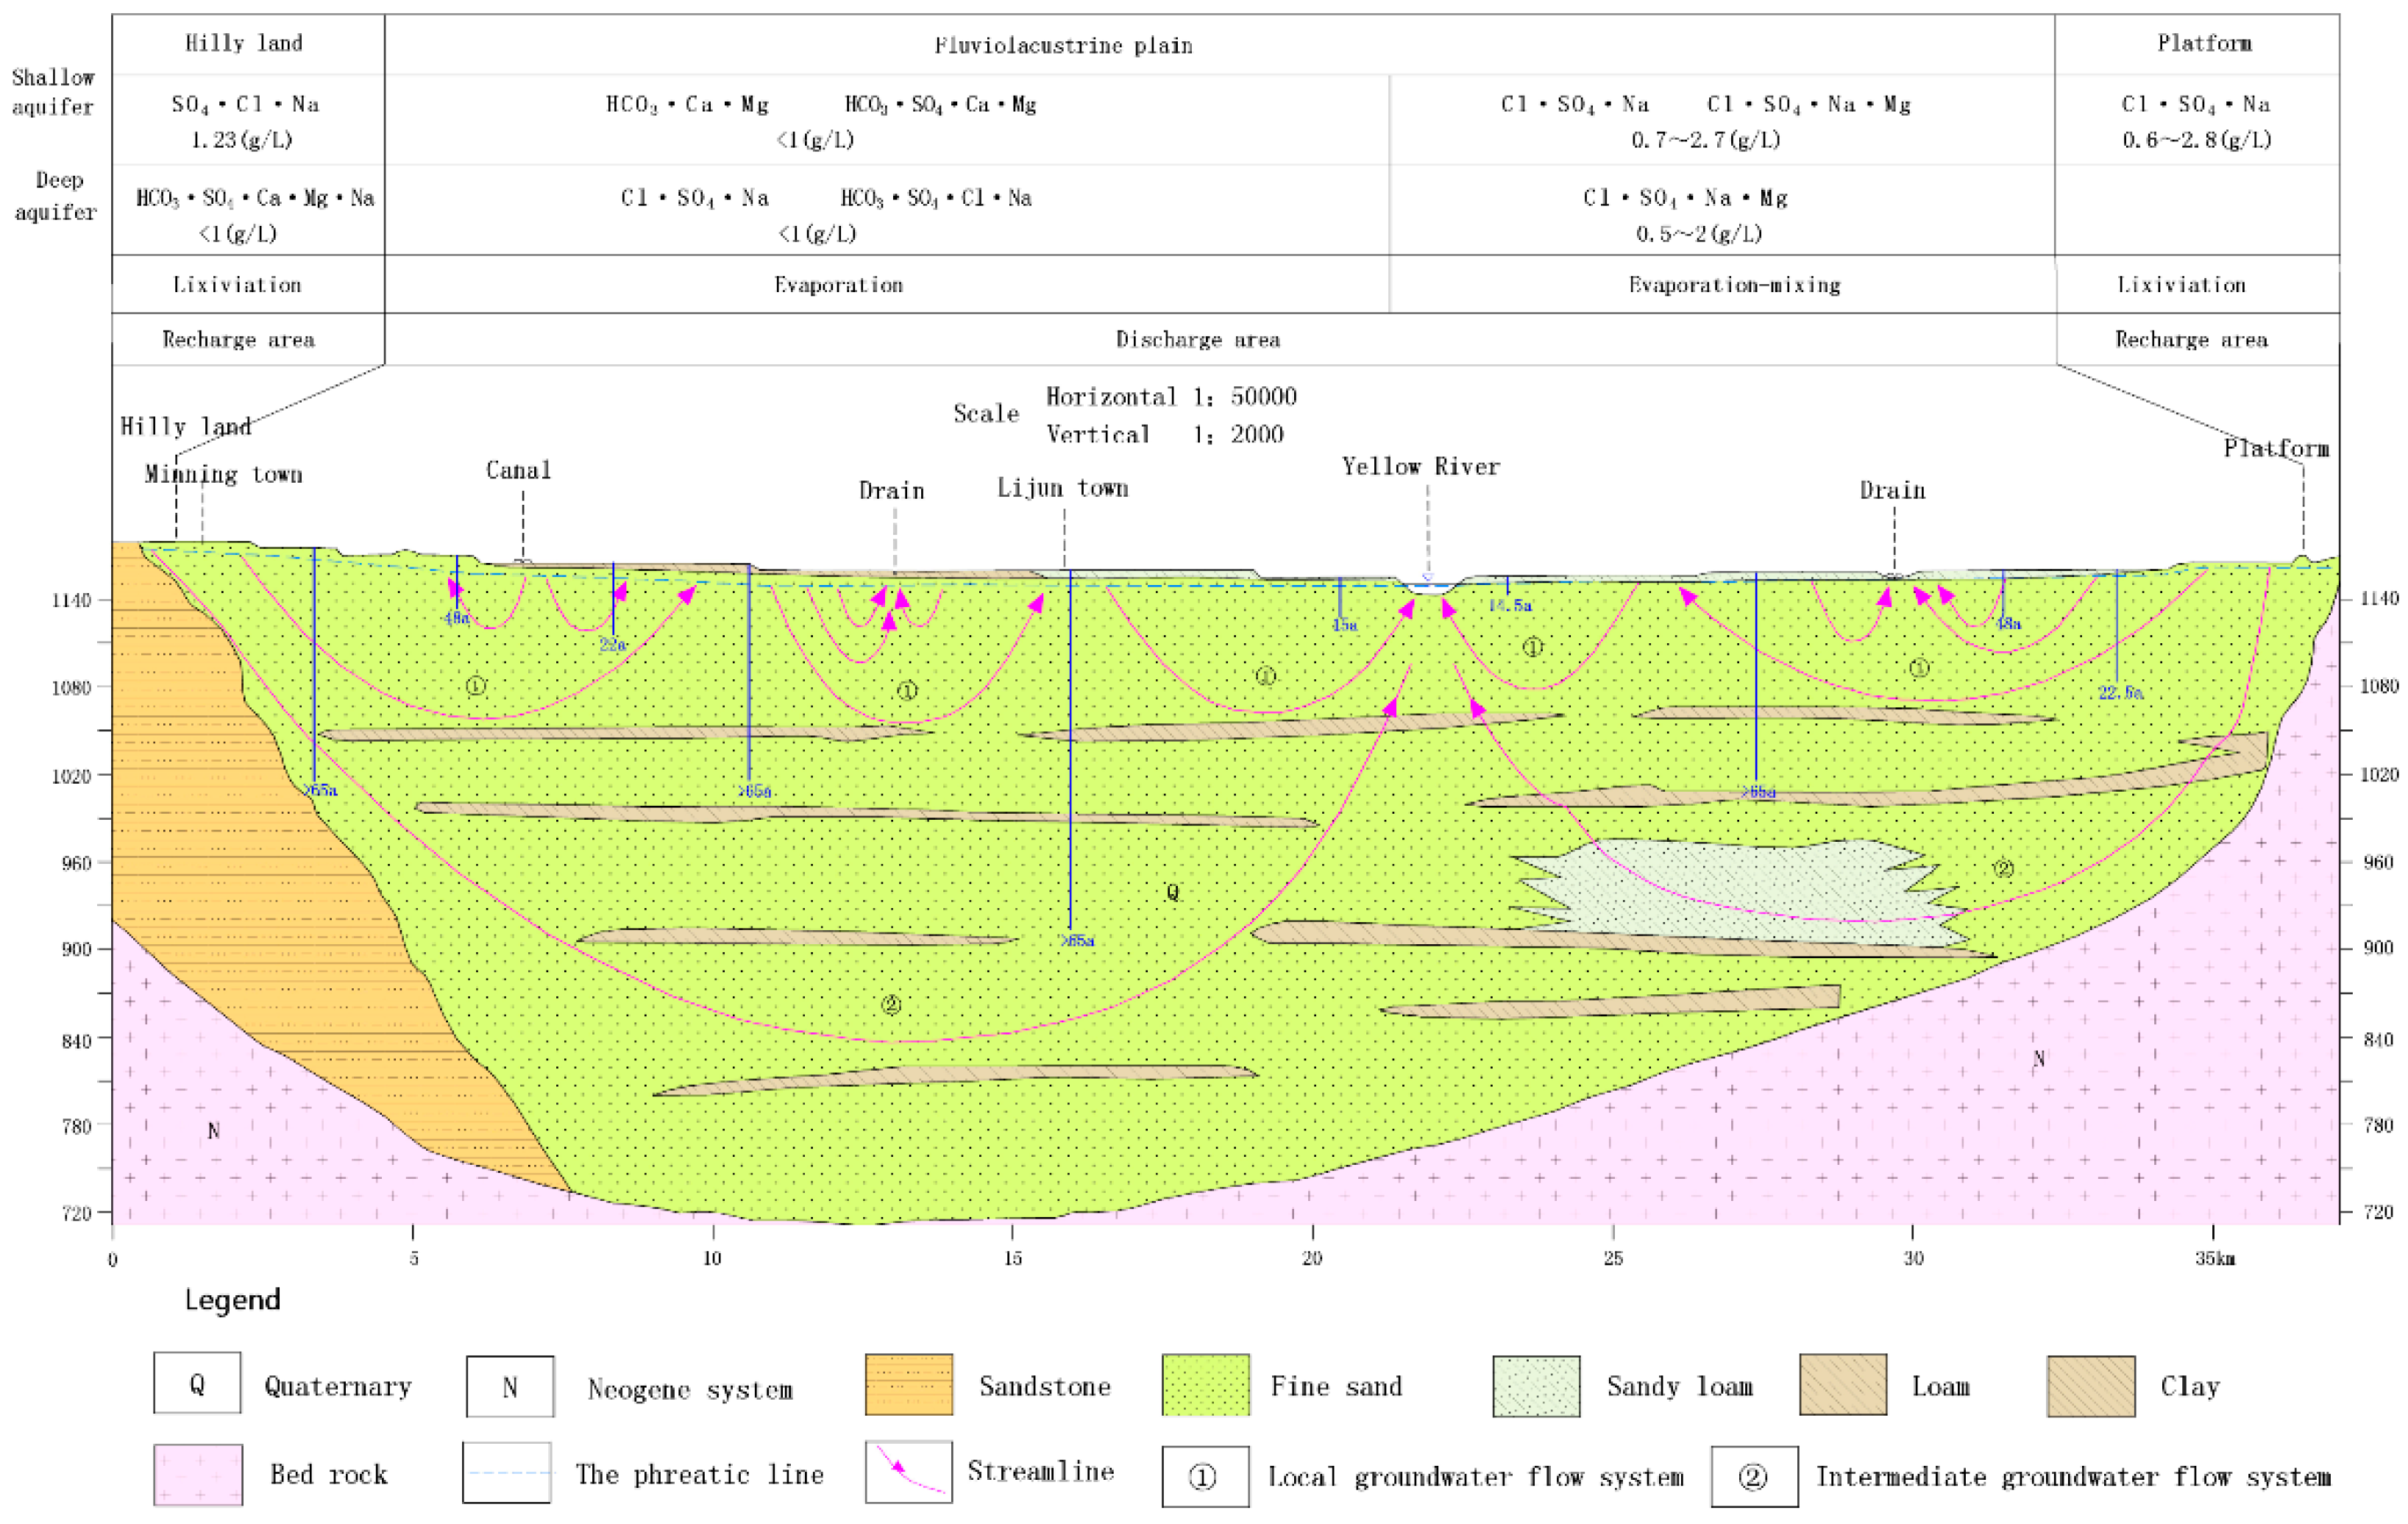
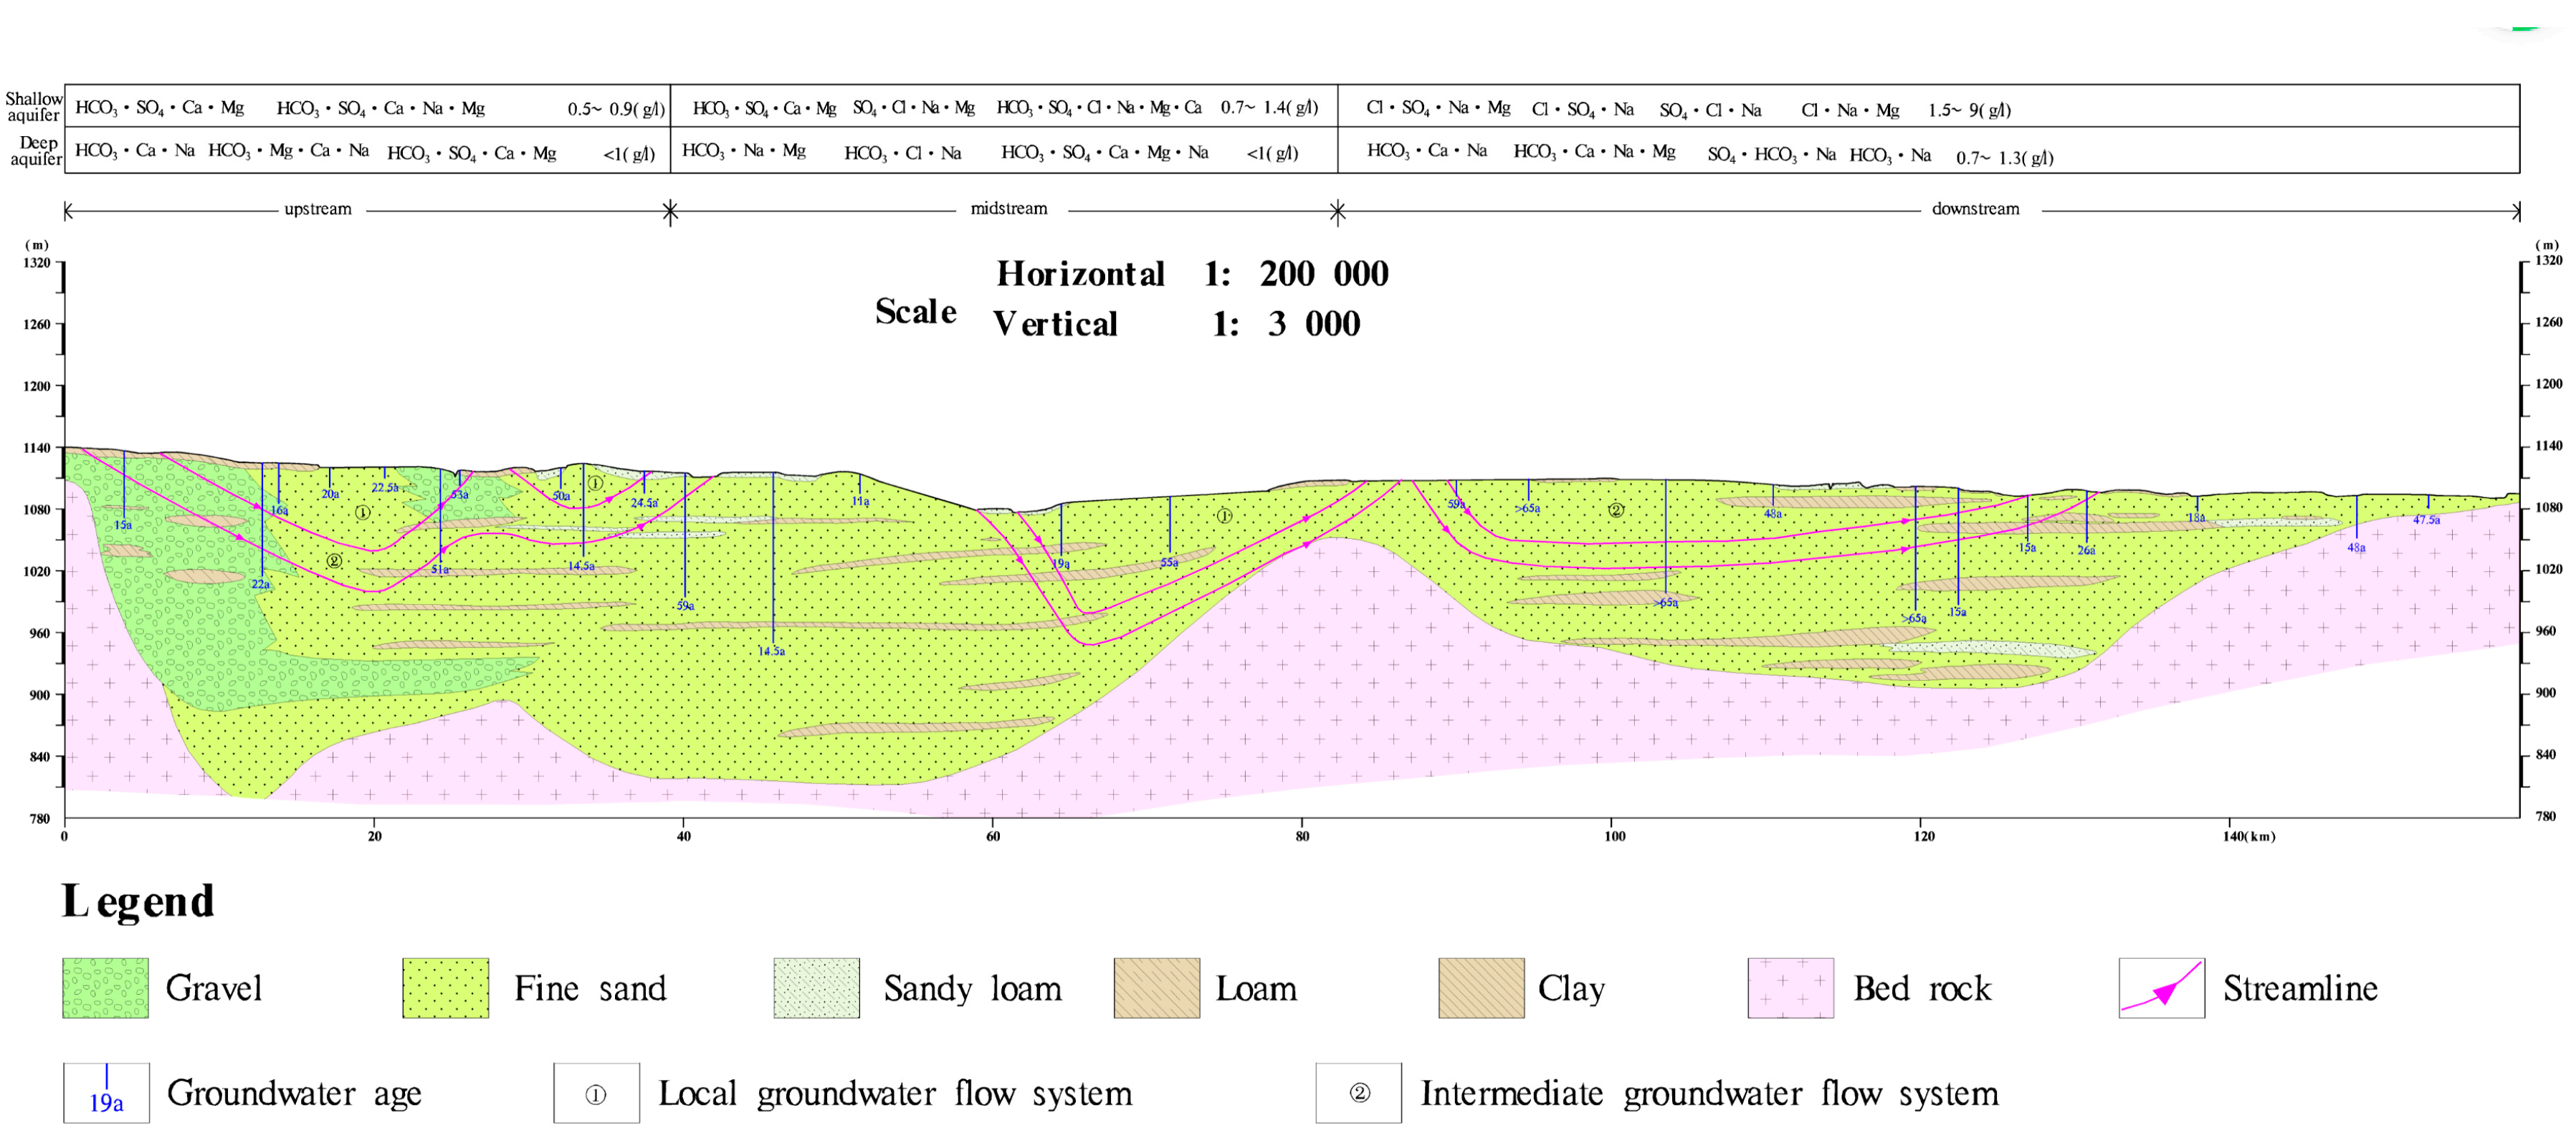
2.2. Typical Profiles Settings
2.3. Methods and Data Collection
2.4. Numerical Model Building
3. Results
3.1. Groundwater Flow Modeling
3.2. Profile 1
3.3. Profile 2
3.4. Profile 3
4. Discussion
4.1. Interpretation to Isotopes of SW–GW Interaction in Yinchuan Plain
4.2. Geological Structure Controlling SW–GW Interaction
4.3. The Impact of Human Activity
4.4. SW–GW Interaction Process in Yinchuan Plain
4.5. Exploration of GW Resources Exploitation
- (1)
- The Helan Mountain Floodplain is the main recharge area of the regional GW flow system. Because there is no perennial river in Helan Mountain, the rainfall is scarce, the recharge is limited, and the GW renewability is poor, so it is not suitable for large-scale development of GW.
- (2)
- In the alluvial fan plain area of the upper reaches of the Yellow River, the GW in this area is mainly recharged by the Yellow River, and the sand gravel layer below the surface is conducive for the seepage of irrigation water. The GW renewability is strong and the water quality is excellent, which can be used as a water source for Yinchuan City.
- (3)
- Current mode, i.e., relying merely on Yellow River water for irrigation, in main irrigation areas in the Yinchuan Plain should be changed. The combination of canal irrigation and well irrigation should be used to improve the drainage ditches, limit the amount of SW irrigation, and rationally develop and utilize shallow GW. This will not only prevent soil from salinization, and improve soil quality, but also reduce the inefficient evaporation of shallow GW, advance the utilization efficiency of water resources, and alleviate the contradiction between supply and demand of water resources.
- (4)
- There are many lake wetlands in Yinchuan Plain. In order to protect the lake wetlands, we must focus on the hydrological cycle, sustain the source of lakes and pay more attention to the impact of the SW–GW interaction.
5. Conclusions
- (1)
- In arid and semi-arid areas, there are frequent mutual interactions between SW and GW. The geological structure controls the basic mode of SW–GW interaction. In the mountain fault basin, river valley areas and plain areas, thick loose sediments are accumulated, forming the main GW recharge area. The piedmont sag and alluvial–proluvial plain is the watershed-runoff transformation area where precipitation is rare and evaporation is intense. The downstream lake wetlands are the consumption areas of water resources.
- (2)
- Through the construction of reservoirs, water diversion irrigation, groundwater development and other closely related activities, human activities interfere with the SW and GW circulation to the native state, change the recharge–discharge relationship between SW and GW aquifers, and cause a decline in the exchange of SW and GW. It further homogenizes the spatial distribution of GW recharge and discharge conditions, and extends the affected area, which causes variation of the dynamic field and hydro-chemical field of the GW system, even causes the great change of GW quality and induces certain negative effects on geological–ecological environments.
- (3)
- From mountainous areas to plains, the SW–GW interaction in different geological and geomorphological units is an important feature of water resources in arid and semi-arid areas. The GW flow system controls the evolution of SW modes and the dynamics of phreatic level. The GW maintains the wetland area such as the overflow zone and the tail-end lake. To maintain the area of the lake and wetland in the Yinchuan Plain, the development of GW resources in the recharge area must be controlled regarding the regional hydrological cycle.
- (4)
- The topography controls the material migration in the water and the lithology of the strata provides the chemical composition in the water. In arid and semi-arid areas, arid climate and strong evaporation determine the material accumulation, human activities lead to the accumulation of a certain degree of change and water chemistry has an indicative role in the circulation of GW, which can effectively reveal the SW–GW interaction. From the piedmont to the plain in Yinchuan Plain, and during the mutual interaction of SW and GW, their hydro-chemical types are HCO3, HCO3•SO4 (SO4•HCO3), HCO3•SO4•CI and HCO3•CI (CI•HCO3 or CI•SO4), and cations are transformed from Ca (Ca•Na, Ca•Mg) to Na•Mg (Na). Along the Yellow River, the evolution of GW chemistry is similar, from HCO3•SO4 to HCO3•Cl•Na•Mg and SO4•Cl•Na•Mg, and then Cl•SO4 in the lower reaches, with obvious horizontal zoning which is consistent with the topographic relief, conforms to the law of continental salt accumulation and also reflects the SW–GW interaction.
Author Contributions
Funding
Conflicts of Interest
References
- Sophocleous, M. Interactions between groundwater and surface water: The state of the science. Hydrogeol. J. 2002, 10, 52–67. [Google Scholar] [CrossRef]
- Lambs, L. Interactions between groundwater and surface water at river banks and the confluence of rivers. J. Hydrol. 2004, 288, 312–326. [Google Scholar] [CrossRef]
- Kalbus, E.; Reinstorf, F.; Schirmer, M. Measuring methods for groundwater? surface water interactions: A review. Hydrol. Earth Syst. Sci. 2006, 10, 873–887. [Google Scholar] [CrossRef]
- Wang, W.; Wang, Z.; Hou, R.; Guan, L.; Dang, Y.; Zhang, Z.; Wang, H.; Duan, L.; Wang, Z. Modes, hydrodynamic processes and ecological impacts exerted by river–groundwater transformation in Junggar Basin, China. Hydrogeol. J. 2018, 26, 1547–1557. [Google Scholar] [CrossRef]
- Kalbus, E.; Schmidt, C.; Molson, J.W.; Reinstorf, F.; Schirmer, M. Influence of aquifer and streambed heterogeneity on the distribution of groundwater discharge. Hydrol. Earth Syst. Sci. 2009, 13, 69–77. [Google Scholar] [CrossRef]
- Winter, T.C. Relation of streams, lakes, and wetlands to groundwater flow systems. Hydrogeol. J. 1999, 7, 28–45. [Google Scholar] [CrossRef]
- Trásy, B.; Kovács, J.; Hatvani, I.; Havril, T.; Nemeth, T.; Scharek, P.; Szabo, C. Assessment of the interaction between surface- and groundwater after the diversion of the inner delta of the River Danube (Hungary) using multivariate statistics. Anthropocene 2018, 22, 51–65. [Google Scholar] [CrossRef]
- Wu, X.; Zheng, Y.; Wu, B.; Tian, Y.; Han, F.; Zheng, C. Optimizing conjunctive use of surface water and groundwater for irrigation to address human-nature water conflicts: A surrogate modeling approach. Agric. Water Manag. 2016, 163, 380–392. [Google Scholar] [CrossRef]
- Liu, F.; Song, X.; Yang, L.; Han, D.; Zhang, Y.; Ma, Y.; Bu, H. The role of anthropogenic and natural factors in shaping the geochemical evolution of groundwater in the Subei Lake basin, Ordos energy base, Northwestern China. Sci. Total. Environ. 2015, 538, 327–340. [Google Scholar] [CrossRef]
- Wang, S.; Tang, C.; Song, X.; Wang, Q.; Zhang, Y.; Yuan, R. The impacts of a linear wastewater reservoir on groundwater recharge and geochemical evolution in a semi-arid area of the Lake Baiyangdian watershed, North China Plain. Sci. Total. Environ. 2014, 482, 325–335. [Google Scholar] [CrossRef]
- Saha, G.C.; Li, J.; Thring, R.W.; Hirshfield, F.; Paul, S. Temporal dynamics of groundwater-surface water interaction under the effects of climate change: A case study in the Kiskatinaw River Watershed, Canada. J. Hydrol. 2017, 551, 440–452. [Google Scholar] [CrossRef]
- Wang, W.; Zhang, Z.; Duan, L.; Wang, Z.; Zhao, Y.; Zhang, Q.; Dai, M.; Liu, H.; Zheng, X.; Sun, Y. Response of the groundwater system in the Guanzhong Basin (central China) to climate change and human activities. Hydrogeol. J. 2018, 26, 1429–1441. [Google Scholar] [CrossRef]
- Garamhegyi, T.; Kovács, J.; Pongrácz, R.; Tanos, P.; Hatvani, I.G. Investigation of the climate-driven periodicity of shallow groundwater level fluctuations in a Central-Eastern European agricultural region. Hydrogeol. J. 2017, 26, 677–688. [Google Scholar] [CrossRef]
- Lee, D.R. A device for measuring seepage flux in lakes and estuaries1. Limnol. Oceanogr. 1977, 22, 140–147. [Google Scholar] [CrossRef]
- Lee, D.R.; Cherry, J.A. A Field Exercise on Groundwater Flow Using Seepage Meters and Mini-piezometers. J. Geol. Educ. 1979, 27, 6–10. [Google Scholar] [CrossRef]
- Woessner, W.W.; Sullivan, K.E. Results of Seepage Meter and Mini-Piezometer Study, Lake Mead, Nevada. Ground Water 1984, 22, 561–568. [Google Scholar] [CrossRef]
- Isiorho, S.A.; Meyer, J.H. The Effects of Bag Type and Meter Size on Seepage Meter Measurements. Ground Water 1999, 37, 411–413. [Google Scholar] [CrossRef]
- Chen, Z.; Chen, J.; Fei, Y.; Zhang, Z.; Zhang, C. Estimation of groundwater renewal rate by tritium in the piedmont plain of the Taihang Mountains. Nucl. Tech. 2006, 29, 426–431. [Google Scholar]
- Xu, W.; Xiaosi, S.; Dai, Z.; Yang, F.; Zhu, P.; Huang, Y. Multi-tracer investigation of river and groundwater interactions: A case study in Nalenggele River basin, northwest China. Hydrogeol. J. 2017, 25, 2015–2029. [Google Scholar] [CrossRef]
- Negrel, P.; Petelet-Giraud, E.; Barbier, J.; Gautier, E. Surface water–groundwater interactions in an alluvial plain: Chemical and isotopic systematics. J. Hydrol. 2003, 277, 248–267. [Google Scholar] [CrossRef]
- Hakam, O.K.; Choukri, A.; Moutia, Z.; Chouak, A.; Cherkaoui, R.; Reyss, J.-L.; Lferde, M. Uranium and radium in groundwater and surface water samples in Morocco. Radiat. Phys. Chem. 2001, 61, 653–654. [Google Scholar] [CrossRef]
- Cook, P.G.; Favreau, G.; Dighton, J.; Tickell, S. Determining natural groundwater influx to a tropical river using radon, chlorofluorocarbons and ionic environmental tracers. J. Hydrol. 2003, 277, 74–88. [Google Scholar] [CrossRef]
- Unland, N.P.; Cartwright, I.; Andersen, M.S.; Rau, G.C.; Reed, J.; Gilfedder, B.S.; Atkinson, A.P.; Hofmann, H. Investigating the spatio-temporal variability in groundwater and surface water interactions: A multi-technique approach. Hydrol. Earth Syst. Sci. 2013, 17, 3437–3453. [Google Scholar] [CrossRef]
- Oyarzún, R.; Barrera, F.; Salazar, P.; Maturana, H.; Oyarzún, J.; Aguirre, E.; Alvarez, P.; Jourde, H.; Kretschmer, N. Multi-method assessment of connectivity between surface water and shallow groundwater: The case of Limarí River basin, north-central Chile. Hydrogeol. J. 2014, 22, 1857–1873. [Google Scholar] [CrossRef]
- Wang, P.; Yu, J.; Zhang, Y.; Liu, C. Groundwater recharge and hydrogeochemical evolution in the Ejina Basin, northwest China. J. Hydrol. 2013, 476, 72–86. [Google Scholar] [CrossRef]
- Martinez, J.L.; Raiber, M.; Cox, M. Assessment of groundwater–surface water interaction using long-term hydrochemical data and isotope hydrology: Headwaters of the Condamine River, Southeast Queensland, Australia. Sci. Total Environ. 2015, 536, 499–516. [Google Scholar] [CrossRef]
- Boano, F.; Revelli, R.; Ridolfi, L. Effect of streamflow stochasticity on bedform-driven hyporheic exchange. Adv. Water Resour. 2010, 33, 1367–1374. [Google Scholar] [CrossRef]
- Frei, S.; Fleckenstein, J.H.; Kollet, S.; Maxwell, R. Patterns and dynamics of river–aquifer exchange with variably-saturated flow using a fully-coupled model. J. Hydrol. 2009, 375, 383–393. [Google Scholar] [CrossRef]
- Jin, G.; Tang, H.W.; Gibbes, B.; Li, L.; Barry, D.A. Transport of nonsorbing solutes in a streambed with periodic bedforms. Adv. Water Resour. 2010, 33, 1402–1416. [Google Scholar] [CrossRef]
- Guay, C.; Nastev, M.; Paniconi, C.; Sulis, M. Comparison of two modeling approaches for groundwater-surface water interactions. Hydrol. Process. 2012, 27, 2258–2270. [Google Scholar] [CrossRef]
- Jones, J.P.; Sudicky, E.A.; McLaren, R.G. Application of a fully-integrated surface-subsurface flow model at the watershed-scale: A case study. Water Resour. Res. 2008, 44, 893–897. [Google Scholar] [CrossRef]
- Sterte, E.J.; Johansson, E.; Sjöberg, Y.; Karlsen, R.H.; Laudon, H. Groundwater-surface water interactions across scales in a boreal landscape investigated using a numerical modelling approach. J. Hydrol. 2018, 560, 184–201. [Google Scholar] [CrossRef]
- Ala-Aho, P.; Rossi, P.M.; Isokangas, E.; Kløve, B. Fully integrated surface–subsurface flow modelling of groundwater–lake interaction in an esker aquifer: Model verification with stable isotopes and airborne thermal imaging. J. Hydrol. 2015, 522, 391–406. [Google Scholar] [CrossRef]
- Menció, A.; Galán, M.; Boix, D.; Mas-Pla, J. Analysis of stream–aquifer relationships: A comparison between mass balance and Darcy’s law approaches. J. Hydrol. 2014, 517, 157–172. [Google Scholar] [CrossRef]
- Li, P.; Qian, H.; Wu, J. Conjunctive use of groundwater and surface water to reduce soil salinization in the Yinchuan Plain, North-West China. Int. J. Water Resour. Dev. 2018, 34, 337–353. [Google Scholar] [CrossRef]
- Qian, H.; Li, P.; Wu, J.; Zhou, Y. Isotopic characteristics of precipitation, surface and ground waters in the Yinchuan plain, Northwest China. Environ. Earth Sci. 2012, 70, 57–70. [Google Scholar] [CrossRef]
- Jing, X.-Y.; Yang, H.; Cao, Y.; Wang, W. Identification of indicators of groundwater quality formation process using a zoning model. J. Hydrol. 2014, 514, 30–40. [Google Scholar] [CrossRef]
- Geological Survey Institute of Ningxia Hui Autonomous Region. The Report on the Hydrogeological Environmental Geological Survey of the Yellow River Economic Zone in Ningxia; Technical Report 1212011220973; Geological Survey Institute of Ningxia Hui Autonomous Region: Yinchuan, China, 2016. [Google Scholar]
- Qian, H.; Li, P.Y. Hydrochemical characteristics of groundwater in Yinchuan plain and their control factors. Asian J. Chem. 2011, 23, 2927. [Google Scholar]
- Qian, H.; Wu, J.; Zhou, Y.; Li, P. Stable oxygen and hydrogen isotopes as indicators of lake water recharge and evaporation in the lakes of the Yinchuan Plain. Hydrol. Process. 2013, 28, 3554–3562. [Google Scholar] [CrossRef]
- Li, Z.; Yang, Q.; Yang, Y.; Ma, H.; Wang, H.; Luo, J.; Bian, J.; Martin, J.D.; Li, S. Isotopic and geochemical interpretation of groundwater under the influences of anthropogenic activities. J. Hydrol. 2019, 576, 685–697. [Google Scholar] [CrossRef]
- Guo, Q.; Yang, Y.; Han, Y.; Li, J.; Wang, X. Assessment of surface–groundwater interactions using hydrochemical and isotopic techniques in a coalmine watershed, NW China. Environ. Earth Sci. 2019, 78, 91. [Google Scholar] [CrossRef]
- Fan, C.-C.; Chen, Y.-W. The effect of root architecture on the shearing resistance of root-permeated soils. Ecol. Eng. 2010, 36, 813–826. [Google Scholar] [CrossRef]
- Fan, H.X. Open a new era of groundwater monitoring-focus on the construction of national groundwater monitoring project. Hydrogeol. Eng. Geol. 2015, 2, 161–162. (In Chinese) [Google Scholar]
- Cheng, Z.S.; Li, Y.; Chen, Z.Y.; Cui, W.X.; Xue, Z.Q. Distribution characteristics and age of Tritium in phreatic aquifers in Yinchuan plain. Environ. Earth Sci. 2019, 33, 141–147. (In Chinese) [Google Scholar]
- Chen, Z.; Wei, W.; Liu, J.; Wang, Y.; Chen, J. Identifying the recharge sources and age of groundwater in the Songnen Plain (Northeast China) using environmental isotopes. Hydrogeol. J. 2010, 19, 163–176. [Google Scholar] [CrossRef]
- Härdle, W.K.; Simar, L. Applied Multivariate Statistical Analysis; Springer Science and Business Media LLC: Berlin, Germany; Louvainla Neuve, Belgium, 2012. [Google Scholar]
- Doney, S.C.; Glover, D.M.; Jenkins, W.J. A model function of the global bomb tritium distribution in precipitation, 1960–1986. J. Geophys. Res. Oceans 1992, 97, 5481–5492. [Google Scholar] [CrossRef]
- Ba, Q.; Xu, Y. Input function and simulated distributions of tritium in the North Pacific. Sci. China Earth Sci. 2010, 53, 441–453. [Google Scholar] [CrossRef]
- Liu, J.; Chen, Z.; Wei, W.; Zhang, Y.; Li, Z.; Liu, F.; Guo, H. Using chlorofluorocarbons (CFCs) and tritium (3H) to estimate groundwater age and flow velocity in Hohhot Basin, China. Hydrol. Process. 2013, 28, 1372–1382. [Google Scholar] [CrossRef]
- Maloszewski, P.; Zuber, A. Lumped Parameter Models for the Interpretation of Environmental Tracer Data, Manual on Mathematical Models in Isotope Hydrogeology, TECDOC-910; International Atomic Energy Agency: Vienna, Austria, 1996; pp. 9–58. Available online: https://www.mendeley.com/catalogue/61bdaeb9-4614-34f2-a359-570efc442d39/ (accessed on 21 September 2020).
- Salle, C.L.G.L.; Marlin, C.; LeDuc, C.; Taupin, J.; Massault, M.; Favreau, G. Renewal rate estimation of groundwater based on radioactive tracers (3H, 14C) in an unconfined aquifer in a semi-arid area, Iullemeden Basin, Niger. J. Hydrol. 2001, 254, 145–156. [Google Scholar] [CrossRef]
- Chen, Z.; Nie, Z.; Zhang, G.; Wan, L.; Shen, J. Environmental isotopic study on the recharge and residence time of groundwater in the Heihe River Basin, northwestern China. Hydrogeol. J. 2006, 14, 1635–1651. [Google Scholar] [CrossRef]
- Yang, Z.; Li, H.X.; Wu, X.H.; Liu, H.M. Estimating of the update speed of groundwater in YinChuan plain by using the radioactive element 3H. Ningxia Eng. Technol. 2007, 6, 84–87. (In Chinese) [Google Scholar]
- Wang, F. Study on Dynamic Characteristics of Groundwater and Age Distribution of Groundwater in Yinchuan Plain. Master’s Thesis, China University of Geosciences (Beijing), Beijing, China, 2017. (In Chinese). [Google Scholar]
- Islam, B.; Firoz, A.B.M.; Foglia, L.; Marandi, A.; Khan, A.R.; Schüth, C.; Ribbe, L. A regional groundwater-flow model for sustainable groundwater-resource management in the south Asian megacity of Dhaka, Bangladesh. Hydrogeol. J. 2017, 25, 617–637. [Google Scholar] [CrossRef]
- Gu, X.; Shao, J.; Cui, Y.; Hao, Q. Calibration of Two-Dimensional Variably Saturated Numerical Model for Groundwater Flow in Arid Inland Basin, China. Curr. Sci. 2017, 113, 403–412. [Google Scholar] [CrossRef]
- Wu, X.H.; Qian, H.; Yu, D.M. Investigation and Assessment of Rational Allocation of Groundwater Resources in the Yinchuan Plain; Geology Publishing House: Beijing, China, 2008. [Google Scholar]
- Xiao, Y.; Shao, J.; Frape, S.K.; Cui, Y.; Dang, X.; Wang, S.; Ji, Y. Groundwater origin, flow regime and geochemical evolution in arid endorheic watersheds: A case study from the Qaidam Basin, northwestern China. Hydrol. Earth Syst. Sci. 2018, 22, 4381–4400. [Google Scholar] [CrossRef]
- Yao, Y.; Zheng, C.; Tian, Y.; Liu, J.; Zheng, Y. Numerical modeling of regional groundwater flow in the Heihe River Basin, China: Advances and new insights. Sci. China Earth Sci. 2014, 58, 3–15. [Google Scholar] [CrossRef]
- Wang, Y. Geochemistry Evolution and Water Cycle Patterns of Groundwater in Golmud River Basin. Maste’s Thesis, Chang’an University, Xi’an, China, 2014. (In Chinese). [Google Scholar]
- Tóth, J. A theoretical analysis of groundwater flow in small drainage basins. J. Geophys. Res. 1963, 68, 4795–4812. [Google Scholar] [CrossRef]
- Liang, X.; Quan, D.; Jin, M.; Liu, Y.; Zhang, R. Numerical simulation of groundwater flow patterns using flux as upper boundary. Hydrol. Process. 2012, 27, 3475–3483. [Google Scholar] [CrossRef]
- Jiang, X.-W.; Wan, L.; Wang, X.-S.; Ge, S.; Liu, J. Effect of exponential decay in hydraulic conductivity with depth on regional groundwater flow. Geophys. Res. Lett. 2009, 36. [Google Scholar] [CrossRef]
- Jin, X.M.; Hu, G.C.; Shi, X.J. Relationship between soil salinization and the vegetation growing, groundwater depth in the Yinchuan. Geoscience 2009, 1, 25–29. (In Chinese) [Google Scholar]
- Richter, B.; Baumgartner, J.; Wigington, R.; Braun, D. How much water does a river need? Freshw. Boil. 1997, 37, 231–249. [Google Scholar] [CrossRef]
- Yang, T.; Zhang, Q.; Chen, Y.D.; Tao, X.; Xu, C.-Y.; Chen, X. A spatial assessment of hydrologic alteration caused by dam construction in the middle and lower Yellow River, China. Hydrol. Process. 2008, 22, 3829–3843. [Google Scholar] [CrossRef]
- Sun, Z.Y.; Wang, Y.J.; Zheng, Y.S.; Liu, Y.H. Influence of desilting of Qingtongxia Reservoir to the channel Scour and fill of the lower reaches. Yellow River 2014, 36, 9–11. (In Chinese) [Google Scholar]
- Zhang, Q.; Zhang, L. Main Water Environmental Problem and Its Countermeasures in Yinchuan Plain. J. Earth Sci. Environ. 2010, 4, 66–71. (In Chinese) [Google Scholar]
- Wang, Y.M. The historical changes and future utilization of lakes in Yinchuan plain. Arid Area Res. Environ. 1992, 6, 47–57. (In Chinese) [Google Scholar]
- Hussein, M.; Schwartz, F.W. Modeling of flow and contaminant transport in coupled stream–aquifer systems. J. Contam. Hydrol. 2003, 65, 41–64. [Google Scholar] [CrossRef]
- Fleckenstein, J.H.; Anderson, M.; Fogg, G.; Mount, J. Managing Surface Water-Groundwater to Restore Fall Flows in the Cosumnes River. J. Water Resour. Plan. Manag. 2004, 130, 301–310. [Google Scholar] [CrossRef]
- Yang, Z.; Zhou, Y.; Wenninger, J.; Uhlenbrook, S.; Wang, X.; Wan, L. Groundwater and surface-water interactions and impacts of human activities in the Hailiutu catchment, northwest China. Hydrogeol. J. 2017, 25, 1341–1355. [Google Scholar] [CrossRef]
- Webb, R.H.; Leake, S.A. Ground-water surface-water interactions and long-term change in riverine riparian vegetation in the southwestern United States. J. Hydrol. 2006, 320, 302–323. [Google Scholar] [CrossRef]


| Lithology | Horizontal Hydraulic Conductivity Kh (m·d−1) | Anisotropy Ratio Kh/Kv | Porosity |
|---|---|---|---|
| Gravel | 35 | 10 | 0.35 |
| Medium sand | 6.8 | 10 | 0.40 |
| Fine sand | 2.5 | 10 | 0.42 |
| Sandy loam | 0.07 | 5 | 0.45 |
| loam | 0.05 | 5 | 0.48 |
| clay | 0.002 | 5 | 0.55 |
© 2020 by the authors. Licensee MDPI, Basel, Switzerland. This article is an open access article distributed under the terms and conditions of the Creative Commons Attribution (CC BY) license (http://creativecommons.org/licenses/by/4.0/).
Share and Cite
Cai, Z.; Wang, W.; Zhao, M.; Ma, Z.; Lu, C.; Li, Y. Interaction between Surface Water and Groundwater in Yinchuan Plain. Water 2020, 12, 2635. https://doi.org/10.3390/w12092635
Cai Z, Wang W, Zhao M, Ma Z, Lu C, Li Y. Interaction between Surface Water and Groundwater in Yinchuan Plain. Water. 2020; 12(9):2635. https://doi.org/10.3390/w12092635
Chicago/Turabian StyleCai, Zizhao, Wenke Wang, Ming Zhao, Zhitong Ma, Chuan Lu, and Ying Li. 2020. "Interaction between Surface Water and Groundwater in Yinchuan Plain" Water 12, no. 9: 2635. https://doi.org/10.3390/w12092635
APA StyleCai, Z., Wang, W., Zhao, M., Ma, Z., Lu, C., & Li, Y. (2020). Interaction between Surface Water and Groundwater in Yinchuan Plain. Water, 12(9), 2635. https://doi.org/10.3390/w12092635