Article

Relationship Between Aquifer Pumping Response and Quality of Water Extracted from Wells in an Active Hydrothermal System: The Case of the Island of Ischia (Southern Italy)

1
Dipartimento di Scienze Ecologiche e Biologiche, Università degli Studi della Tuscia, 01100 Viterbo, Italy
2
Acque Terme Ambiente, 80133 Napoli, Italy
3
Kataclima srl, 01019 Vetralla, Italy
4
Dipartimento di Scienze Chimiche, Università degli Studi di Napoli Federico II, 80126 Napoli, Italy
*
Author to whom correspondence should be addressed.
Water 2020, 12(9), 2576; https://doi.org/10.3390/w12092576
Submission received: 7 July 2020 / Revised: 1 September 2020 / Accepted: 9 September 2020 / Published: 15 September 2020
(This article belongs to the Section Hydrology)

Abstract

:
The thermal waters of the Island of Ischia, an active volcano located in Southern Italy, are widely used for supplying numerous spas. Groundwater withdrawals occur mainly through wells in the coastal strip. This study explores the impact of withdrawals on the quality of the waters used in thermal facilities, which is required to be constant in terms of composition and temperature by law. For this purpose, specific investigations were conducted including 155 pumping tests, 124 water temperature measurements during pumping tests, 31 temperature and electrical conductivity logs and periodic chemical analysis of the waters of 21 selected wells. By comparing the response to pumping of the aquifer and the quality of the water extracted from the wells, it turned out that the quality of groundwater supplying spas depends not only on natural phenomena (meteoric recharge, seawater intrusion, and rising of deep hydrothermal fluids) but also relies on the island sector where groundwater is pumped and on the pumping method. The distance of the wells from the coast, the type of aquifer formation intersected by the wells, and the field of groundwater temperature of the hydrothermal system strongly affect the aquifer pumping response, determining the quality of water extracted from wells and its variation over time. In Ischia, techniques and regimes of groundwater withdrawals should adapt to the local aquifer pumping response, more than in another hydrogeological context. The concomitant analysis of drawdown, water temperature, and salinity during pumping turned out to be a valuable tool to define the sustainable yield of the single well.

1. Introduction

The Island of Ischia, an active volcano located in the Gulf of Naples (southern Italy, Figure 1), has a long tradition in the use of its groundwaters as a resource for health, wellness, and recreational tourism. The thermal waters of the island have been known since the Romans and in the 16th century, the doctor and philosopher Giulio Iasolino highlighted their therapeutic properties in his essay (i.e., De rimedi naturali che sono nell’isola di Pithecusa). Currently, the island is the destination of a significant tourist flow related to thermal waters having about 290 hotels, most of which have health and wellness centers, available on a surface area of 46 km2. Such activities sustain directly or indirectly the economy of the island [1].
The remarkable spread of health and wellness centers on the island is linked to the presence of a wide variety of chemical groundwater composition (from calcium-bicarbonate to alkali-chloride waters), temperature (from 13 to 90 °C), and salinity (from 1 to 42 g/L). The groundwater withdrawals for the supply of the thermal and recreational centers are mainly distributed in the coastal strip of the island (Figure S1) and occur through 244 wells and from 20 springs [2].
Many studies are available in the literature on the chemistry of the island’s groundwaters, e.g., [3,4,5,6], but few studies have highlighted the possible impact of withdrawals on the quantity and quality of the groundwater resources [2]. This last point has economic relevance, given that both the European and Italian legislations establish that the composition and temperature of mineral and thermal waters must remain constant over time (Italian Legislative Decree 176/2011 implementing UE Directive 2009/54/CE). A change in the chemistry of the waters used for spa treatments, for example, requires a new assessment about the therapeutic properties of waters by the Ministry of Health, a procedure that lasts at least one year, with an obvious impact on the activity of the spa.
This study explores the impact of groundwater withdrawals on the quality of the waters used in the thermal centers. For this purpose, the aquifer response to the pumping has been related to the main chemical characteristics of the water extracted, two features that so far were examined separately. This analysis can help to identify the criteria for sustainable management of groundwater resources in the specific case and hydrothermal areas in general.

2. Previous Hydrogeochemical and Hydrogeological Knowledge

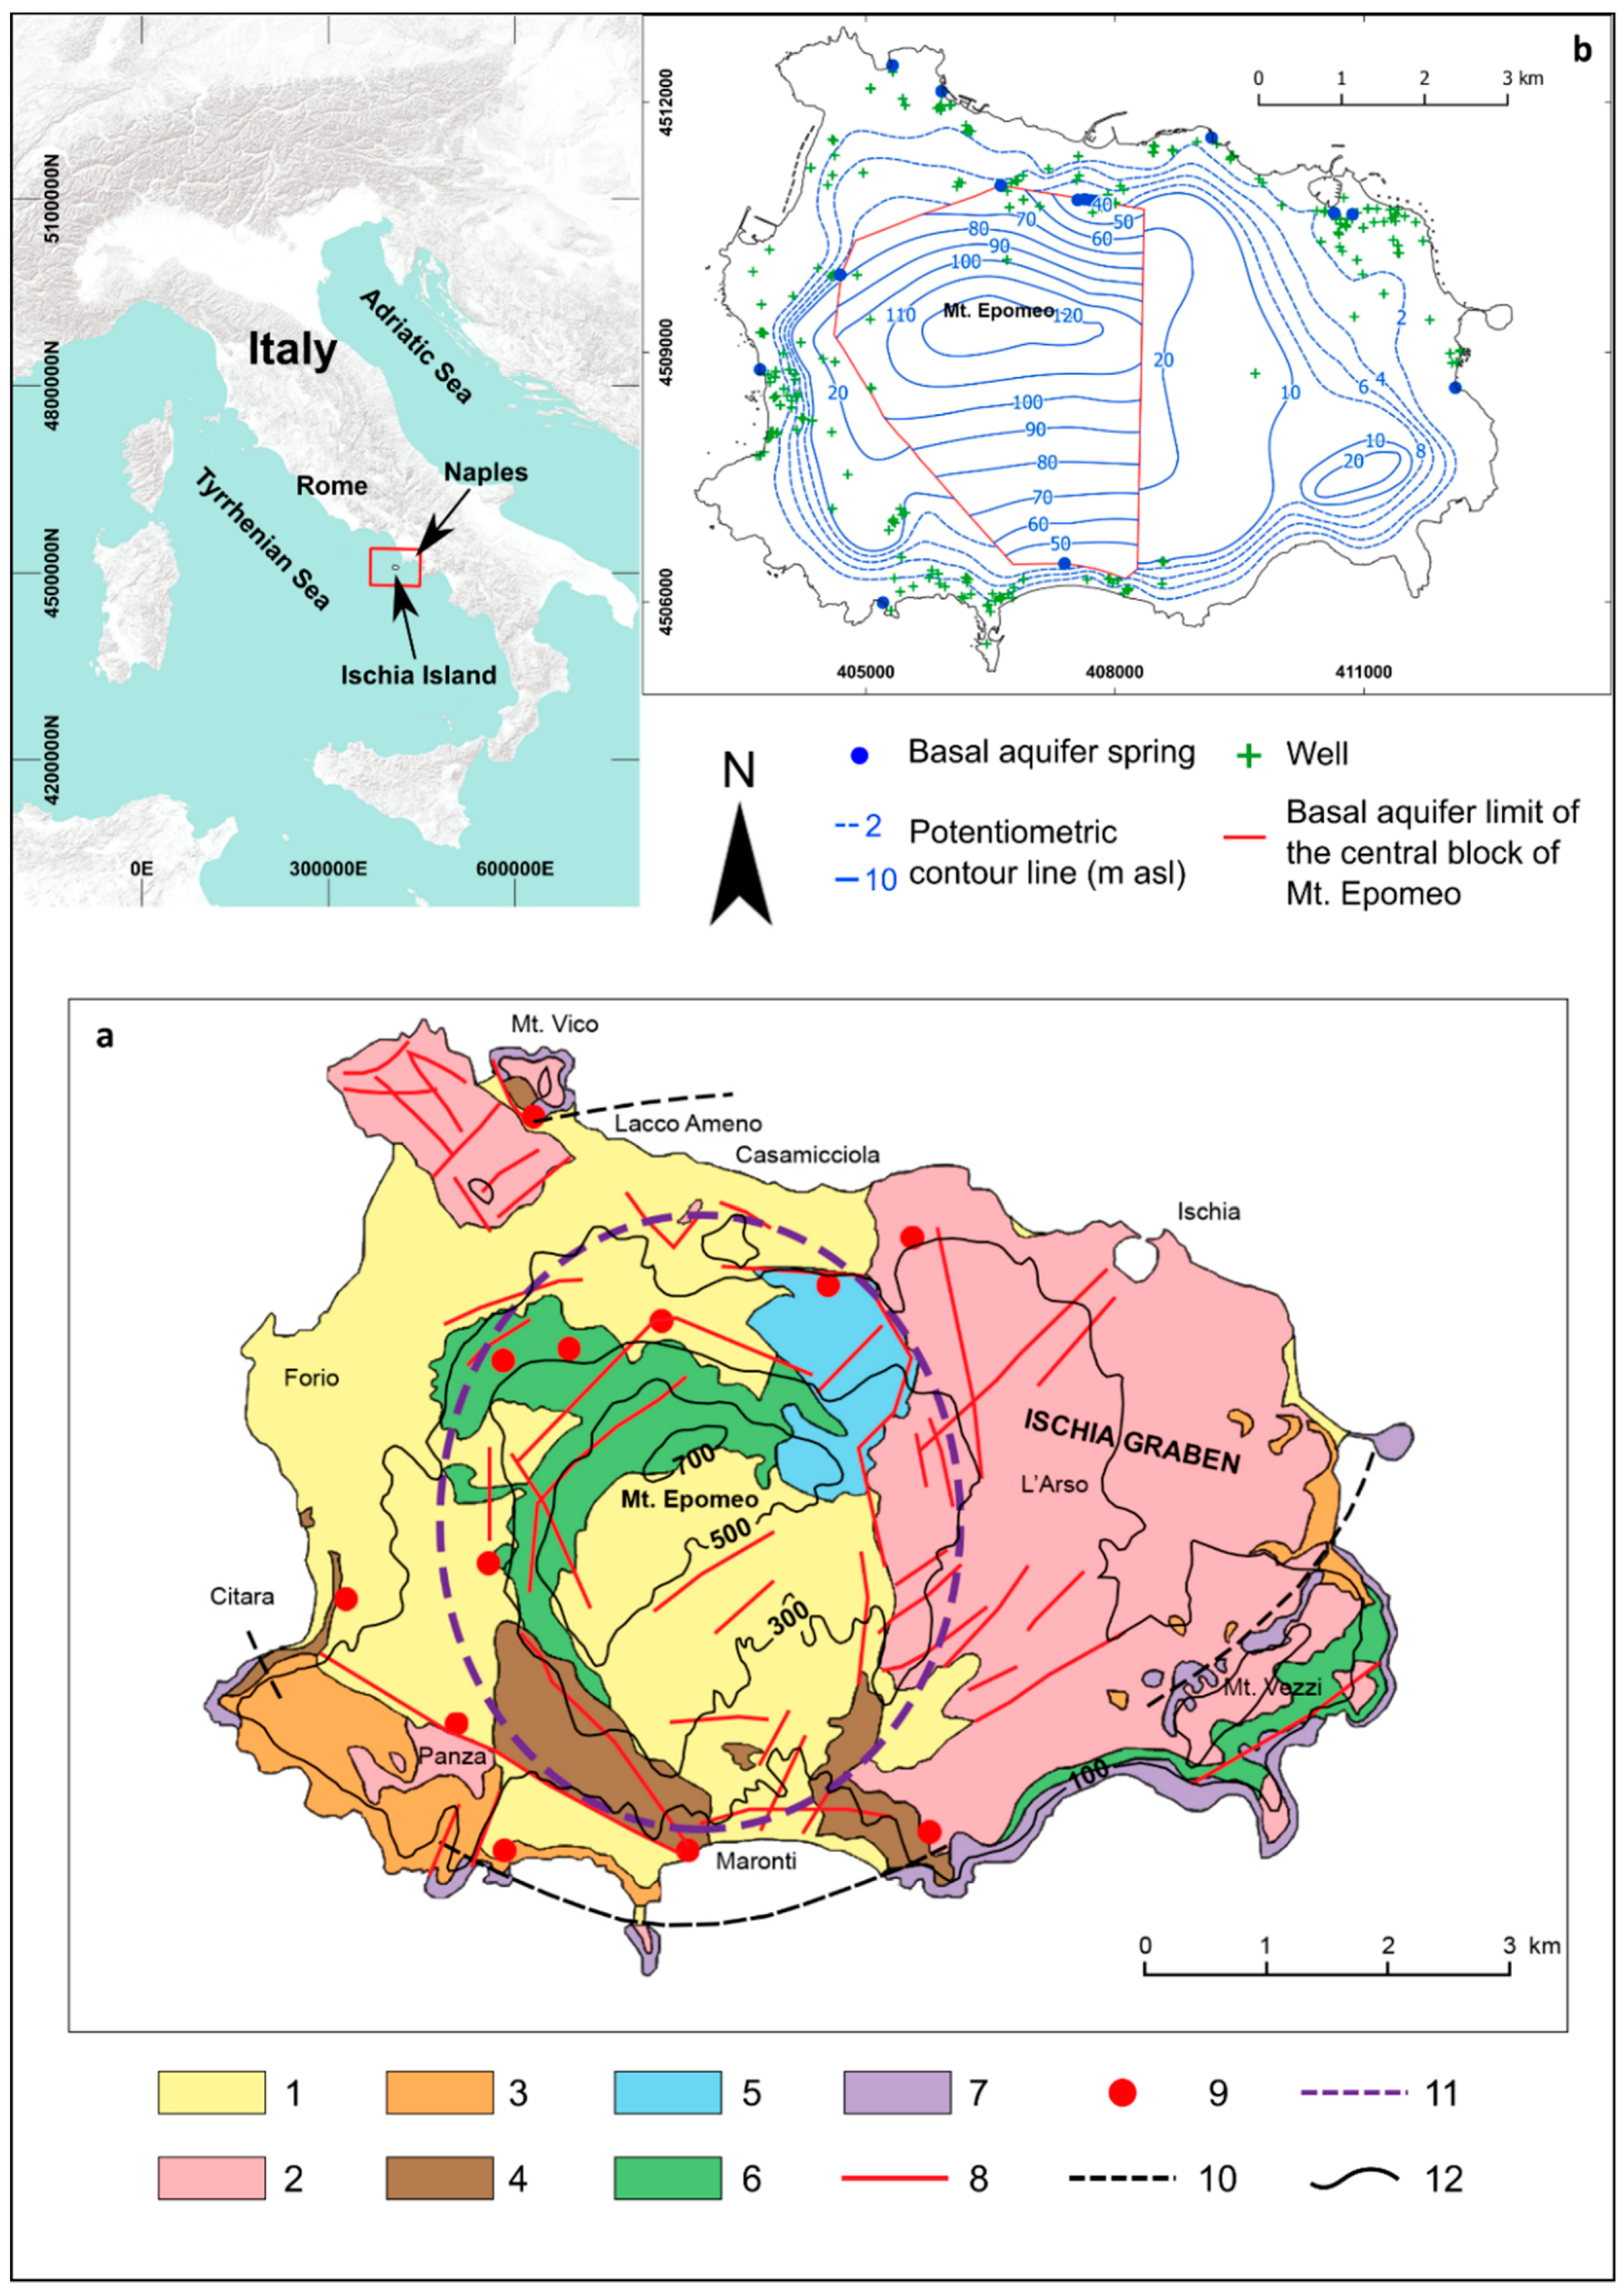
The Island of Ischia belongs to the Neapolitan volcanic area (Figure 1) characterized by a crustal thinning and intense heat flow (up to 500 mW/m
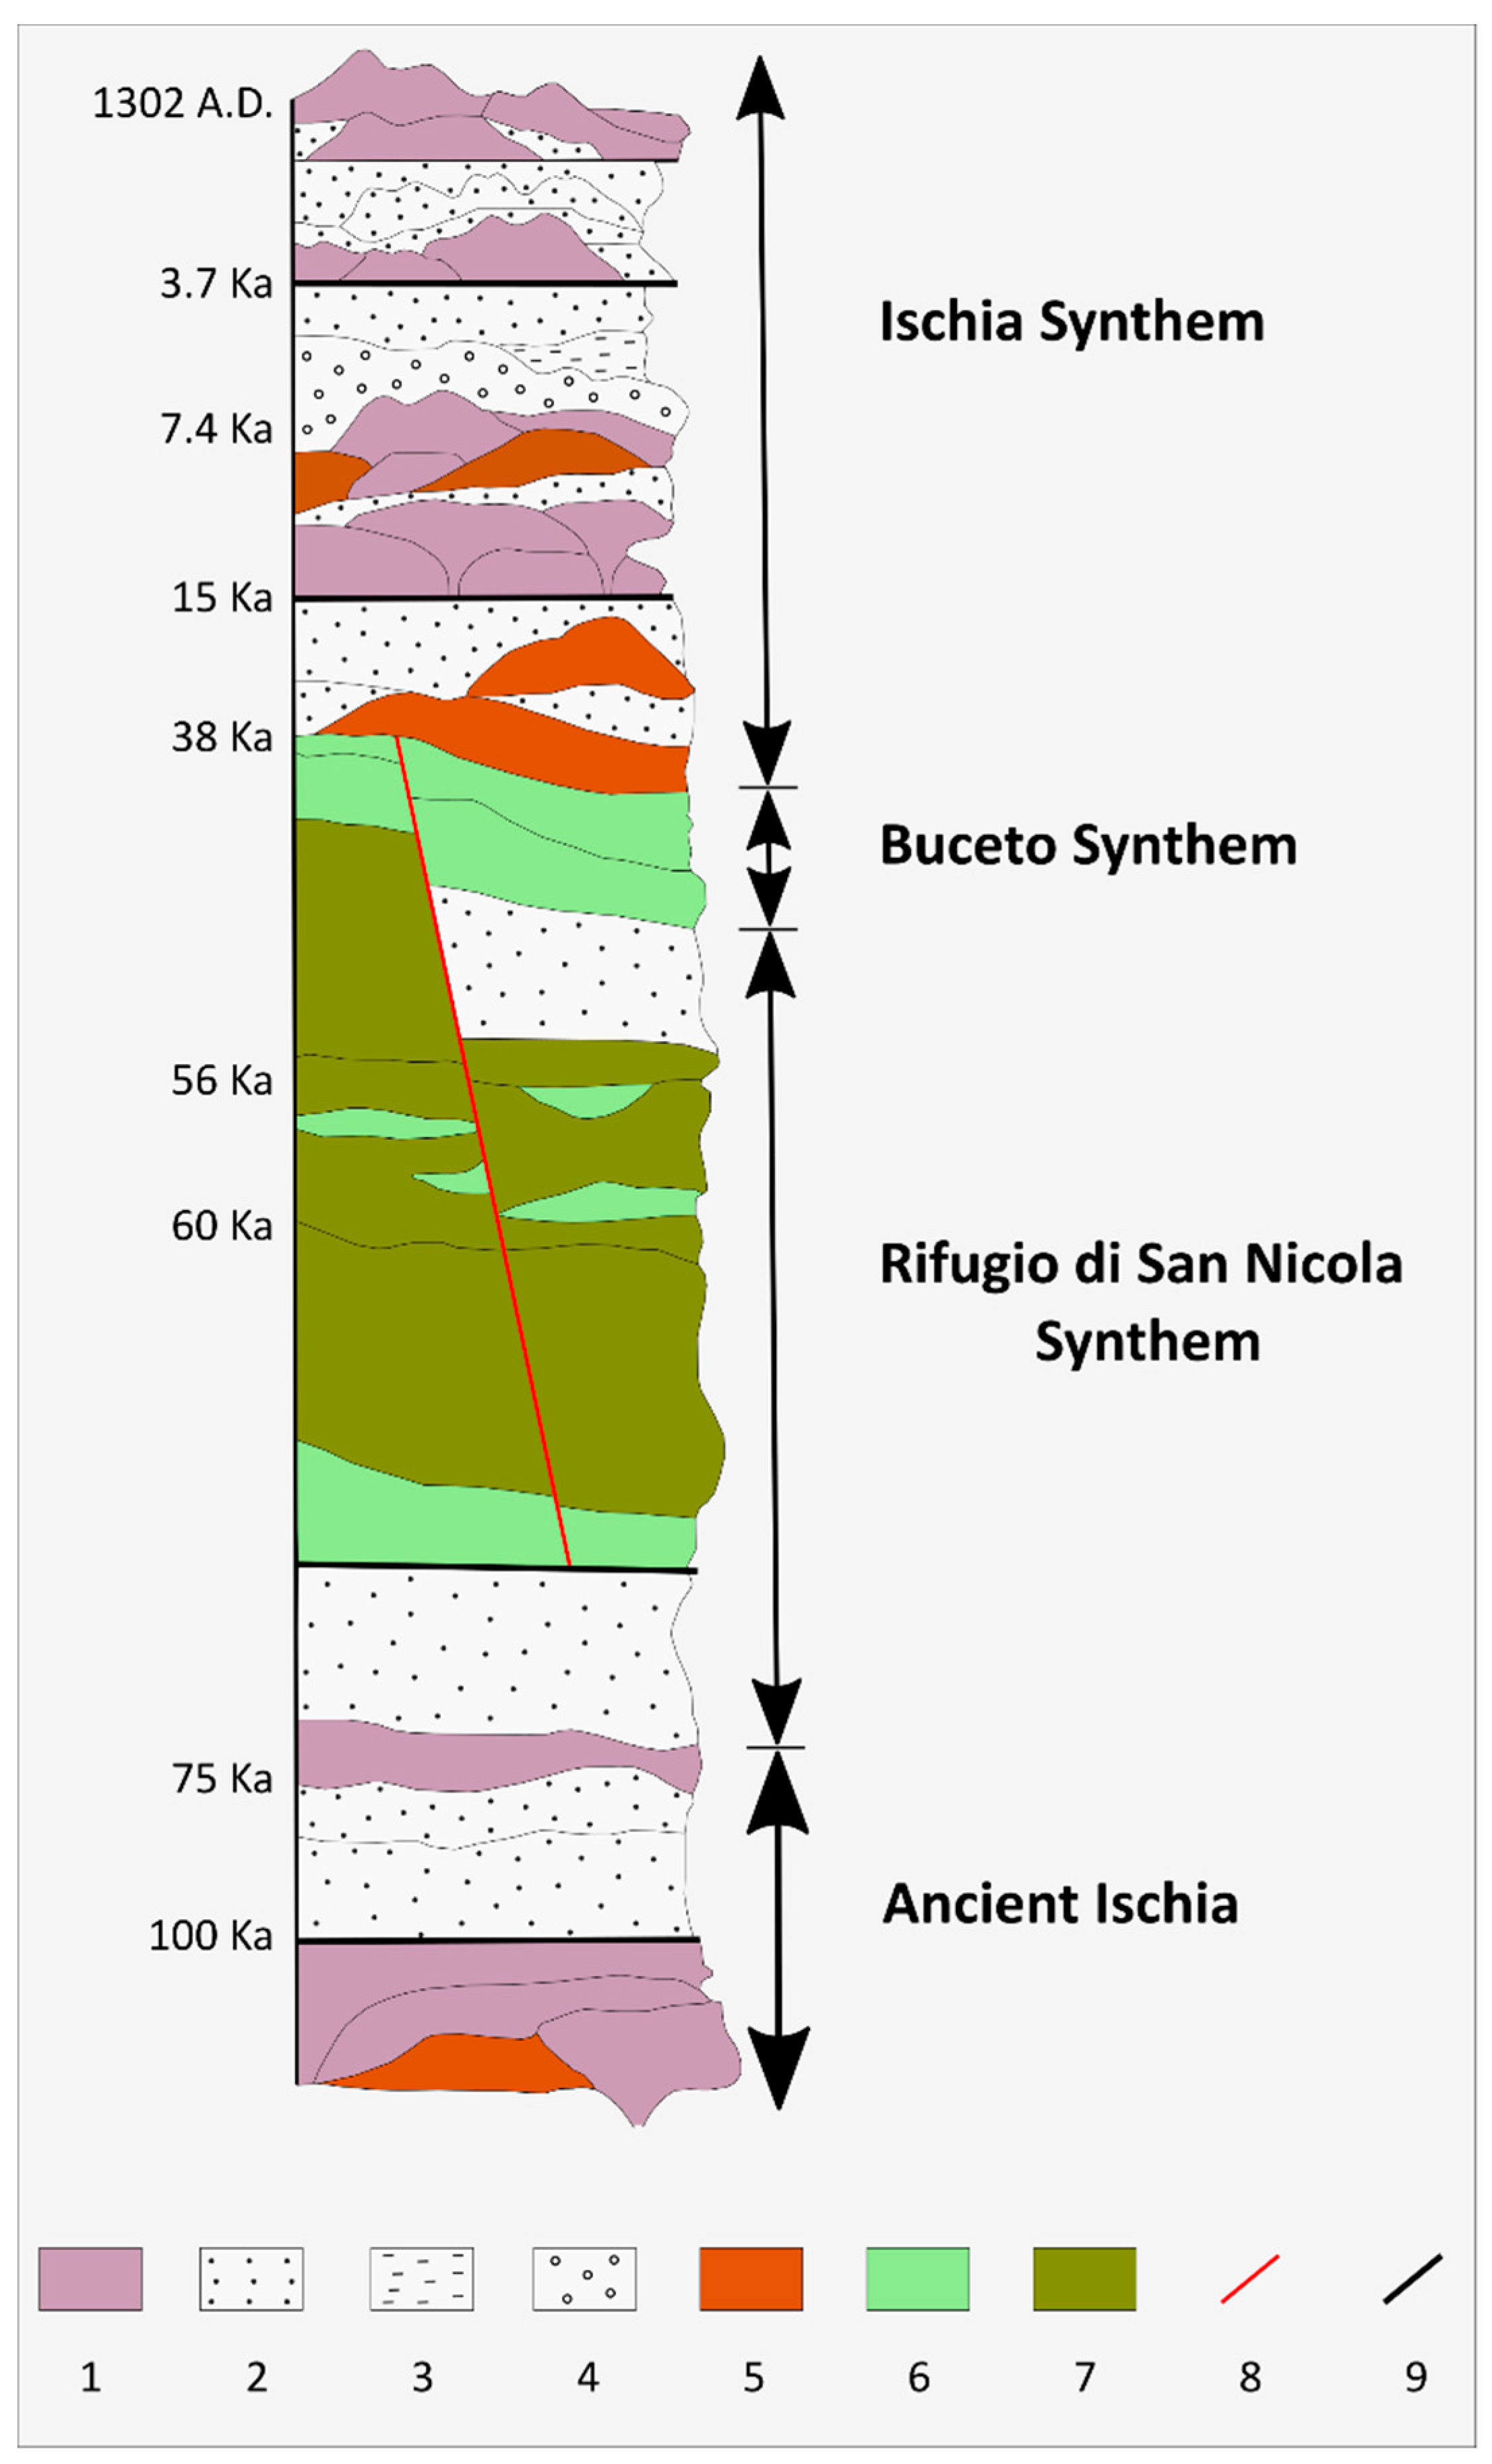
2). Volcanism of Ischia was active from 150 ka to AD 1302 (Figure 2), giving rise to lava flows, lava domes, and pyroclastic deposits, ranging in composition mainly from trachyte to phonolite, epiclastic deposits, marine sediments, and landslide deposits [7,8,9,10,11,12]. The most remarkable eruption was the Mt. Epomeo Green Tuff eruption (55 ka) accompanied by the caldera collapse, followed by a resurgence phenomenon producing over time an uplift of the Mt. Epomeo block of about 900 m [13] (Figure 1). The most complete studies on geology and volcanology of Ischia distinguish from 88 [7] to 130 stratigraphic units [11]. The structural setting of the island is related to interactions between the resurgence of the Mt. Epomeo block and regional tectonics (Figure 1). ENE–WSW to E–W and NNW –SSE to N–S striking systems surround the Mt. Epomeo resurgent block. NE–SW and NW–SE striking systems control the eastern, northwestern, and southwestern structures of the island [13,14,15].
The volcanic area is characterized by an active geothermal system linked to the presence of a shallow magmatic body located at a depth of about 2 km [7,13,16,17,18,19]. Surface manifestations of the geothermal system are hot waters, fumaroles, and steaming grounds. Geochemical studies conducted on the waters and fumaroles of the island have highlighted the presence of a complex hydrothermal system due to overlapping and interconnected reservoirs fed by meteoric waters, seawater, and magma-derived or mixed magmatic-crustal gases [3,4,5,20,21,22,23,24]. As to groundwater tapped by wells and emerging from springs, more recent and complete geochemical investigations confirm a wide range of water chemistry, having detected temperatures between 13 and 90 °C, salinities between 0.76 and 42 g/L, composition varying from calcium bicarbonate to alkali-chloride, and concentrations of the dissolved CO2 between 1 and 448 cm3/L [6]. The same authors explain this variability in the physicochemical parameters as the result of complex mixing phenomena among meteoric water, seawater, and three thermal end-members due to hydrothermal deep reservoirs with estimated equilibrium temperature from 150 to 270 °C. The ascending of deep geothermal fluids and mixing with meteoric and seawater determine groundwater quality that supplies the spas of the island.
The most comprehensive studies on the island’s hydrogeology have been conducted by Celico et al. [25] and Piscopo et al. [2].
Celico et al. [25] distinguish two hydrogeological sectors, coinciding with the main volcano-tectonic structures of the island: “Ischia graben”, in the north-eastern sector, characterized by a single aquifer recharged by both rainfall and seawater intrusion, and “Mt. Epomeo horst” and its margins, where a less transmissive and more heterogeneous aquifer has been found. In this last sector, the aquifer is recharged by rainfall, seawater intrusion, and rising geothermal fluids.
Piscopo et al. [2] recognize an independent and uplifted basal groundwater circulation in the resurgent block of Mt. Epomeo (Figure 1), where its marginal faults constitute partial barriers to the basal groundwater flow and preferential ways of ascending deep fluids. Groundwater flow in the peripheral area of Mt. Epomeo is mainly influenced by the nature of the aquifer formations. In the northern, western, and southern areas, a continuous basal aquifer and local discontinuous perched aquifers can be distinguished according to the succession of tuffs, ignimbrites, and epiclastic deposits. In the north-eastern area, characterized by the most recent volcanic deposits of the island, a single and continuous basal aquifer with the highest permeability on the island is found (Figure 1).
In natural conditions, the hydrogeological system is recharged by rainfall (250–290 L/s) and by deep fluids (at least 90 L/s); the discharge is towards the sea and the springs (a total of about 20 L/s). In the peripheral areas of Mt. Epomeo, where there are numerous groundwater withdrawal centers for supplying tourist facilities (Figure S1), during the peak season, a significant additional recharge of the aquifers derives from seawater and upwelling increase of deep fluids. It was estimated that a total flow between 540 and 620 L/s is simultaneously pumped during the period of operation of the spa facilities (about 180 days per year). This flow is significantly higher than the estimated average meteoric recharge value (250–290 L/s). Specifically, the wells along the coast are also recharged from seawater and the innermost wells are also recharged from deep fluids. Although this does not compromise the availability of groundwater in quantitative terms, the pumping can affect the quality of the water captured by the wells [2].

3. Materials and Methods

To examine the impact of withdrawals on the quality of water, different investigations were conducted on the wells of the thermal facilities. Investigations included: pumping tests, water temperature measurements during pumping tests, temperature and/or electrical conductivity logs in static conditions, chemical analysis of the water in some wells.

3.1. Pumping Tests

The pumping tests were aimed at examining the aquifer response to groundwater withdrawals in the peak period of the tourist season.
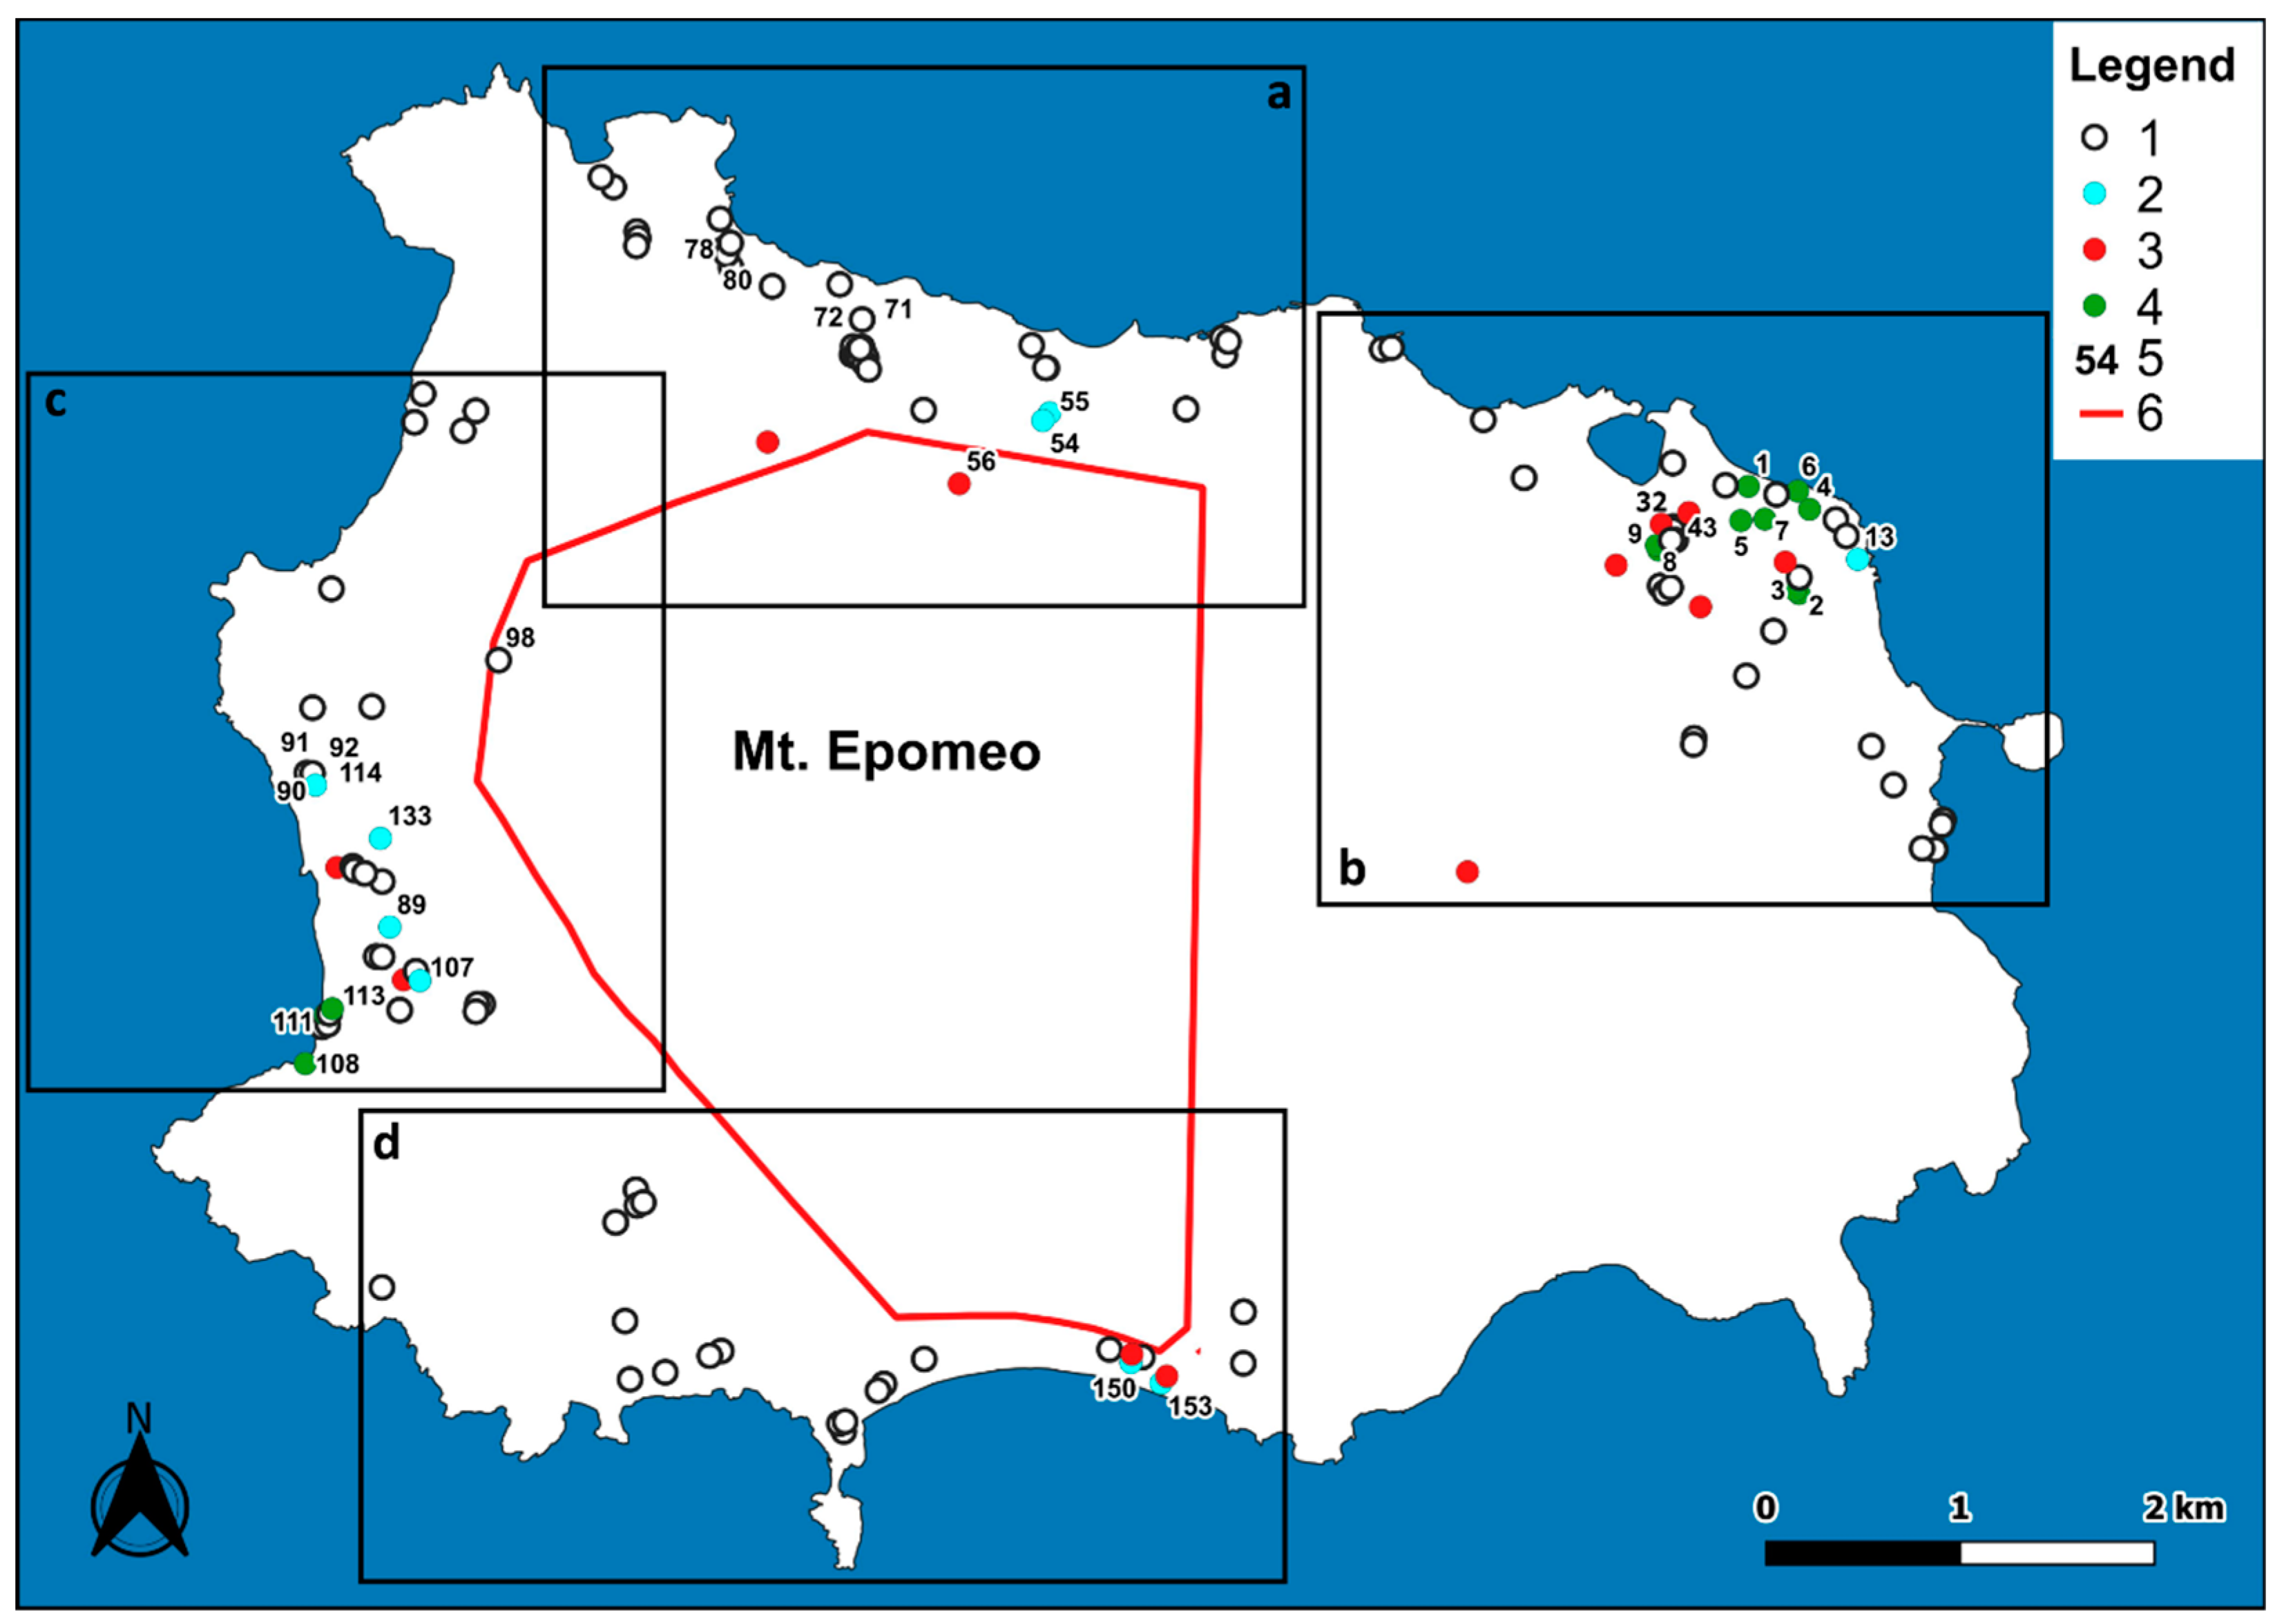
From 1997 to 2018, 155 tests were carried out on 144 wells used to supply the thermal facilities of the island (some wells were tested several times). The main characteristics of the wells are shown in Table 1. Only two wells (56 and 98) are located in the resurgent block of Mt. Epomeo (Figure 3). All the characteristics of the wells are not always known.
146 tests were carried out as single-well tests, in 9 tests also an observation well located next (<15 m) to the pumping well was included. 83 tests were carried out at a constant flow rate, 72 step-drawdown tests were carried out by increasing the flow rate in two or three steps, or by interrupting the pumping at each step and waiting for the water level recovery before increasing the pumping flow rate. For 140 tests, the residual drawdown during recovery was measured. The tests were carried out at flow rates between 0.2 and 7 L/s, the pumping duration was between 60 and 330 min for constant flow tests or each step of step-drawdown tests.
The interpretation of the tests was conducted with different approaches according to the different response of the aquifer to pumping.
When a condition of steady-state drawdown was achieved during the pumping time, the specific capacity (SC) was determined using the drawdown measured for the lowest flow rate step in the case of step-drawdown tests. Recovery data were analyzed by the Theis recovery method [26] and Cooper and Jacob straight-line fitting [27] to estimate transmissivity. For variable-discharge tests, the recovery phase was analyzed by the Birsoy–Summers recovery method [28]. In case of significant change in slope in the semilog-plot of recovery data, only the late-time residual drawdown was considered to eliminate well storage effects.
When a condition of unsteady-state flow resulted from the single-well tests, transmissivity values were estimated to apply the Cooper and Jacob straight-line method to drawdown and recovery data. In this case, the early-time section of drawdown in the semilog-plot was ignored. These tests were all conducted at a constant flow rate.
Of the nine tests carried out at a constant flow rate by measuring the drawdown also in an observation well, six showed an unsteady-state trend of drawdown and three a steady-state condition. For the first tests, the transmissivity values were determined by means of drawdown and recovery data measured in the pumping well and in the observation well by the Cooper and Jacob straight-line method. Storativity was also estimated through drawdown data measured in the observation well. For the three tests with a steady-state response, Thiem’s method [29] was applied to drawdown data, and Cooper and Jacob straight-line method to recovery data to estimate the transmissivity.
The characterization of intersected aquifer formation of the tested wells was obtained from the stratigraphy, saturated thickness, and screen depth of the wells, when available. When direct stratigraphic information of the wells was not available, stratigraphic correlations with the surface geology reported in the 1:10,000 scale geological map of Sbrana and Toccaceli [11] and with the stratigraphy of the nearest wells were considered.
Statistical analysis of the data examined: the relationships between specific capacity and transmissivity, the relationships between these parameters and the type of aquifer formation, the relationship between transmissivity and thickness of saturated aquifer intercepted by wells, and the spatial distribution of transmissivity. Different kriging models were also used.

3.2. Physicochemical Measurements of Well Water

During the pumping tests, temperature measurements of the water discharged from the production tubing of wells were performed. The measurements concerned 124 tests, determining the temperature (accuracy ± 0.5 °C) after the first 10–20 min of pumping and then once or more until the end of the test. These investigations were aimed at examining the contribution of seawater and the rising of the deep fluids recharging the wells during pumping.
31 temperature (accuracy ± 0.1 °C) and electrical conductivity (accuracy 5%) logs carried out on 24 of the wells tested (Figure 3) were considered. 19 logs were acquired from a previous study [2] and 12 logs were performed during this study, in some cases repeating the measurements on previously investigated wells. All measurements were carried out under undisturbed conditions (i.e., in periods without pumping) in accessible wells with known screen depths.
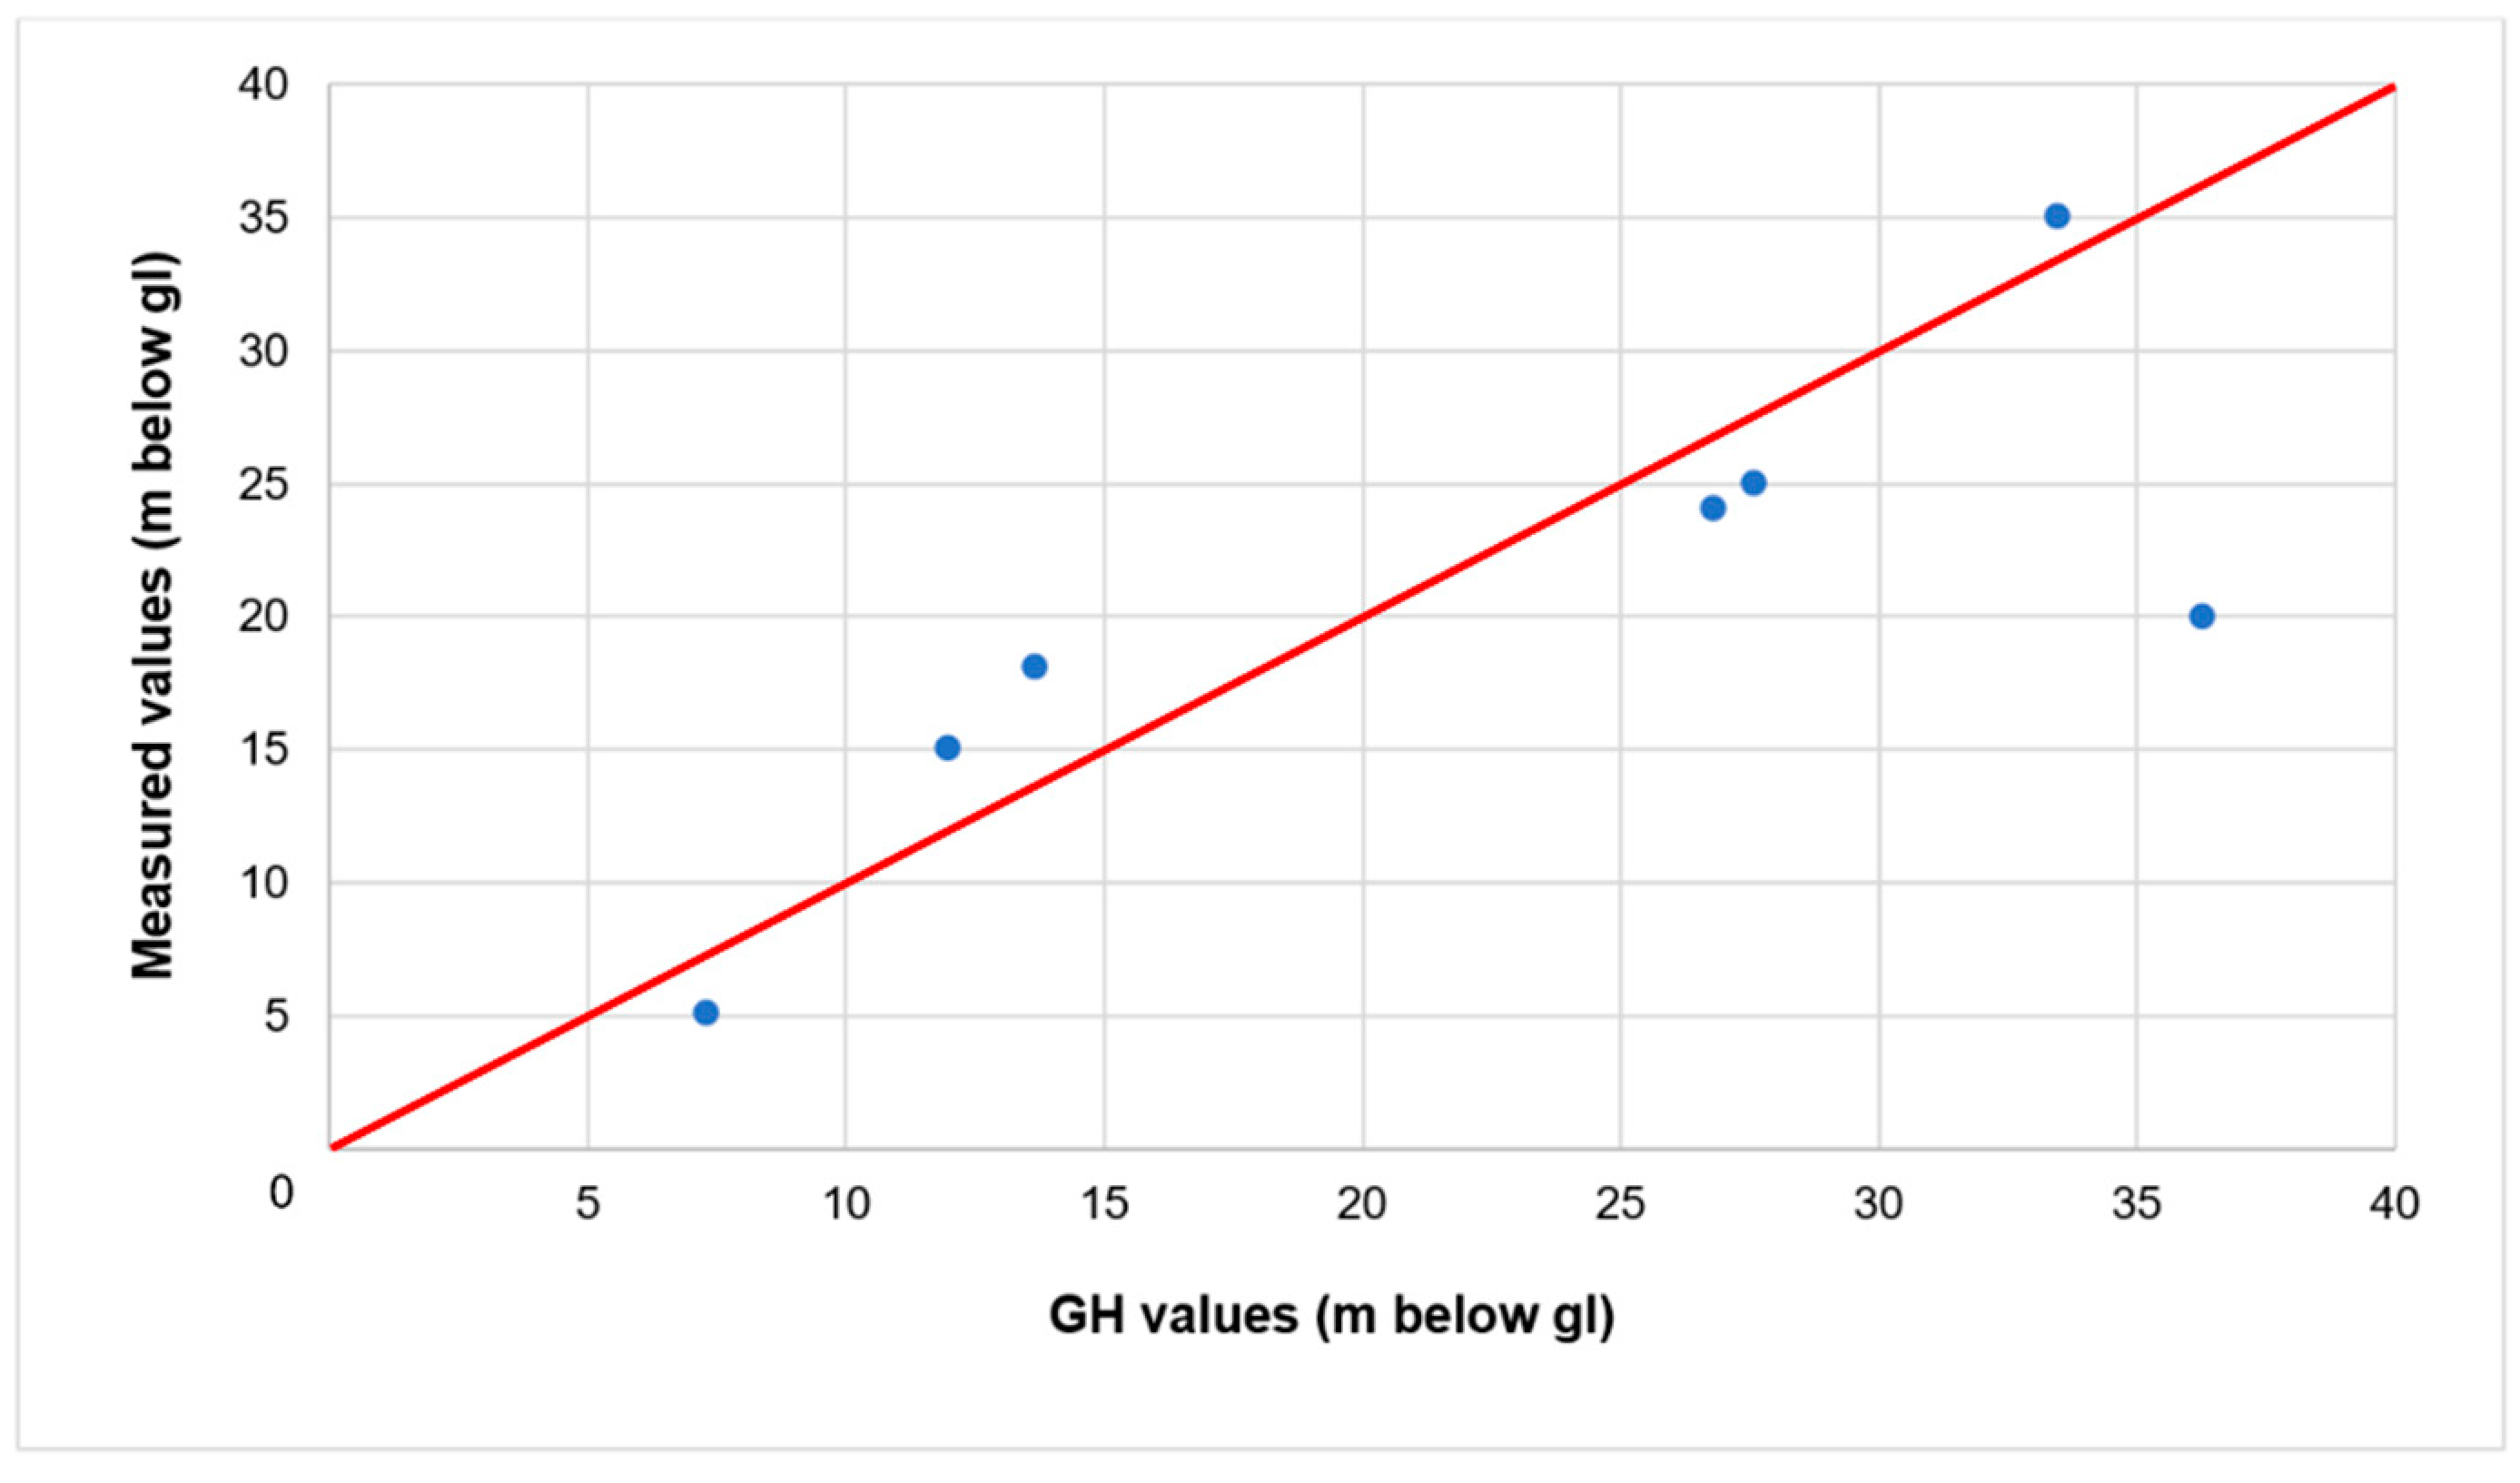
These investigations were aimed at identifying the depth of the seawater interface in coastal areas and comparing it with that obtained from the well-known Ghyben–Herzberg formula [30].

3.3. Chemical Analyses of Well Water

21 wells (Figure 3), selected on the basis of previous hydrogeological and hydrogeochemical data, were periodically sampled and analyzed over the period 2006–2019.
Although the number of sampled waters does not fully represent the types of groundwater of the island, the waters of the selected wells represent a large part of groundwaters captured by the wells serving the thermal facilities. The present investigations were not focused on geochemical characterization of the water, widely studied in the past, but addressed the variations over time in the physicochemical properties and composition of the water captured by the wells.
Water temperature, electrical conductivity and pH values were determined in the field by a multiparametric probe (Multimeter 3420, TetraCon 325, SenTix pH electrodes, WTW). Water samples were immediately divide in two parts and stored at 4 °C until the laboratory analyses. The first part was acidified to pH < 2 with HNO3 (1% v/v) and saved for the determination of metals and metalloids, while the second one was kept for major ions determination. Major anions (HCO3, Cl, SO42−), nitrate (NO3) and bromide (Br) were determined in the laboratory within 24 h from sample collection. HCO3 was determined by means of titration, using HCl 0.1N as a titrant and methyl-orange as a pH indicator.
Metals and metalloids were determined by inductively coupled plasma mass spectrometry (ICP-MS, Aurora M90, Bruker Scientific LLC, Billerica, MA USA). Major ions as NO3, SO42−, Cl, F, Ca2+, Mg2+, Na+, and K+ were determined by ion chromatography (IC Metrohm 850 Professional). Cations were separated by a Metrosep C4 250/4.0 column using 3.0 mM HNO3 as eluent and a flow rate of 0.9 mL × min−1, whereas anions by a Metrosep A supp7 250/40 column using 3.6 mM Na2CO3 as eluent at a flow rate of 0.7 mL × min−1, and determined through a conductivity detector. Silica was determined by colorimetric method using a Cary UV 50 spectrophotometer (Varian, Palo Alto, CA USA). The ionic balance was checked for all the samples and returned an ionic balance error [31] less than ±5% in all cases.

4. Results

4.1. Pumping Tests

In 115 out of 155 tests the condition of steady-state drawdown was reached, despite the relatively short duration of the test time. The specific capacity (SC) values obtained from these tests are summarized in Table S1. Specific capacity spans over 4 order of magnitude (10−5–10−1 m2/s) and shows a log-normal frequency distribution (Figure S2).
For 100 of the previous tests, the residual drawdown during recovery was measured. In most cases the complete recovery of the initial level was achieved in less than 30 min or, generally, in intervals no longer than the pumping time. The transmissivity values obtained from the recovery test (Tr) were compared with SC. An approximate relationship (Figure 4) between the two parameters (coefficient of determination R2 = 0.77) is
Tr = 0.277 SC0.95
For the remaining 40 tests the water level did not reach a steady-state condition during the testing time. The transmissivity was estimated according to the drawdown measured in the pumping well (Td) and, for 32 tests, also to the residual drawdown measured during the recovery (Tr). Tr and Td are in agreement with the following relationship (Figure S3):
Tr = 1.61 Td
From Equation (2) Tr is always slightly higher than Td, being less influenced by well losses.
For the few tests performed also with measurements in an observation well, six showed a non-stationary trend of the drawdown (wells 56, 71, 72, 90, 91, and 92 in Figure 3) and three showed steady-state conditions (wells 43, 78, and 80 in Figure 3). The parameters obtained from these tests are (Table S2): (i) transmissivity estimated by recovery data (Tr) measured in the pumping well, (ii) transmissivity (Tob) determined through the data measured in the observation well, and, for wells which showed unsteady conditions, (iii) transmissivity estimated by drawdown data (Td) measured in the pumping well, and (iv) storativity (S).
The statistics of the transmissivity data obtained from all 139 tests are summarized in Table S3; when more than one value of transmissivity was determined, the arithmetic mean was considered (Tm). Transmissivity values spans over 4 orders of magnitude (10−6–10−2 m2/s) with a dispersion around the mean slightly smaller than the case of SC (Figure S4).
The values of specific capacity (SC) and transmissivity (Tm) obtained have been grouped according to the different types of aquifer formation. Five aquifer types have been distinguished in the peripheral area of the resurgent block of Mt. Epomeo: (i) lava flows, marine sediments and weakly lithified pyroclastic deposits younger than 15 ka (LSP); (ii) weakly to lithified pyroclastic deposits and marine sediments younger than 15 ka (PS); (iii) debris flow and mudflow deposits, marine sediments, pyroclastic fall deposits and tuffs (DT); (iv) epiclastic deposits and the underlying tuff and ignimbrite units (ET); (v) pyroclastic fall and surge deposits, tuffs and Green Tuff (TP). As already mentioned above, only two tests concerned the resurgent block of Mt. Epomeo (wells 56 and 98 in Figure 3), where the aquifer formation is constituted by ignimbrite succession of Green Tuff. The diagrams of SC and Tm for each aquifer formation are shown in Figure 5, with the LSP and TP groups presenting the highest and lowest values of specific capacity and transmissivity, respectively.
Figure 6 shows the distribution of transmissivity values in the different areas of the island. The tests for which transmissivity was indirectly determined using Equation (1) were also considered. When more than one value of transmissivity was determined for each test, the arithmetic mean (Tm) is shown in the Figure 6.
A significant spatial variability of transmissivity is evident from the map. The spatial distribution of the parameter seems in general to be dependent on the type of aquifer formation, with the highest values of transmissivity in the LSP and PS types (Figure 6). These aquifer formations, including lavas, pyroclastic deposits and marine sediments younger than 15 ka, are mainly distributed in the northeastern area of the island, where the latest volcanic activity mostly took place. However, it should be noted that even for similar aquifer formations and wells close to each other there might be significant variation of the parameter. This can be attributed to the wide vertical and horizontal variability of the specific stratigraphic units constituting the identified aquifer formations. In general, the saturated thickness of the aquifer intersected by the wells seems to have little influence on the variation of the transmissivity (Figure S5).
To point out the distribution of the areas with the highest transmissivity at the scale of the island as a whole, geostatistical estimators were applied. The absence of clear spatial correlation does not allow to obtain reliable results through the application of linear geostatistical estimators; the non-linear estimator Disjunctive Kriging [32,33,34,35] was applied in association with log-transformation and second order detrending (Figure 7).
As shown in Figure 7, the highest values of transmissivity are found in the northeastern, northwestern and southwestern areas, where the aquifer is made up of the most recent (from Present to 33 ka) fractured lavas, weakly lithified pyroclastic deposits, marine sediments and alluvial deposits, while the lowest values are in the innermost areas of the island, where the aquifer is made up of the oldest pyroclastic deposits (mainly tuffs and ignimbrite units).

4.2. Variation in Water Temperature during Pumping

During the pumping tests, the abstracted water showed in some cases an increase in temperature, in other cases no change or a decrease. The water temperatures at the beginning of the tests and the temperature change during pumping are shown in Figure 8.
The initial temperature does not show a clear spatial correlation, the highest values being observed in the north-western, western and southern areas, in agreement with previous studies [3,4,5,6]. Different correlations between temperature variation during the test and other parameters have been sought, such as temperature at the beginning of the test, depth of the wells, transmissivity of the aquifer, pumping flow rate, and elevation of the water level. None were acceptably significant (as shown, for example, in the Figures S6–S8). Six out of twelve tests, after an initial drawdown, showed an increase in the piezometric level in the last stages of pumping in conjunction with the rise in temperature (up to 80 °C at the end of pumping) (Figure 8). The same phenomenon was observed in previous studies for some wells on the island [25].
The temperature variation during pumping was analyzed in terms of “probability to exceed 2 °C of increase” with indicator kriging. This processing was carried out to highlight the zones of the island which are most sensitive to temperature variations during pumping, a factor that affects the maintenance of the properties of thermal waters over time according to current legislation. Higher probabilities to find a temperature increases (>2 °C) were explored through the non-parametric approach of Indicator Kriging [36,37] and were found in the north-western, western and southern areas of the island (Figure 9). These areas are those most densely affected by fumarole fields, fractures and faults (Figure 1).

4.3. Water Temperature and Electrical Conductivity Logs

Water temperature logs were also conducted under undisturbed conditions. 19 wells had a depth of saturated aquifer intercepted by wells from 11 to 150, sufficient to perform the analysis. 14 wells showed an increase in temperature with depth from 0.01 to 0.27 °C/m; conversely, 5 wells showed a decrease in temperature with depth. For the latter, a significant increase in electrical conductivity with depth has been found, up to values close to that of seawater. Also some wells, located near the coast line and characterized by a positive temperature gradient, showed a significant increase in electrical conductivity with depth, up to the typical values of seawater.
In the case of 7 sufficiently deep wells (wells 1, 4, 6, 7, 32, 111, and 113 in Figure 3), that showed significant increases in electrical conductivity and/or significant decreases in temperature with depth, the depth of the seawater interface was determined by the sudden change in temperature and electrical conductivity logs. Results were compared with the Ghyben–Herzberg formula [30], considering the measures of the elevation of the water level in the well and the ratio (α):
α = ρ f ρ s ρ f
where ρf and ρs are the densities of the “fresh” water and the seawater, respectively. The densities of the “fresh” water and the seawater have been determined following Sharqawy et al. [38], which draw a relationship between different salinity and temperature scales. For “fresh” water, salinity and water temperature values measured in the first meters of depth were considered. For the seawater, the salinity (41 g/L [23]) and the temperature measured at the bottom of each hole were considered. The α ratio results to vary between 38 and 67 for the examined wells. The measured values of the depth of the seawater interface through the logs and those determined through the Ghyben–Herzberg formula are not very different from each other, with the exception of a well, as shown in Figure 10.

4.4. Chemical Analyses of Well Water

Analytical data of water sampled from the selected wells (wells 1, 2, 3, 4, 5, 6, 7, 8, 9, 13, 54, 55, 89, 107, 108, 111, 113, 114, 133, 150, and 153 in Figure 3) are reported in Table S4. A wide variety in the physicochemical parameters and chemical compositions of groundwater (major ions, temperature and salinity) is found, as already well known from the literature, e.g., [3,4,5,6]. Temperature of water (T) ranges from 25 to 80 °C, total dissolved solids contents (TDS) vary from 1 to 41 g/L, concentrations of major ions indicate sodium bicarbonate to sodium chloride types (Figure 11) and silica content range from 6 to 185 mg/L.
For the purposes of the research, the variations over time in the main physicochemical and chemical parameters were considered, such as water temperature, and TDS and Na/Cl, Mg/Cl and Br/Cl ratios. Na/Cl and Mg/Cl ratios are considered indicators of the contribution of seawater and deep-rising hydrothermal fluids for Ischia groundwater [6], Br/Cl ratio is used in the literature to distinguish groundwater affected by seawater intrusion and by endogenous degassing in active volcanic areas [39].
The waters of all the wells show an insignificant variation in the Mg/Cl ratio over time. Only four wells show negligible variation in all indicators (wells 8, 108, 113, and 150 in Figure 3 and Table S4). All the other wells show variation of at least one indicator during the considered period. The most significant changes over time in percentage terms are of temperature, TDS and Br/Cl ratio (wells 1, 4, 5, 6, 7, 9, 13, 54, 55, 89, 107, 111, 114, 133, and 153 in Figure 3 and Table S4) as shown in Figure 12. Most of these wells also show variation in the silica content. In general, the silica content depends on the temperature of the water, and according to [3] is also influenced by the complex processes of evaporation, subsurface boiling and water-rock exchange.
Under the hypothesis that the concentration of chloride in the sampled waters represents an index of the contribution of seawater, the following ratio was used to determine the percentage of seawater (%SW) in the waters of the sampled wells:
% S W =   ( 1 C l s C l m C l s C l f )   100
where
-
Cls is the concentration of chloride in seawater, set equal to the highest value found for well water (i.e., 22,125 mg/L, which is slightly higher than that reported for seawater in [23]),
-
Clm is the concentration of chloride in well waters and
-
Clf is the concentration of chloride in “fresh” water, set equal to the lowest value found for well water (i.e., 139 mg/L).
Table 2 shows the average percentage of seawater (%SWav) in the water of each sampled well. The %SWav mainly depends, with some exceptions, on the distance of the well from the coast line, the depth of the well and the value of the drawdown during pumping.

5. Discussion

The study allowed us to deepen the knowledge on the hydrogeology of the island, and specifically on the response of aquifer to pumping and its implications on the quality of the water extracted.
Although the island constitutes an active hydrothermal system, the classical interpretation methods of the pumping tests seem to be generally applicable in the case under examination: exceptions to the drawdown-time trends were detected only in wells with the highest water temperatures. It is clear, however, that the estimated transmissivity values should be corrected for the variable conditions of density (ρ) and dynamic viscosity of the fluid (μ). Considering the range of variation of salinity and temperature of the waters of the island, it turns out that the ρ/μ ratio varies between 1 and 2 if compared to standard conditions (pure water at 15.5 °C, ρ = 1.0 g/cm3, and μ = 1.124 cP). A comparison of the estimated transmissivities in the different areas of the island should take into account this correction. However, the wide range in which the estimated parameter falls (from 10−6 to 10−2 m2/s) allow us to attribute its extreme variability mostly to the heterogeneity of the aquifer, making any effect of density and dynamic viscosity negligible in comparison.
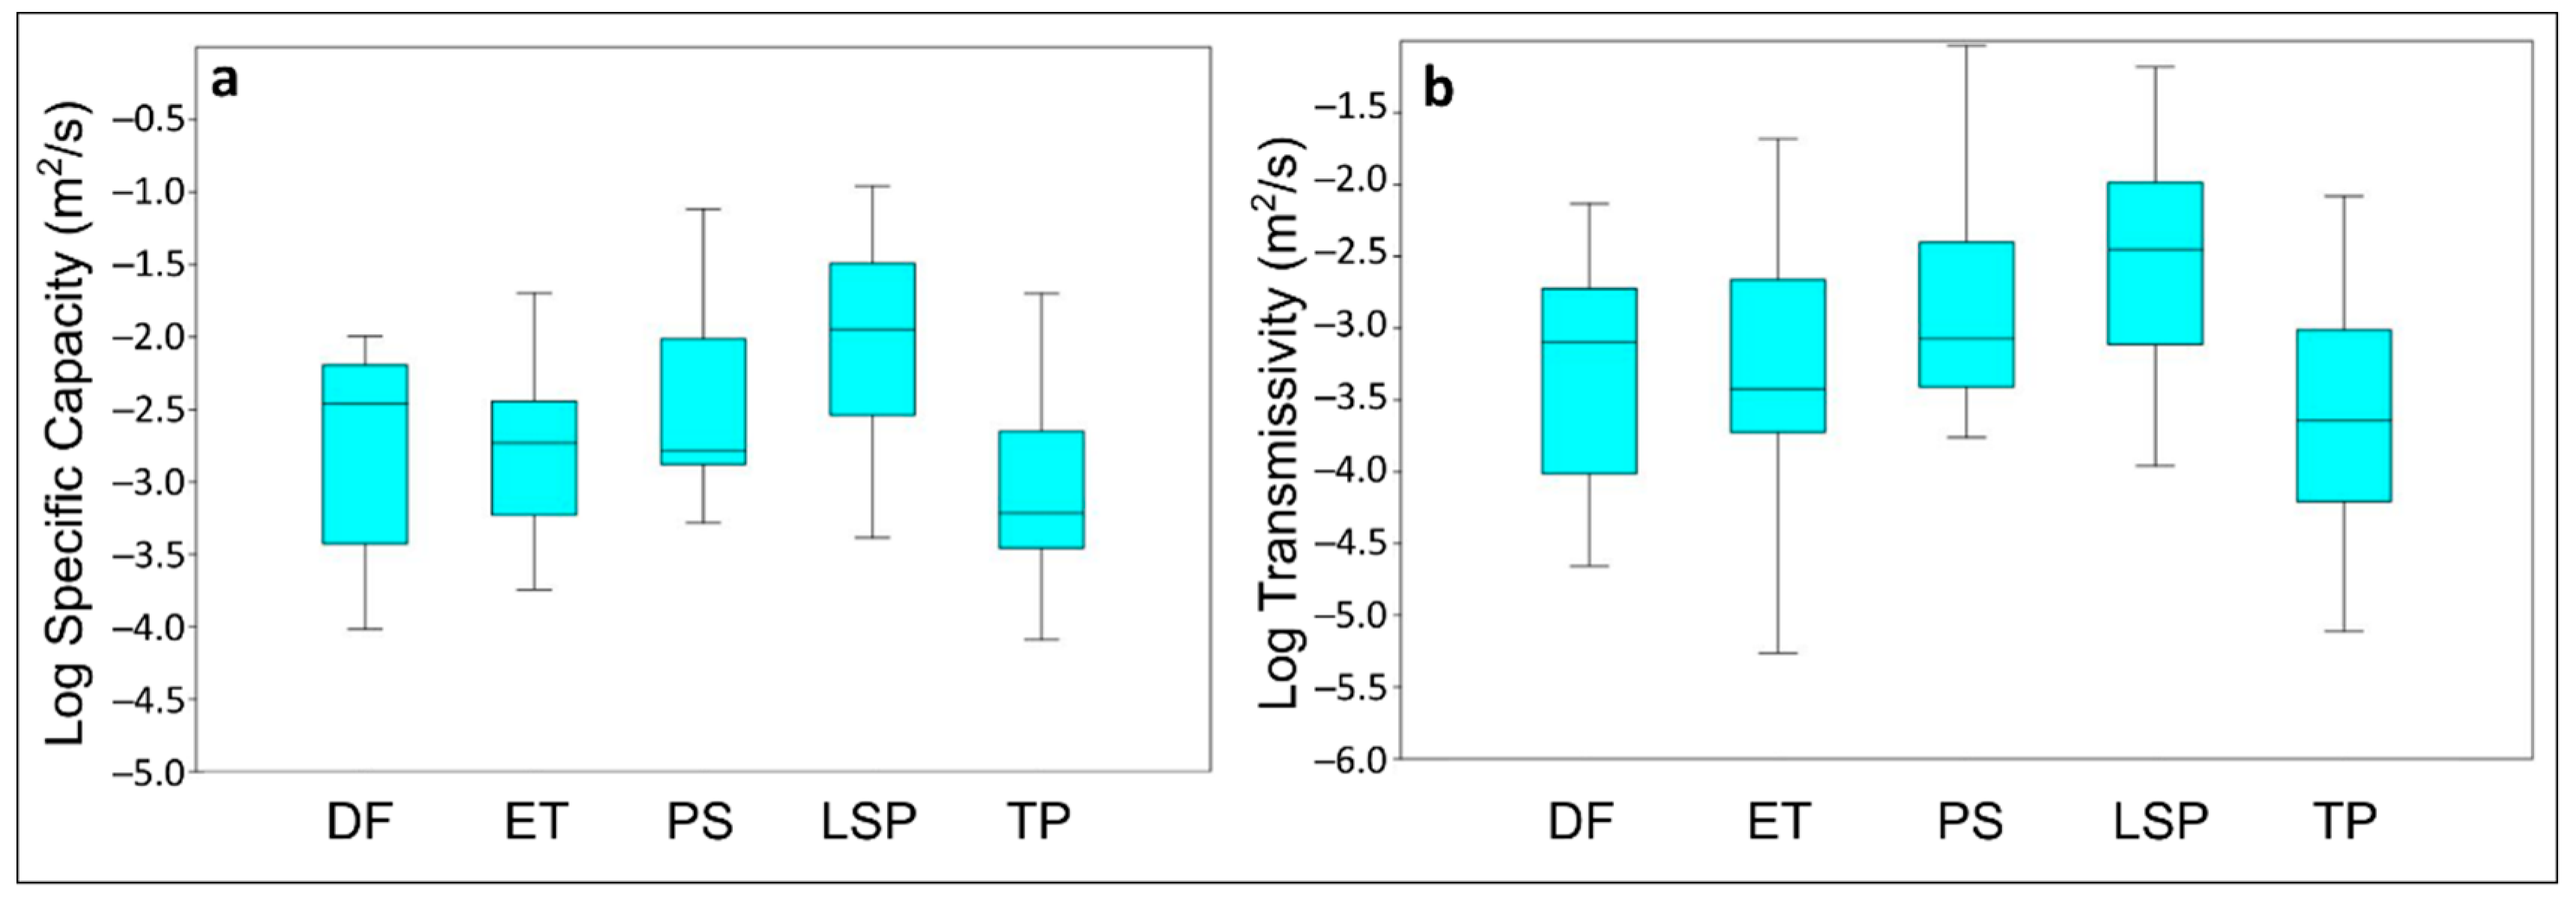
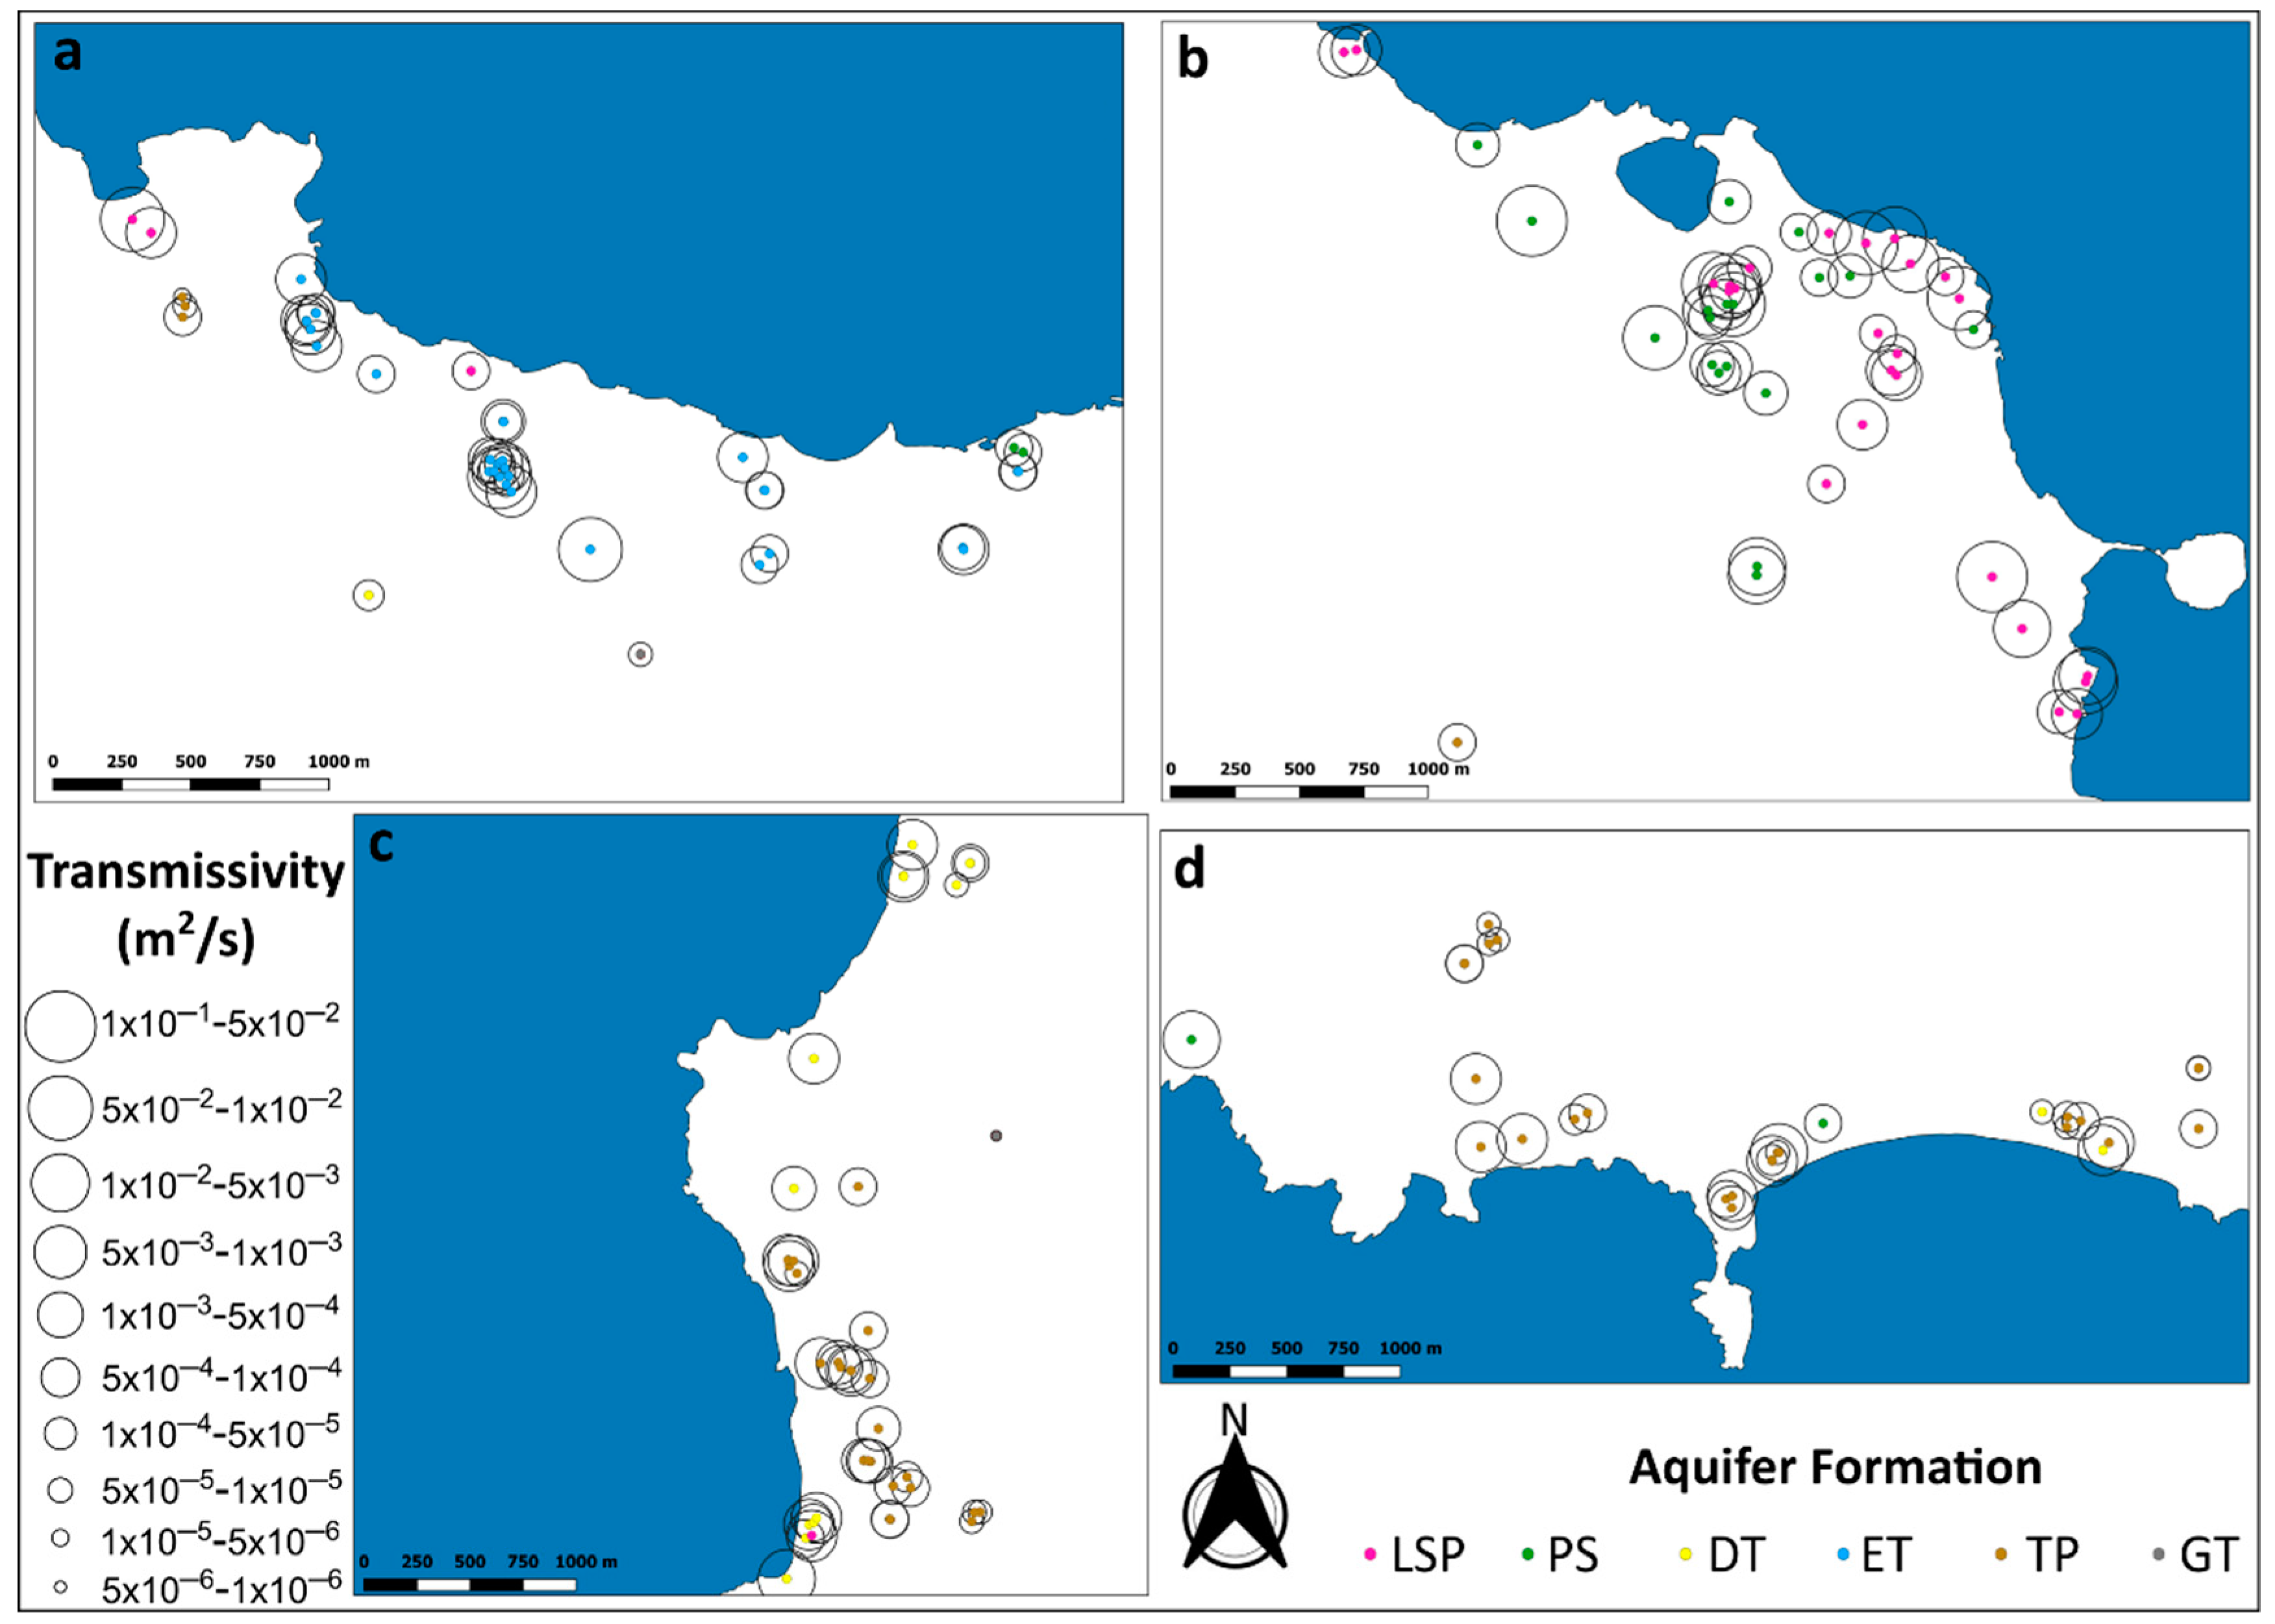
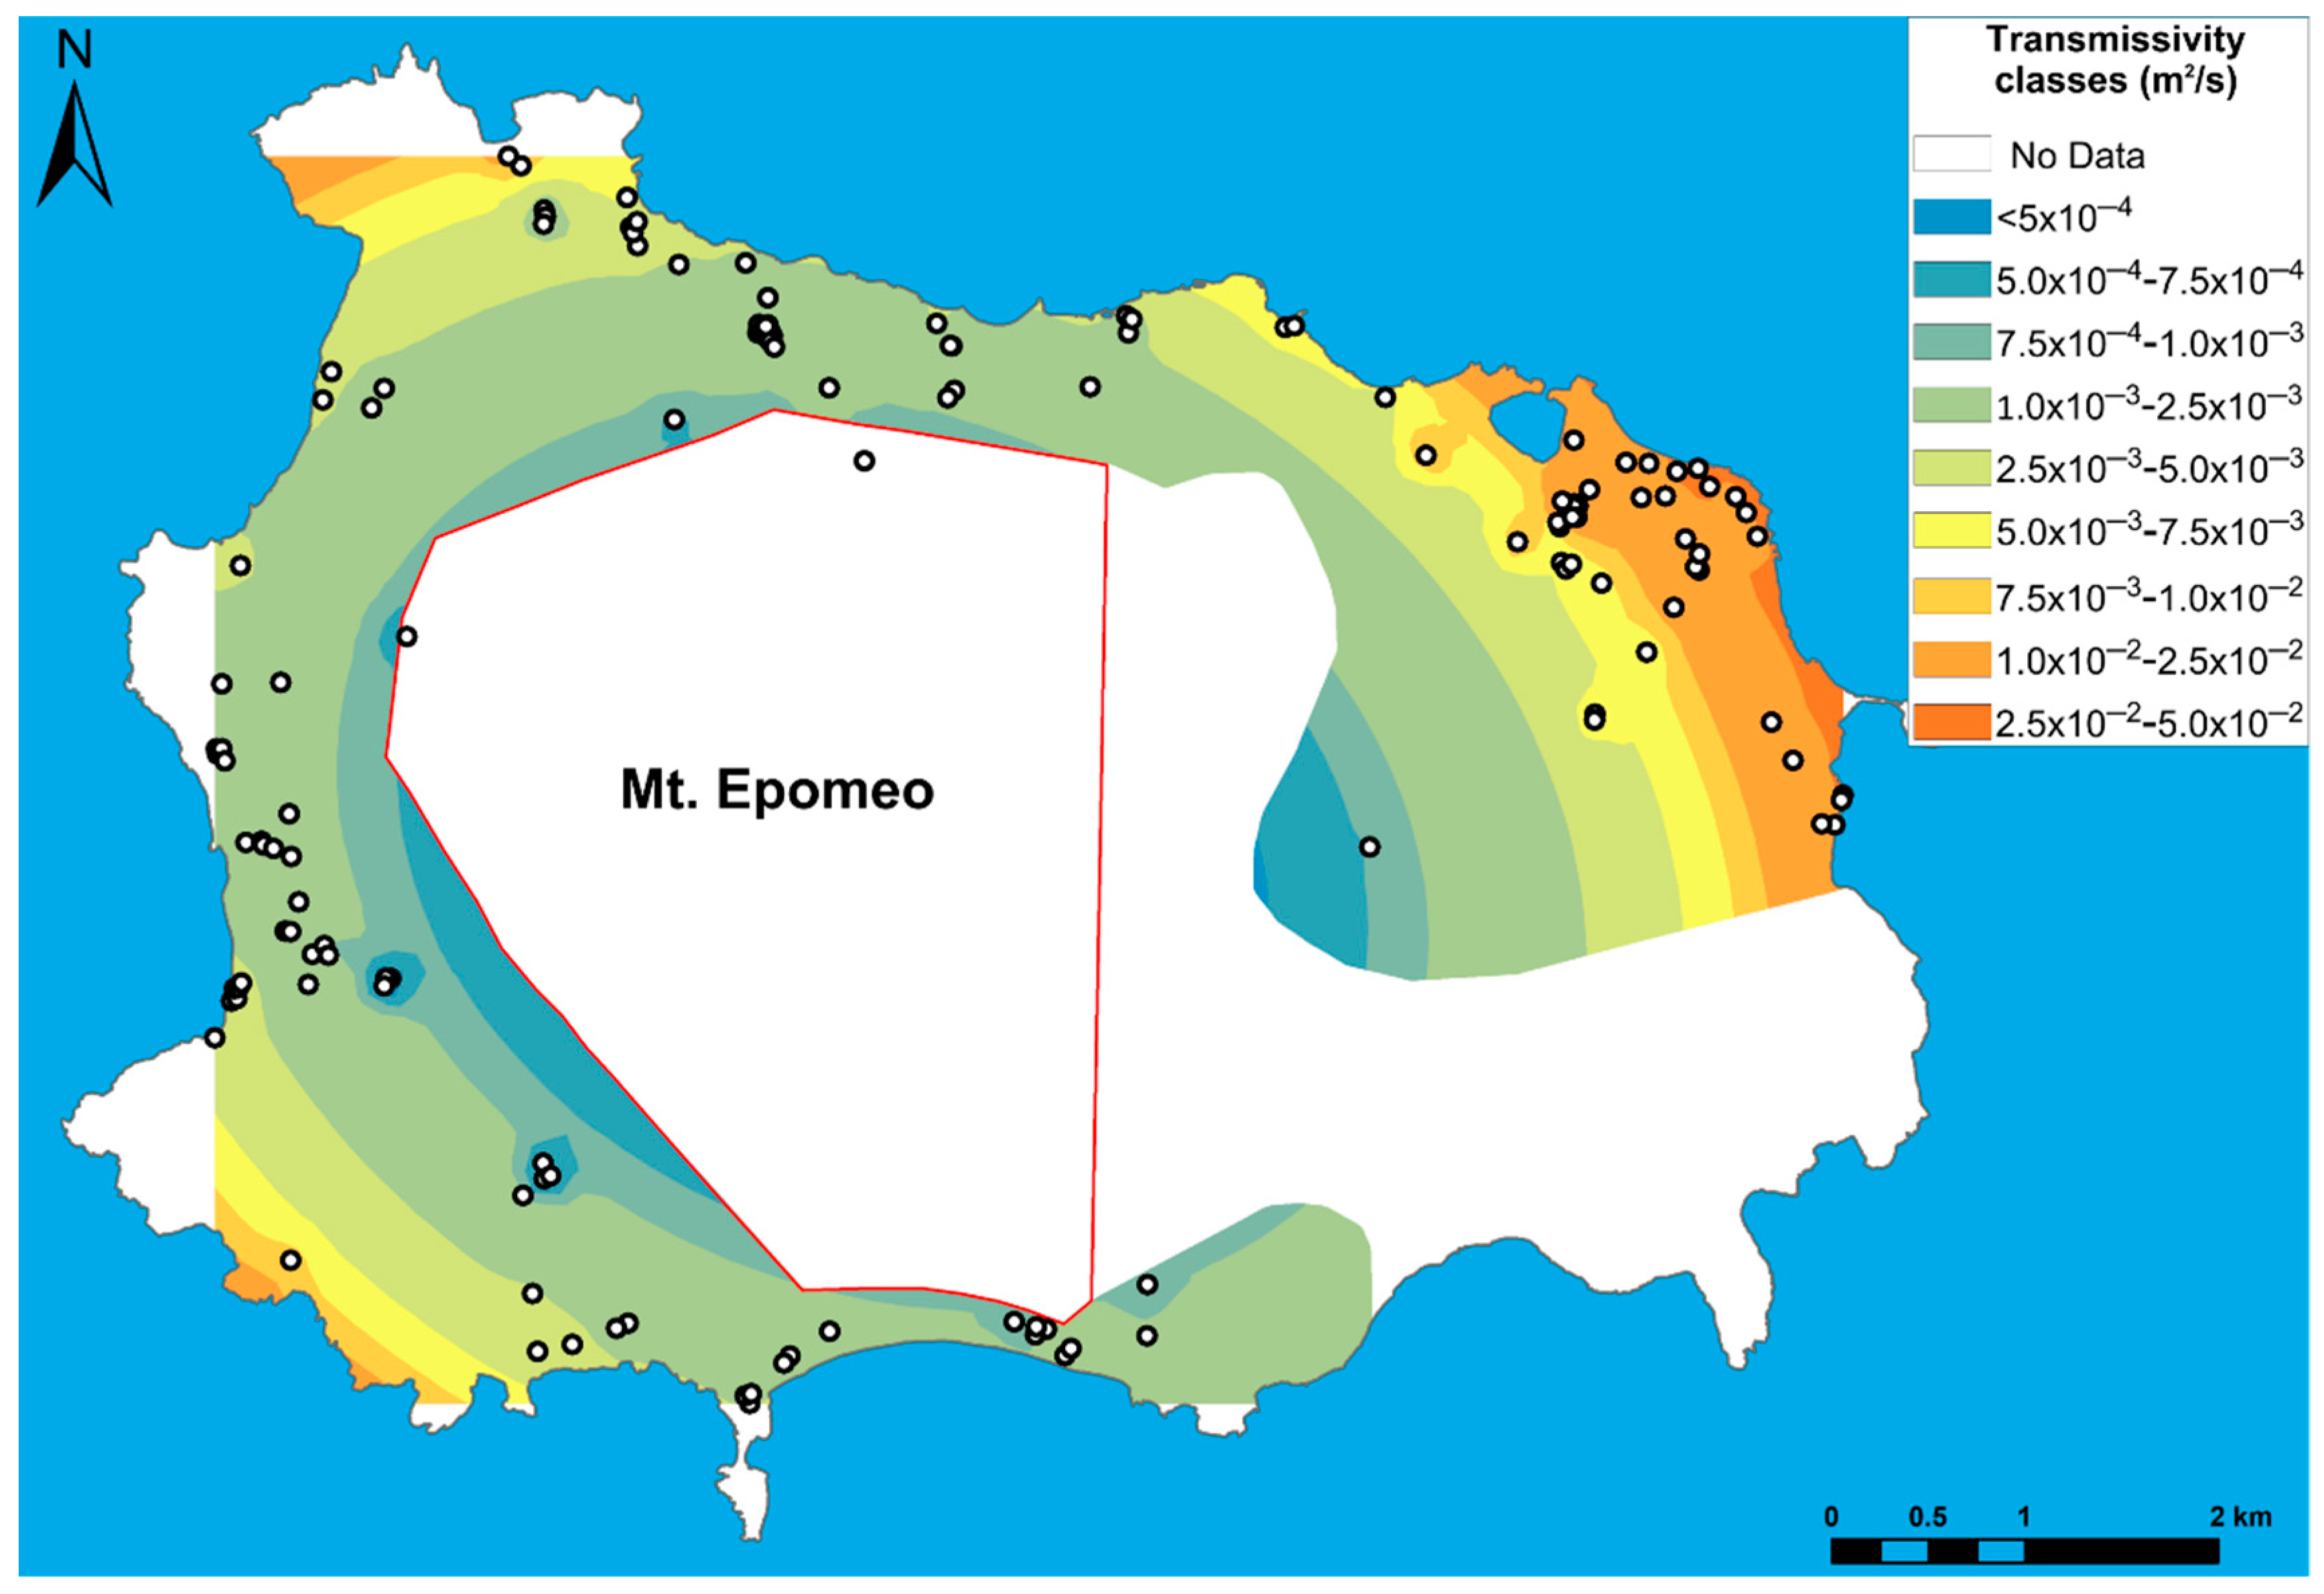
As it was found in other volcanic aquifers [40], higher values of transmissivity are recognized in the most recent volcanic and volcanoclastic deposits and lower values in the oldest pyroclastic and epiclastic deposits of the island (Figure 5, Figure 6 and Figure 7). Sometimes there is an extreme variability of the parameter even among wells very close to each other with little spatial correlation at the small scale. This is due to the complex volcanological history of the island, where, based on the most recent studies [11], 130 stratigraphic units have been recognized in 46 km2. These geological-volcanological features result in a significant vertical and horizontal hydraulic heterogeneity which is reflected by: (i) the absence of a direct relationship between transmissivity and thickness of saturated aquifer intercepted by the tested wells for the whole island, (ii) and by the fact that the lowest values of the parameter (4 × 10⁻⁶ to 2 × 10⁻⁵ m2/s) were found for the very deep wells crossing a more homogeneous ignimbrite sequence of the resurgent block of Mt. Epomeo.
From the different types of tests conducted on wells, it is confirmed that the specific capacity can be a useful parameter for a first estimate of the transmissivity. In the case under consideration, the transmissivity obtainable from Equation (1) is about half an order of magnitude lower than the specific capacity. Similar relationships found in other volcanic areas highlight a smaller difference between the two parameters [41,42,43], but they concern very different aquifers (mainly basaltic lavas) hosting fresh waters.
The hydrogeochemical investigations confirm an extreme variety of the physicochemical characteristics of the island’s groundwaters (TDS from 1 to 41 g/L and T from 25 to 90 °C), as already well known in literature [3,4,5,6]. The range in salinity and temperature locally influences the water density and the ratio α of Equation (3) used in the Ghyben-Herzberg relationship; applying a locally modified α value, the calculated depth of the seawater interface generally differs little from the one measured.
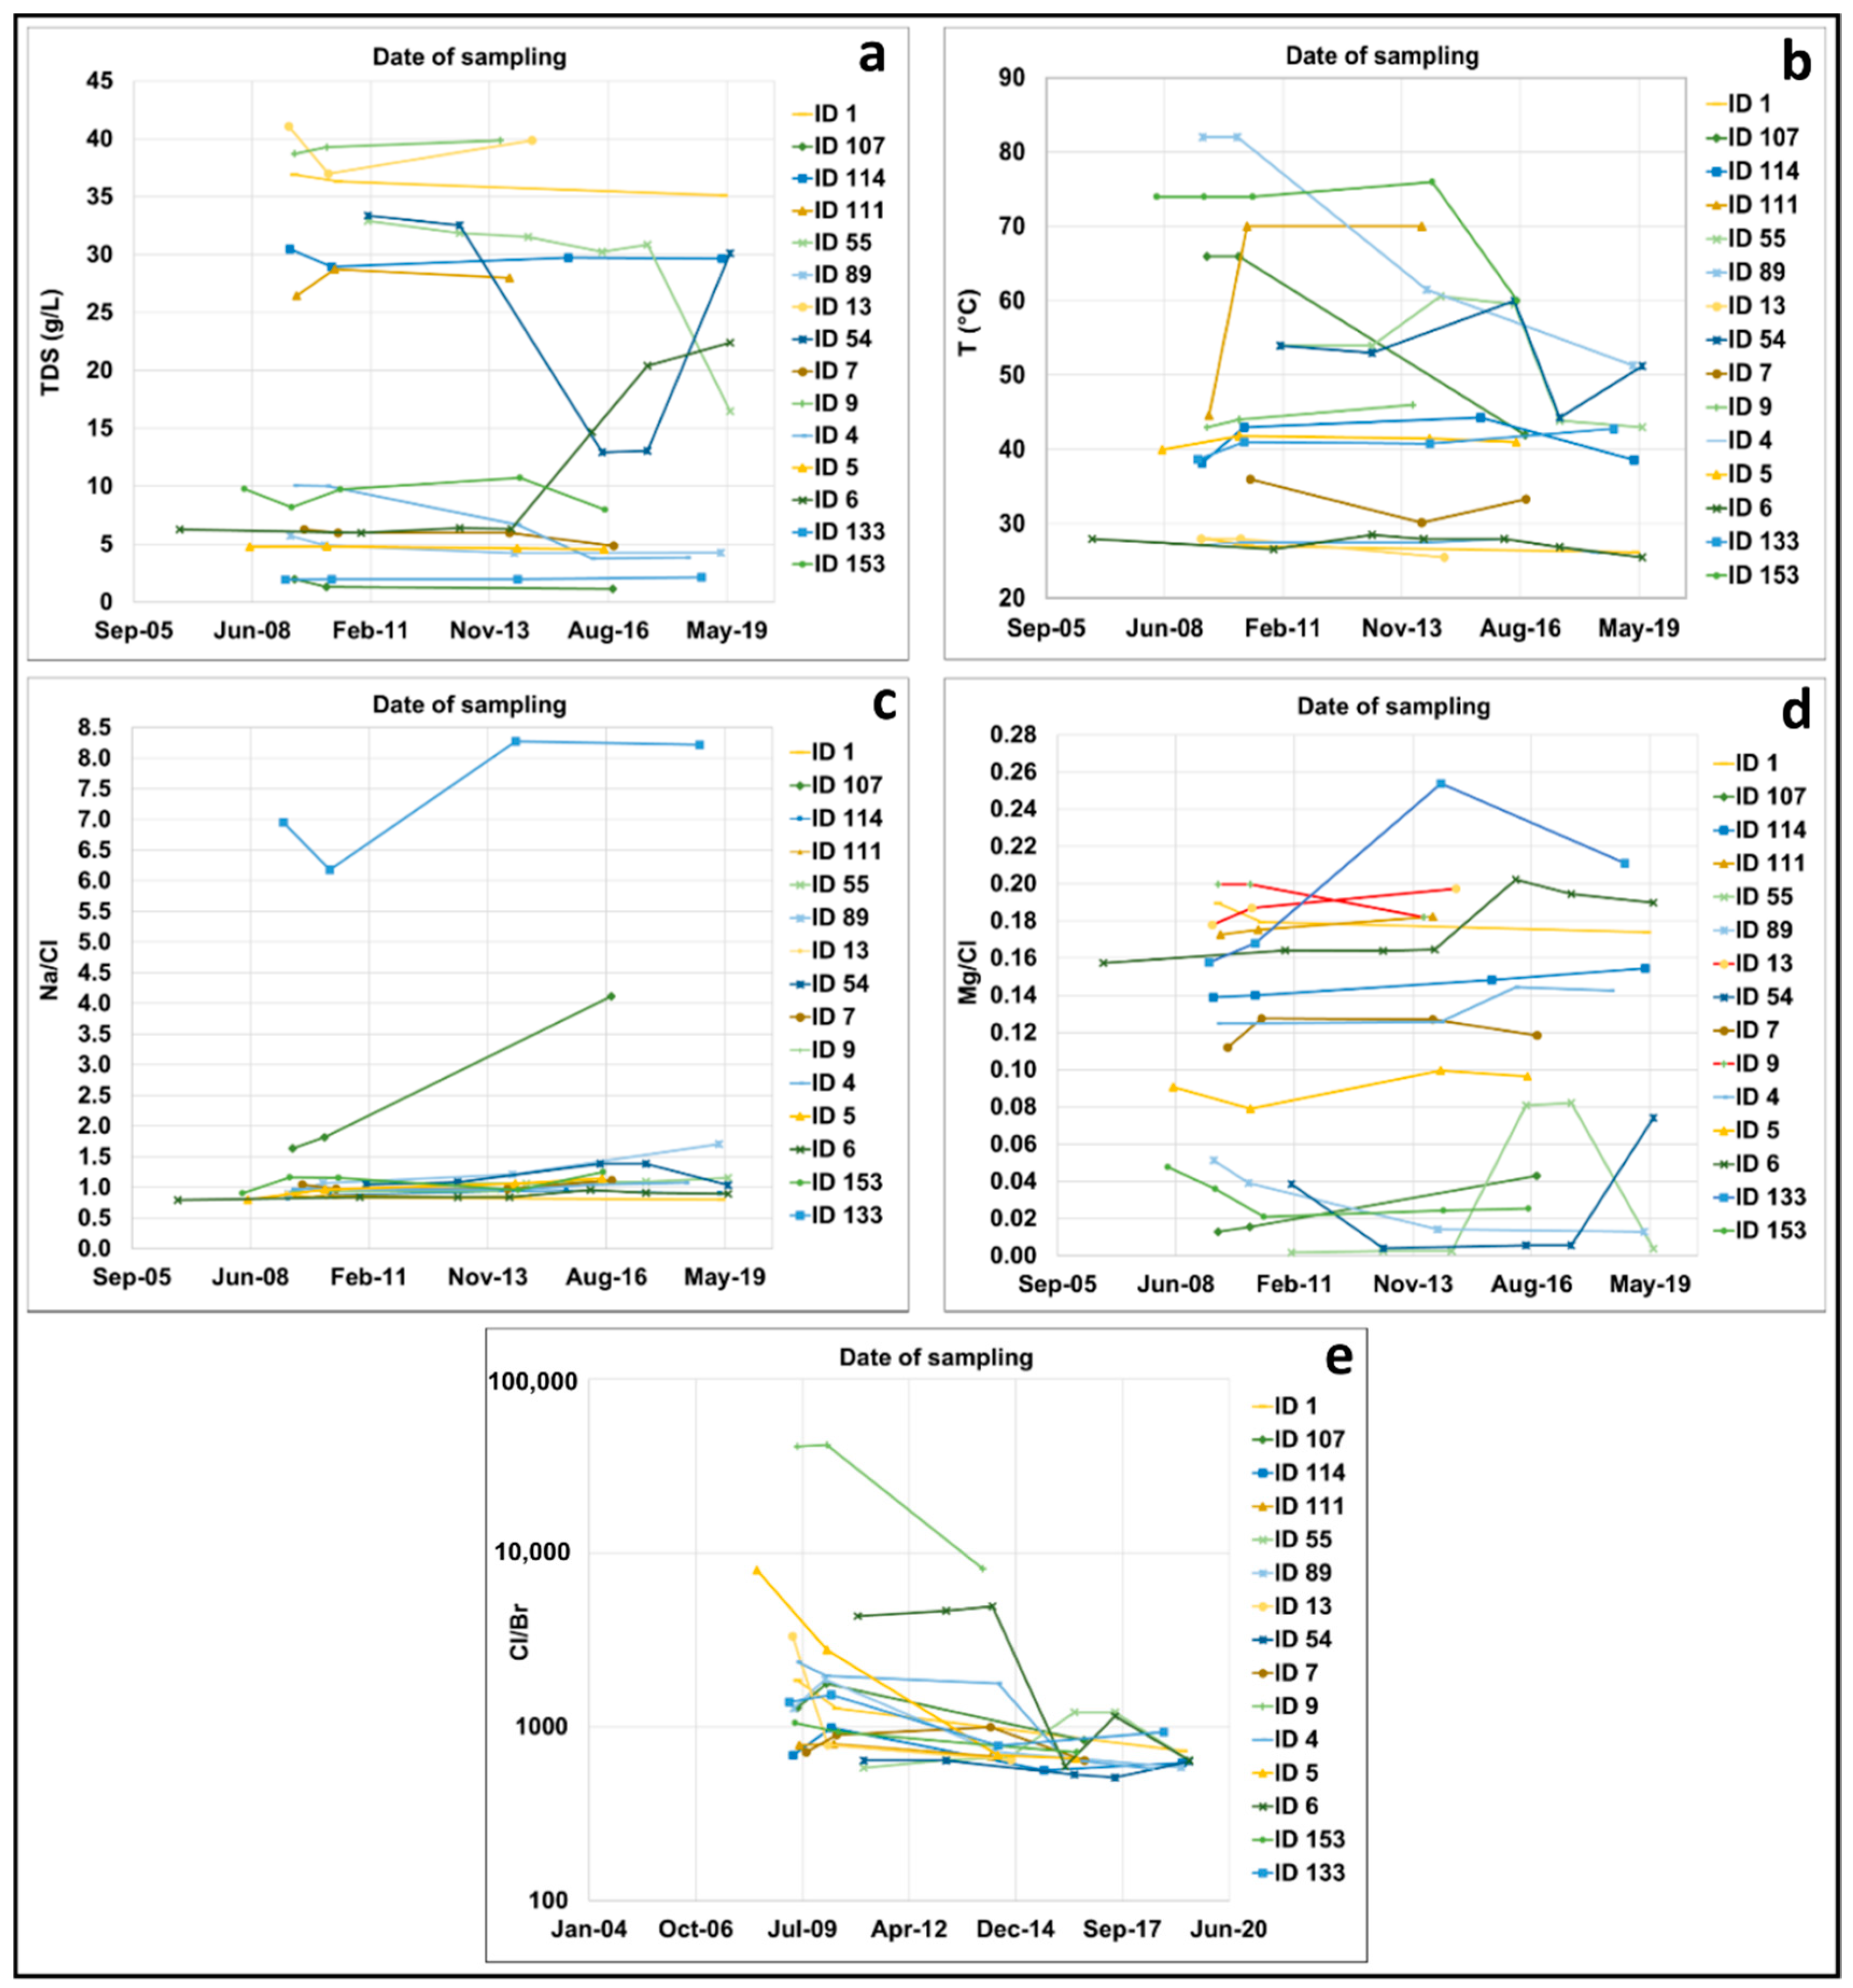
15 of the 21 wells sampled several times in the period 2006–2019 show significant variations in the quality of their waters (Figure 12); some of these wells (wells 89, 107, and 153) also show a significant increase in water temperature during pumping (from 4 to 9 °C). The other 6 wells monitored in the same period did not show significant changes in their chemistry and temperature, highlighting the stability of temperature even during pumping. Therefore, comparing what was found for the 21 wells, the differences in the quality of the water extracted over time can be attributed to the effects of pumping in a heterogeneous aquifer, characterized by different recharge boundary conditions.
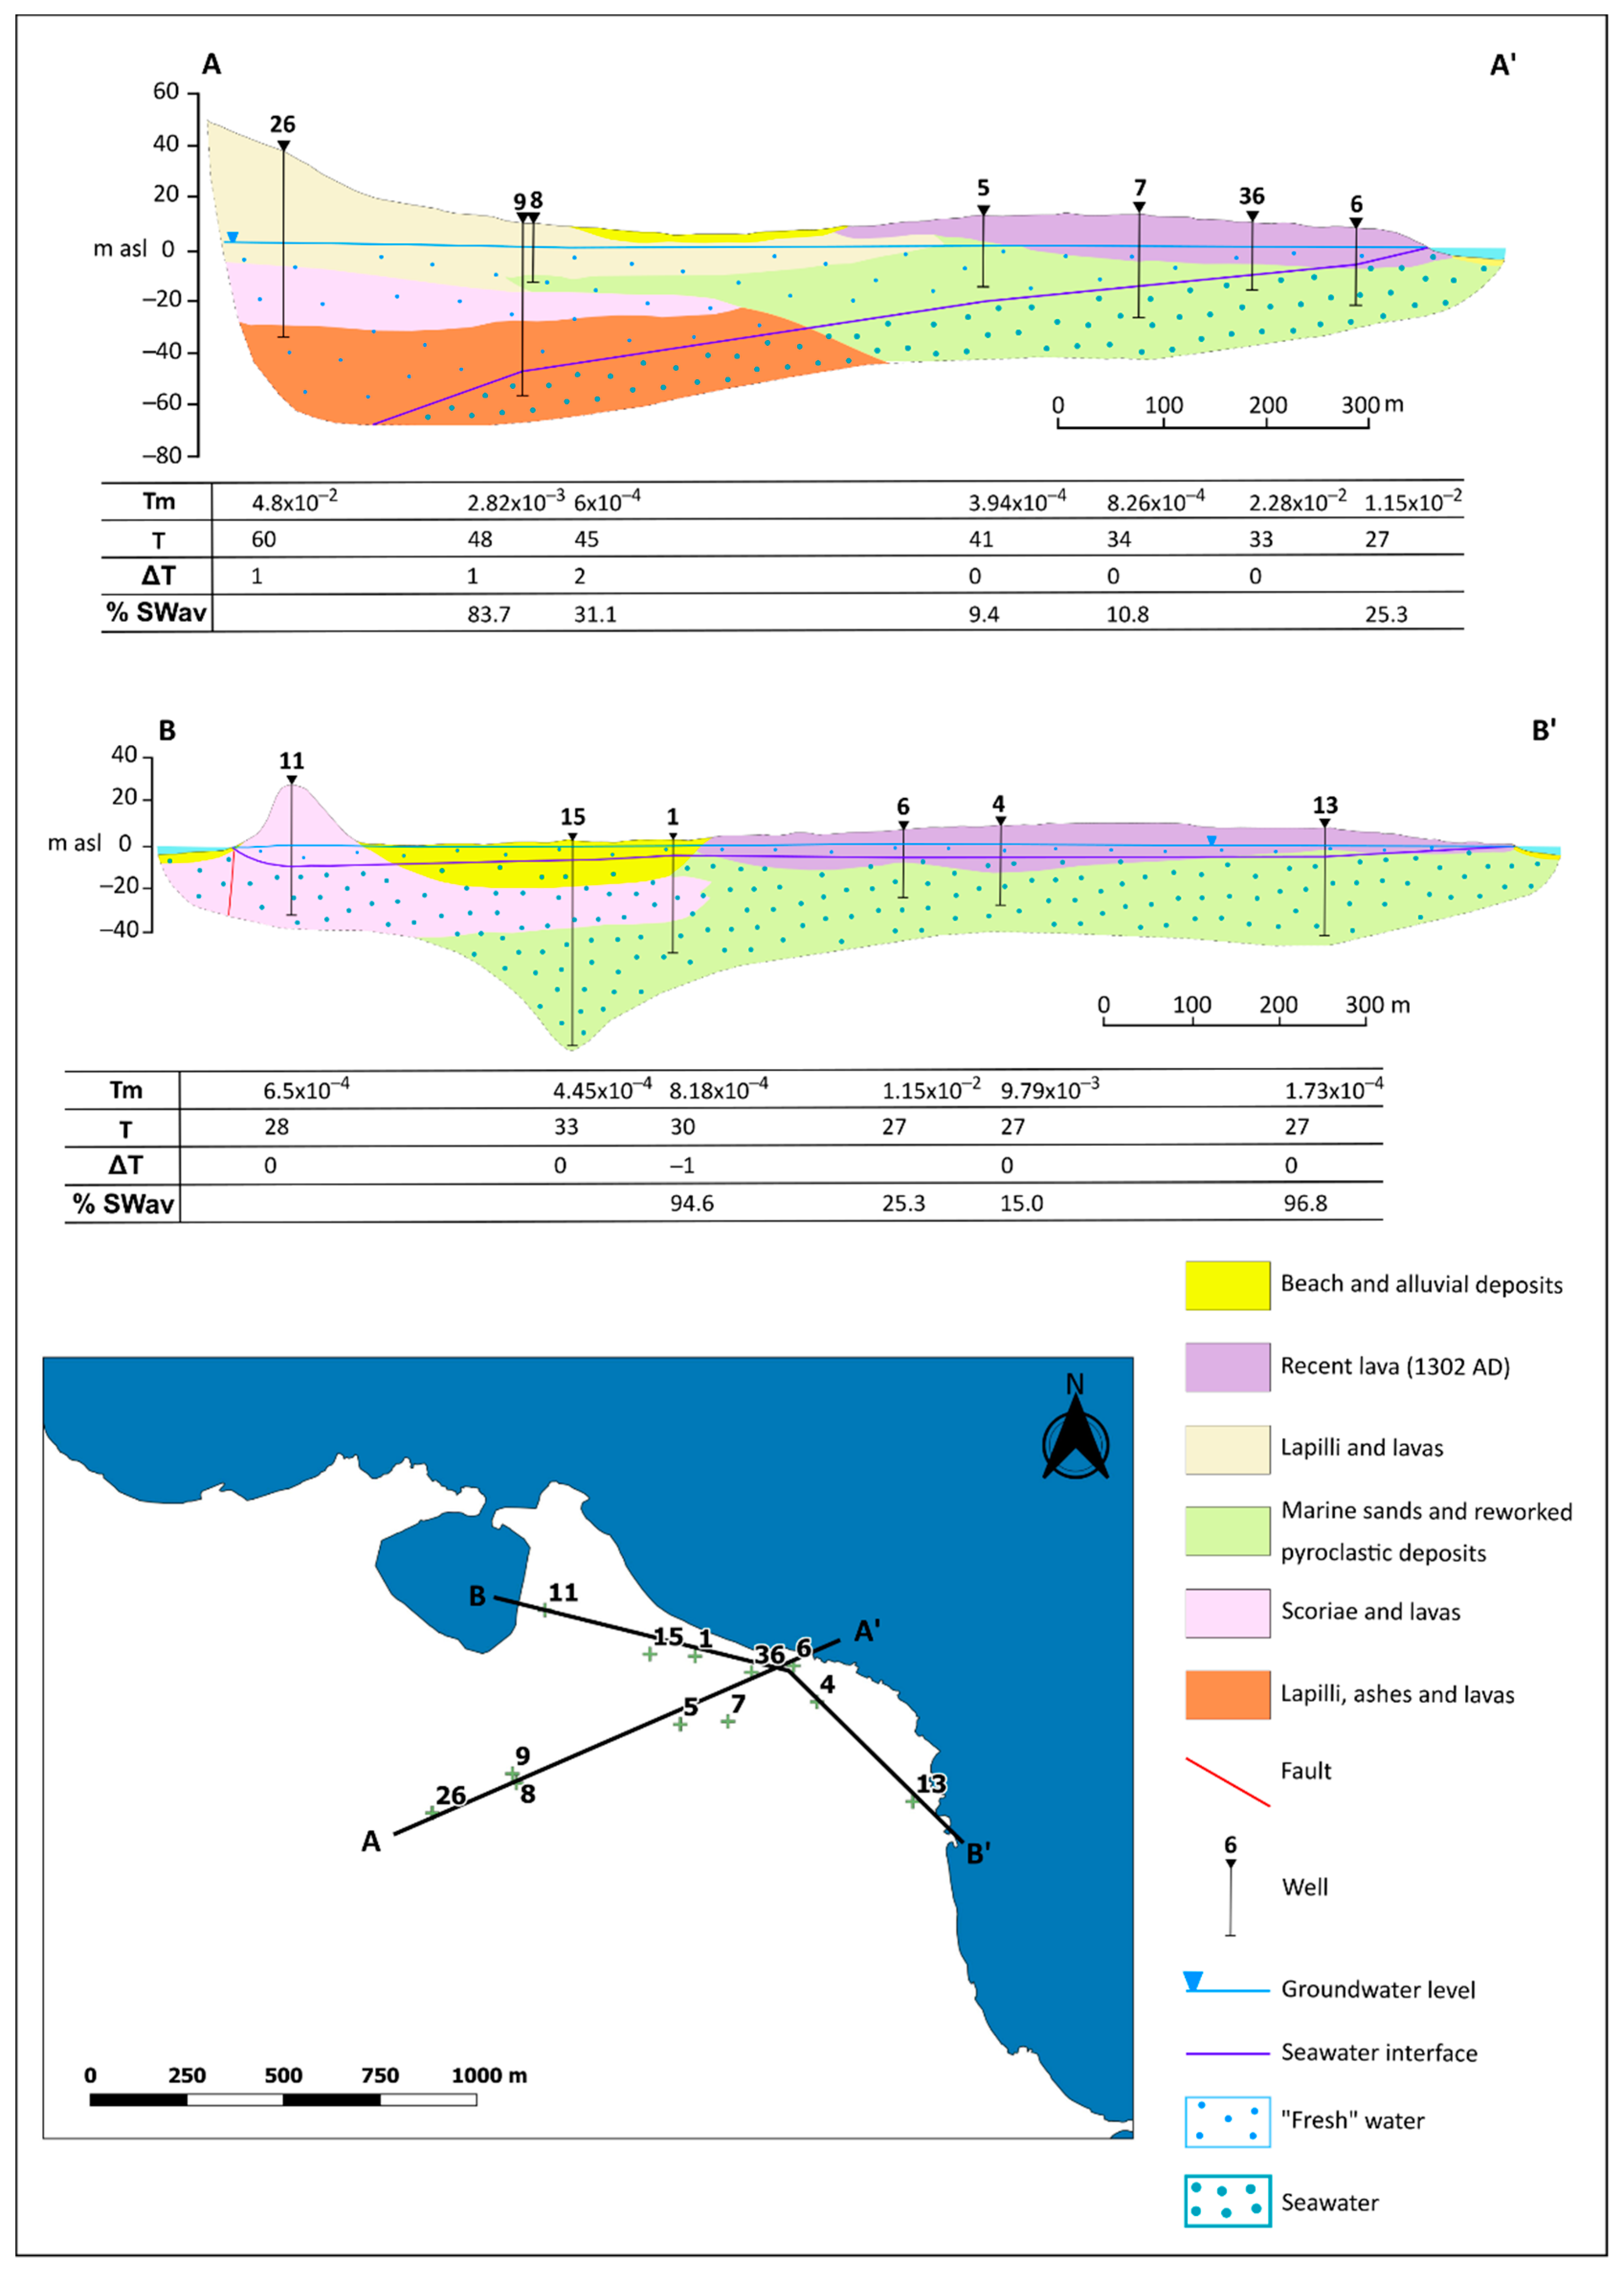
In general, the wells closest to the coast rapidly reach steady-state conditions during pumping, show higher transmissivity values, a greater percentage of seawater in the captured waters, and stability of water temperature during pumping (indeed in some cases a decrease has been measured, Figure 8). In many cases, the boreholes are deeper than the “fresh” water-seawater interface already in static conditions (i.e., before pumping). Examples of this are shown in the hydrogeological sections of Figure 13, which cross the north-eastern coastal sector.
In the first cross-section (A-A’ in Figure 13), an increase in the water temperature as the depth of the seawater interface increases can be observed, while there is no change in temperature during pumping for the wells where the seawater interface is less deep. The transmissivity varies between two orders of magnitude, with the highest values for wells intercepting significant lava thicknesses (wells 26, 9, 7, 36, and 6). It is noteworthy that the wells closest to the coast (wells 7 and 6), which already in static conditions pierce the interface, show a percentage of seawater under pumping lower than the inner wells (wells 8 and 9). This can be explained by taking into account that the wells closest to the coast intercept a significant thickness of the most recent blocky lavas of the island (Arso lavas, dated 1302 AD). The thickness of the most superficial and more permeable lava layer can determine the percentage of seawater captured by the well, which tends to be fed by the landward inflow, limiting the seawater upconing. From cross-section B-B’ as well (Figure 13), the thickness of recent blocky lavas intercepted by the wells seems to locally influence the transmissivity and the percentage of seawater captured during pumping.
Moreover, the response of the aquifer to pumping also depends on the possible interference between neighboring wells and on the change in the groundwater level induced by tides, taking into account that in this area there is one of the highest densities of wells operating simultaneously during the peak season (Figure S1) and the piezometric level is only a few decimeters above sea level (asl) in static conditions (Figure 1). Together, these conditions have an impact on local and variable seawater upconing with a consequence on the quality of the water captured by the wells.
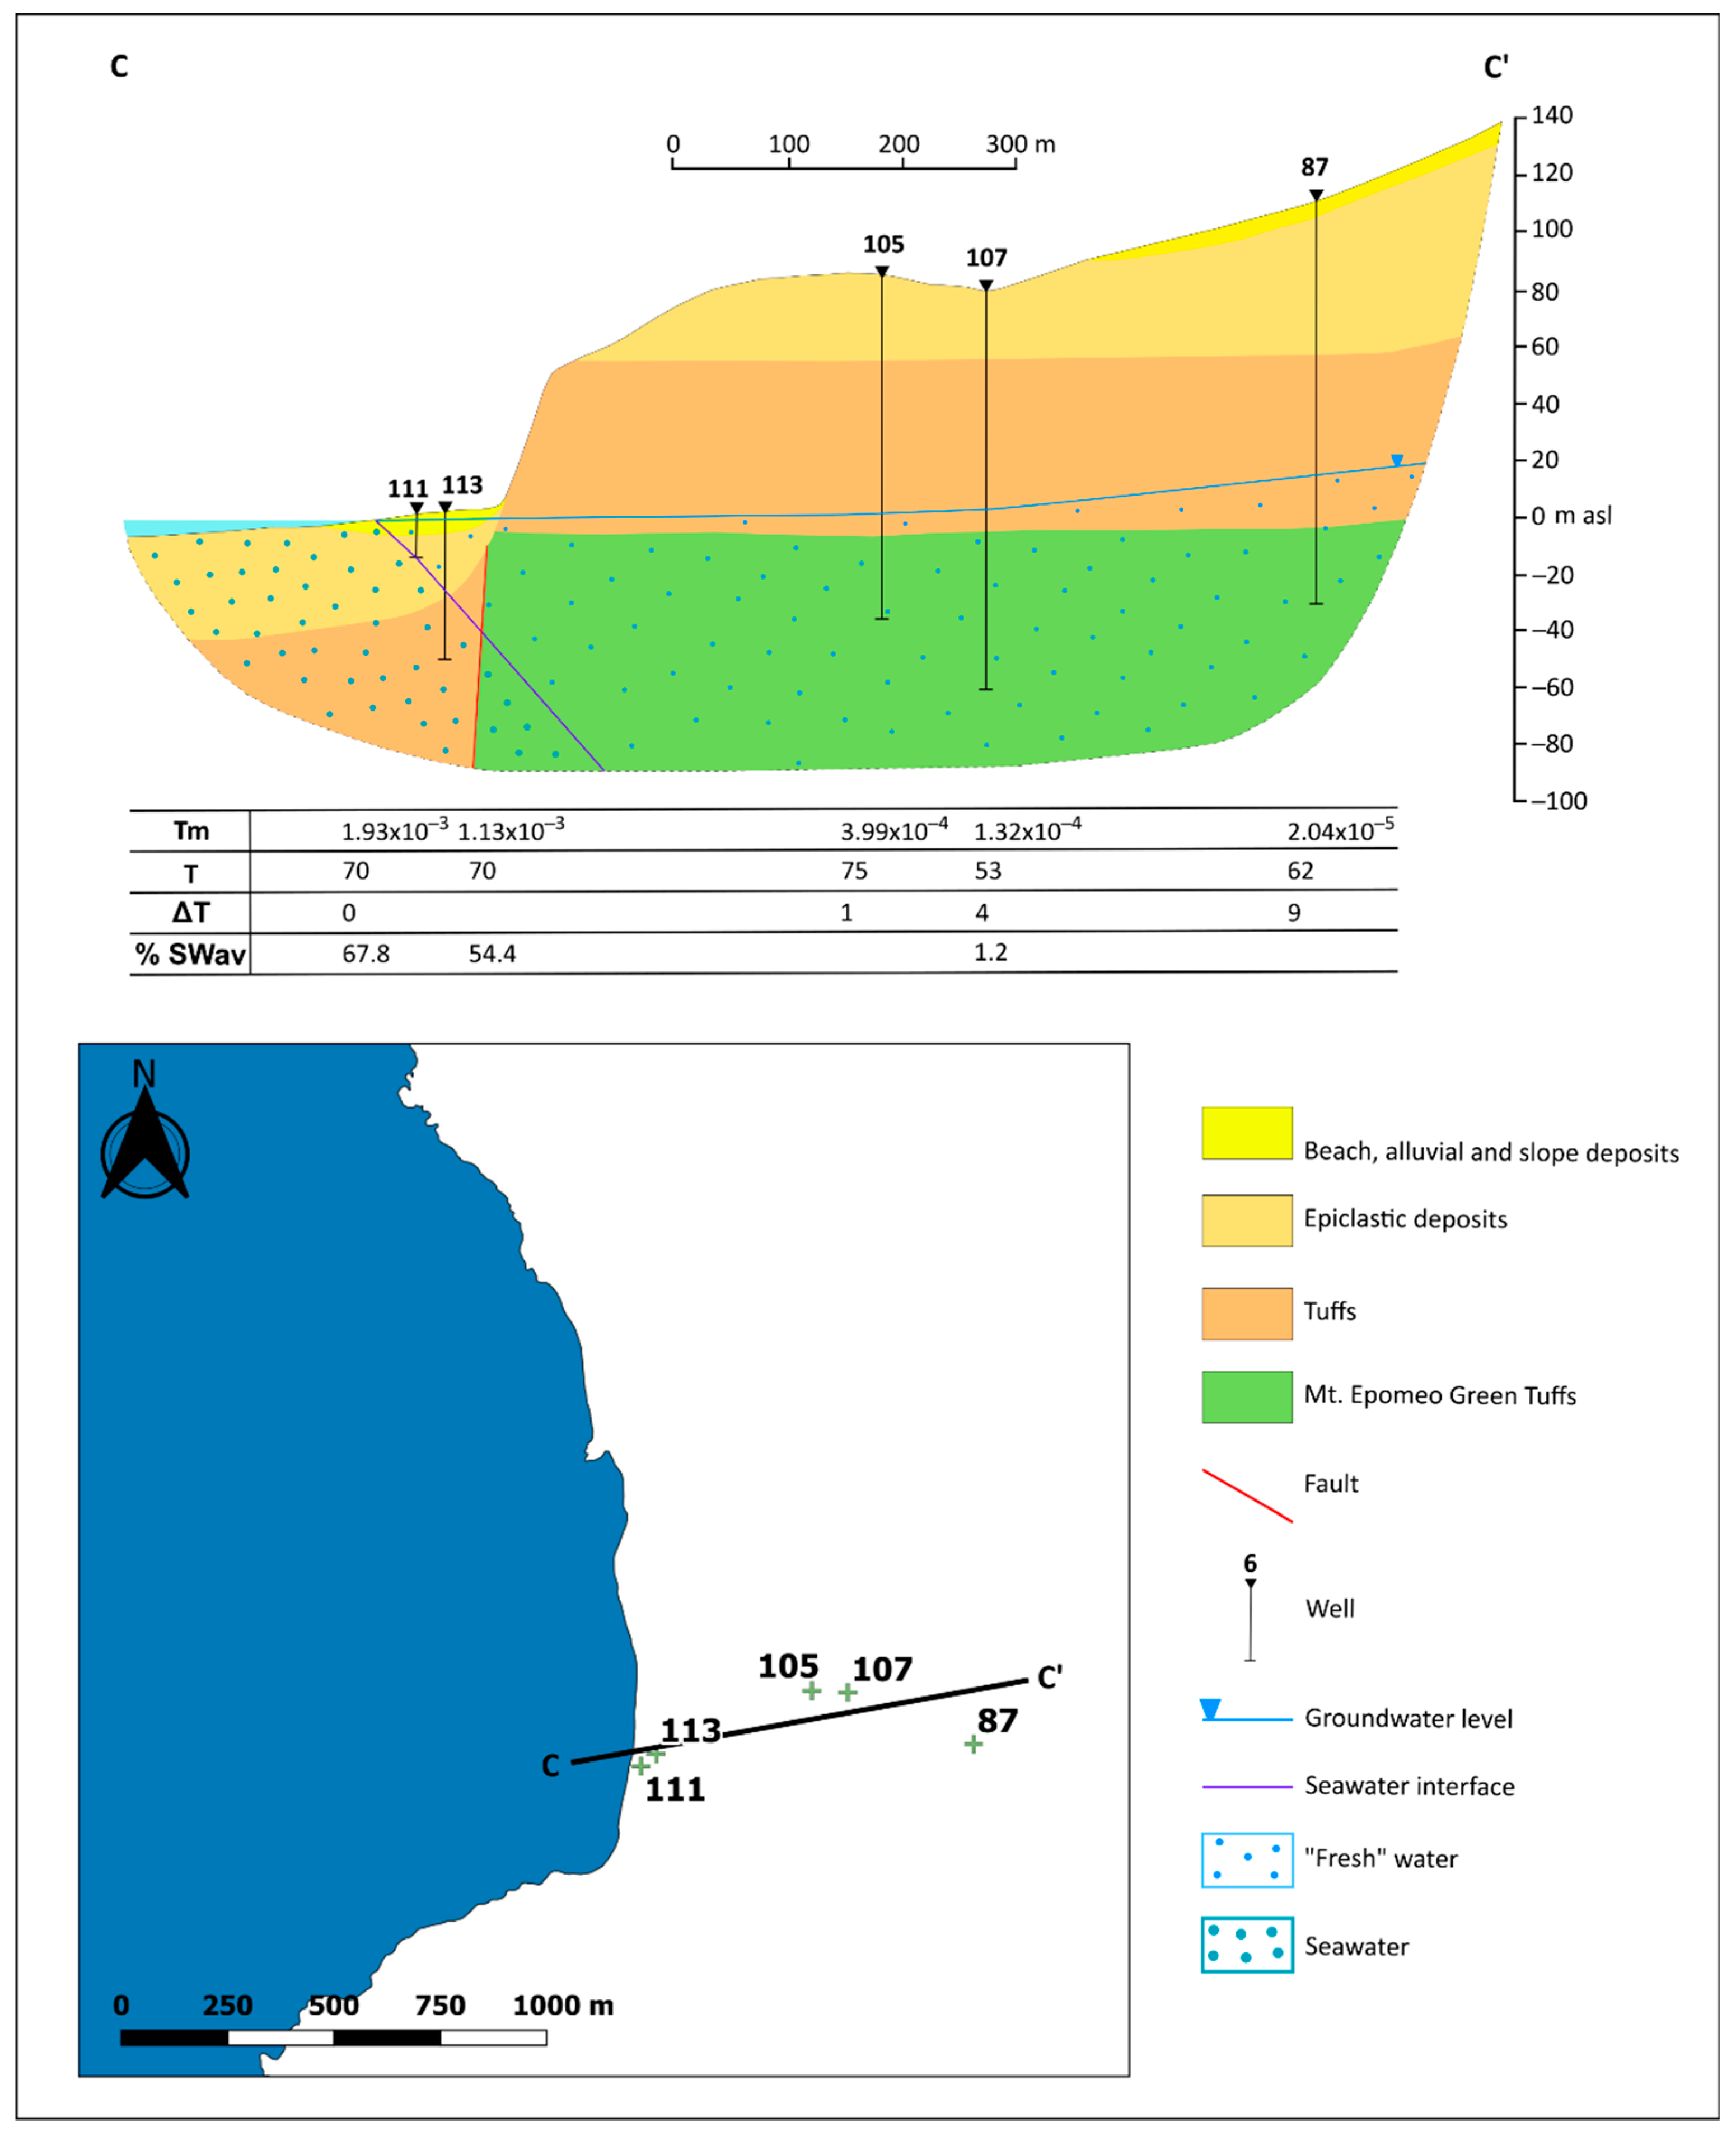
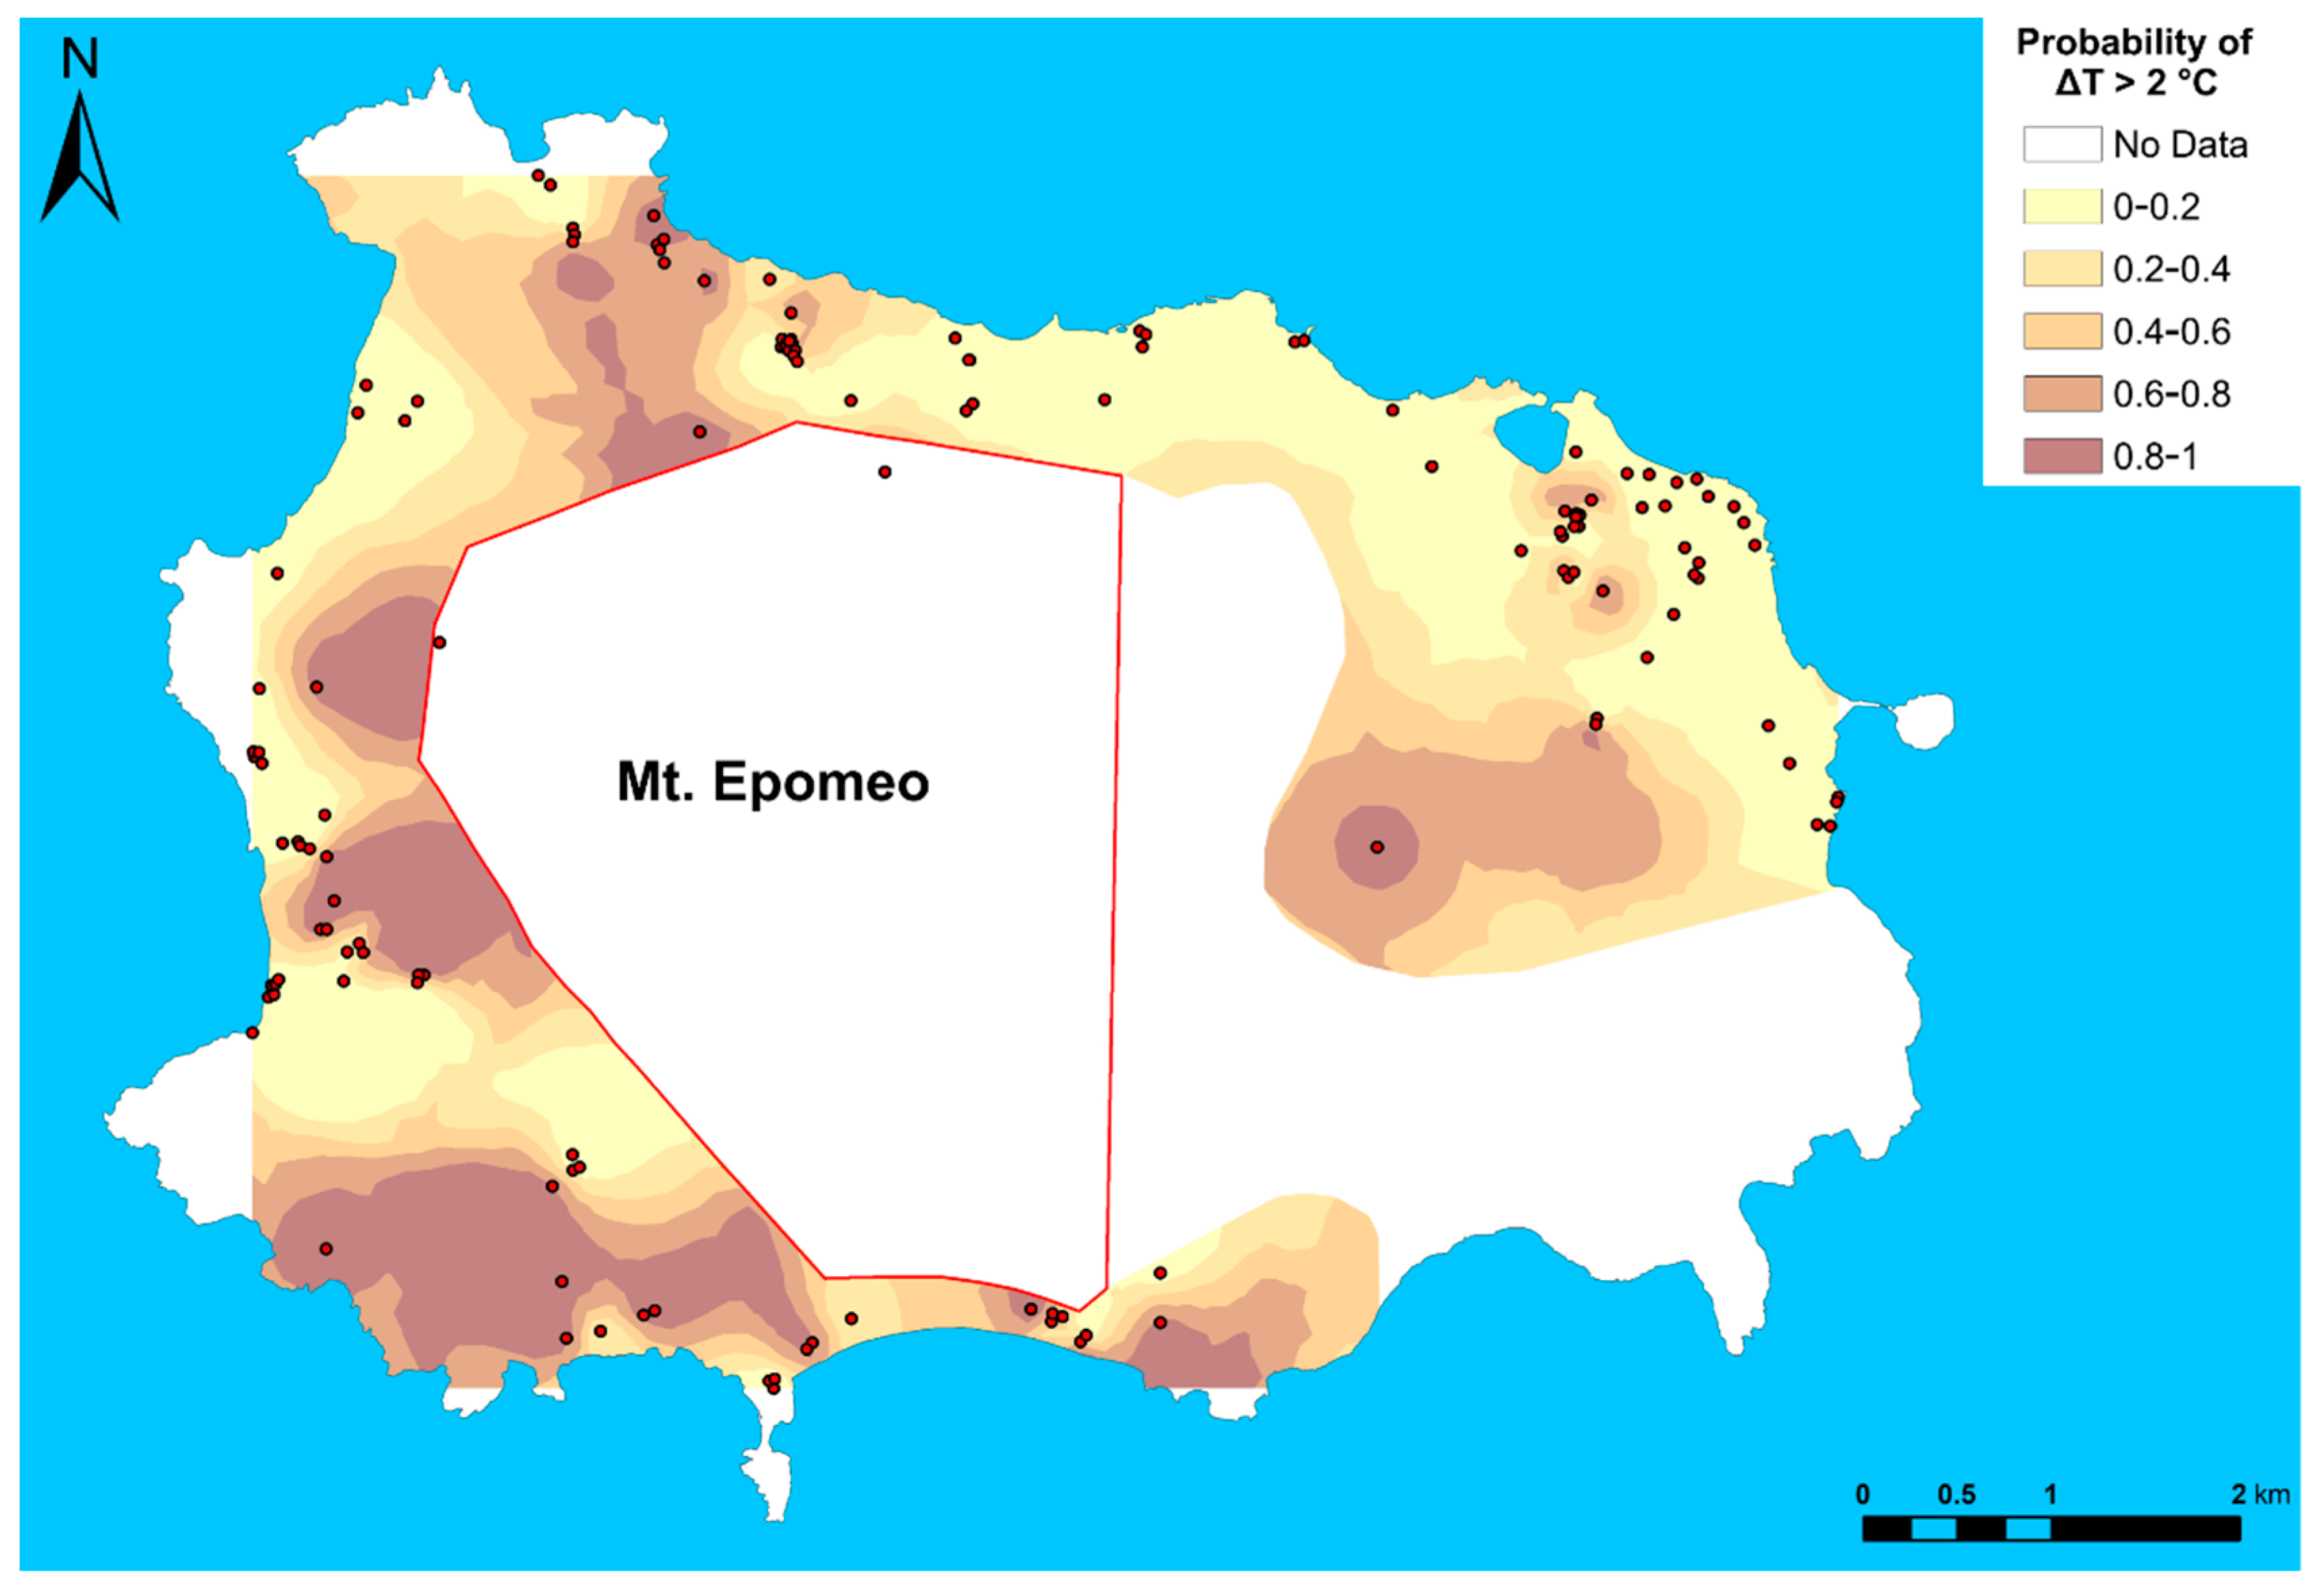
For the innermost wells of the island, the parameter that shows a higher variability during the sampling period 2006–2019 is the water temperature (wells 89, 107, and 133 in Figure 12). These wells are located in one of the areas of the island (Figure 3) characterized by a more active hydrothermal circulation which is reflected in the highest groundwater temperatures and a widespread presence of fumarole fields [3,4,5,6]. In this area, but also in the other north-western, western, and southern sectors of the island characterized by the similar hydrothermal conditions, the highest increases in water temperature during pumping have been found (Figure 8 and Figure 9), and in some cases even the rise in the piezometric level in the last stages of pumping (Figure 8). In these areas the transmissivity values are low (Figure 6 and Figure 7) and often an unsteady response of drawdown was found during pumping. These conditions can explain the temperature variations of the water captured by the wells, which are related to an increase of upwelling of deep hydrothermal fluids during pumping. In this case, neighboring wells show differences in the variations of water temperature during pumping, which depend on the local transmissivity of the aquifer, the depth of the well, and, generally, on the complex volcano-tectonic setting of these areas (Figure 1). An example of the different hydrogeological conditions moving from the coast to the innermost areas of the island, as well as of related impacts on the quality of the groundwater captured by the wells, is shown in the cross-section of Figure 14.
Wells that showed insignificant changes in water quality during the monitoring period (wells 2, 3, 8, 108, 113, and 150 in Table S4) are characterized by a low operating flow (lower than 4 L/s), a piezometric level in static conditions higher than 0.8 m asl and a transmissivity generally higher than 5 × 10⁻⁴ m2/s.
General criteria for the sustainable management of the island’s thermal waters can be drafted from the results of the study.
In coastal areas, to maintain the quality of the thermal waters over time, the flow rate to be granted to each thermal centers should take into account the local transmissivity of the aquifer, defining the depth of the wells in relation to the local stratigraphy, distance from the coast and between neighboring wells. In the innermost areas of the island, the flow rate and duration of the pumping from each well should be defined by not exceeding a threshold of drawdown, especially in areas with low transmissivity. This is necessary to prevent the increase of the ascent of the deep fluids, which can determine changes in the quality of water extracted from wells.
The implementation of the proposed approach can be achieved through a participated management advised by decision-support modeling [44,45,46]. This modeling should be focused on the search of an equilibrium point between profit maximization of thermal waters and their conservation. The knowledge of the relationship between response to pumping and quality of the extracted water from wells presented in this study represents key points to be considered in the overall decision-making process. The sustainable management of hydrothermal resources needs to rely on the local results of pumping tests with monitoring of drawdown, temperature, and salinity of the extracted water. The concomitant analysis of these three indicators is effective to define the sustainable yield of the single well.

6. Conclusions

This study examined the response to pumping of the volcanic aquifer of the Island of Ischia, an active hydrothermal system where numerous spas extract thermal waters that are significantly different in temperature, salinity, and chemical compositions.
The stratigraphic and volcano-tectonic complexity of the island determines a remarkable hydraulic heterogeneity. Consequently, the quality of groundwater extracted from the wells depends not only on natural phenomena (meteoric recharge, seawater intrusion, and rising of deep hydrothermal fluids) but also on the island sector where groundwater is pumped from and on the pumping method. The distance of the wells from the coast, the type of aquifer formation intersected by the wells, and the field of groundwater temperature of the hydrothermal system are the factors that most affect the aquifer pumping response, determining the quality of water extracted from wells and its variation over time.
In the case study, more than in other hydrothermal systems, techniques, and regimes of groundwater withdrawals should dynamically adapt to the local response of the aquifer to pumping. The concomitant analysis of drawdown, water temperature, and salinity during pumping, associated with decision-support modeling, turns out to be a valuable tool to define the sustainable yield of the single well.

Supplementary Materials

The following are available online at https://www.mdpi.com/2073-4441/12/9/2576/s1, Figure S1: Known location of the wells and springs supplying the island’s spas; Figure S2: Frequency and Q-Q plot of the specific capacity; Figure S3: Log-log plot of Td versus Tr for tests that showed unsteady-state condition; Figure S4: Frequency and Q-Q plot of transmissivity; Figure S5: Saturated thickness of the aquifer versus transmissivity; Figure S6: Water temperature at beginning of test versus temperature change during pumping; Figure S7: Temperature change during pumping versus well depth; Figure S8: Temperature change during pumping versus transmissivity; Table S1: Statistics of specific capacity (SC) values in m2/s; Table S2: Hydrogeological parameters obtained from tests performed with an observation well; Table S3: Statistics of transmissivity values in m2/s; Table S4: Chemical composition of the waters of selected wells tested.

Author Contributions

Conceptualization, V.P.; methodology, V.P., F.L. and M.T.; investigation, F.F., L.L., L.P. and M.T.; data curation, F.F., L.L. and L.P.; writing—original draft preparation, V.P.; writing—review and editing, V.P. and F.L.; funding acquisition, V.P. All authors have read and agreed to the published version of the manuscript.

Funding

This research received no external funding.

Acknowledgments

The authors gratefully thank Paola Arduino for the revision of English and Associazione Termalisti Isola d’Ischia for the support provided in the investigation. The authors are also grateful to the four anonymous reviewers for their valuable comments and suggestions.

Conflicts of Interest

The authors declare no conflict of interest.

References

  1. Monti, S. Thermalism between past and future. In Proceedings of the Conference “The Cultural Turn in Geography”, Gorizia, Italy, 18–20 September 2003; EUT Edizioni Università di Trieste: Trieste, Italy; pp. 305–312. [Google Scholar]
  2. Piscopo, V.; Lotti, F.; Formica, F.; Lana, L.; Pianese, L. Groundwater flow in the Ischia volcanic island (Italy) and its implications for thermal water abstraction. Hydrogeol. J. 2019, 28, 579–601. [Google Scholar] [CrossRef]
  3. De Gennaro, M.; Ferreri, M.; Ghiara, M.R.; Stanzione, D. Geochemistry of thermal waters on the Island of Ischia (Campania, Italy). Geothermics 1984, 13, 361–374. [Google Scholar] [CrossRef]
  4. Panichi, C.; Bolognesi, L.; Ghiara, M.R.; Noto, P.; Stanzione, D. Geothermal assessment of the Island of Ischia (southern Italy) from isotopic and chemical composition of the delivered fluids. J. Volcanol. Geotherm. Res. 1992, 49, 329–348. [Google Scholar] [CrossRef]
  5. Aiuppa, A.; Avino, R.; Brusca, L.; Caliro, S.; Chiodini, G.; D’Alessandro, W.; Favara, R.; Federico, C.; Ginevra, W.; Inguaggiato, S.; et al. Mineral control of arsenic content in thermal waters from volcano-hosted hydrothermal systems: Insights from Island of Ischia and Phlegrean Fields (Campanian Volcanic Province, Italy). Chem. Geol. 2006, 229, 313–330. [Google Scholar] [CrossRef]
  6. Di Napoli, R.; Aiuppa, A.; Bellomo, S.; Brusca, L.; D’Alessandro, W.; Candela, E.G.; Longo, M.; Pecoraino, G.; Valenza, M.; Giovannella, P. A model for Ischia hydrothermal system: Evidences from the chemistry of thermal groundwaters. J. Volcanol. Geotherm. Res. 2009, 186, 133–159. [Google Scholar] [CrossRef]
  7. Vezzoli, L. Island of Ischia; CNR Quaderni de La Ricerca Scientifica 114: Roma, Italy, 1988. [Google Scholar]
  8. Crisci, G.M.; De Francesco, A.; Mazzuoli, R.; Poli, G.; Stanzione, D. Geochemistry of recent volcanics of Ischia Island, Italy: Evidences for fractional crystallization and magma mixing. Chem. Geol. 1989, 78, 15–33. [Google Scholar] [CrossRef]
  9. Civetta, L.; Gallo, G.; Orsi, G. Sr- and Nd-isotope and trace-element constraints on the chemical evolution of the magmatic system of Ischia (Italy) in the last 55 ka. J. Volcanol. Geotherm. Res. 1991, 46, 213–230. [Google Scholar] [CrossRef]
  10. De Vita, S.; Sansivero, F.; Orsi, G.; Marotta, E. Cyclical slope instability and volcanism related to volcano-tectonism in resurgent calderas: The Ischia island (Italy) case study. Eng. Geol. 2006, 86, 148–165. [Google Scholar] [CrossRef]
  11. Sbrana, A.; Toccaceli, R.M. Carta Geologica dell’Isola d’Ischia con note illustrative scala 1:10000; Regione Campania: Napoli, Italy, 2011. [Google Scholar]
  12. Della Seta, M.; Marotta, E.; Orsi, G.; De Vita, S.; Sansivero, F.; Fredi, P. Slope instability induced by volcano-tectonics as an additional source of hazard in active volcanic areas: The case of Ischia Island (Italy). Bull. Volcanol. 2011, 74, 79–106. [Google Scholar] [CrossRef]
  13. Orsi, G.; Gallo, G.; Zanchi, A. Simple-shearing block resurgence in caldera depressions. A model from Pantelleria and Ischia. J. Volcanol. Geotherm. Res. 1991, 47, 1–11. [Google Scholar] [CrossRef]
  14. Acocella, V.; Funiciello, R. The interaction between regional and local tectonics during resurgent doming: The case of the Island of Ischia, Italy. J. Volcanol. Geotherm. Res. 1999, 88, 109–123. [Google Scholar] [CrossRef]
  15. Molin, P.; Acocella, V.; Funiciello, R. Structural, seismic and hydrothermal features at the border of an active intermittent resurgent block: Ischia Island (Italy). J. Volcanol. Geotherm. Res. 2003, 121, 65–81. [Google Scholar] [CrossRef]
  16. Tibaldi, A.; Vezzoli, L. A new type of volcano flank failure: The resurgent caldera sector collapse, Ischia, Italy. Geophys. Res. Lett. 2004, 31, 14605. [Google Scholar] [CrossRef]
  17. Paoletti, V.; Di Maio, R.; Cella, F.; Florio, G.; Motschka, K.; Roberti, N.; Secomandi, M.; Supper, R.; Fedi, M.; Rapolla, A. The Ischia volcanic island (Southern Italy): Inferences from potential field data interpretation. J. Volcanol. Geotherm. Res. 2009, 179, 69–86. [Google Scholar] [CrossRef]
  18. Carlino, S. The process of resurgence for Ischia Island (southern Italy) since 55 ka: The laccolith model and implications for eruption forecasting. Bull. Volcanol. 2012, 74, 947–961. [Google Scholar] [CrossRef]
  19. Carlino, S.; Somma, R.; Troiano, A.; Di Giuseppe, M.; Troise, C.; De Natale, G. The geothermal system of Ischia Island (southern Italy): Critical review and sustainability analysis of geothermal resource for electricity generation. Renew. Energy 2014, 62, 177–196. [Google Scholar] [CrossRef]
  20. Carapezza, M.; Hauser, S.; Parello, F.; Scelsi, E.; Valenza, M.; Favara, R.; Guerrieri, S. Preliminary studies on the geothermal fluids of the Island of Ischia: Gas geochemistry. Rend. Soc. Ital. Mineral. Petrol. 1988, 43, 967–974. [Google Scholar]
  21. Tedesco, D. Chemical and isotopic investigations of fumarolic gases from Ischia island (southern Italy): Evidences of magmatic and crustal contribution. J. Volcanol. Geotherm. Res. 1996, 74, 233–242. [Google Scholar] [CrossRef]
  22. Caliro, S.; Panichi, C.; Stanzione, D. Variation in the total dissolved carbon isotope composition of thermal waters of the Island of Ischia (Italy) and its implications for volcanic surveillance. J. Volcanol. Geotherm. Res. 1999, 90, 219–240. [Google Scholar] [CrossRef]
  23. Inguaggiato, S.; Pecoraino, G.; D’Amore, F.; Giovannella, P. Chemical and isotopical characterisation of fluid manifestations of Ischia Island (Italy). J. Volcanol. Geotherm. Res. 2000, 99, 151–178. [Google Scholar] [CrossRef]
  24. Chiodini, G.; Avino, R.; Brombach, T.; Caliro, S.; Cardellini, C.; De Vita, S.; Frondini, F.; Granieri, D.; Marotta, E.; Ventura, G. Fumarolic and diffuse soil degassing west of Mount Epomeo, Ischia, Italy. J. Volcanol. Geotherm. Res. 2004, 133, 291–309. [Google Scholar] [CrossRef]
  25. Celico, P.; Stanzione, D.; Esposito, L.; Formica, F.; Piscopo, V.; De Rosa, B.M. La complessità idrogeologica di un’area vulcanica attiva: L’Isola d’Ischia (Napoli-Campania). Boll. Soc. Geol. It. 1999, 118, 485–504. [Google Scholar]
  26. Theis, C.V. The relation between the lowering of the piezometric surface and the rate and duration of discharge of a well using ground-water storage. Trans. Am. Geophys. Union 1935, 16, 519–524. [Google Scholar] [CrossRef]
  27. Cooper, H.H.; Jacob, C.E. A generalized graphical method for evaluating formation constants and summarizing well-field history. Trans. Am. Geophys. Union 1946, 27, 526–534. [Google Scholar] [CrossRef]
  28. Birsoy, Y.K.; Summers, W.K. Determination of Aquifer Parameters from Step Tests and Intermittent Pumping Data. Ground Water 1980, 18, 137–146. [Google Scholar] [CrossRef]
  29. Thiem, G. Hydrologische Methoden; Gebhardt: Leipzig, Germany, 1906. [Google Scholar]
  30. Herzberg, B. Die Wasserversorgung einiger Nordseebäder. J. Gasbeleuchtung Wasserversorg 1901, 44, 815–844. [Google Scholar]
  31. Appelo, C.A.J.; Postma, D. Geochemistry: Groundwater and Pollution; Balkema: Rotterdam, The Netherlands, 1996. [Google Scholar]
  32. Armstrong, M.; Matheron, G. Disjunctive kriging revisited: Part I. Math. Geol. 1986, 18, 711–728. [Google Scholar] [CrossRef]
  33. Armstrong, M.; Matheron, G. Disjunctive kriging revisited: Part II. Math. Geol. 1986, 18, 729–742. [Google Scholar] [CrossRef]
  34. Matheron, G. A Simple Substitute for Conditional Expectation: The Disjunctive Kriging. In Advanced Geostatistics in the Mining Industry; Springer Science and Business Media LLC: Cham, Switzerland, 1976; pp. 221–236. [Google Scholar]
  35. Rivoirard, J. Introduction to Disjunctive Kriging and Non-Linear Geostatistics; Oxford University Press: New York, NY, USA, 1994. [Google Scholar]
  36. Journel, A.G. Nonparametric estimation of spatial distributions. Math. Geol. 1983, 15, 445–468. [Google Scholar] [CrossRef]
  37. Goovaerts, P. Comparative performance of indicator algorithms for modeling conditional probability distribution functions. Math. Geol. 1994, 26, 389–411. [Google Scholar] [CrossRef]
  38. Sharqawy, M.H.; Lienhard, J.H.; Zubair, S.M. Thermophysical properties of seawater: A review of existing correlations and data. Desalination Water Treat. 2010, 16, 354–380. [Google Scholar] [CrossRef]
  39. Alcalá, F.J.; Custodio, E. Using the Cl/Br ratio as traces to identify the origin of salinity in aquifers in Spain and Portugal. J. Hydrol. 2008, 359, 189–207. [Google Scholar] [CrossRef]
  40. Custodio, E. Groundwater in volcanic hard rocks. In Groundwater in Fractured Rocks; Taylor & Francis Balkema: Leiden, The Netherlands, 2007; pp. 95–108. [Google Scholar]
  41. Jalludin, M.; Razack, M. Assessment of hydraulic properties of sedimentary and volcanic aquifer systems under arid conditions in the Republic of Djibouti (Horn of Africa). Hydrogeol. J. 2004, 12, 159–170. [Google Scholar] [CrossRef]
  42. Hamm, S.-Y.; Cheong, J.-Y.; Jang, S.; Jung, C.-Y.; Kim, B.-S. Relationship between transmissivity and specific capacity in the volcanic aquifers of Jeju Island, Korea. J. Hydrol. 2005, 310, 111–121. [Google Scholar] [CrossRef]
  43. Baye, A.Y.; Razack, M.; Ayenew, T.; Zemedagegnehu, E. Estimating transmissivity using empirical and geostatistical methods in the volcanic aquifers of Upper Awash Basin, central Ethiopia. Environ. Earth Sci. 2012, 69, 1791–1802. [Google Scholar] [CrossRef]
  44. Freeze, R.A.; Massmann, J.; Smith, L.; Sperling, T.; James, B. Hydrogeological decision analysis I: A framework. Groundwater 1990, 28, 738–766. [Google Scholar] [CrossRef]
  45. Doherty, J.; Simmons, C.T. Groundwater modelling in decision support: Reflections on a unified conceptual framework. Hydrogeol. J. 2013, 21, 1531–1537. [Google Scholar] [CrossRef]
  46. Doherty, J.; Moore, C.R. Decision Support Modeling: Data Assimilation, Uncertainty Quantification, and Strategic Abstraction. Ground Water 2019, 58, 327–337. [Google Scholar] [CrossRef] [Green Version]
Figure 1. The geological and hydrogeological framework of the Island of Ischia. (a) Simplified geological map (surface geology from [11], structural lineaments from [12]): (1) landslide and reworked pyroclastic deposits, (2) pyroclastic deposits and lavas (<18 ka), (3) pyroclastic fall deposits, tuffs, and lavas (33–18 ka), (4) tuffs and pyroclastic fall deposits (55–18 ka), (5) marine epiclastic deposits, (6) Mt. Epomeo Green Tuff (75–55 ka), (7) lavas and pyroclastic deposits (>75 ka), (8) fault, (9) fumarole field, (10) caldera rim, (11) resurgent area, (12) elevation in m asl. (b) Simplified hydrogeological map (from [2]).
Water 12 02576 g001
Figure 2. Simplified diagram of the stratigraphy of the island (modified from [11]): (1) lava flows, lava domes, breccias, and scoriae, (2) pumices, scoriae, bombs, and ashes, (3) marine sands and silty sands, (4) debris flow and mudflow deposits, (5) ash tuffs, (6) epiclastic deposits and marine sediments, (7) ash-flow tuffs, ashy and pumiceous tuffs (Mt. Epomeo Green Tuff Auctt., pro parte), (8) fault, (9) unconformity.
Water 12 02576 g002
Figure 3. Location of investigated wells (the boxes show the different areas of the island of the other thematic maps: (a) N area, (b) NE area, (c) W area, (d) SW area). Legend: (1) pumping test wells, (2) pumping tests wells with chemical analysis, (3) pumping test wells with logs (temperature and/or electrical conductivity), (4) pumping test wells with logs and chemical analysis, (5) reference number of wells mentioned in the text, (6) aquifer boundary of the central block of Mt. Epomeo.
Water 12 02576 g003
Figure 4. Log-log plot of specific capacity (SC) versus the recovery test (Tr) for tests that showed steady-state condition.
Water 12 02576 g004
Figure 5. Box-and-whisker diagrams of the log-transformed values of specific capacity (a) and transmissivity (b) for the different types of aquifer formation (for the abbreviations see the text).
Water 12 02576 g005
Figure 6. Distribution of wells with associated value of transmissivity and type of aquifer formation (for the abbreviations see the text, GT: Green Tuff of the central block of Mt. Epomeo): (a) N area, (b) NE area, (c) W area, (d) SW area.
Water 12 02576 g006
Figure 7. Map of transmissivity estimated with Disjunctive Kriging.
Water 12 02576 g007
Figure 8. Water temperature (in °C) during pumping tests, (a) N area, (b) NE area, (c) W area, (d) SW area: (1) wells tested, (2) temperature at the beginning of the test, (3) increase or decrease (negative values) in temperature during the test, (4) wells that showed a rise of the groundwater level during pumping, (5) aquifer boundary of the central block of Mt. Epomeo.
Water 12 02576 g008
Figure 9. Probability of finding an increase in water temperature (ΔT) during pumping higher than 2 °C, estimated with Indicator Kriging.
Water 12 02576 g009
Figure 10. Depth of the seawater interface below ground level (gl) for some wells located near the coast line: values measured by means of temperature and electrical conductivity logs versus values calculated by the Ghyben–Herzberg formula (GH).
Water 12 02576 g010
Figure 11. Piper diagram of water samples from wells.
Water 12 02576 g011
Figure 12. Variation of selected indicators of the quality of the thermal waters of some wells over the period 2006–2019: (a) TDS, (b) temperature (T), (c) Na/Cl, (d) Mg/Cl, and (e) Cl/Br ratios.
Water 12 02576 g012
Figure 13. Hydrogeological cross-sections A-A’ and B-B’ (Tm: transmissivity in m2/s; T: water temperature in °C; ΔT: increase of water temperature during pumping in °C; %SWav: average percentage of seawater).
Water 12 02576 g013
Figure 14. Hydrogeological cross-section C-C’ (Tm: transmissivity in m2/s; T: water temperature in °C; ΔT: increase of water temperature during pumping in °C; %SWav: average percentage of seawater).
Water 12 02576 g014
Table 1. Main characteristics of the tested wells.
CharacteristicsNumberMinMaxMeanSDMedianMode
Wells elevation (m asl)1442200
Wells depth (m)105324577.959.36050
Water level elevation (m asl)1440.1764.410.31.21
Thickness of saturated aquifer (m)101117030.331.83015
Operating flow rate of wells (L/s)1400.3103.31.933
Table 2. Average percentage of seawater (%SWav) and standard deviation (SD) in sampled waters.
WellCount%SWavSDWellCount%SWavSD
1494.62.055672.220.0
249.91.98948.43.2
3310.81.710731.21.0
4515.08.2108393.01.8
549.40.3111367.84.0
6725.316.2113354.46.2
7410.81.0114475.05.5
8331.10.413330.10.1
9483.71.6150335.42.8
13396.83.6153419.04.3
54559.331.1

