Abstract
In recent years, precipitation patterns in Korea have shifted to be characterized as short and intense rainfalls. In consideration of shallow landslide initiations primarily governed by heavy rainfalls at short-time scales that diminish drainage effects, the concept of critical continuous rainfall is proposed as a single-rainfall-variable threshold for shallow landslide forecasting. To generate a critical continuous rainfall map for hillslope areas in a city of Korea (Busan), this study designed and applied a systematic modeling process. As a preparatory stage, input datasets of geo-hydraulic properties and geotechnical properties were assembled using estimation techniques based on experiment data of field samples. The inherent and fixed critical continuous rainfall values for hillslope areas in Busan were derived through one-dimensional infiltration analysis coupled with infinite slope stability calculations. As a result of a detailed analysis of historical rainfall records in a case study area over a period of 11 years, three false forecasting cases were recorded, whereas all landslide-triggering rainfall events were correctly captured with no missed forecasting cases. The results of the case study indicate that the proposed critical continuous rainfall may be useful as an effective and straightforward indicator for forecasting the initiation of shallow landslides.
1. Introduction
Numerous sources have reported that precipitation patterns during wet seasons (or summer seasons) in Korea began exhibiting changing trends since the end of the 1990s or the beginning of the 2000s [1,2,3,4]. In particular, various researchers investigated the increasing trends in the frequency and intensity of heavy rainfalls [5,6,7]. Such climatic movements are consistent with the period in which shallow landslide and debris flow typologies began to be widely diffused, which resulted in the substantial rise in landslide-damaged areas and related recovery costs [8]. As illustrated in Figure 1, the clearly discernable differences between the two groups of cumulative rainfall patterns exemplify the changing climatic trends of Korea. The two groups of rainfalls resulted in notable landslide event occurrences in 2002 and 2009, respectively. Although both landslide events took place in the same city in Korea (Busan) with the same geological conditions, the two events exhibited completely different landslide kinematics to each other due to the differences in rainfall patterns. More specifically, deep-seated and rotational failures were triggered by prolonged and progressively increasing cumulative rainfalls in 2002, whereas the 2009 event involved abundant rapid shallow landslides and debris flows that were initiated by heavy rainfalls concentrated within the final 6–30 h before occurrences of landslides. In the wake of such shifting circumstances, the importance of landslide forecasting (or early warning) technologies that take into account the aforementioned short and intense rainfall trends is becoming increasingly highlighted.
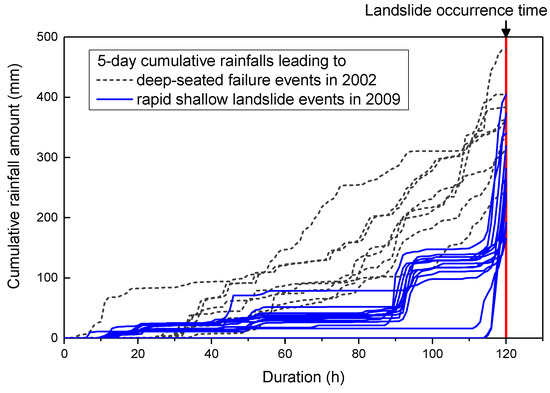
Figure 1.
Difference in precipitation patterns between 2002 and 2009: comparison of five-day cumulative rainfalls leading to landslide occurrences in Busan, Korea.
Over the past few decades, research on physically based landslide modeling in response to rainfall has seen substantial advancements, and numerous sophisticated landslide models have been devised and suggested [9,10,11,12,13,14,15,16]. However, at the level of early warnings, the degree of sophistication is bound to prompt tradeoffs to avoid excessive computational loads, which often leads to limited areal scales, spatial resolutions, or update frequencies of the available warning information [8,10,14].
Alternatively, a computationally light approach involves calibrating critical conditions (or thresholds) of hydro-meteorological variables for landslide initiations based on either historical data or physically based modeling. For instance, rainfall intensity–duration curves [17,18,19], cumulative rainfall curves in relation to duration [20,21], and in some cases, thresholds regarding soil water storage levels or soil moisture in relation to net rainfall [22,23,24], are all empirically derived based on historical records. As these empirical thresholds do not require resource-intensive analyses, they have been preferred and have seen widespread implementation for landslide forecasting at regional scales. However, it is not possible to derive empirical thresholds for areas with lacking historical landslide databases. Moreover, predictions using such thresholds are spatially coarse as they do not consider spatially varying geophysical factors. On the other hand, some groups of researchers [25,26,27,28,29,30,31] proposed the concept of deterministic rainfall intensity-duration curves inversely derived from transient, one-dimensional (1-D) infiltration models coupled with infinite slope stability calculations. Because such deterministic intensity–duration curves can be defined independently for each slope, spatially localized landslide forecasting is possible. However, it is questionable whether such site-specific thresholds of multiple rainfall variables (i.e., intensity and duration) can effectively function as straightforward indicators forecasting landslide occurrences at regional scales.
In this study, the concept of critical continuous rainfall (hereafter referred to as CRCritical) is proposed as a physically based single-rainfall-variable threshold for the initiation of shallow landslides. Considering the recent climatic trends characterized by localized rainfall of greater intensities at short-term scales, the validity of definitions and modeling assumptions of CRCritical for Korean geological conditions are meticulously addressed. Based on the established definitions, a three-stage systematic modeling process is delineated to generate a geographic information system (GIS)-based map of CRCritical amounts for the hillslope areas of Busan. The first stage involves the setup of geo-hydraulic, geotechnical, and geomorphological input data for the entire hillslope area of Busan using estimation techniques as primary methods. In the first of the two following consecutive analysis stages, 1-D infiltration analysis is conducted to compute the suction stress term in the generalized effective stress equation proposed by Lu and Likos [32] in relation to the cumulated continuous rainfall amount. Subsequently, infinite slope stability calculations that plug in the obtained suction stresses are conducted to finally derive the inherent and fixed CRCritical values. To test the effectiveness of CRCritical as a shallow landslide forecasting threshold, an 11-year case study was conducted for the two mountainous areas within Busan where the largest number of landslide damages have been reported in the past. By conducting a detailed analysis of historical rainfall records that resulted in landslide events with/without forecasting as well as false forecasting cases, the relevance and effectiveness of CRCritical are discussed. Moreover, possible limitations and the potential for future updates are deliberated in the concluding discussion.
2. Methodology
2.1. Definition of Critical Continuous Rainfall
From the viewpoint of rainfall as an index of slope moisture conditions that may lead to the initiation of landslides, the continuity of two individual rainfalls can be understood as the scenario in which two consecutive rainfalls contribute to the continuous increase in moisturization of potential slip surfaces in slopes. In other words, the discontinuity of two rainfalls depends on whether the intervening non-rainfall time is long enough to allow slopes to recover their initial moisture conditions primarily through drainage processes. As the capacity of soils to retain and drain water is determined by unsaturated soil characteristics such as hydraulic conductivity and soil-water characteristic curves, the minimum non-rainfall period required to terminate a continuous rainfall event will vary according to the geo-hydraulic conditions of the slopes being examined. This idea is supported by Segoni et al.’s [33] statistical calibration results, where the optimal period of no rainfall that was used to define a rainfall threshold for landslide warnings varied according to the physical setting and hydrological properties of the test site. In terms of the geological conditions of Korea, weathered residual soils in hillslope areas can be represented by poorly or well graded sand according to the Unified Soil Classification System [6,34]. Based on this geological background, numerous previous studies that analyzed the relationship between rainfall characteristics and landslides in Korea set the minimum non-rainfall period as 24 h [35,36,37,38]. In addition, the well-qualified in situ monitoring results of Lee et al. [39], which measured matric suction in a natural slope, corroborates the relevance of the period of 24 h as the minimum duration required for the matric suction of a soil to return to its initial state following a sharp decrease due to rainfall infiltration during wet seasons. Based on this context, continuous rainfall was defined as cumulative rainfall that is counted before entering a non-rainfall period longer than 24 h. In other words, rainfall that is observed after a period of no rainfall for at least 24 h is considered as a separate event of continuous rainfall.
Furthermore, CRCritical is defined in this study as the minimum required amount of continuous rainfall for slopes to enter a phase of mechanical instability that may lead to the initiation of shallow landslides. This definition was motivated based on historical observations of the relation between continuous rainfall and landslides. Figure 2 compares the annual number of landslides recorded by the local government of Busan and the annual maximum continuous rainfall from 2009 to 2016. According to these plots, the two sets of data exhibited a generally proportional relationship. In particular, during years in which the annual maximum continuous rainfall amount exceeded 250 mm, more than 10 landslides were recorded. These observations give rise to the existence of a certain critical amount of continuous rainfall that triggers landslide initiations in Busan.
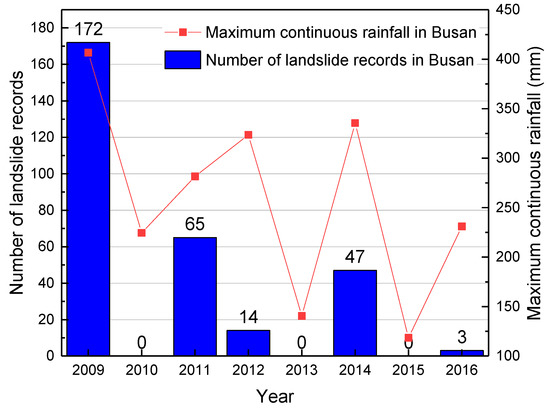
Figure 2.
Comparison of annual data on the number of landslides and maximum continuous rainfall.
Theoretically, the idea is plausible as shallow landslides, the most diffused landslide typology in Korea, are a type of movement principally governed by intense rainfalls concentrated in a short-time scale [40,41]. Short-time scales of intense rainfall that usually span several hours to a few days diminish the drainage effects of shallow soil depths overlying hillslope bedrocks. Therefore, slopes can be considered as water storage sites where infiltrated rain is temporarily retained and accumulated. Namely, the subsurface hydrology of slopes can be simply represented by 1-D vertical water flow processes. This reflection corroborates the validity of 1-D infiltration models that have been preferentially applied in the modeling of transient infinite slope stability [42]. Under these short-term conditions, if all of the rainfall is assumed to permeate the ground without being lost via surface runoff, the continuous rainfall amount directly represents the amount of infiltrated and retained water within slopes; hence, it can serve as an index for the degree of saturation and the instability of slopes. Furthermore, under this conservative assumption, the CRCritical can be considered as equivalent to a minimum required amount of water that needs to be accumulated in slopes to reach the limit of slope stability. Therefore, CRCritical is determined as a unique and fixed value for each slope depending on its geo-hydraulic, geotechnical, and geomorphological characteristics. As CRCritical is quantitatively derived through modeling based on the aforementioned assumptions, it is able to function as a conservative and straightforward threshold that only requires the calculation of a single rainfall variable from actual rainfall conditions—namely the continuous rainfall amount relative to the threshold—regardless of various combinations of other rainfall variables such as intensity and duration. In other words, various rainfall scenarios resulting in different probabilities of shallow landslides can be simplified using a single rainfall variable: continuous rainfall amount.
2.2. Modeling of Critical Continuous Rainfalls in Busan
Based on the definition established in Section 2.1, a systematic modeling process was designed to quantitatively derive CRCriticals for hillslope areas in Busan (Figure 3). As a preparatory stage for the following two consecutive analysis steps, various input datasets regarding geo-hydraulic, geotechnical, and geomorphological properties are assembled. This stage is based on various estimation methods that utilize lithologies and subsoil textures to cover the broad area of Busan. In the first analysis step, 1-D numerical analysis of steady flux infiltration is conducted to compute suction stresses (σs) on a potential sliding surface in relation to the cumulated continuous rainfall amounts. To avoid water loss via runoff, the steady flux rate is set lower than the minimum infiltration capacity of the soil (i.e., saturated hydraulic conductivity, ks). Infiltration analysis is conducted independently for each geo-hydraulic parameter dataset. In the second and final analysis step, infinite slope stability is analyzed in relation to the cumulated continuous rainfall amount by plugging in the suction stresses obtained from the previous analysis step. Ultimately, the minimum continuous rainfall amount resulting in a factor of safety (FOS) equal to or less than 1.3 is selected as the CRCritical amount for the slope being examined. The conservative FOS limit of 1.3 was selected in reference to Song et al.’s [43] review on the design standards of slopes suggested by the Korean and Japanese geotechnical societies. In the practical field of slope design, the minimum required FOS values for slopes to be considered stable are conservatively set as higher values than the theoretical FOS limit of stability of 1.0. This is due to conservative FOS limits being able to account for uncertainties in the designing data and conditions. In addition, the conservative FOS limit of 1.3 in this study may result in moderately lower CRCritical amounts than those derived from the theoretical FOS limit of 1.0, which ensures preemptive time for imminent landslide occurrences. Based on a Python- and GIS-based framework, a map is generated in which each of the millions of raster cells that constitute the hillslope areas of Busan is specified with an inherent and fixed CRCritical value.
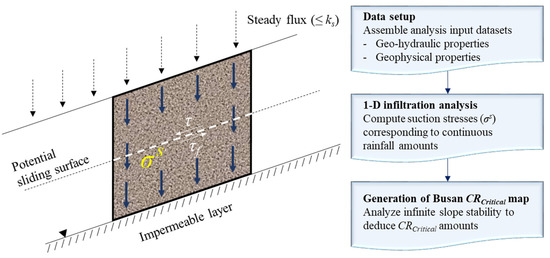
Figure 3.
Schematic diagram of the modeling process to develop a Busan critical continuous rainfall (CRCritical) map. 1-D: one-dimensional.
3. Data Setup
The derivation of CRCritical requires several important parameters, such as the geo-hydraulic characteristics of unsaturated soil, to conduct infiltration analysis, as well as the geotechnical and geomorphological parameters that are required to analyze slope stability. As we aimed to define CRCriticals for a regional-scale area (city) in this study, datasets of such parameters needed to be relevant to, and appropriate for, the area. However, it is impractical to develop datasets which have been verified through refined site investigations and laboratory tests for such a broad area. In fact, the issue of securing various geo-property data inputs has been reported as one of the limitations reducing the applicability of physically based landslide forecasting models at a regional scale [21]. Therefore, in this study, several estimation methods were adopted as alternatives when assembling the input datasets, with the overall structure and processes involved in dataset construction illustrated in Figure 4.
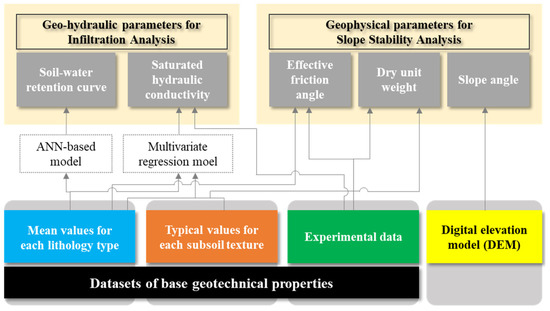
Figure 4.
Input dataset setup: structure and processes involved. ANN: artificial neural network.
Firstly, mean or typical values were adopted, representing several basic geotechnical properties for the various lithologies or subsoil texture types which constituted the mountainous areas of Busan. The values came from various domestic articles and national research reports, involved numerous sample sets and laboratory tests, and were considered to be suitably representative. Secondly, statistical estimation techniques were applied to derive data from geo-hydraulic parameters for infiltration analysis. The validity of applying typical values and estimation techniques in setting up geotechnical and hydraulic input parameter datasets in landslide modeling was previously examined and verified for Korean geological conditions in several studies, including Park et al. [44] and Vasu et al. [38]. Lastly, for areas with available laboratory and in situ soil experimental data from national research projects, experimental data was used instead of typical or estimated data values. Slope angle data were extracted from digital elevation models (DEM) with resolutions of 5 m. The systematic processes and database setup outcomes, established using the main construction steps referred to above, have been discussed further in the following subsections.
3.1. Base Geotechnical Properties
Busan’s mountainous areas have been divided into several regions using various features, as shown in Figure 5. The white areas in Figure 5a,b represent non-hillslope areas that were excluded from the analysis domain in this study. Firstly, information on hierarchical rock (lithology) categories, which form the basis of residual Busan soils, was sourced from a 1:50,000 geology map developed by the Korea Institute of Geoscience and Mineral Resources (KIGAM). Busan geology consists mainly of three types of parent rock: cretaceous volcanic (andesitic), cretaceous sedimentary, and plutonic rocks (from the last cretaceous period), and their distribution can be seen in Figure 5a. Kim [34] conducted various tests on soil samples that were collected from natural slopes in Busan (188 volcanic rock samples, 47 of plutonic rock, and 45 sedimentary rock samples). They then determined the material properties and engineering features of each lithology type, looking for correlations. The means of several geotechnical characteristics from each lithology type, including sand fractions, fine-grained soil (silt and clay) fractions, void ratios, effective friction angles, and in situ water contents, have been summarized in Table 1.
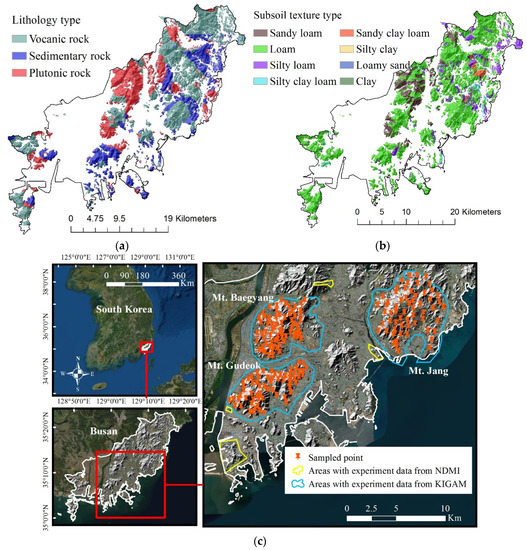
Figure 5.
Regional divisions of Busan’s mountainous areas based on (a) lithology, (b) subsoil texture, and (c) experimental data (shown together with location maps). NDMI: National Disaster Management Institute. KIGAM: Korea Institute of Geoscience and Mineral Resources.

Table 1.
Means of several geotechnical properties for each Busan lithology type (source: [34]).
Secondly, information on Busan subsoil textures was taken from a 1:25,000 forest soil map developed by the Korea Forest Service, with the subsoil layer being defined in the field of forestry as a soil layer below the topsoil. This means that the subsoil layer is located at depths > 0.5 m, which is also where shallow landslide failure mechanisms are generally found. As depicted in Figure 5b, there are eight subsoil texture types distributed throughout Busan, mostly as different forms of loam. In this study, subsoil texture type information was used to establish a natural unit weight database for Busan, by applying a method that was introduced in a domestic research project conducted by the National Institute for Disaster Prevention (Korea) [45]. The process of setting up natural unit weight data was as follows: the literature suggested that typical natural unit weight values for sand, silt, and clay were 2, 1.7, and 1.7 t/m3, respectively. Typical natural unit weight values were derived for all soil texture types by calculating the weighted natural unit weight averages for the sand, silt, and clay soil particle groups. The composition percentages of the three different particles in each soil texture type were obtained from the soil texture triangle proposed by the US Department of Agriculture, Soil Science Division [46]. Composition percentages for the three different soil particle groups, together with corresponding typical natural unit weight values for each Busan subsoil texture type are listed in Table 2.

Table 2.
Fractions of sand, silt, and clay, together with corresponding typical natural unit weight values, for various Busan subsoil texture types.
Thirdly, experimental data for several geotechnical properties were obtained for certain sites from existing domestic research reports, as depicted in Figure 5c. As part of the ‘Construction of a Slope Management System in an Urban Area (Busan area)’ research project, KIGAM [47,48,49] collected 168, 140, and 60 soil samples from Mt. Gudeok, Mt. Baegyang, and Mt. Jang, respectively, and conducted various in situ and laboratory tests on them. In addition, National Institute for Disaster Prevention [50] and Korea’s National Disaster Management Institute [51] reported various selected local area geotechnical properties as part of projects investigating slope failure and its causative factors.
3.2. Geo-Hydraulic Input Parameters
Saturated hydraulic conductivity (ks) and soil–water retention curves (SWRC) are fundamental factors required to understand subsurface hydraulic behavior during rainfall infiltration into unsaturated soil. In this section, the methods used to establish datasets for these two important geo-hydraulic factors have been described, together with the results achieved.
In terms of ks, Yoon et al. [52] conducted multivariate regression analyses on 44 sets of in situ ks test data using weathered soils obtained from various Korean regions. An estimation model (Equation (1)) was then developed using several geotechnical variables, including sand percentages, silt and clay percentages, void ratios, and dry unit weights.
In Equation (1), Kin-situ denotes in situ saturated hydraulic conductivity, Sand% shows the sand fraction, Silt & Clay% indicates the fraction of silt and clay, Υd represents dry unit weight, and e indicates the void ratio.
In this study, raster datasets for Sand%, Silt & Clay%, and e were generated for the Busan area by referring to the mean values of each lithology type shown in Table 1. A raster dataset for Υd was generated by applying the relationship of Υd = Υt/(1 + ω); in this case, distributed natural unit weight (Υt) and in situ water content (ω) data were generated for the study area using subsoil texture (Table 2) and lithology (Table 1) data, respectively. This resulted in the generation of a raster dataset with 32 different saturated hydraulic conductivity zones for Busan. For those zones which had experimental data (Figure 5c), the estimated data were replaced with experimental data means. A uniform saturated hydraulic conductivity data value was assigned for each zone.
In terms of SWRC, an artificial neural network (ANN) model was applied to determine SWRC fitting parameters for Busan. The ANN computational technique has been popularly applied in various geotechnical engineering studies, to capture non-linear and complex variable relationships, including predictions of unsaturated soil shear strengths, undrained soil shear strengths, consolidation settlements, and soil thermal conductivities [53,54,55,56,57,58]. In this study, by referring to earlier studies that estimated SWRC using ANN models [38,59], a back-propagation neural network [60], applying the Bayesian regularization algorithm with a two hidden-layer structure, was designed. Three variables (sand fraction, fine grained soil fraction, and void ratio) were selected as inputs for the model, to predict output variables—that is, as the coefficients of a mathematical equation for fitting SWRCs. Fifty-one input and output variable datasets were collected by collecting laboratory test results (SWRC drying paths) for samples obtained from nine Korean regions with different geological conditions. By using 80% of these data for training, and the balance for testing, an ANN model was derived which achieved high correlation coefficients, such that R = 0.99806 for the training set, R = 0.91305 for the test set, and R = 0.82628 across all datasets. The drying path SWRCs determined from the ANN model were then processed further using a conversion step into corresponding wetting paths. Wetting path SWRCs, which reflect the soil saturation process in the field more effectively than those for drying paths, were obtained by applying the empirical approach introduced by Park et al. [61].
The properties of each Busan lithology type covered in Table 1 were applied as input variables for the ANN model. This allowed the six Busan lithology type drying and wetting SWRCs to be derived, as shown in Figure 6a. The SWRC fitting coefficients, shown in Table 3, constituted the Van Genuchten [62] SWRC fitting equation, as shown in Equation (2):
where Se represents the effective degree of saturation, θr denotes the residual water content, a stands for the inverse of the air-entry pressure, n indicates the pore size distribution parameter (m = 1 − 1/n), and ψ shows matric suction.
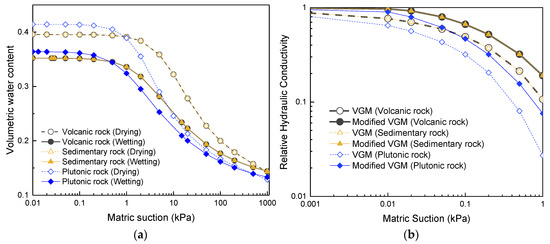
Figure 6.
Unsaturated soil properties for three lithology types: (a) soil-water retention curves for drying and wetting paths; (b) relative hydraulic conductivity functions corresponding to wetting path SWRCs.

Table 3.
Infiltration parameter datasets for the eight Busan infiltration characteristic (IC) zones. SWRC: soil-water retention curve.
Relative hydraulic conductivity functions were calculated using the modified van Genuchten–Mualem (Modified VGM) model [63], and can be seen in Figure 6b. The original VGM model [62] was modified to solve the mathematical problems associated with drastic decreases in relative hydraulic conductivity at very low matric suctions. Application of the Modified VGM model produced relative hydraulic conductivity values higher than the VGM model at low matric suctions and near saturation, and enhanced numerical stability when conducting infiltration analyses.
As a final step in setting up the parameter dataset for infiltration analyses, the Busan mountainous area was divided into eight infiltration characteristic (IC) zones, using geological (lithology), topographic, and landslide history criteria (Figure 7). IC zone boundaries were defined to demarcate areas with specific unsaturated soil characteristics, so that slopes within each IC zone had near-homogeneous rainfall infiltration and subsurface water flow characteristics. The final parameters for the eight IC zones, in terms of SWRC and ks, can be seen in Table 3. The wetting path SWRC fitting coefficients for the predominant lithology type were selected from each IC zone, while the distributed ks data values in the raster dataset were averaged to a single representative value for each IC zone. As shown in Table 3, the estimated values of ks were 2.767 × 10⁻⁵~5.115 × 10⁻⁵, 3.3 × 10⁻⁵, and 5.562 × 10⁻⁵ m/s for the volcanic, sedimentary, and plutonic rock type IC zones, respectively. These estimated values had a high degree of conformity with the ranges and means of permeability for the three lithology type conditions in Kim [34]’s statistics, which are based on experimental data of 280 samples from Busan hillslope areas. On the other hand, the estimated drying SWRC paths for the volcanic and plutonic rock types in Figure 6a fell in the distribution range of the drying paths of experimental SWRCs for the igneous rock type presented in the National Disaster Management Institute’s primary research report [51]. Likewise, the drying SWRC path of the sedimentary rock type in Figure 6a fell in the distribution range of the drying paths of experimental SWRCs for the sedimentary rock type presented in the same primary research report.
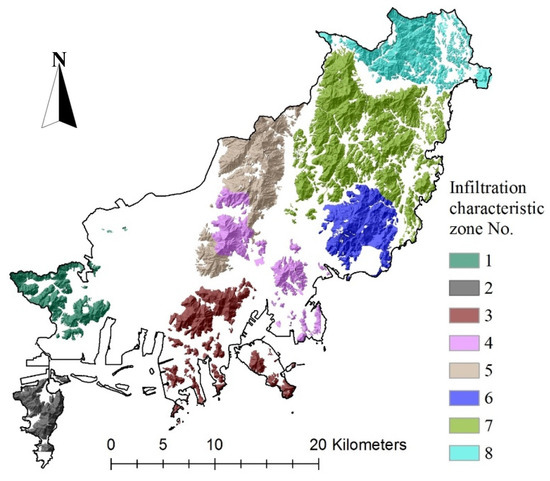
Figure 7.
Division of the Busan mountainous area into eight infiltration characteristic (IC) zones.
3.3. Geotechnical and Geomorphological Input Parameters
In this study, several geotechnical and geomorphological input parameters—including effective friction angle, soil dry unit weight, and slope angle—were required, to populate slope stability equations. Firstly, as shown in Figure 8a, a total of 57 geo-mechanical parameter zones was generated in the Busan mountainous area by combining the previously mentioned lithology, subsoil texture, and experimental data maps together (Figure 5). In the table that lists the geo-mechanical parameter data for each of the 57 zones, effective friction angle data were entered by referring to either mean values for the zone lithology types (Table 1), or representative experimental values, where soil samplings and tests had been conducted (Figure 5c). Effective soil cohesion was assumed to be zero, considering that Korean mountainous geological conditions consist mainly of weathered residual sandy soils with minor levels of effective cohesion. This assumption accorded with other landslide/slope stability modeling studies conducted under Korean [64,65,66] and international [13,14] conditions. Dry unit weight data were set for each of the 57 zones by adopting the dataset generated using the relationship Υd = Υt/(1 + ω), as introduced in Section 3.1. The final data table for the 57 geo-mechanical parameter zones can be found in Table A1 (Appendix A). Secondly, the slope angle raster dataset was generated using the DEM, as shown in Figure 8b. This raster dataset was set with a spatial resolution of 5 × 5 m, to serve as a reference for setting equal cell alignments and spatial resolutions in input parameter zone maps (Figure 7 and Figure 8a), as well as an output raster dataset (i.e., the CRCritical map).
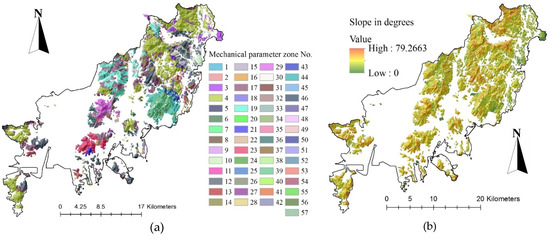
Figure 8.
Busan raster datasets for selected geotechnical and geomorphological input parameters: (a) geo-mechanical parameter zones; (b) slope angles.
4. Analysis Results
4.1. Infiltration Analysis
In this section, we describe the process used to derive suction stress changes at a potential sliding surface depth, for each of the eight IC zones, in relation to increased continuous rainfall amounts. This process was based on numerical analysis of 1-D rainfall infiltration, using the commercial finite element code SEEP/W [67]. Pressure head profile progressions were calculated in transient conditions by iteratively solving the governing equation for each time step, using a given flux boundary and initial pressure head conditions. The governing equation (Equation (3)) embodies the fundamental concept that the rate of change in flow across an elemental volume is equal to the rate of change in volumetric water content. In other words, as change in volumetric water content is related to change in pore-water pressure, according to Equation (4), a ground condition that has an SWRC with gentler gradients (i.e., a smaller mw) could exhibit more rapid increases in pore-water pressure, with respect to a particular rainfall accumulation rate—that is, to a particular flow rate change across an elemental volume:
where H shows the total head (in m), kx and ky represent hydraulic conductivities in the x-direction and y-direction (as m/s), respectively; Q stands for the applied boundary flux (as m3/s); t stands for time (s); mw denotes the slope of the storage curve; θ indicates the volumetric water content; and uw represents pore-water pressure.
The analysis domain geometry was determined using a 1-D soil column to represent a shallow weathered residual soil layer overlying Busan hillslope bedrock. Using field investigations and a comprehensive grey literature review (e.g., articles and project reports) describing landslide site conditions in Busan mountainous areas, the effective thickness of the soil layer—that is, the height of the domain—was determined to be 2 m. A discretized quadrilateral mesh, made up of 231 nodes and 200 elements, was constructed within the column domain. Material properties (the SWRC and saturated hydraulic conductivity) in the domain were determined by adopting the datasets for the eight Busan IC zones (as introduced in Table 3). Through a steady-state analysis, a uniform initial moisture condition, with a negative pore-water pressure of −15 kPa, was set in the domain area. This initial pore-water pressure was determined by referring to monitored matric suction data for Korean hillslopes during wet seasons [39,68,69]. In these monitoring results, the matric suctions tended to drastically decrease from the 70–90 kPa range to near 0 kPa upon initial rainfall events of wet seasons. The matric suctions subsequently recovered to maintain levels in the 5–20 kPa range during intermittent dry periods. Side and bottom (i.e., impermeable bedrock) boundaries were specified as no flux conditions, and a 10 mm/h flux was applied to the top boundary, until the soil column entered a hydrostatic pressure state. The steady flux rate at the top boundary, which was well below the minimum infiltration capacity (i.e., saturated hydraulic conductivity), was employed to model the critical hillslope hydrological condition. In this situation, all rainwater infiltrated into the ground, and contributed to increasing soil moisture—and thus slope instability—without any loss of water by ponding or runoff. In this critical hillslope hydrological condition, the cumulative continuous rainfall amount corresponds directly with the degree of saturation or slope instability.
Parts of the infiltration analysis results for the eight IC zones in Busan can be seen in Figure 9. The IC zone 1 results shown in Figure 9a also represent results for IC zones 2, 6, 7, and 8. These zones exhibited analogous pore-water pressure and suction stress profile progressions, as they had similar saturated hydraulic conductivity values, with the same lithology type SWRC (volcanic rock). A pore-water pressure profile from the ground surface to bedrock depth was numerically derived for each 15 min time interval. The iterative calculations ceased when the pore-water pressure profile reached the hydrostatic pressure state—that is, the water table had reached the ground surface—in which the water pressure increases in proportion to depth.
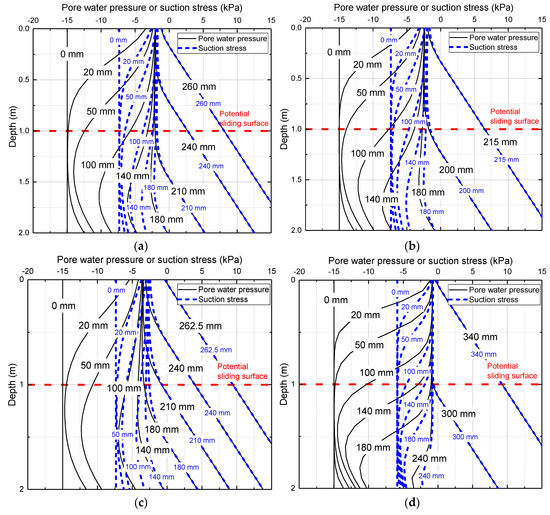
Figure 9.
Infiltration analyses (vertical profiles of pore-water pressure and suction stress) for: (a) IC zone 1 (volcanic rock); (b) IC zone 3 (sedimentary rock); (c) IC zone 4 (volcanic rock); (d) IC zone 5 (plutonic rock).
The continuous rainfall amount infiltrated to reach the hydrostatic pressure state depended primarily on the SWRC type; the amounts were approximately 260, 220, and 340 mm for volcanic rock (zones 1, 2, 4, and 6–8; Figure 9a,c), sedimentary rock (zone 3; Figure 9b), and plutonic rock (zone 5; Figure 9d), respectively. As theoretically described from the introduction of Equation (4), the plutonic rock-type SWRC, which exhibited the steepest overall gradient among the three lithology types (compare the three wetting paths in Figure 6a), from 15 (initial condition) to 0 kPa matric suction, resulted in the slowest downward progression of the wetting front requiring the largest amount of continuous rainfall retained. The effective degree of saturation corresponding to pore-water pressure was calculated using the van Genuchten SWRC model (Equation (2)), and the suction stress was accordingly derived using the general functional form shown in Equation (5):
where σs shows the suction stress, Se represents the effective degree of saturation, ua denotes the pore-air pressure (which can be conveniently set as 0, equal to atmospheric pressure), and uw represents the pore-water pressure [70].
In the following section, the calculated suction stress at a potential sliding surface depth of 1 m has been linked to an infinite slope stability analysis at each 15 min time step, to derive a CRCritical amount. The 1 m potential sliding surface depth was determined by referring to the detailed field survey conducted in relation to 459 Korean landslides by Kim and Song [71], in which it was found that landslide depths mainly ranged from 0.6–1 m, and seldom exceeded 1.1 m. It is noteworthy that from our accrued experiences conducting investigations on landslide sites in Korea, there were a greater number of shallow landslide initiation areas where the sliding surface depths did not correspond to the bedrock depths than areas where this was the case. As an example, Figure 10 shows two initiation areas of shallow landslides in Korea where certain depths of soil deposits still remained above bedrocks.
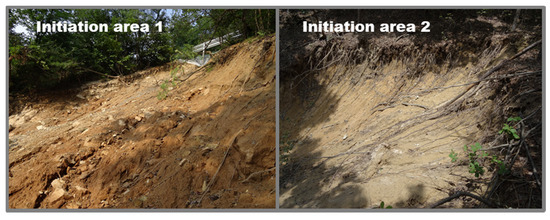
Figure 10.
Two example initiation areas of shallow landslides in Korea where certain depths of soil deposits still remained above bedrocks.
4.2. Generation of Busan Critical Continuous Rainfall Map
CRCritical amounts for shallow landslides were derived using the factor of safety (FOS) equation for an infinite slope. This equation (Equation (6)) embodies the unified effective stress concept (Equation (7)) for both saturated and unsaturated conditions, as determined by Lu and Likos [32] and Lu and Godt [70], which were based on the Mohr–Coulomb failure criterion and the limited equilibrium approach:
where σ′ stands for the effective stress, σ denotes total stress, ua denotes the pore air pressure, φ′ is the effective internal friction angle, c′ represents effective cohesion (kPa), σs stands for the suction stress (kPa), β denotes slope angle, zω indicates the vertical soil depth of a potential sliding surface (fixed at 1 m in this study), and γ shows the water content-dependent soil unit weight (as kN/m3). This last parameter increases as continuous rainfall accumulates and can be derived using the equation γ = γd + θ·ρw, where θ represents volumetric water content, and ρw stands for the density of water.
The whole process of deriving CRCritical levels for the Busan area was implemented using a Python script and has been summarized in the flow chart presented as Figure 11. As a first step, relevant numbers of an IC zone (see Figure 7) and a geo-mechanical parameter zone (see Figure 8a) were granted to each cell in the slope angle raster dataset (see Figure 8b) for the Busan mountainous area based on cell location. This was done to link the dataset of geo-mechanical parameter zones in Table A1 (Appendix A) to each corresponding cell in the slope angle raster dataset. In the second step, the FOS for a particular cell was calculated at each infiltration analysis time step, by substituting suction stress data corresponding to that time step into Equation (6). Thirdly, the earliest elapsed time when the FOS became ≤1.3 for a particular cell was found. Then, the CRCritical amount for that particular cell could be calculated by multiplying the steady rainfall flux rate (10 mm/h) with the earliest elapsed time. Fourthly, the calculated CRCritical amount was assigned as a fixed characteristic data point for the particular cell. Lastly, the process from the second to the fourth step was repeated for every cell in the slope angle raster dataset constituting Busan mountainous areas.
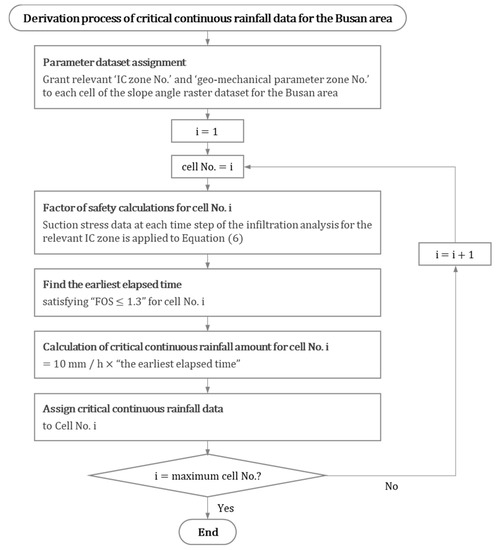
Figure 11.
Flow chart for the Busan area critical continuous rainfall data derivation process. IC zone No.: infiltration characteristic zone number. FOS: factor of safety.
As an example, a slope in IC zone 3, used to determine CRCritical, can be seen in Figure 12, where the calculated suction stress and FOSs at potential sliding surface depths have been plotted with respect to cumulative continuous rainfall. It can be seen that the suction stress drastically decreased—and entered an excessive pore-water pressure state—at the 10 mm increment between the 200 and 210 mm continuous rainfall amounts (the yellow-colored region in Figure 12). This in turn decreased the FOS significantly below 1.3. Although 2.5 mm (= the steady flux rate of 10 mm/h × the 0.25 h time step interval) was the minimum increment available, 10 mm was used as the unit increment in this study, being more practical. The figure demonstrates why 200 mm would be used as the CRCritical quantum for this example slope. It is noteworthy that the use of a conservative FOS limit of 1.3 instead of a theoretical FOS limit of 1.0 did not result in significant decreases in the CRCritical amounts in the example slope; Figure 12 shows that both CRCritical amounts corresponding to FOS = 1.3 and 1.0 are between 200 and 210 mm. This is because the suction stress on the potential sliding surface in IC zone 3 decreases drastically faster following the accumulation of continuous rainfall exceeding 200 mm. The infiltration analysis result of IC zone 3 in Figure 9b demonstrates that an incremental increase in continuous rainfall as small as 15 mm from 200 to 215 mm results in the water table rising from a depth below the potential sliding surface to near the ground surface level. This water table increase in turn resulted in the drastic increase in pore-water pressure on the potential sliding surface from approximately −2 to +7 kPa.
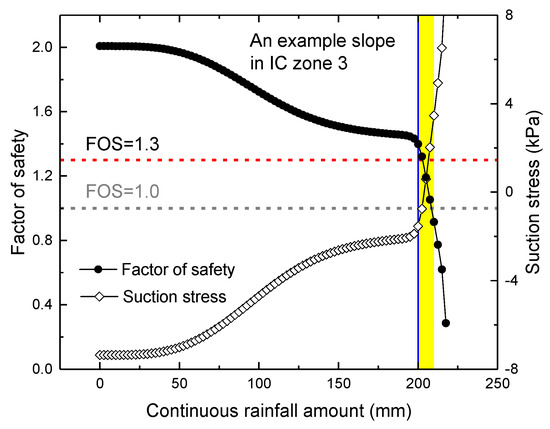
Figure 12.
Variations in suction stress and factor of safety for an example slope in IC zone 3, with respect to continuous rainfall accumulation.
Following the process shown in Figure 11, a GIS-based, CRCritical map covering the entire Busan mountainous area was generated (Figure 13). Each cell (5 × 5 m) of the map is independently specified by its own fixed CRCritical amount. As is readily noticeable in Figure 13, the range of derived CRCritical amounts was unique for each IC zone (or lithology type). This result was supported by distribution statistics of the almost 12 million CRCritical map grid cells which constituted the eight Busan IC zones, as depicted in Figure 14. In volcanic (IC zones 1, 2, 4, 6–8), sedimentary (IC zone 3), and plutonic (IC zone 5) rock-type regions, most CRCritical amounts were distributed in the 180–250, 200–210, and 140–310 mm ranges, respectively. In particular, IC zone 5 exhibited relatively high CRCritical values, with the largest dispersion, with the range of 300–310 mm being most prevalent. This was because a majority of slopes in this zone required larger amounts of continuous rainfall to advance wetting fronts and reach the limit of stability than in the others. The degree of dispersion of CRCriticals within each IC zone was primarily due to slope inclinations. More specifically, the stability of steep slopes decreased to “FOS ≤ 1.3” in unsaturated states due to the effects caused by the advancement of wetting fronts, whereas relatively gentler slopes maintained stability until after entering fully saturated states with excessive pore pressures. The results indicated that in the geological conditions of Busan slope stability primarily depend on infiltration characteristics related to unsaturated soil parameters, rather than on geotechnical and geomorphological characteristics, such as internal friction angle or slope angle.
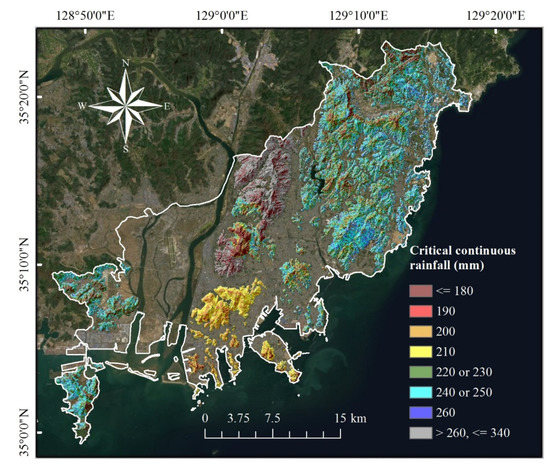
Figure 13.
Geographic information system-based critical continuous rainfall map for shallow landslide forecasting in mountainous areas in Busan.
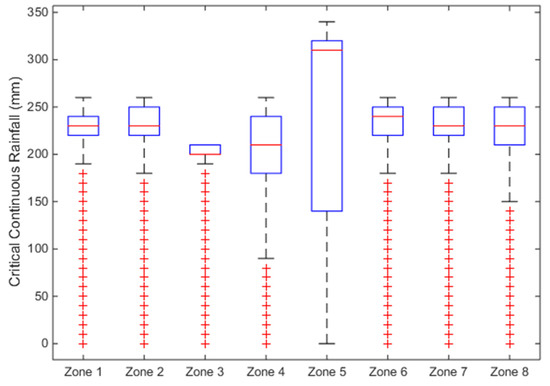
Figure 14.
Boxplot of the distributions of critical continuous rainfall for the eight IC zones.
5. Case Study
To test the applicability of the derived CRCritical as a threshold for shallow landslide forecasting, a case study was conducted. Two mountains in Busan, Mt. Gudeok and Mt. Hwangnyeong, which exhibited the highest frequency of large- and small-scale landslide damages to surrounding communities and villages, were selected as the case study areas. Mt. Gudeok is situated in IC zone 3 (a sedimentary rock type region), whereas Mt. Hwangnyeong is a part of IC zone 4 (a volcanic rock type region). Figure 15 describes the case study areas and the diffused historical landslide locations that were recorded during the case study period of 2006 to 2016. The collected historical landslides were all recorded to have occurred during one of five dates: 10 July 2006, 7 July 2009, 16 July 2009, 27 July 2011, or 15 July 2012. The CRCritical amount ranges of the historical landslide locations in Mt. Gudeok and Mt. Hwangnyeong were 200–210 mm and 210–250 mm, respectively. More specifically, the collected historical landslides of Mt. Hwangnyeong were seldom located in areas where the CRCritical amount was less than 190 mm. This appears to be due to the fact that a majority of these areas are characterized by relatively steep slopes located at high elevations where in situ weathered soil deposits are readily lost by sustained surface runoff or erosion processes. To compare the derived CRCriticals of the historical landslide locations with the in situ rainfall events that actually resulted in these historical landslides, historical records from rainfall observatories (hereafter referred to as R.O.) of the Korea Meteorological Administration were analyzed. Five different R.O.s (marked with the numbers 1 to 5 in Figure 15) that are located in the surrounding area were utilized as sources for analyzing Mt. Gudeok, whereas only a single R.O. (marked with the number 6 in Figure 15) located in the center of the Mt. Hwangnyeong area was considered to be an effective source to represent the field rainfall conditions of the area.
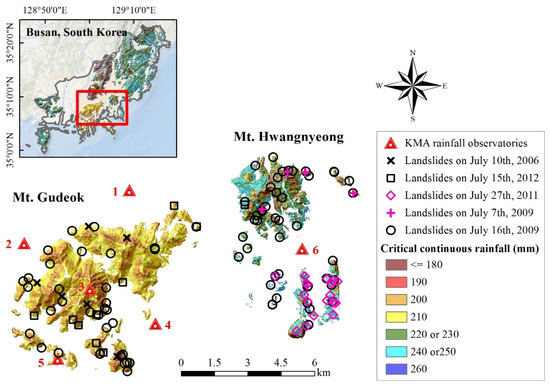
Figure 15.
Overview of the case study areas and the distributions of historical landslides, rainfall observatories of the Korea Meteorological Administration (KMA), and specified critical continuous rainfalls.
As one part of the analysis results, Figure 16 shows the annual maximum continuous rainfall amounts recorded in the case study areas during the study period of 11 years. The results provide insights on whether the landslides actually occurred under continuous rainfall amounts larger or smaller than the CRCritical amounts. First, landslides were not reported when continuous rainfall amounts were less than the CRCritical amounts in both mountains; in other words, there were no false negative (missed forecasting) cases. Moreover, all the collected historical landslides occurred when continuous rainfall amounts exceeded the CRCritical amounts. This specifically indicates that the main bodies of the recorded landslide-triggering rainfalls tended to not have interim discontinuity terms longer than 24 h, which otherwise would have led to underestimations of the recorded landslide-triggering continuous rainfall amounts and thus increasing the number of missed forecasting cases.
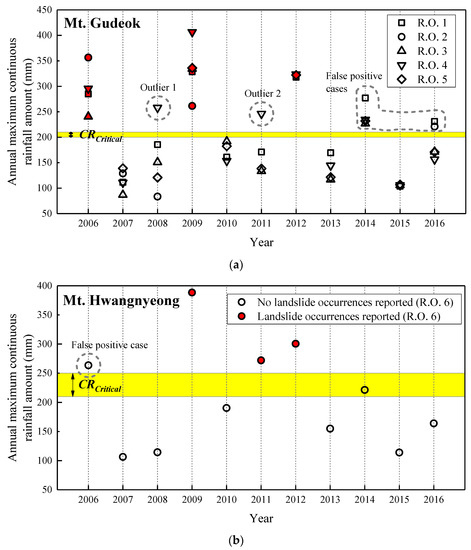
Figure 16.
Comparison of annual maximum continuous rainfall amounts and derived CRCritical amounts in (a) Mt. Gudeok and (b) Mt. Hwangnyeong during the study period of 11 years. Polygons filled with a red color: rainfall events during which landslides occurred. R.O.: the abbreviation for rainfall observatory.
In Mt. Gudeok (Figure 16a), landslides were reported in three separate years (2006, 2009, and 2012) and false positive cases (or false forecasting) were recorded in 2014 and 2016. The cases exceeding the CRCritical amounts in 2008 and 2011 were considered as outliers as, in both years, rainfall records from all R.O.s were below the CRCritical amounts with the exception of R.O. 4. In fact, Outliers 1 and 2 recorded by R.O. 4 represented the rainfall conditions that triggered multiple landslides in areas outside of the case study areas located southeastward from Mt. Gudeok. In Mt. Hwangnyeong (Figure 16b), landslides were reported in three separate years (2009, 2011, and 2012) and a false positive case (or false forecasting) was recorded in 2006.
Figure 17a,b show the continuous rainfall accumulations that triggered landslides during the case study period in Mt. Gudeok and Mt. Hwangnyeong, respectively. The rainfall data for Mt. Gudeok were obtained from available data among the five adjacent R.O.s at each rainfall event. Although the total duration required to reach the maximum amount significantly varied among the rainfall events and the R.O.s, the main bodies of the landslide-triggering continuous rainfall amounts were concentrated with significant intensities during the final 10 h to 50 h before the maximum amount was achieved. Information regarding the landslide occurrence time was obtained in a limited manner through internet news archives for two and three landslide incidents in Mt. Gudeok and Mt. Hwangnyeong, respectively: 14:30 on 10 July 2016 and 08:00 on 16 July 2009 in Mt. Gudeok, and 09:30 on 07 July 2009, 10:40 on 16 July 2009, and 10:20 on 27 July 2011 in Mt. Hwangnyeong. The occurrence times were subsequently compared with the points at which the accumulated continuous rainfall exceeded the CRCritical amount. As for the 2009 landslide incident in Mt. Gudeok, the data from the two farthest R.O.s (No. 2 and 5) were excluded and the data from the three remaining R.O.s (No. 1, 3, and 4) that are equally distanced from the location of the landslide incident were used for the comparative analysis. On the other hand, the nearest R.O. (No. 1) to the 2006 landslide incident was only the rainfall data source used for the comparative analysis. As a result, the calculated time lags between the exceedance of the CRCritical amount and the occurrence of landslides were mostly short, which were approximated as a minimum of less than 30 min and a maximum of 2.5 h. Even in the case of landslides occurring at much larger rainfall amounts than the CRCritical amounts, sufficient time lags were not detected due to the rainfalls being highly intensified in the final hours before landslide occurrences. Therefore, to ensure sufficient lead times, predicted rainfall data are preferable for use over the real-time recorded rainfall data when CRCritical is applied as a threshold for shallow landslide forecasting.
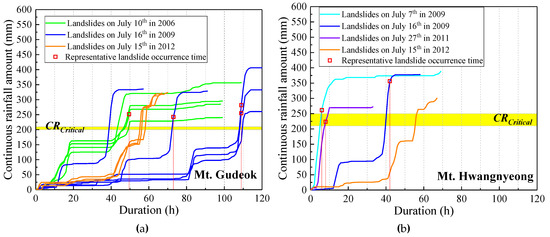
Figure 17.
Accumulations of landslide-triggering continuous rainfalls relative to the CRCritical amounts in (a) Mt. Gudeok and (b) Mt. Hwangnyeong.
Figure 18a shows the continuous rainfall accumulations of the false positive (i.e., false forecasting) cases in Mt. Gudeok, or in other words, the rainfalls in 2014 and 2016 that exceeded the CRCritical amounts but under which landslides were not reported; in actuality, only a couple of minor failures of manmade slopes (e.g., embankments and cut slopes with retaining walls) in housing areas were reported. In Figure 18b, the false positive continuous rainfall in Mt. Hwangnyeong is compared with another continuous rainfall that reached almost the same maximum amount as the false positive rainfall yet resulted in several landslides in the area. The first common characteristic of continuous rainfall accumulations in the false positive cases was the overall lower gradients of rainfall accumulations. The second characteristic involved the fact that extreme rainfall intensities were rarely exhibited in the final hours of rainfall events. From a theoretical perspective, such progressive accumulation patterns over prolonged durations enhance the drainage effects of infiltrated rainwater and thus require higher rainfall amounts compared to the designed CRCritical amounts to saturate slopes to the point of landslide initiation.
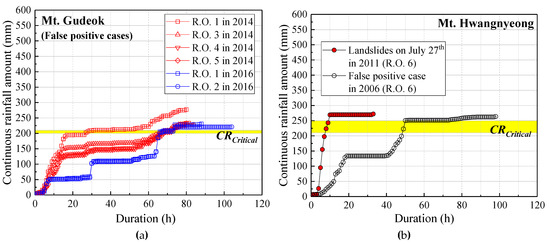
Figure 18.
Continuous rainfall accumulations of false positive cases in (a) Mt. Gudeok and (b) Mt. Hwangnyeong. R.O.: the abbreviation for rainfall observatory.
To conclude, the relevance of the derived CRCritical as a threshold for shallow landslide forecasting was validated in the case study areas. This was based on the following aspects: (1) although conservatively designed with the assumption that all rainfall infiltrates and saturates slopes without runoff and drainage, the CRCritical thresholds were not frequently exceeded without landslide occurrences (three false positive cases over a total period of 11 years), hence sustaining its forecasting credibility; (2) there were no missed forecasting cases as all three and four landslide-triggering rainfall events were captured by the CRCritical thresholds in Mt. Gudeok and Mt. Hwangnyeong, respectively.
6. Concluding Discussion
This work developed a physically based rainfall threshold, namely CRCritical, that only requires the consideration of a single rainfall variable to forecast shallow landslide initiations. Based on the definitions and assumptions that reflect shallow landslide movements primarily triggered by short and intense rainfalls, a systematic modeling analysis was conducted to generate a GIS-based map of CRCritical amounts assigned to hillslope areas in Busan. Suction stresses corresponding to the cumulated continuous rainfalls were quantitatively derived through 1-D infiltration analysis. Subsequently, these suction stresses were linked to infinite slope stability analysis to determine the inherent and fixed CRCritical values for each slope in the hillslope areas of Busan. The 11-year case study results for two landslide-prone mountainous areas verified the relevance and effectiveness of CRCritical as a straightforward threshold indicating shallow landslide initiations.
By deducing several conventional hydrological factors (i.e., rainfall intensity and duration, runoff, and drainage) to be negligible under certain geological and climatic conditions, the proposed CRCritical model offers to simplify landslide-triggering rainfall scenarios through the use of a single rainfall variable: continuous rainfall amount.
Possible limitations of the concept CRCritical proposed in this study can be listed as follows. Firstly, the concept was developed to target shallow deposits of weathered residual sandy soil overlying hillslope areas. Therefore, it may not be applicable to regions with fine-grained soils such as silty clays, as significant portions of high-intensity rainfall fail to infiltrate the ground and are lost as runoff due to the low infiltration capacity of such soils. This fact leads to an overestimation of the field moisture conditions by the observed continuous rainfall amount. Moreover, landslides in such impervious soil regions exhibit completely different kinematics from shallow landslides, which are primarily governed by long-term drainage effects of prolonged antecedent rainfalls. More specifically, under certain climate conditions in which landslides are typically triggered by rainfall events that are progressively cumulated over prolonged durations, the continuity of rainfall should be redefined. Namely, the minimum duration of no rainfall required to terminate a continuous rainfall event should be longer than 24 h, which will cause continuous rainfall events to have greater rainfall amounts over longer durations. This is important as such climatic settings require the consideration of more complex mechanisms behind landslide initiations, such as long-term perspectives of drainage and evaporation effects as well as water table increases of confined, unconfined, or perched aquifers in deeper geological layers. Secondly, CRCritical may exhibit limited prediction performance regarding manmade slope failures, as these can be influenced by other design factors (retaining walls, drainage, culverts, excavation, etc.). Lastly, although the estimation techniques based on the experiment data of numerous field samples proved acceptable for use as alternative methods of establishing the geo-hydraulic and geotechnical input datasets for broad areas, more reliable and refined in situ and laboratory tests using sufficient field samples should be progressively applied to better characterize the unsaturated soil and other geotechnical properties of Busan. In particular, the typical natural unit weight values and composition percentages of the three different-sized particles in each soil texture type in Table 2 only rely on the values suggested by relevant domestic and US departments. These suggested composition percentages are in discord with the mean values derived from sufficient amounts of experiment data in Table 1. Therefore, the input parameter data determined using such suggested typical values in Table 2 should be prioritized as one of the first sets of parameter data to be validated and updated through refined in situ and laboratory investigations.
As an initial phase in the proposition and validation of a concept, research on CRCritical as a threshold has progressed through this study to the point where such thresholds can indicate that shallow landslides will occur “somewhere” within a particular area as a particular amount of continuous rainfall is accumulated. In future studies, the proposed concept of CRCritical could potentially be updated to refine its spatial predictions to reduce the area in which landslides are predicted to occur. Advanced derivations of such localized and site-specific CRCritical values are possible based on three-dimensional infiltration analysis capable of considering subsurface water flows that tend to converge in concave terrain and diverge in convex terrain. This analysis could also reflect soil depths overlying the bedrock that vary with topography. Furthermore, such analyses could be coupled with infinite slope stability to add refined modeling factors such as root and vegetation effects, while excluding stream lines, exposed rock areas, and land-use zones. On the other hand, it is necessary to conduct a sensitivity analysis by varying the rainfall flux on the top boundary condition in the infiltration analysis to investigate the effects of the profile shape of saturation progresses (e.g., downward progresses of wetting fronts and water table increase progresses). This could be a potential topic for future study.
One of the main advantages of using a fixed threshold is that such sophisticated modeling methods do not prompt problems of repetitive intensive computation loads for real-time landslide forecasting. However, our concept of CRCritical requires sustained validation and improvement; this requires systematic documentation of future landslide events, including credible information on occurrence times and locations as well as information on landslide types and scales.
Author Contributions
Conceptualization, J.-Y.P. and S.-R.L.; Data curation, J.-Y.P., S.O., J.H.L. and J.-S.J.; Formal analysis, J.-Y.P., S.O., J.H.L., J.-S.J. and H.-S.P.; Funding acquisition, Y.-S.S.; Investigation, Y.-S.S.; Methodology, J.-Y.P. and S.-R.L.; Project administration, S.-R.L.; Resources, S.O. and Y.-S.S.; Software, S.-R.L.; Supervision, S.-R.L.; Validation J.-Y.P.; Visualization, J.-Y.P. and J.H.L.; Writing—original draft, J.-Y.P.; Writing—review and editing, S.-R.L. All authors have read and agreed to the published version of the manuscript.
Funding
This research was supported by the Basic Research Laboratory Program through the National Research Foundation of Korea funded by the Ministry of Science and ICT (NRF-2018R1A4A1025765), and the Basic Research Project (no. 20-3412-1) of the Korea Institute of Geoscience and Mineral Resources (KIGAM) funded by the Ministry of Science and ICT of Korea.
Conflicts of Interest
The authors declare no conflict of interest.
Appendix A

Table A1.
Datasets of the 57 geo-mechanical parameter zones in Figure 8a.
Table A1.
Datasets of the 57 geo-mechanical parameter zones in Figure 8a.
| Geo-mechanical Parameter Zone No. | Effective Friction Angle (°) | Dry Unit Weight (N/m3) |
|---|---|---|
| 1 | 38.15 | 1.35 × 10⁴ |
| 2 | 36.85 | 1.32 × 10⁴ |
| 3 | 36.39 | 1.34 × 10⁴ |
| 4 | 35.86 | 1.39 × 10⁴ |
| 5 | 35.54 | 1.44 × 10⁴ |
| 6 | 35.03 | 1.46 × 10⁴ |
| 7 | 34.69 | 1.49 × 10⁴ |
| 8 | 40.40 | 1.43 × 10⁴ |
| 9 | 39.17 | 1.41 × 10⁴ |
| 10 | 38.74 | 1.42 × 10⁴ |
| 11 | 36.71 | 1.44 × 10⁴ |
| 12 | 38.25 | 1.48 × 10⁴ |
| 13 | 35.35 | 1.42 × 10⁴ |
| 14 | 34.88 | 1.43 × 10⁴ |
| 15 | 37.95 | 1.53 × 10⁴ |
| 16 | 37.47 | 1.55 × 10⁴ |
| 17 | 34.33 | 1.49 × 10⁴ |
| 18 | 34.00 | 1.54 × 10⁴ |
| 19 | 33.47 | 1.56 × 10⁴ |
| 20 | 36.39 | 1.34 × 10⁴ |
| 21 | 41.37 | 1.20 × 10⁴ |
| 22 | 38.74 | 1.13 × 10⁴ |
| 23 | 40.09 | 1.14 × 10⁴ |
| 24 | 34.88 | 1.43 × 10⁴ |
| 25 | 37.47 | 9.81 × 10³ |
| 26 | 40.10 | 1.18 × 10⁴ |
| 27 | 40.24 | 1.20 × 10⁴ |
| 28 | 36.39 | 1.34 × 10⁴ |
| 29 | 30.18 | 1.23 × 10⁴ |
| 30 | 31.00 | 1.31 × 10⁴ |
| 31 | 38.74 | 1.42 × 10⁴ |
| 32 | 31.00 | 1.35 × 10⁴ |
| 33 | 34.88 | 1.43 × 10⁴ |
| 34 | 37.47 | 1.55 × 10⁴ |
| 35 | 31.02 | 1.39 × 10⁴ |
| 36 | 31.08 | 1.42 × 10⁴ |
| 37 | 36.85 | 1.32 × 10⁴ |
| 38 | 36.39 | 1.39 × 10⁴ |
| 39 | 38.42 | 1.27 × 10⁴ |
| 40 | 35.54 | 1.44 × 10⁴ |
| 41 | 35.03 | 1.37 × 10⁴ |
| 42 | 39.17 | 1.41 × 10⁴ |
| 43 | 37.55 | 1.34 × 10⁴ |
| 44 | 38.71 | 1.26 × 10⁴ |
| 45 | 37.95 | 1.37 × 10⁴ |
| 46 | 37.47 | 1.42 × 10⁴ |
| 47 | 34.33 | 1.49 × 10⁴ |
| 48 | 33.47 | 1.56 × 10⁴ |
| 49 | 38.25 | 1.48 × 10⁴ |
| 50 | 30.99 | 9.88 × 10³ |
| 51 | 30.99 | 9.88 × 10³ |
| 52 | 30.99 | 9.88 × 10³ |
| 53 | 32.10 | 1.24 × 10⁴ |
| 54 | 32.10 | 1.24 × 10⁴ |
| 55 | 40.22 | 1.51 × 10⁴ |
| 56 | 40.22 | 1.51 × 10⁴ |
| 57 | 40.22 | 1.51 × 10⁴ |
References
- Choi, G.; Kwon, W.T.; Boo, K.O.; Cha, Y.M. Recent spatial and temporal changes in means and extreme events of temperature and precipitation across the republic of Korea. J. Korean Geogr. Soc. 2008, 43, 681–700. [Google Scholar]
- Choi, K.S.; Moon, J.Y.; Kim, D.W.; Byun, H.R.; Kripalani, R.H. The Significant Increase of Summer Rainfall Occurring in Korea from 1998. Theor. Appl. Climatol. 2010, 102, 275–286. [Google Scholar] [CrossRef]
- Choi, Y.; Kim, M.G.; Kim, Y.J.; Park, C. Characteristics and Changes of Extreme Precipitation Events in the Republic of Korea, 1954~2010: Their Magnitude, Frequency, and Percent to Total Precipitation. J. Clim. Res. 2011, 6, 45–58. [Google Scholar]
- Lee, K.; Baek, H.J.; Cho, C.H.; Kwon, W.T. The Recent (2001–2010) Changes on Temperature and Precipitation Related to Normals (1971–2000) in Korea. Geogr. J. Korea 2011, 45, 237–248. [Google Scholar]
- Jeong, S.; Kim, J.; Lee, K. Effect of clay content on well-graded sands due to infiltration. Eng. Geol. 2008, 102, 74–81. [Google Scholar] [CrossRef]
- Kim, J.; Jeong, S.; Regueiro, R.A. Instability of partially saturated soil slopes due to alteration of rainfall pattern. Eng. Geol. 2012, 147, 28–36. [Google Scholar] [CrossRef]
- Kwon, Y.; Park, J.; Kim, T. Estimation of design rainfalls considering an increasing trend in rainfall data. J. Korean Soc. Civ. Eng. 2009, 29, 131–139. [Google Scholar]
- Park, J.Y.; Lee, S.R.; Lee, D.H.; Kim, Y.T.; Lee, J.S. A regional-scale landslide early warning methodology applying statistical and physically based approaches in sequence. Eng. Geol. 2019, 260, 105193. [Google Scholar] [CrossRef]
- An, H.; Viet, T.T.; Lee, G.; Kim, Y.; Kim, M.; Noh, S.; Noh, J. Development of time-variant landslide-prediction software considering three-dimensional subsurface unsaturated flow. Environ. Model. Softw. 2016, 85, 172–183. [Google Scholar] [CrossRef]
- Baum, R.L.; Godt, J.W.; Savage, W.Z. Estimating the timing and location of shallow rainfall—Induced landslides using a model for transient, unsaturated infiltration. J. Geophys. Res. Earth Surf. 2010, 115. [Google Scholar] [CrossRef]
- De Sy, V.; Schoorl, J.M.; Keesstra, S.D.; Jones, K.E.; Claessens, L. Landslide model performance in a high resolution small-scale landscape. Geomorphology 2013, 190, 73–81. [Google Scholar] [CrossRef]
- Kim, J.; Lee, K.; Jeong, S.; Kim, G. GIS-based prediction method of landslide susceptibility using a rainfall infiltration-groundwater flow model. Eng. Geol. 2014, 182, 63–78. [Google Scholar] [CrossRef]
- Montrasio, L.; Valentino, R.; Corina, A.; Rossi, L.; Rudari, R. A prototype system for space–time assessment of rainfall-induced shallow landslides in Italy. Nat. Hazards 2014, 74, 1263–1290. [Google Scholar] [CrossRef]
- Rossi, G.; Catani, F.; Leoni, L.; Segoni, S.; Tofani, V. HIRESSS: A physically based slope stability simulator for HPC applications. Nat. Hazards Earth Syst. Sci. 2013, 13, 151. [Google Scholar] [CrossRef]
- Salciarini, D.; Godt, J.W.; Savage, W.Z.; Conversini, P.; Baum, R.L.; Michael, J.A. Modeling regional initiation of rainfall-induced shallow landslides in the eastern Umbria Region of central Italy. Landslides 2006, 3, 181. [Google Scholar] [CrossRef]
- Tiranti, D.; Rabuffetti, D.; Salandin, A.; Tararbra, M. Development of a new translational and rotational slides prediction model in Langhe hills (north-western Italy) and its application to the 2011 March landslide event. Landslides 2013, 10, 121–138. [Google Scholar] [CrossRef]
- Aleotti, P. A warning system for rainfall-induced shallow failures. Eng. Geol. 2004, 73, 247–265. [Google Scholar] [CrossRef]
- Caine, N. The rainfall intensity-duration control of shallow landslides and debris flows. Geogr. Ann. Ser. A Phys. Geogr. 1980, 62, 23–27. [Google Scholar]
- Guzzetti, F.; Peruccacci, S.; Rossi, M.; Stark, C.P. The rainfall intensity–duration control of shallow landslides and debris flows: An update. Landslides 2008, 5, 3–17. [Google Scholar] [CrossRef]
- Chleborad, A.F.; Baum, R.L.; Godt, J.W. Rainfall thresholds for forecasting landslides in the Seattle, Washington, area: Exceedance and probability. US Geol. Surv. Open-File Rep. 2006, 1064, 31. [Google Scholar]
- Segoni, S.; Rosi, A.; Fanti, R.; Gallucci, A.; Monni, A.; Casagli, N. A regional-scale landslide warning system based on 20 years of operational experience. Water 2018, 10, 1297. [Google Scholar] [CrossRef]
- Bezak, N.; Auflič, M.J.; Mikoš, M. Application of hydrological modelling for temporal prediction of rainfall-induced shallow landslides. Landslides 2019, 16, 1273–1283. [Google Scholar] [CrossRef]
- Lee, C.; Kim, D.; Woo, C.; Kim, Y.S.; Seo, J.; Kwon, H. Construction and operation of the national landslide forecast system using soil water index in Republic of Korea. J. Korean Soc. Hazard Mitig. 2015, 15, 213–221. [Google Scholar] [CrossRef]
- Marino, P.; Peres, D.J.; Cancelliere, A.; Greco, R.; Bogaard, T.A. Soil moisture information can improve shallow landslide forecasting using the hydrometeorological threshold approach. Landslides 2020. [Google Scholar] [CrossRef]
- Bordoni, M.; Corradini, B.; Lucchelli, L.; Valentino, R.; Bittelli, M.; Vivaldi, V.; Meisina, C. Empirical and Physically Based Thresholds for the Occurrence of Shallow Landslides in a Prone Area of Northern Italian Apennines. Water 2019, 11, 2653. [Google Scholar] [CrossRef]
- Fusco, F.; De Vita, P.; Mirus, B.B.; Baum, R.L.; Allocca, V.; Tufano, R.; Di Clemente, E.; Calcaterra, D. Physically Based Estimation of Rainfall Thresholds Triggering Shallow Landslides in Volcanic Slopes of Southern Italy. Water 2019, 11, 1915. [Google Scholar] [CrossRef]
- Godt, J.W.; McKenna, J.P. Numerical modeling of rainfall thresholds for shallow landsliding in the Seattle, Washington, area. Rev. Eng. Geol. 2008, 20, 121–136. [Google Scholar]
- Papa, M.N.; Medina, V.; Ciervo, F.; Bateman, A. Derivation of critical rainfall thresholds for shallow landslides as a tool for debris flow early warning systems. Hydrol. Earth Syst. Sci. 2013, 17, 4095–4107. [Google Scholar] [CrossRef]
- Salciarini, D.; Godt, J.W.; Savage, W.Z.; Baum, R.L.; Conversini, P. Modeling landslide recurrence in Seattle, Washington, USA. Eng. Geol. 2008, 102, 227–237. [Google Scholar] [CrossRef]
- Wei, X.; Fan, W.; Cao, Y.; Chai, X.; Bordoni, M.; Meisina, C.; Li, J. Integrated experiments on field monitoring and hydro-mechanical modeling for determination of a triggering threshold of rainfall-induced shallow landslides. A case study in Ren River catchment, China. Bull. Eng. Geol. Environ. 2020, 79, 513–532. [Google Scholar] [CrossRef]
- Wu, Y.M.; Lan, H.X.; Gao, X.; Li, L.P.; Yang, Z.H. A simplified physically based coupled rainfall threshold model for triggering landslides. Eng. Geol. 2015, 195, 63–69. [Google Scholar] [CrossRef]
- Lu, N.; Likos, W.J. Suction stress characteristic curve for unsaturated soil. J. Geotech. Geoenviron. Eng. 2006, 132, 131–142. [Google Scholar] [CrossRef]
- Segoni, S.; Rosi, A.; Rossi, G.; Catani, F.; Casagli, N. Analysing the relationship between rainfalls and landslides to define a mosaic of triggering thresholds for regional-scale warning systems. Nat. Hazards Earth Syst. Sci. 2014, 14, 2637. [Google Scholar] [CrossRef]
- Kim, K.S. Soil characteristics according to the geological condition of natural slopes in Busan Area. J. Eng. Geol. 2007, 17, 471–481. [Google Scholar]
- Kang, H.S.; Kim, Y.T. A study on warning level-based-landslide triggering rainfall criteria considering weathered soil type and landslide type. J. Korean Soc. Hazard Mitig. 2016, 16, 341–350. [Google Scholar] [CrossRef]
- Lee, J.S.; Kim, Y.T.; Song, Y.K.; Jang, D.H. Landslide Triggering Rainfall Threshold Based on Landslide Type. J. Korean Geotech. Soc. 2014, 30, 5–14. [Google Scholar]
- Oh, J.; Park, H.J. Analysis of landslide triggering rainfall threshold for prediction of landslide occurrence. J. Korean Soc. Hazard Mitig. 2014, 14, 115–129. [Google Scholar] [CrossRef]
- Vasu, N.N.; Lee, S.R.; Pradhan, A.M.S.; Kim, Y.T.; Kang, S.H.; Lee, D.H. A new approach to temporal modelling for landslide hazard assessment using an extreme rainfall induced-landslide index. Eng. Geol. 2016, 215, 36–49. [Google Scholar] [CrossRef]
- Lee, I.M.; Cho, W.S.; Kim, Y.U.; Sung, S.G. In-situ monitoring of matric suctions in a weathered soil slope. J. Korean Geotech. Soc. 2003, 19, 41–49. [Google Scholar]
- Campbell, R.H. Debris flows originating from soil slips during rainstorms in Southern California. Quart. J. Eng. Geol. 1974, 7, 339–349. [Google Scholar] [CrossRef]
- Crosta, G.B. Regionalization of rainfall thresholds: An aid to landslide hazard evaluation. Environ. Geol. 1998, 35, 131–145. [Google Scholar] [CrossRef]
- Godt, J.W.; Baum, R.L.; Savage, W.Z.; Salciarini, D.; Schulz, W.H.; Harp, E.L. Transient deterministic shallow landslide modeling: Requirements for susceptibility and hazard assessments in a GIS framework. Eng. Geol. 2008, 102, 214–226. [Google Scholar] [CrossRef]
- Song, Y.S.; Kim, K.S.; Woo, K.S. Stability of embankments constructed from soil mixed with stone dust in quarry reclamation. Environ. Earth Sci. 2012, 67, 285–292. [Google Scholar] [CrossRef]
- Park, D.W.; Lee, S.R.; Vasu, N.N.; Yoon, S.; Go, G.H. Quantitative assessment of landslide susceptibility on a regional scale using geotechnical databases developed from GIS-based maps. Disaster Adv. 2014, 7, 25–38. [Google Scholar]
- NIDP. A Study on Natural Landslide Hazards Using Geographic Information Systems; Research Project Report; National Institute for Disaster Prevention: Seoul, Korea, 2003. [Google Scholar]
- Soil Science Division. Soil survey manual. In USDA Handbook 18; Ditzler, C., Scheffe, K., Monger, H.C., Eds.; Government Printing Office: Washington, DC, USA, 2017. [Google Scholar]
- KIGAM. Construction of Slope Management System in Urban Area (Busan Area); First-Year Project Report, Project No.: KR-04-09; Korea Institute of Geoscience and Mineral Resources: Daejeon, Korea, 2004. [Google Scholar]
- KIGAM. Construction of Slope Management System in Urban Area (Busan Area); Second-Year Project Report, Project No.: OAA2004019-2005(2); Korea Institute of Geoscience and Mineral Resources: Daejeon, Korea, 2005. [Google Scholar]
- KIGAM. Construction of Slope Management System in Urban Area (Busan Area); Third-Year Project Report, Project No.: OAA2004019-2006(3); Korea Institute of Geoscience and Mineral Resources: Daejeon, Korea, 2006. [Google Scholar]
- NIDP. A Study on Weighting Factors Affecting Steep-Slope Failure Considering Rainfall Infiltration; Primary Research Report, Report No.: NIDP-PR-2010-10-02; National Institute for Disaster Prevention: Seoul, Korea, 2010; p. 209. [Google Scholar]
- NDMI. Disasters Risk Evaluation of Steep-Slope Considering the Unsaturated Soil Characteristics—Unsaturated Characteristics and Steep-Slope Risk Evaluation of Weathered Metamorphic Soil Testbeds; Primary Research Report, Report No.: NDMI-PR-2013-19-02; National Disaster Management Institute: Ulsan, Korea, 2013; p. 308. [Google Scholar]
- Yoon, S.; Lee, S.R.; Kim, Y.T.; Go, G.H. Estimation of saturated hydraulic conductivity of Korean weathered granite soils using a regression analysis. Geomech. Eng. 2015, 9, 101–113. [Google Scholar] [CrossRef]
- Go, G.H.; Lee, S.R.; Kim, Y.S. A reliable model to predict thermal conductivity of unsaturated weathered granite soils. Int. Commun. Heat Mass Transf. 2016, 74, 82–90. [Google Scholar] [CrossRef]
- Kim, Y.S. Development of neural network nodel for estimation of undrained shear strength of Korean soft soil based on UU triaxial test and piezocone test results. J. KGS 2005, 21, 73–84. [Google Scholar]
- Lee, S.J.; Lee, S.R.; Kim, Y.S. An approach to estimate unsaturated shear strength using artificial neural network and hyperbolic formulation. Comput. Geotech. 2003, 30, 489–503. [Google Scholar] [CrossRef]
- Min, T.K.; Hwang, K.M.; Jeon, H.W. Prediction of consolidation settlements at vertical drain using modular artificial neural networks. J. KGS 2000, 16, 71–77. [Google Scholar]
- Yoon, S.; Kim, M.M. Prediction of ground thermal diffusivity from thermal response test. Energy. Build. 2019, 185, 239–246. [Google Scholar] [CrossRef]
- Yoon, S.; Jeon, J.S.; Kim, G.Y.; Seong, J.H.; Baik, M.H. Specific heat capacity model for compacted bentonite buffer materials. Ann. Nucl. Energy 2019, 125, 18–25. [Google Scholar] [CrossRef]
- Lee, S.J.; Lee, H.J.; Lee, S.R. Soil water characteristic curve for weathered granite soils-A prediction method. J. Korean Geotech. Soc. 2005, 21, 15–27. [Google Scholar]
- MacKay, D.J. A practical Bayesian framework for backpropagation networks. Neural Comput. 1992, 4, 448–472. [Google Scholar] [CrossRef]
- Park, H.S.; Kim, B.S.; Park, S.W. A Simple Method for Estimating Wetting Path of Soil Water Characteristic Curve on Unsaturated Soils. J. Korean Geotech. Soc. 2017, 33, 37–48. [Google Scholar] [CrossRef]
- Van Genuchten, M.T. A closed-form equation for predicting the hydraulic conductivity of unsaturated soils 1. Soil Sci. Soc. Am. J. 1980, 44, 892–898. [Google Scholar] [CrossRef]
- Oh, S.; Kim, Y.K.; Kim, J.W. A modified van Genuchten-Mualem Model of hydraulic conductivity in Korean Residual Soils. Water 2015, 7, 5487–5502. [Google Scholar] [CrossRef]
- Cho, S.E.; Lee, S.R. Evaluation of surficial stability for homogeneous slopes considering rainfall characteristics. J. Geotech. Geoenviron. Eng. 2002, 128, 756–763. [Google Scholar] [CrossRef]
- Cho, S.E. Infiltration analysis to evaluate the surficial stability of two-layered slopes considering rainfall characteristics. Eng. Geol. 2009, 105, 32–43. [Google Scholar]
- Oh, S.; Lu, N. Slope stability analysis under unsaturated conditions: Case studies of rainfall-induced failure of cut slopes. Eng. Geol. 2015, 184, 96–103. [Google Scholar] [CrossRef]
- GEO-SLOPE International Ltd. Seepage Modeling with SEEP/W; GEO-SLOPE International Ltd.: Calgary, AB, Canada, 2012. [Google Scholar]
- Jeong, S.; Kim, Y.; Lee, J.K.; Kim, J. The 27 July 2011 debris flows at Umyeonsan, Seoul, Korea. Landslides 2015, 12, 799–813. [Google Scholar] [CrossRef]
- Kim, Y.K.; Choi, J.C.; Lee, S.R.; Seong, J.H. Reliable assessment of rainfall-induced slope instability. J. Korean Geotech. Soc. 2009, 25, 53–64. [Google Scholar]
- Lu, N.; Godt, J. Infinite slope stability under steady unsaturated seepage conditions. Water Resour. Res. 2008, 44. [Google Scholar] [CrossRef]
- Kim, K.S.; Song, Y.S. Geometrical and geotechnical characteristics of landslides in Korea under various geological conditions. J. Mt. Sci. 2015, 12, 1267–1280. [Google Scholar] [CrossRef]
© 2020 by the authors. Licensee MDPI, Basel, Switzerland. This article is an open access article distributed under the terms and conditions of the Creative Commons Attribution (CC BY) license (http://creativecommons.org/licenses/by/4.0/).