Article

Response of Soil Water Dynamics to Rainfall on A Collapsing Gully Slope: Based on Continuous Multi-Depth Measurements

1
School of Geography, South China Normal University, Guangzhou 510631, China
2
School of Geographical Science, Northeast Normal University, Changchun 130024, China
3
National-Regional Joint Engineering Research Center for Soil Pollution Control and Remediation in South China, Guangdong Key Laboratory of Integrated Agro-environmental Pollution Control and Management, Guangdong Institute of Eco-environmental Science & Technology, Guangdong Academy of Sciences, Guangzhou 510650, China
4
Guangdong-Hong Kong-Macao Joint Laboratory for Environmental Pollution and Control, Guangzhou 510650, China
5
State Key Laboratory of Environmental Criteria and Risk Assessment, Chinese Research Academy of Environmental Sciences, Beijing 100012, China
*
Authors to whom correspondence should be addressed.
Water 2020, 12(8), 2272; https://doi.org/10.3390/w12082272
Submission received: 12 July 2020 / Revised: 8 August 2020 / Accepted: 11 August 2020 / Published: 13 August 2020
(This article belongs to the Section Water Erosion and Sediment Transport)

Abstract

:
Soil water conditions play an important role in the formation of a collapsing gully, but we are still at the early stages of understanding how the soil water changes on the slope after different rainfall events due to a lack of high-frequency continuous field observations. This study aimed to reveal the response of soil water dynamics to rainfall events for different slope aspects and positions based on continuous multi-depth observations of soil water on a typical collapsing gully slope from 2017 to 2019 in Wuhua County, Guangdong Province, China. The vegetation characteristics and soil properties were investigated, and the storage of soil water was also calculated. The results showed that the dynamics and storage of soil water varied with the slope aspect, slope position and vegetation cover. The response time of the soil water to intensive rainfall events on the sunny slope was shorter than that on the shady slope, while soil water storage in the sunny slope was significantly lower than in the shady slope (p < 0.01). For the different slope positions, the soil water response time to the intensive rainfall events on the upper slope was shorter than that in the middle slope, while the soil water storage in the middle slope was significantly higher than on the upper slope. This was mainly due to the redistribution runoff from the upper slope to middle slope, delaying the process by which rainwater infiltrated into the soil layers. Moreover, vegetation significantly allayed the response of soil water dynamics to an intensive rainfall event but increased the storage of soil water, owing to the protection of soil surface from rain and conservation of high soil clay content. The bare area in the middle position of the sunny slope was speculated to be the potential source of the collapsing gully because it lacked the cover of vegetation. Our findings highlight the importance of soil water dynamics on the formation of a collapsing gully and provided valuable insights for the optimization of soil conservation and management practices for collapsing erosion.

1. Introduction

Collapsing gullies are a particular type of soil erosion caused by gravity and hydraulic erosion, which are widely distributed in granite areas in southern China, known locally as “Benggang” [1,2]. Similar geomorphology landscapes have been also reported in other regions around the world, such as lavakas in Madagascar [3], vocorocas in Brazil [4], and calanchi in Italy [5]. Collapsing gullies develop rapidly and suddenly, causing landscape changes and soil degradation, not only affecting the sediment production but also changing the carbon and nitrogen processes [6]. They are then considered the most serious types of erosion worldwide [7]. In southern China alone, the soil erosion rate from collapsing gullies was estimated to exceed 5.9 × 10⁴ t km−2 per year [8], damaging approximately 3.8 × 10⁵ km2 of farmland and causing USD 3.2 billion in annual economic losses [9]. Understanding the formation mechanisms of collapsing gullies and their interactions with environmental factors is critically important for the management of these serious gully erosions. Research on collapsing gullies has intensively increased over the last several decades [10], to the point of becoming a hotspot in surface soil erosion science [11].
A collapsing gully is generally composed of a catchment hillslope, collapsing wall, colluvial deposit, gully, and alluvial fan [1]. Hillslope erosion of the colluvium deposit is a fundamental procedure when collapsing gullies form, and the erosion process and mechanism of the colluvium deposition have been extensively researched by previous studies [2,12,13]. Due to their large slope angle and sparse vegetation cover, colluviums generally lack soil aggregates and plant roots, which are easily separated and generate a large amount of sediment under rainfall events [14]. However, as the source of the collapsing gully, the catchment hillslope has received insufficient attention. We are still at the early stages of understanding how the hillslope generates colluvial deposits and what the main factors affecting this process are.
Water erosion has been considered the main factor for inducing the formation of a collapsing gully [15], even though the mechanism of collapsing erosion is not yet totally clear [16]. In particular, soil water conditions play an important role in the formation of a collapsing gully [1]. An increase of soil water content can raise the weight of the soil in the upper layer after rainfall events, significantly decreasing soil shear resistance [17]. Some studies have suggested that the cohesion and internal friction angle of soil in granite reduce as soil water content increases, and that this increases soil fissure pressure, which eventually promotes the formation of collapsing erosion [18]. In addition, subsurface flow will generate and carry out soil particles when soil moisture becomes saturated, leading to an increase in soil porosity [19]. Due to the importance role of soil water in erosion, recent research has focused on the relationships between soil water and collapsing erosions. For example, Liu et al. [2] explored the variations of soil water contents and slope runoff in collapsing colluvium under simulated rainfall conditions. Tao et al. [16] captured the occurrence of preferential flow by monitoring the dynamics of soil water, and found strong relationships between preferential flow, soil water variations and collapse activation near a collapsing wall. Previous studies mainly focused on the variations of soil water in collapsing walls [20] and colluvial deposits [13]. However, soil water in the catchment slope has rarely been studied.
Rainfall is the main source of soil water and thus directly determines the dynamics of soil water in the hillslope [21]. In general, the responses of soil water to rainfall events in different slope aspects and positions vary considerably [22]. For instance, Gabarrón-Galeote et al. [23] concluded that north-facing slopes generally have more vegetation cover and a wetter soil moisture regime than south-facing slopes, especially during the dry season. In subtropical and tropical regions, rainfall events are frequent and heavy, which will significantly influence the variations in soil water and probably generate surface runoff and erosion [24]. However, it remains unclear how the soil water in different slope aspects and positions changes after different rainfall events, and how the vegetation cover affects soil water. These questions need to be further studied based on high-frequency continuous field observations of soil water content over long periods.
Therefore, this study aimed to (1) examine the responses of soil water dynamics to rainfall events in different slope aspects and positions, and (2) explore the effects of vegetation on soil water in the slope based on a continuous multi-depth observation of the soil water in a typical collapsing gully in southern China. We expect that the results of this work will be beneficial for understanding the hydrological processes of collapsing gullies, and that they will provide valuable insights for the early detection of collapsing erosion.

2. Materials and Methods
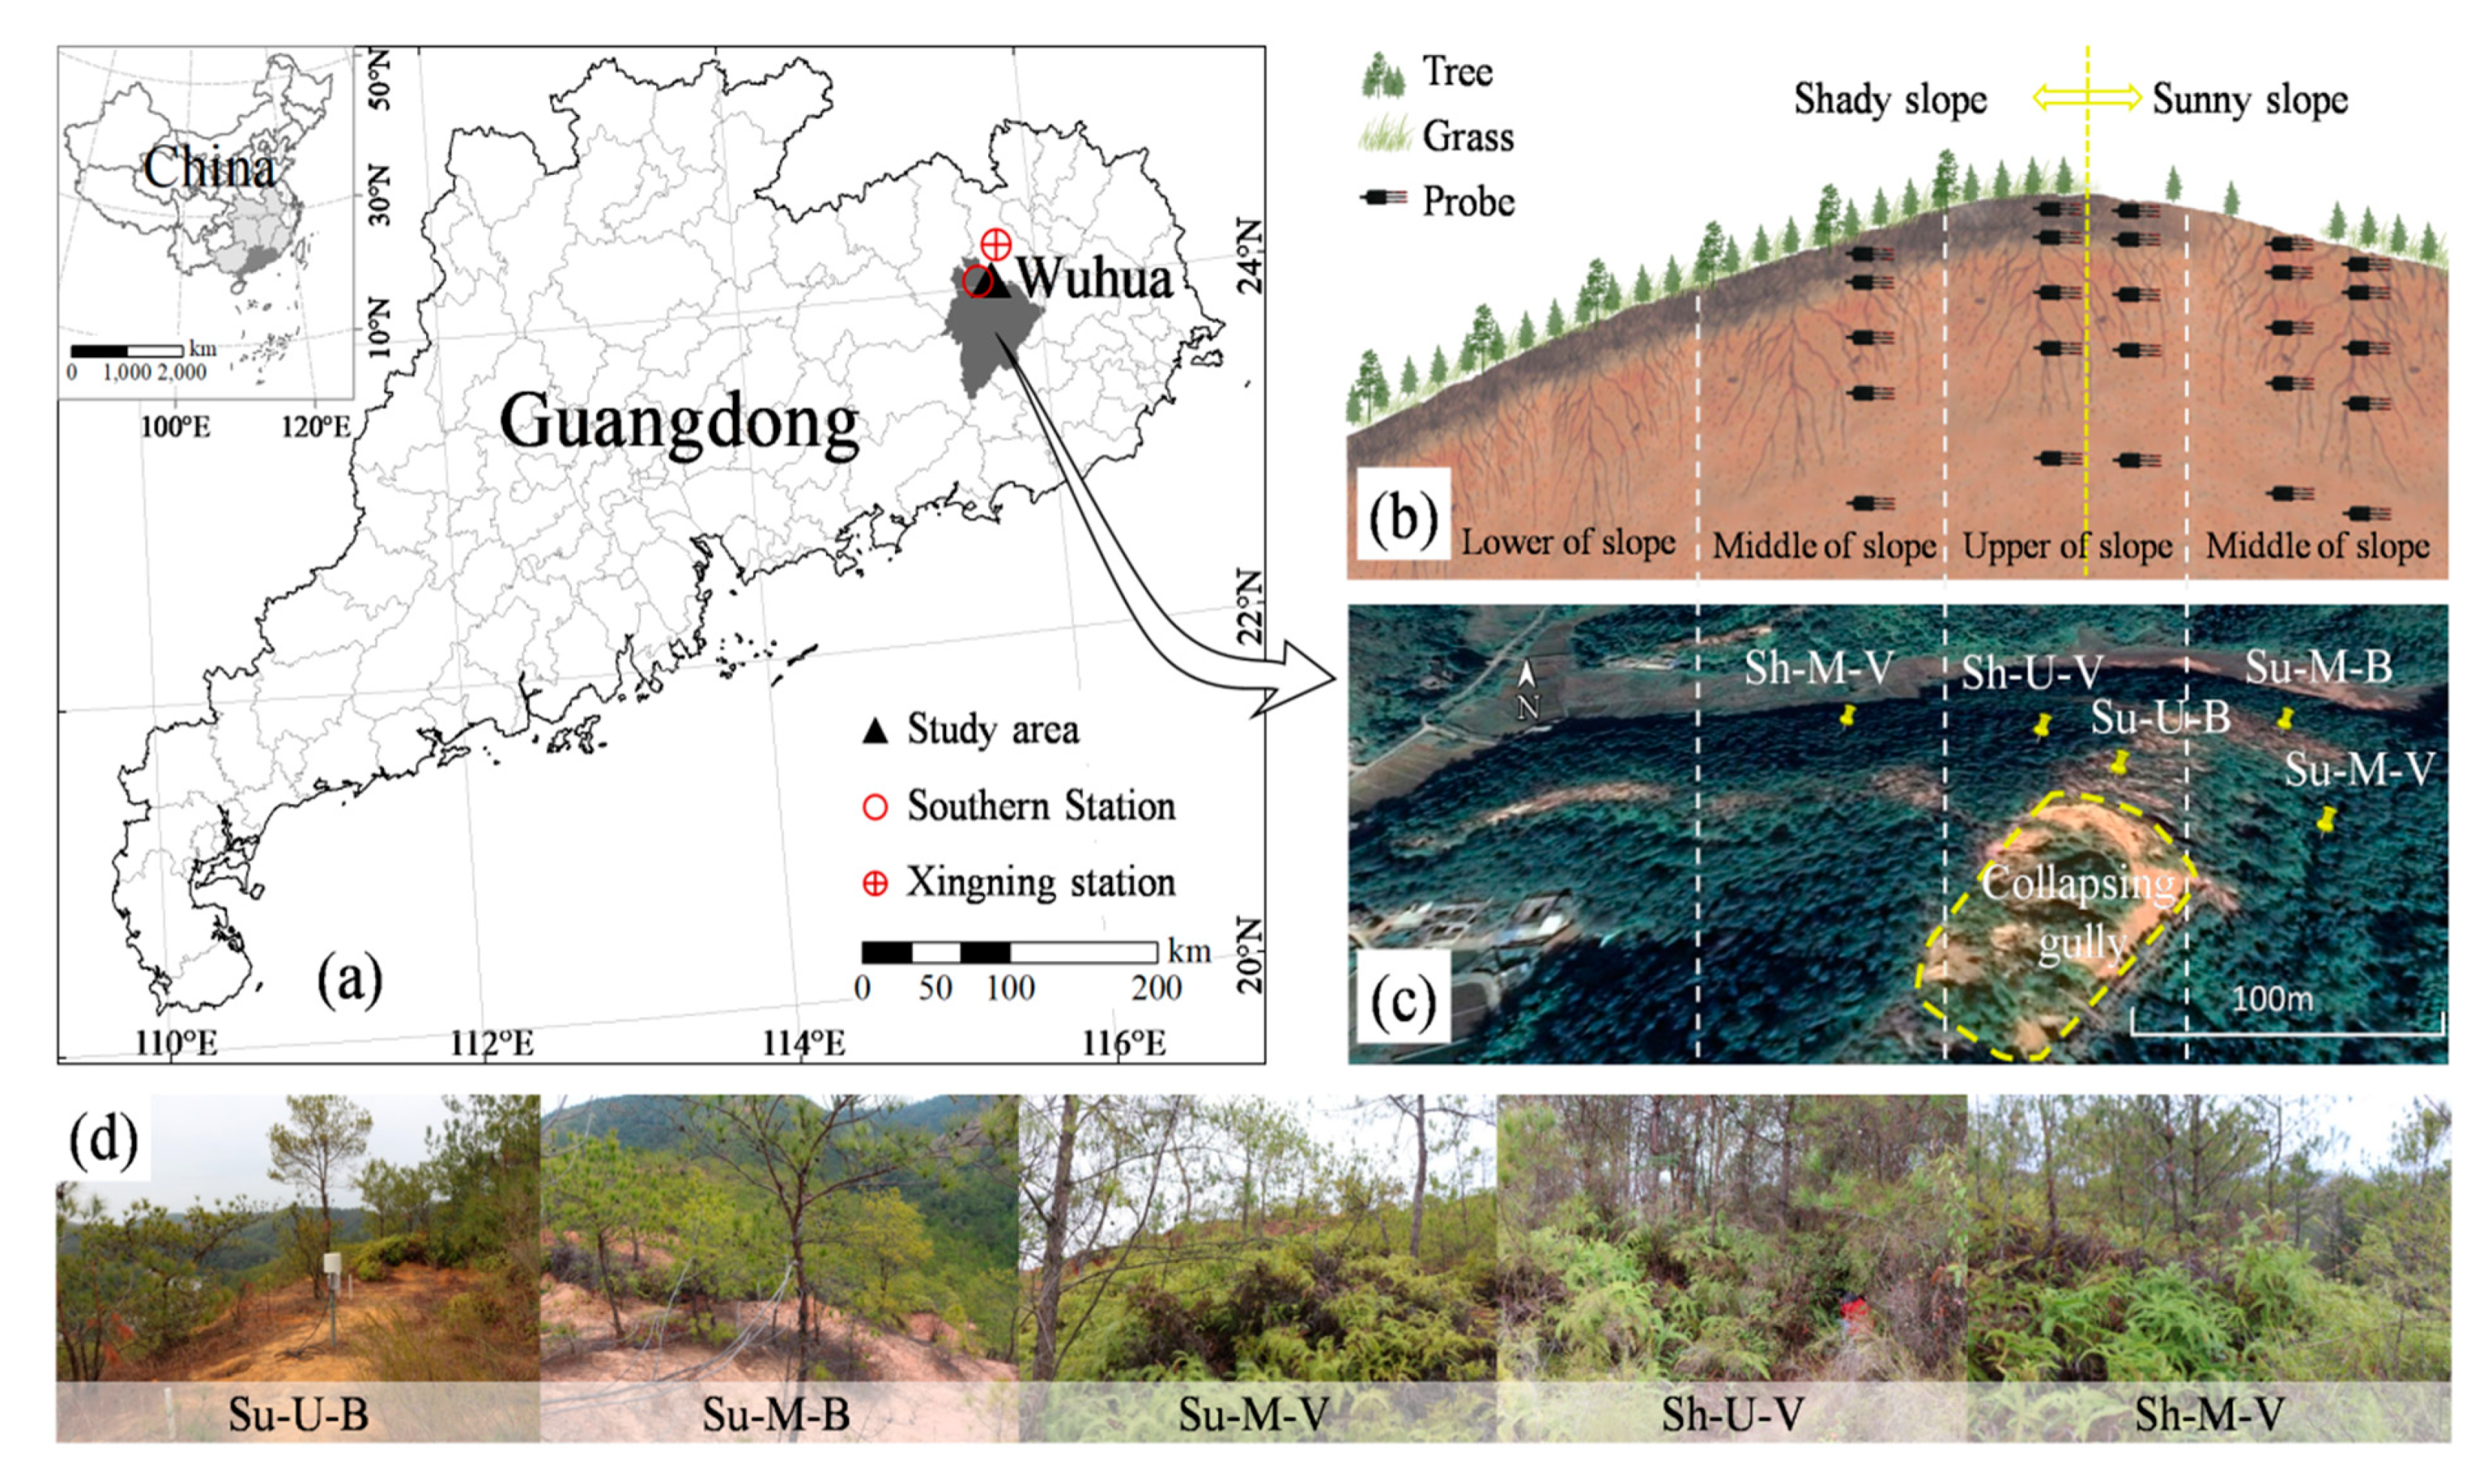
2.1. Study Area

The study area was situated at Huacheng Town (24°04’ N, 115°38’ E), north of Wuhua County, Guangdong Province, China (Figure 1a), which has more than 2000 collapsing gullies, accounting for 8.49% of the total number in southern China. There are 500–1000 tha−1 of sediment being generated from collapsing gullies every year [1]. This area has a subtropical monsoon climate, a mean annual air temperature of 21.3 °C and mean annual rainfall of 1507 mm. About 75.6% of the total annual rainfall occurs from April to September along with the southeast monsoon from the Pacific.
The zonal soil of the surface layer and laterite layer on the collapsing slope are mainly clay. The most common plant species on the shady slope are Pinus massoniana, Dicranopteris dichotoma, Baechea frutescens and Rhodomyrtus tomentosa, while the landscape of sunny slope is nearly bare, occasionally covered with P. massoniana, with some gullies and flat land covered with D. dichotoma.

2.2. Experimental Design and Data Collection

In order to analyze the influence of slope aspect, slope position and vegetation on soil water, 5 sites were selected as experimental sites (Figure 1b,c and Table 1). The sites were selected basing on their slope position, vegetation cover and the relative position to the collapsing gully. The sunny slope is at the eastern side of a collapsing gully, while the shady slope is at the back of the collapsing gully (Figure 1c). The comparison between sunny and shady slopes could explain the slope aspect selection of collapsing gullies’ development from the aspect of soil water movement. The Su-U-B site was located between the collapsing wall of the collapsing gully and the ridge of the slope. Here is the upslope of the collapsing wall and the direction of the headward erosion of the collapsing gully. There was little undergrowth vegetation at the upper position of the sunny slope. Thus, typical bare land was selected to represent the bare area in the upper position of sunny slope. The Su-M-B and Su-M-V sites are located at the eastern side of the collapsing gully (Figure 1c). Here would be the start of new collapsing gullies as many eroding gullies are observed, or it would be the direction of the side erosion of the collapsing gully. Bare land and vegetated land were selected to compare the effect of vegetation on the soil water movement on the slope.
At each site, ECH2O 5TE (Decagon Devices, Pullman, DC, USA) probes were installed at 5, 15, 30, 60 and 100 cm below the ground to automatically measure the volumetric soil water content (%) at 10 min intervals. The probes have been calibrated to make sure that there were no significant sensor-to-sensor variations, that there were no significant differences between the results of sensors and that they were measured by the traditional gravimetric method before they were installed to the soil profiles. The data of soil water content were checked according to the empirical calibration equation to attain approximately ±(1–2%) accuracy. The measurements of soil water content were carried out between 1 January 2017 and 31 December 2019 (note that the data of soil water content in some periods were missed due to a sensor malfunction).
The rainfall data were mainly extracted from Southern Station (Figure 1a) of the Flood Situation Release System of Guangdong Water Conservancy Department from 2017 to 2019. The missing rainfall data from August 2017 to June 2018 were all extracted from the Xingning sites (Figure 1a) of the China Meteorological Data Sharing Service System. A rainfall event was defined that there was at least six hours without rainfall occurring before rainfall beginning and after rainfall stopping.

2.3. Statistical Analyses

Differences in soil water content between different soil layers in the same site were analyzed using one-way analysis of variance (ANOVA) and Fisher’s protected least significant difference (LSD). Paired tests of the soil water content in the common data period of the five experimental sites were used to analyze the difference of the effect of the slope aspect, slope position, and vegetation on soil water. All statistical analyses were conducted using version 20.0 of the SPSS software (SPSS Inc., Chicago, IL, USA), where p < 0.05 indicated significant. Graphic plotting was generated with Origin Pro 2020 (Origin Lab, Northampton, MA, USA).
Soil water storage (SWS) was calculated as follows:
SWS0–120 cm = θ5 cm × 10 cm + θ15 cm × 12.5 cm + θ30 cm × 22.5 cm + θ60 cm × 35 cm + θ100 cm × 40 cm
where SWS0–120 cm is the soil water storage of the 0–120 cm soil layer (cm); and θ5cm, θ15 cm, θ30 cm, θ60 cm, θ100 cm represent the soil water content at the depths of 5, 15, 30, 60 and 100 cm, respectively.
Change in soil water storage (ΔSWS, cm) was calculated as follows:
ΔSWS = SWS2 − SWS1
where SWS1 is the soil water storage before a certain rainfall event, and SWS2 is the peak value of soil water storage after rainfall event. The change in SWS was used to characterize the supply capacity of rainfall to soil water.
The coefficient variation (CV) was calculated as follows:
CV = σ/μ × 100%
where σ is the standard deviation of the samples, and μ is the average value of soil samples, which reflects the dispersion of statistical samples. According to the CV, the variability of soil water can be classified as weak variation (CV ≤ 10%), medium variation (10% < CV < 100%) and strong variation (CV ≥ 100%).

3. Results

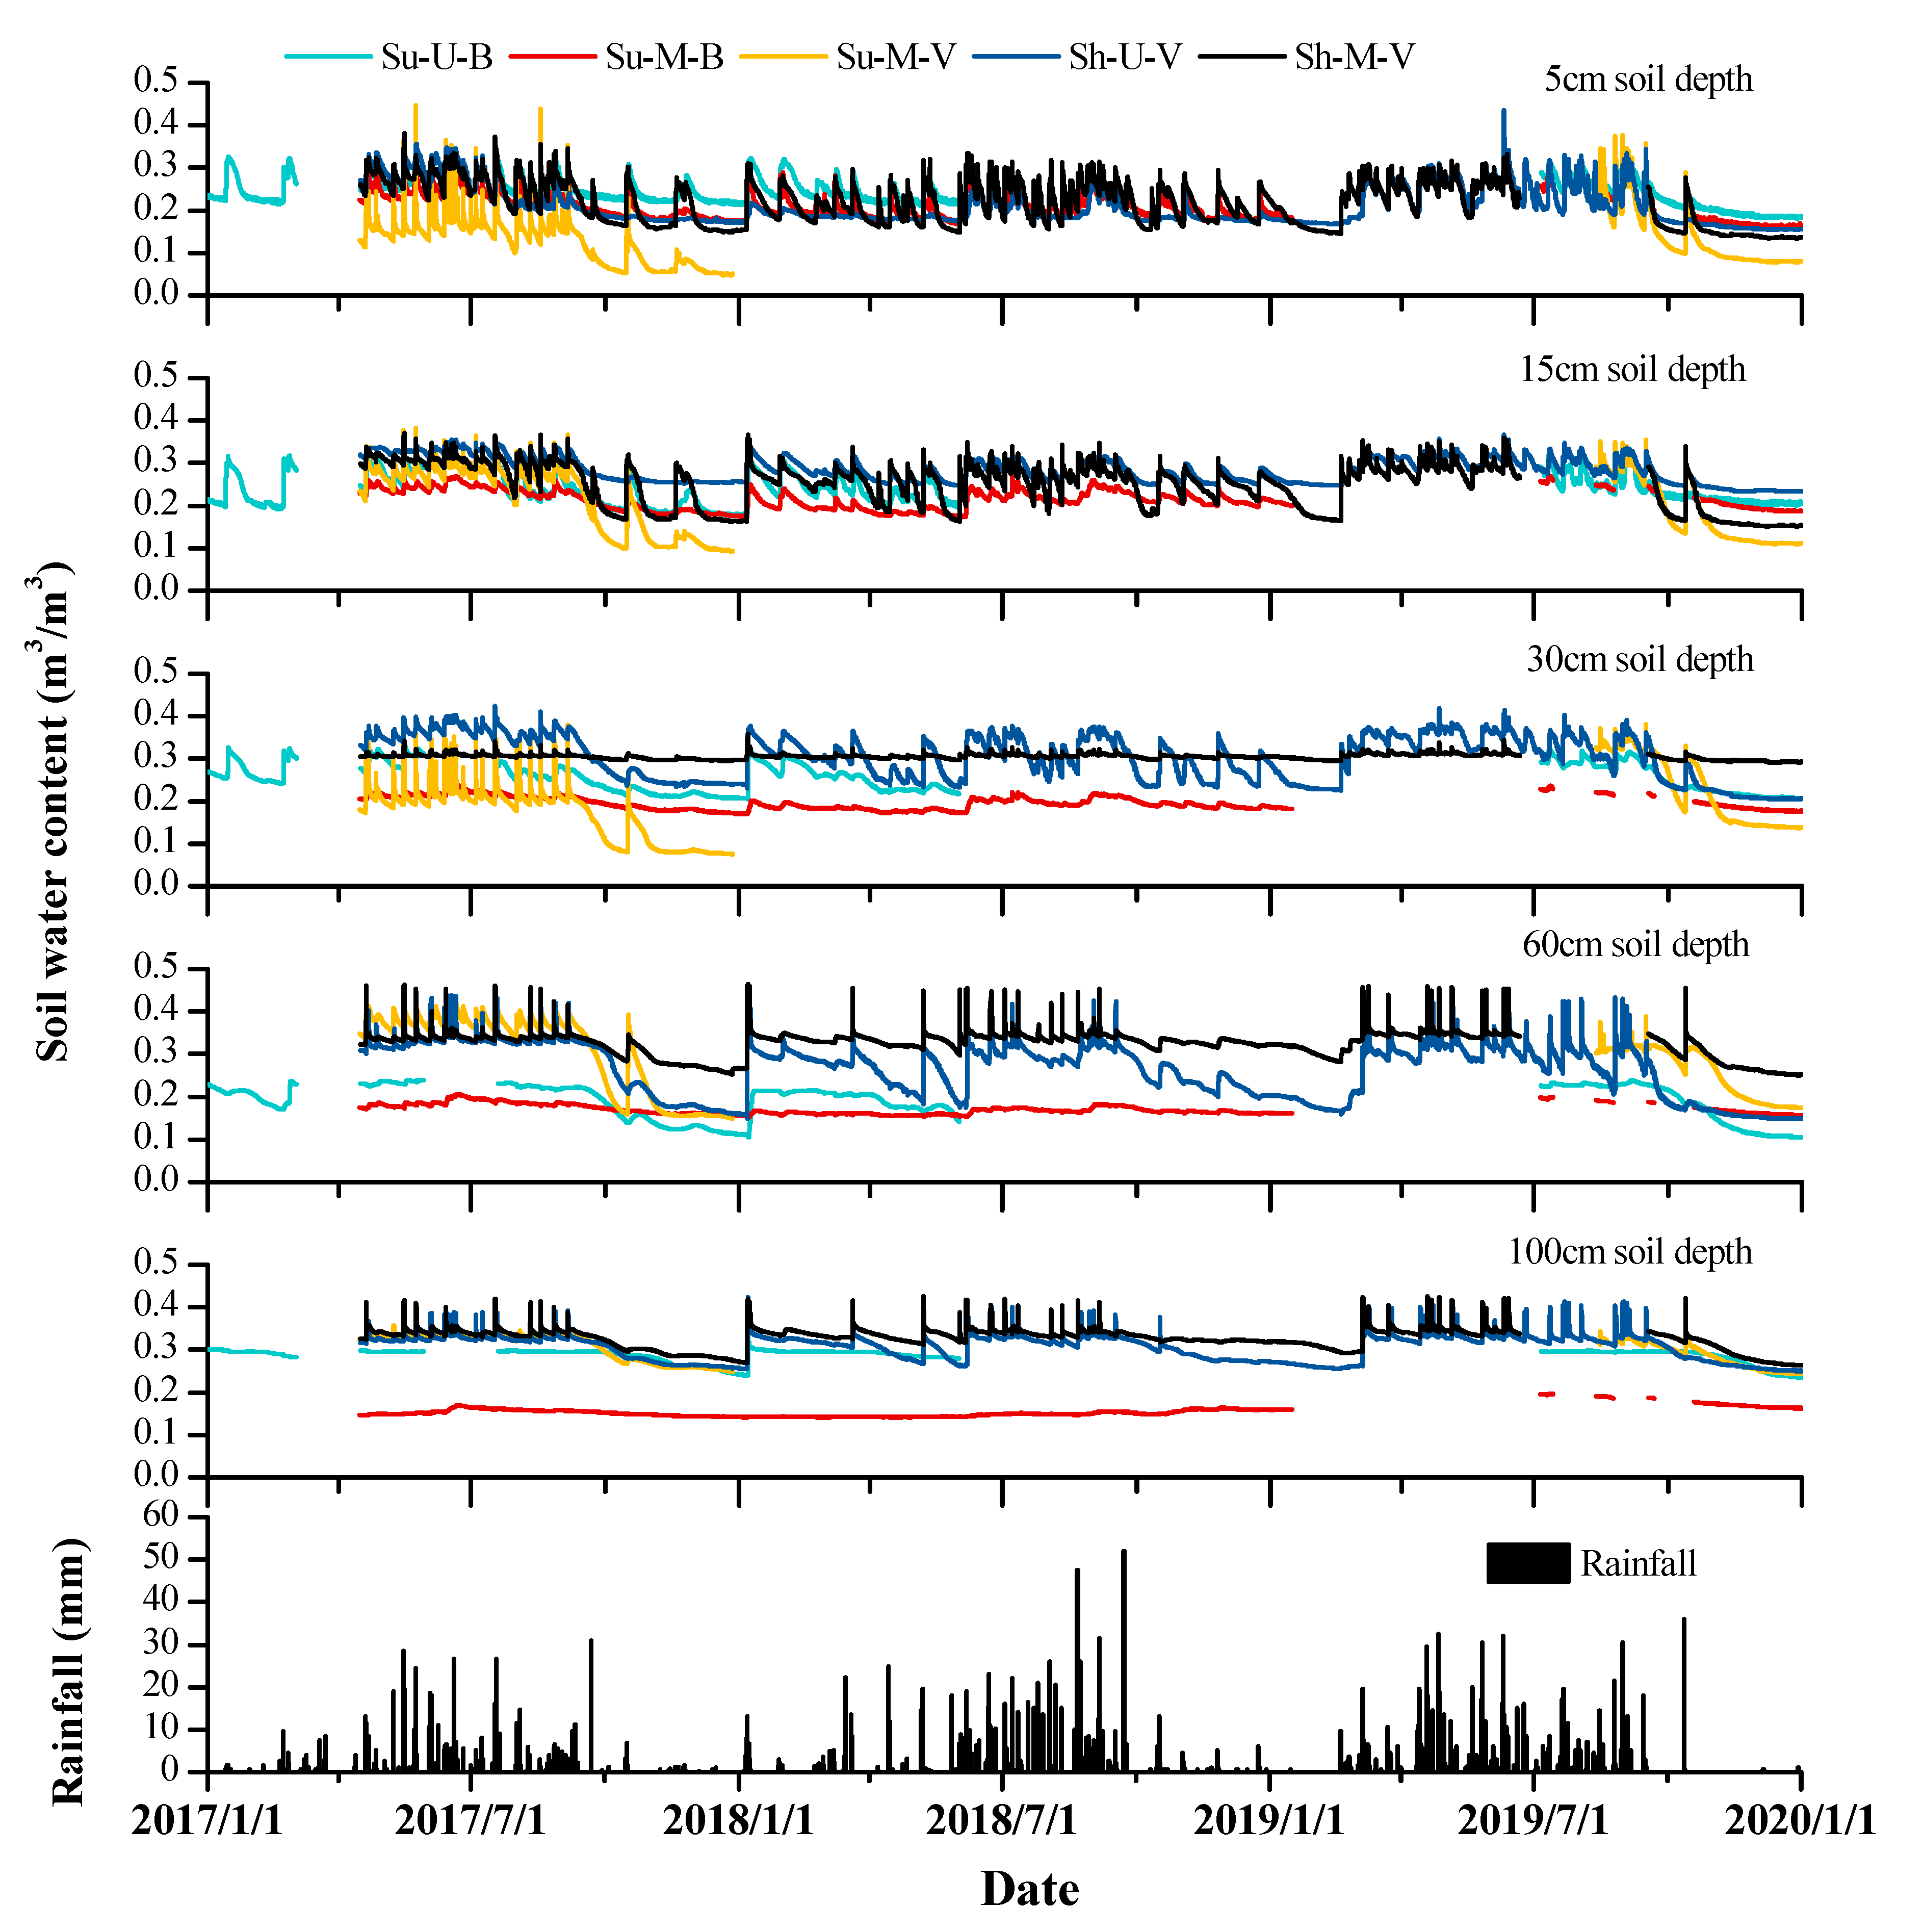
3.1. Dynamics of Soil Water

In the study area, the frequency of 0–10 mm rainfall events was the most, with an average frequency percentage of 65.9% during the three years (Table 2). The rainfall of 10–60 mm rainfall events contributed approximately 64.5% of the average annual rainfall, even though the frequency of 10–60 mm rainfall events was less than half of that in 0–10 mm. Although the frequency of >60 mm rainfall events was very low, the rainfall percentage of them could reach 22.2% of the average annual rainfall. The continuous measurements showed that the soil water dynamics in the collapsing gully were directly influenced by rainfall events from 2017 to 2019 (Figure 2). In general, the soil water in the surface soil layers (e.g., at depths of 5 cm, 15 cm and 30 cm) was more sensitive to rainfall than the deeper soils (>30 cm). The statistical analysis of soil water content (Table 3) also showed that the CVs of soil water in surfaces soils were higher than those in deeper soils. For example, CVs at 5 cm were higher than 14%, and as such belonged to a medium variation level.

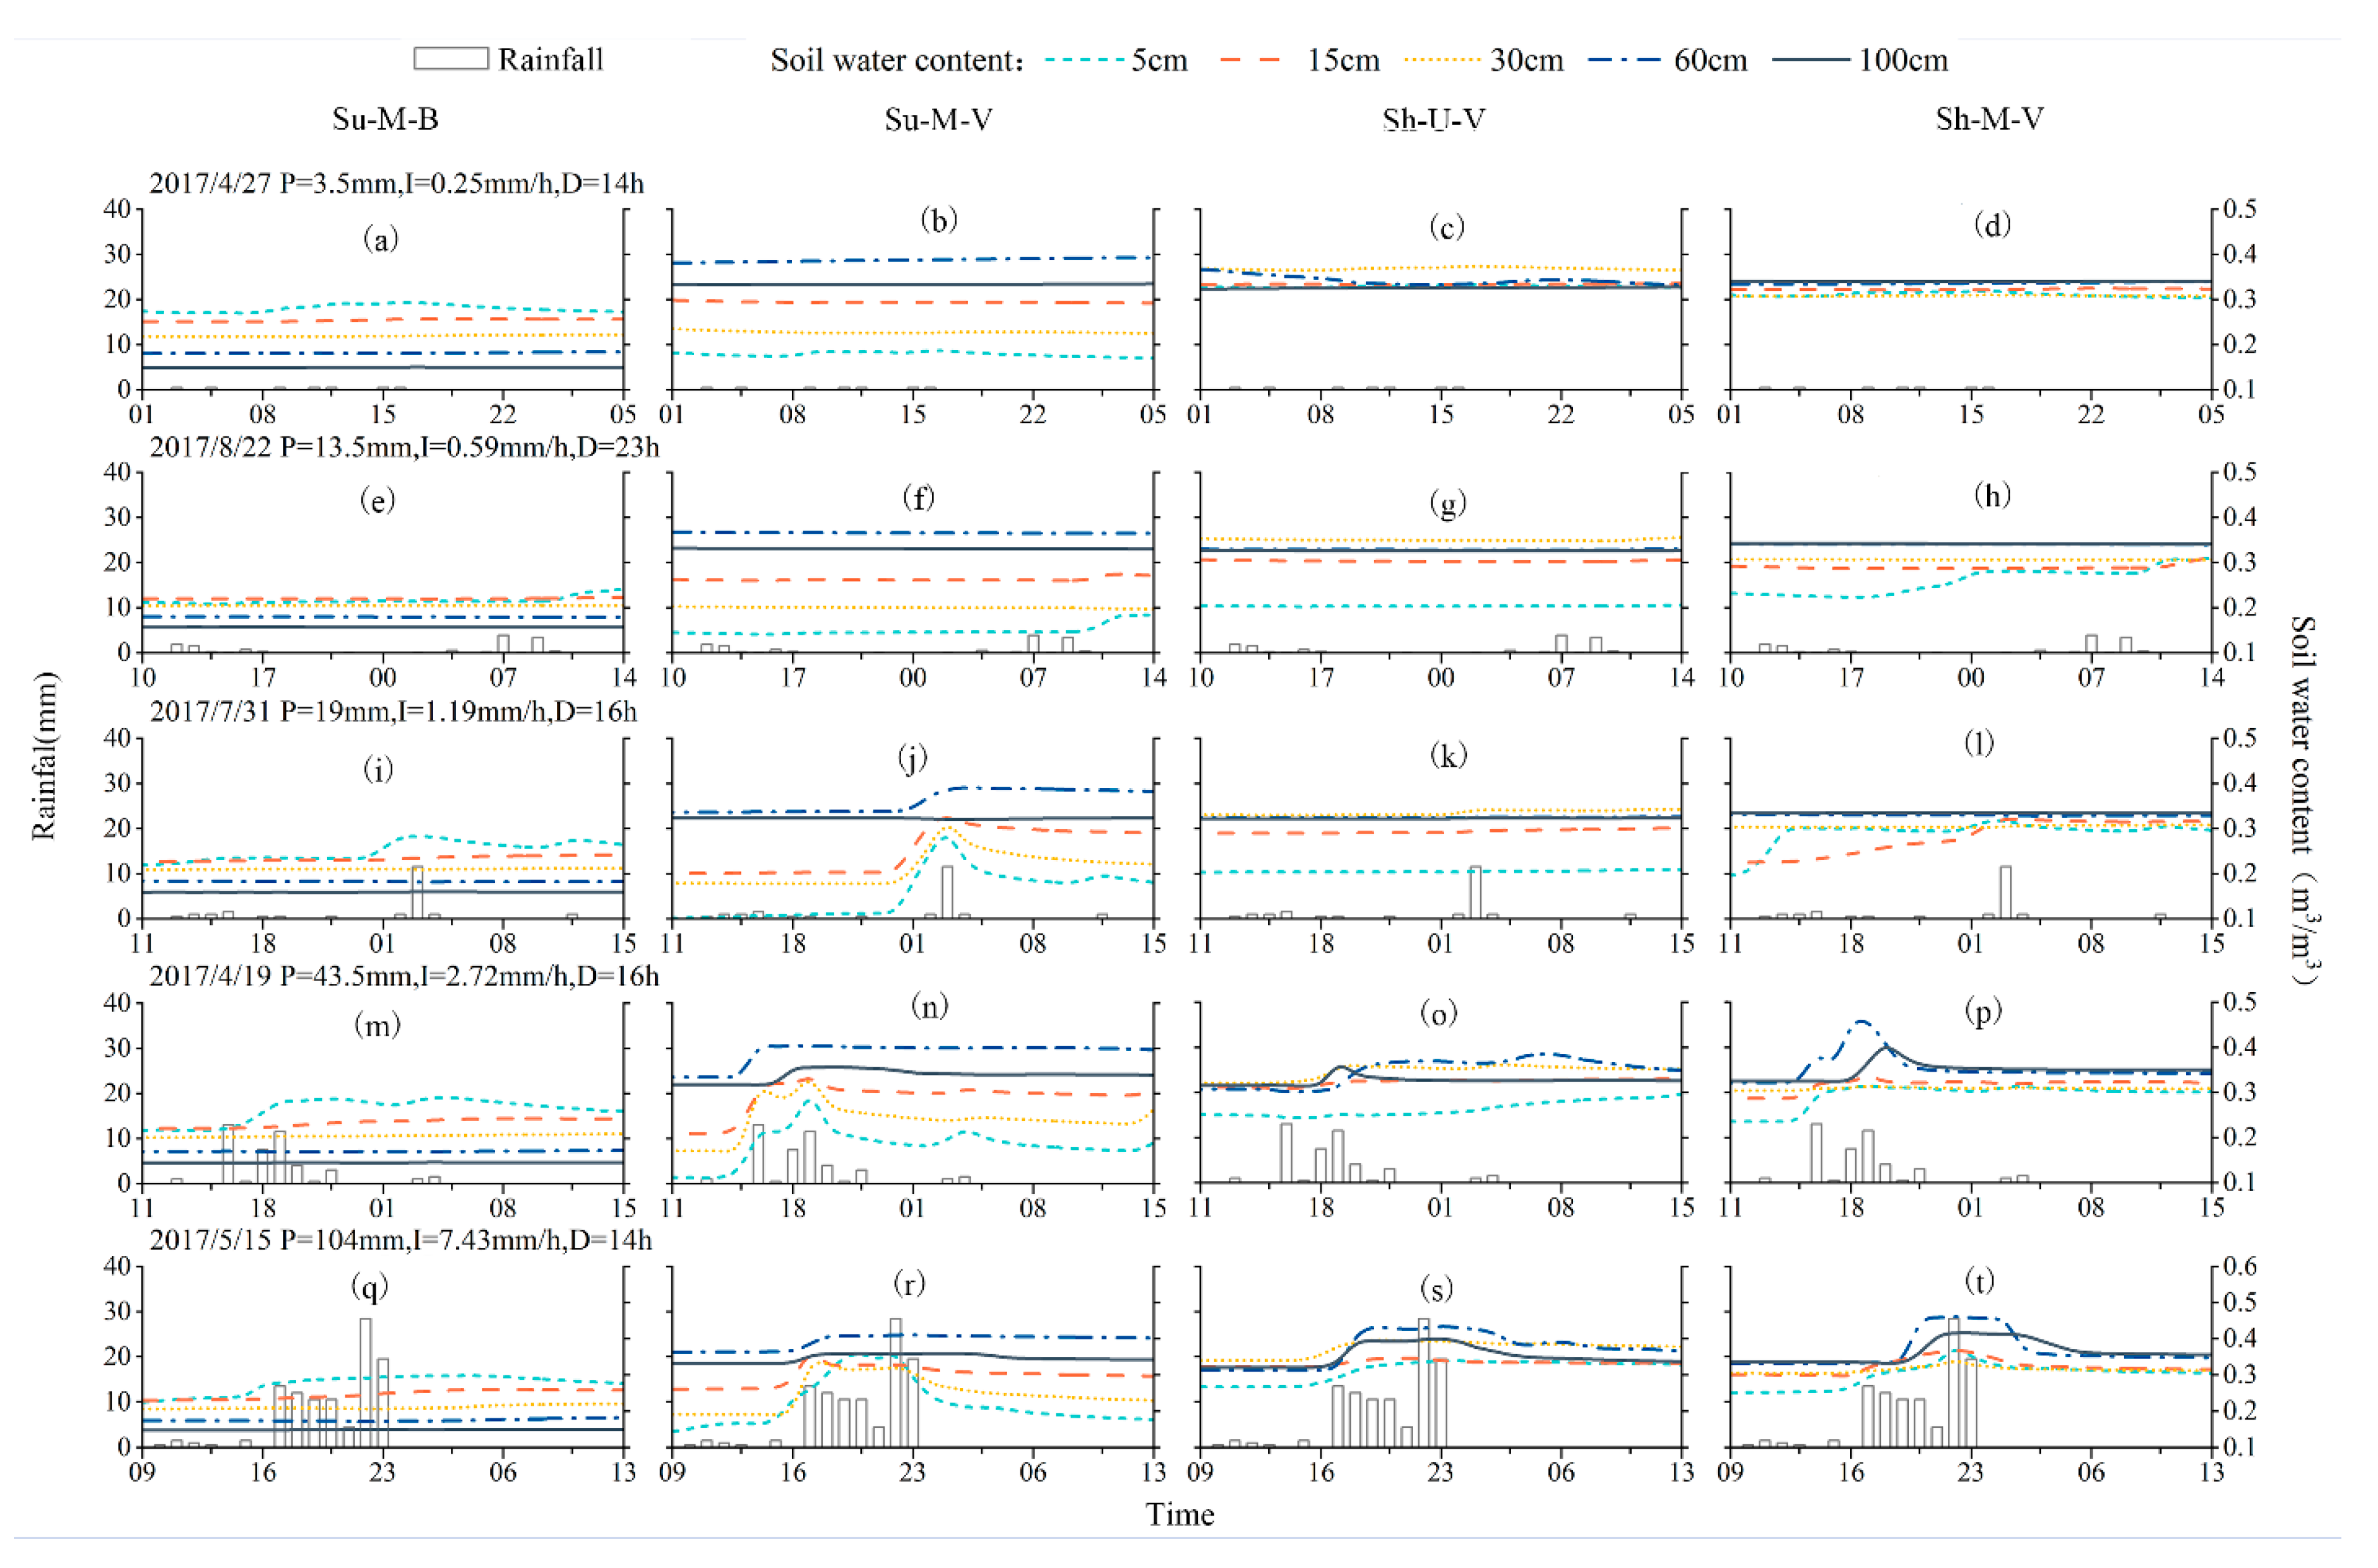
3.2. Responses of the Dynamics of Soil Water to Typical Rainfall Events

Five typical rainfall events were selected to analyze the responses of soil water in different slope aspects and positions to rainfall (Figure 3). In general, the responses were more obvious with increased rainfall. For example, there was no significant change in soil water at all soil depths of the five experimental sites when the rainfall was 3.5 and 13.5 mm (Figure 3a–h). However, when rainfall increased to 19 mm, the dynamics of soil water became significant (i–k). The responses of soil water contents in different slope aspects were inconsistent. For instance, the soil water content in the sunny slope showed an upward trend immediately after rainfall, while that in the shady slope only responded for a period of time after rainfall events of 43.5 and 104 mm (Figure 3n,p,r,t). In addition, soil water dynamics in the upper slope were different from those of the middle slope. The peak value of the soil water content in the middle slope lagged behind that of the upper slope, but its peak value was higher than that in the upper slope (Figure 3o,p,s,t). We observed that the soil content water in the area with vegetation coverage was higher, and that the change of soil water content to the rainfall response was larger, whereas that in the area with bare land was faster and earlier. When rainfall was 19, 43.5 and 104 mm (Figure 3i,j,n,m,q,r), the response of the soil water content in the Su-M-V site to rainfall events was more obvious than that in the Su-M-B site, and the change in soil water was more significant.

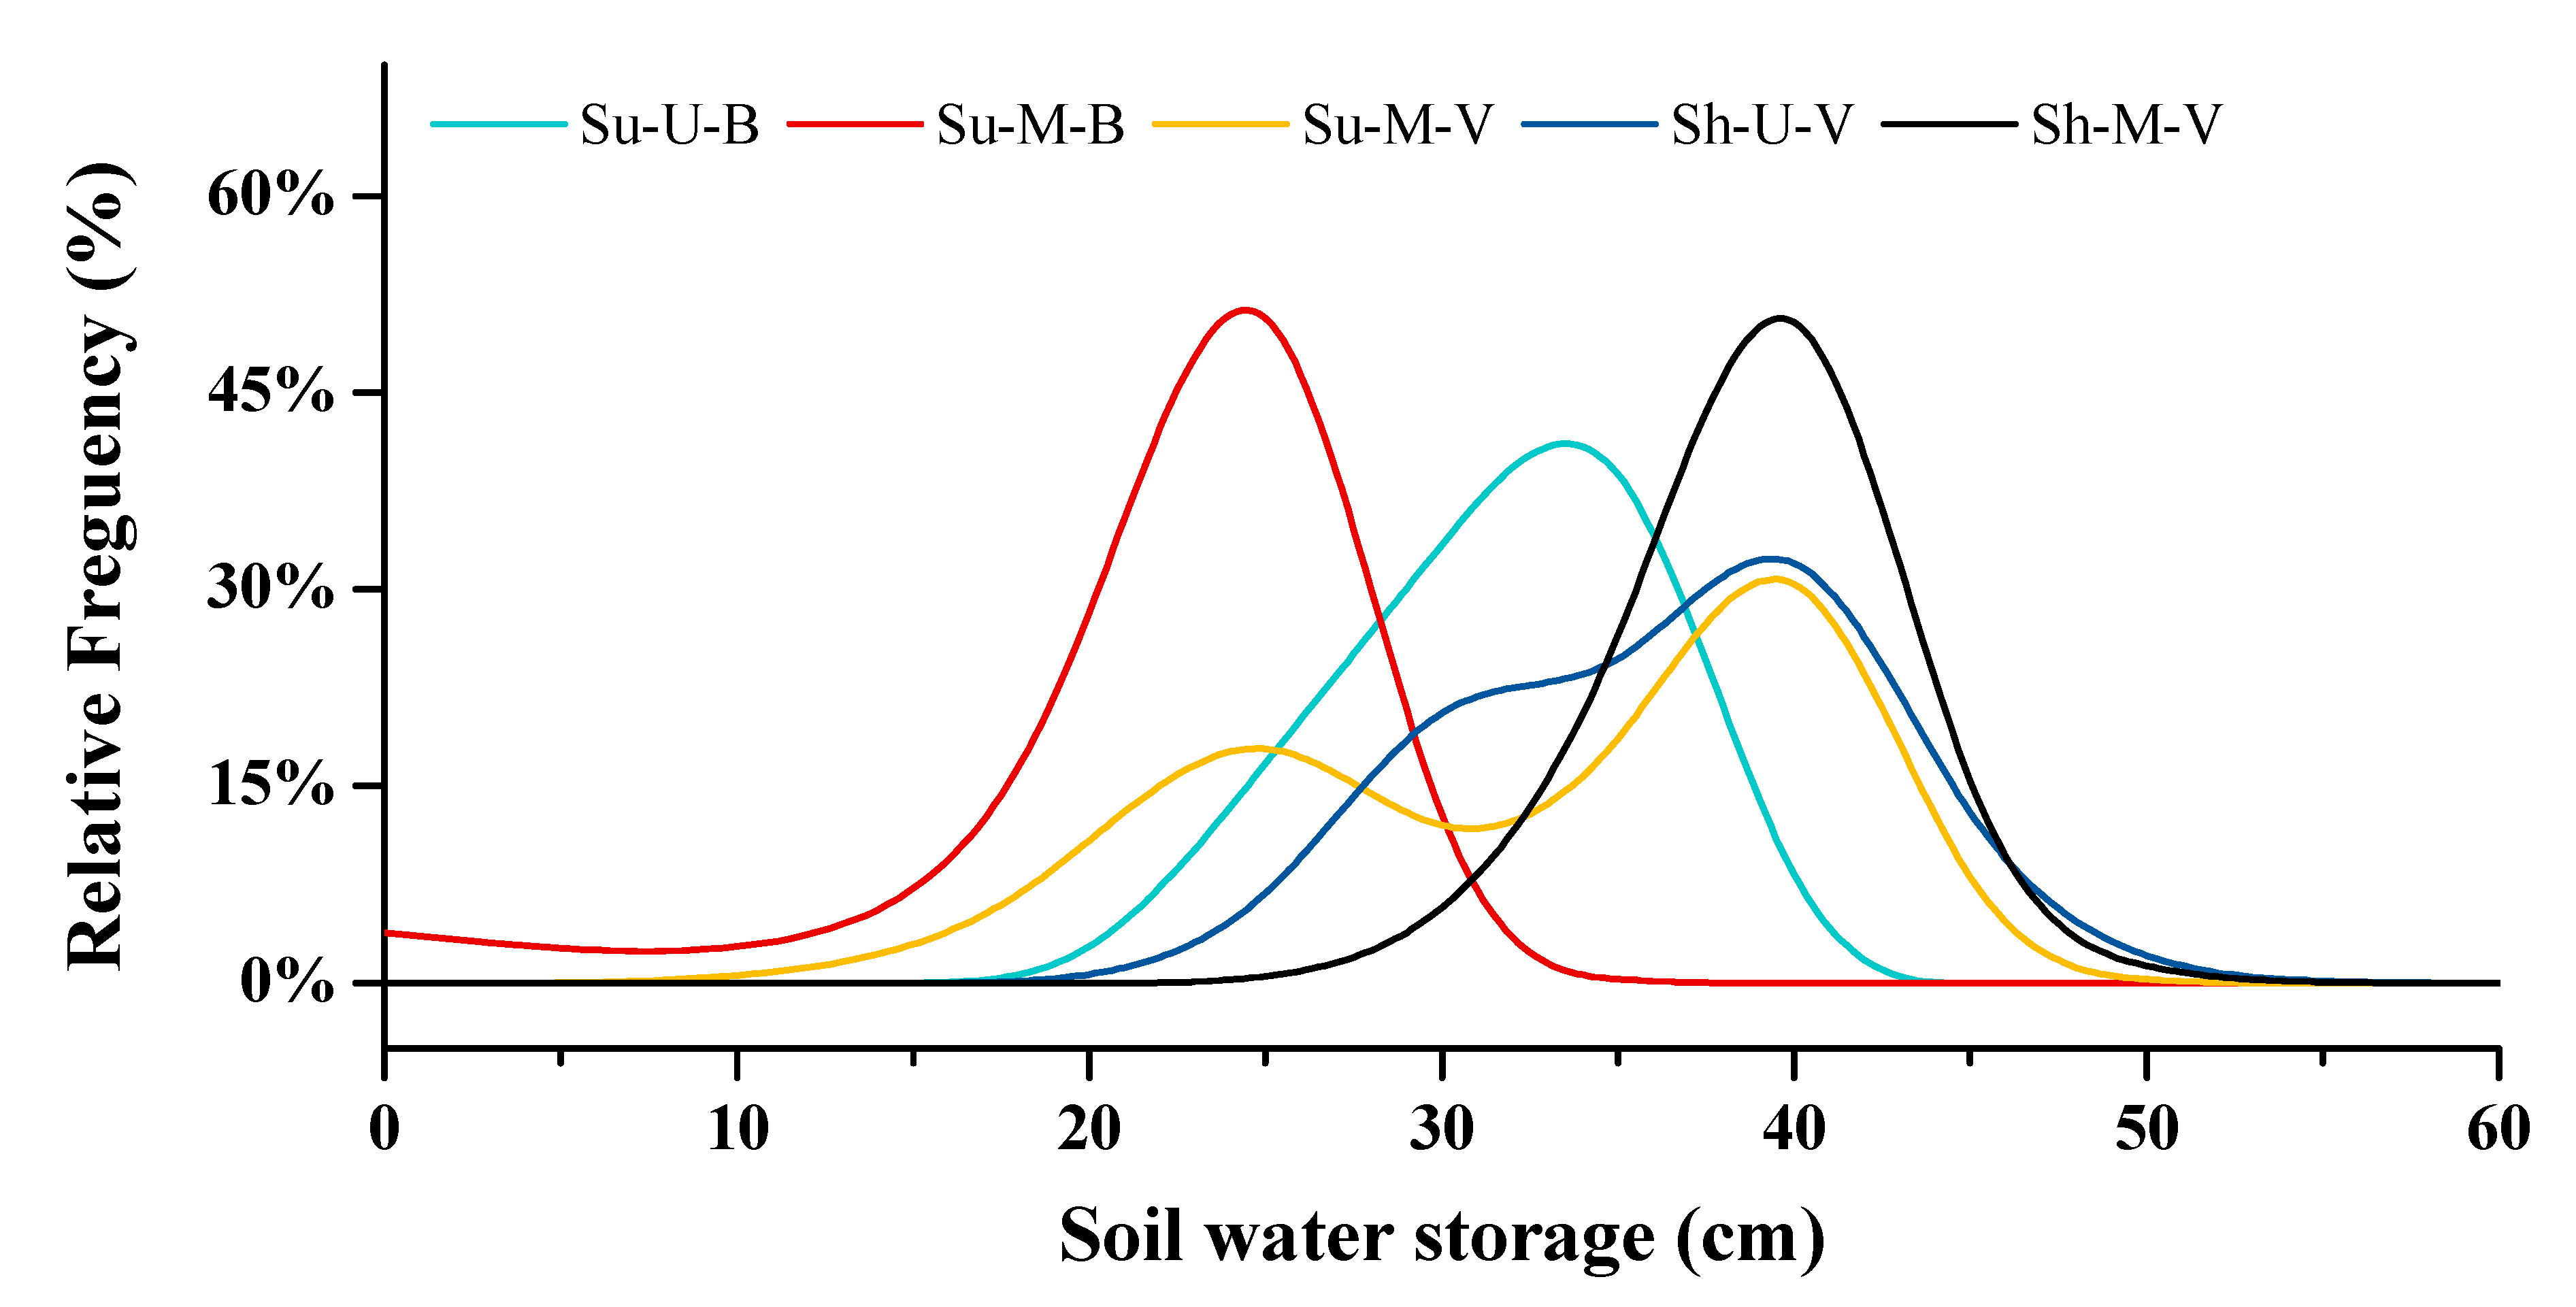
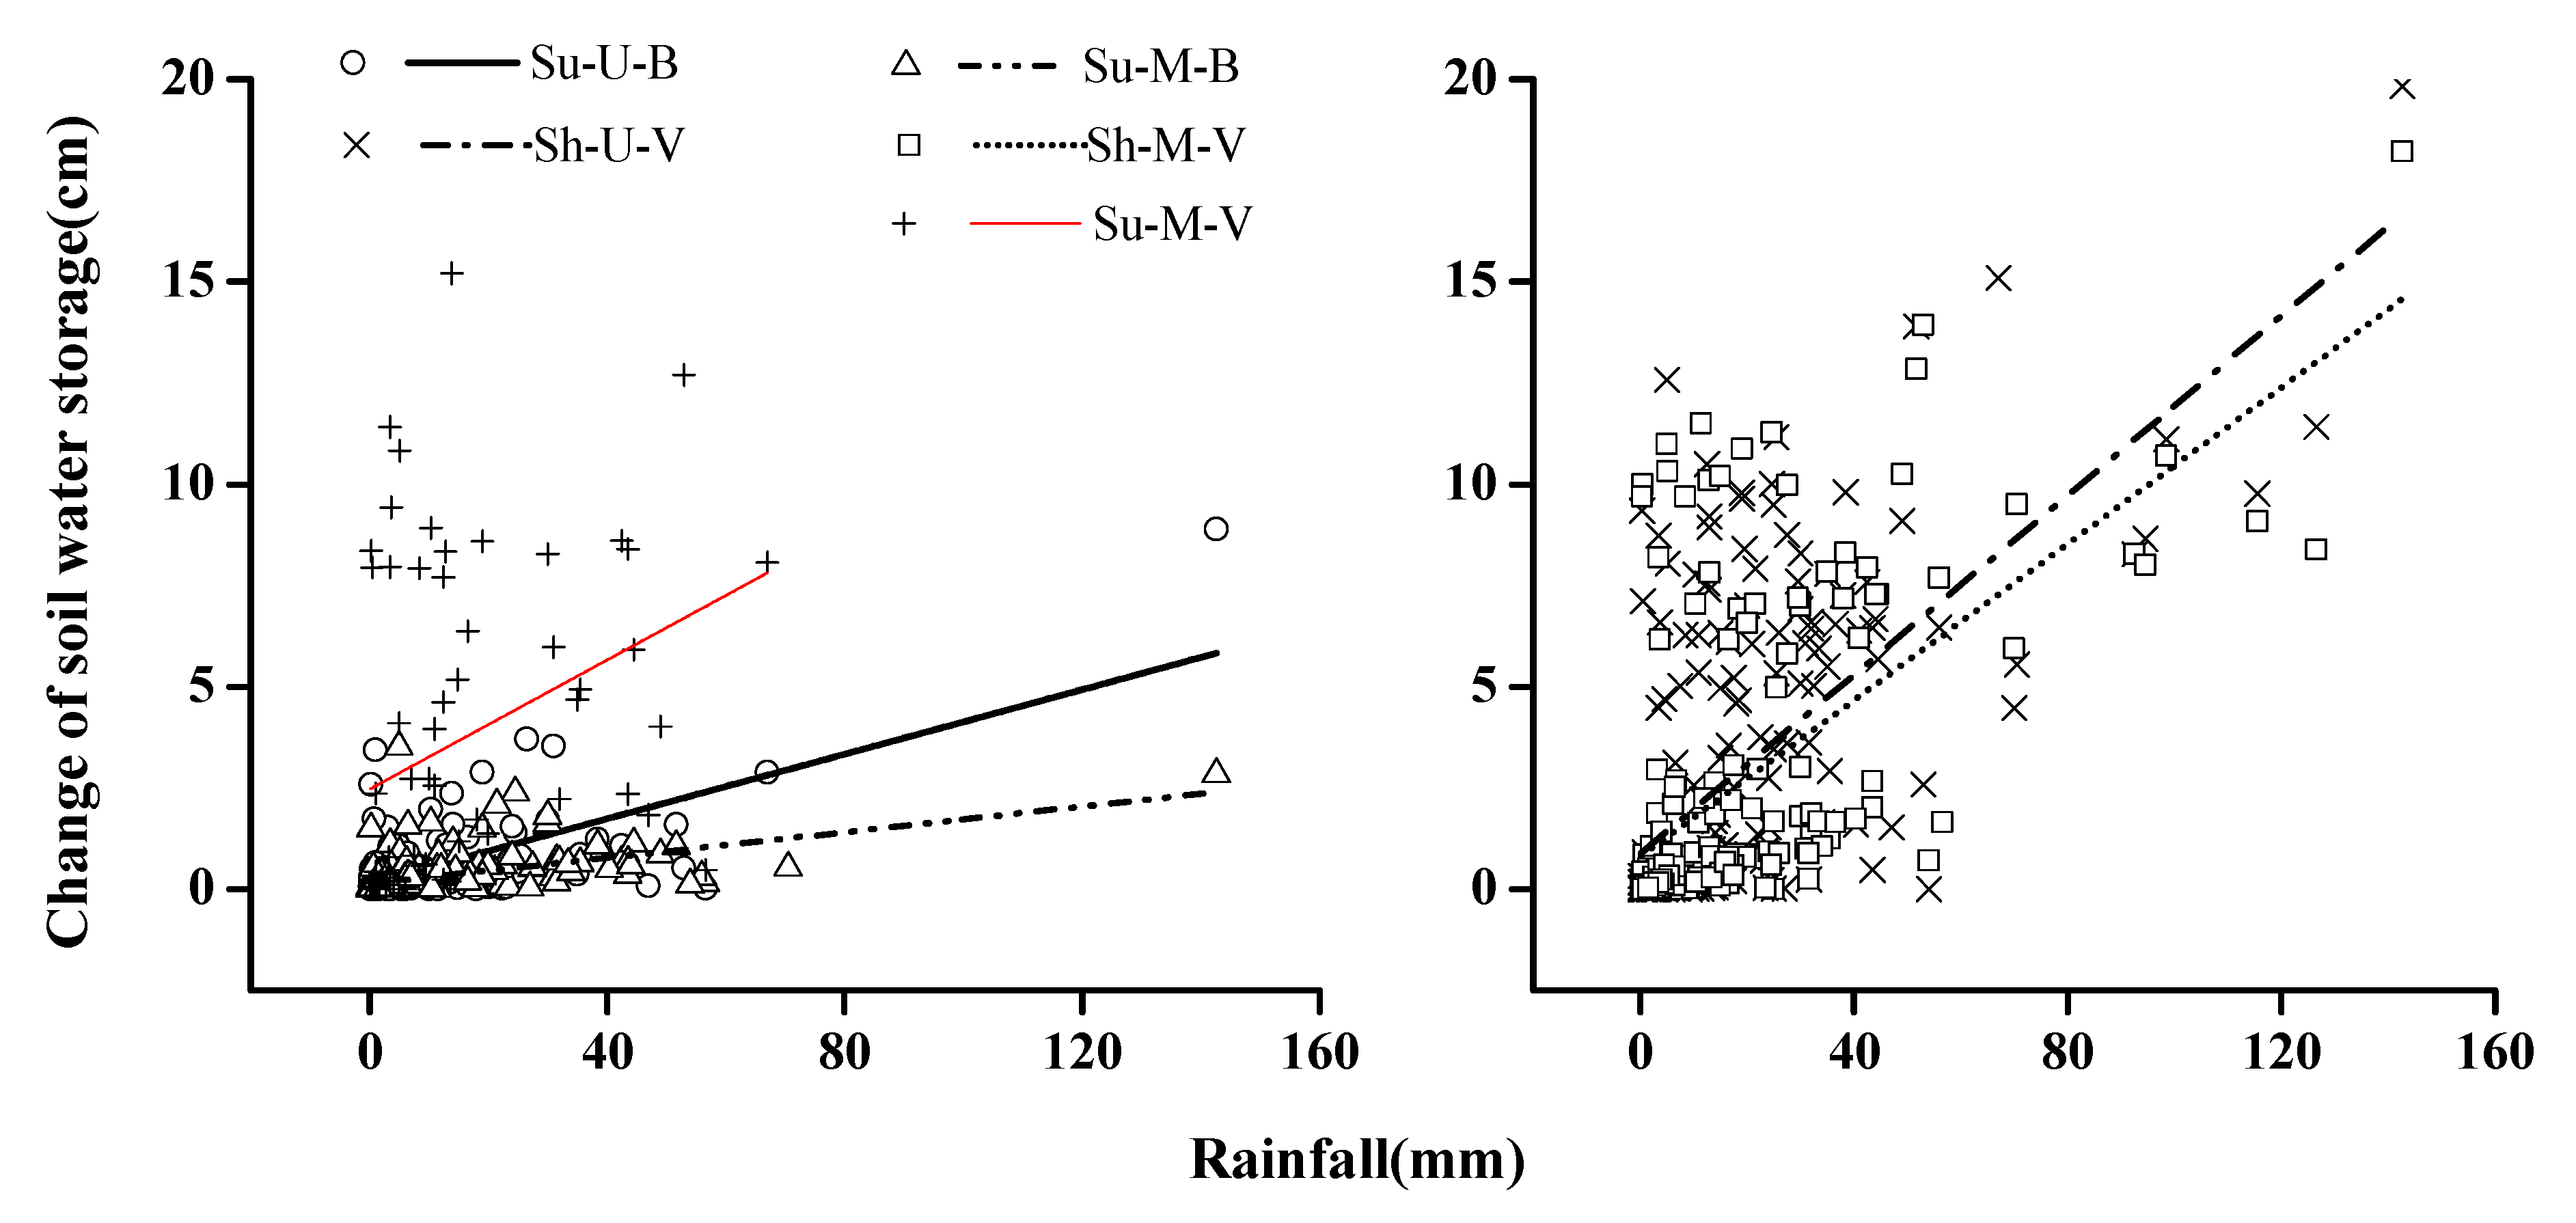
3.3. Soil Water Storage

The relative frequency of soil water storage (Figure 4) showed that more than 90% of soil water storage in all sites ranged from 10 to 50 cm during the experimental periods. In particular, the middle slope in the shady aspect displayed the highest soil water storage, almost all the ranging from 30 to 50 cm. By contrast, the middle slope in the sunny aspect was the lowest, mainly ranging from 15 to 30 cm. The results of statistical analysis (Table 4) showed that the average soil water storage in the Sh-M-V site was the highest (31.94 cm), but lowest in Su-M-B (21.17 cm). Moreover, the difference in soil water storage of the two slope aspects was significant (p < 0.05). Similarly, there were also significant differences in soil water storage of different slope positions and vegetation conditions (p < 0.05).
The response of soil water storage to rainfall (Figure 5) showed that the correlation relationship between the changes of soil water storage and rainfall was significant in all of the experimental sites (p < 0.05) except the middle position of the sunny slope with vegetation. From the linear fit (4)–(8), the gradient ratio of Equation (7) was the highest, which meant the sensitivity of soil water storage in the upper position of the shady slope was highest. The gradient ratio of Equation (5) was the lowest, meaning the lowest sensitivity occurred in the Su-M-B site.
ΔSWSSu-U-B = 0.146 + 0.039P, R2 = 0.430, p < 0.05
ΔSWS Su-M-B = 0.148 + 0.015P, R2 = 0.263, p < 0.05
ΔSWSSu-M-V = 2.472 + 0.079P, R2 = 0.117, p > 0.05
ΔSWSSh-U-V = 0.872 + 0.111P, R2 = 0.425, p < 0.05
ΔSWSSh-M-V = 0.807 + 0.097P, R2 = 0.363, p < 0.05
where ΔSWS represents change of soil water storage; p means rainfall.

4. Discussion

The dynamic behavior of soil water to rainfall events showed that the response time in the shady slope was delayed in comparison to that of the sunny slope (Figure 3). This was mainly because of the dense vegetation cover along the shady slope (Table 1), which intercepted rainfall into the canopy for evapotranspiration [25]. This partitioning process of the vegetation canopy suspended the incorporation of rainfall into soil and reduced the static energy of the raindrops, thus mitigating surface soil erosion [26]. It has been reported that the infiltration properties (e.g., soil hydraulic conductivity, soil organic matter and soil aggregation) of the shady slopes are generally higher than those of the sunny slopes, promoting more rainfall into the soil [27,28]. For example, Martínez-Murillo et al. [29] found that the capacity of shady slopes to repel soil water is relatively lower than that of the sunny slopes, facilitating rainwater penetration into the soil and maintaining wet soil conditions. The increases of soil water storage in the shady slope were, thus, significantly higher than those of the sunny slope after rainfall events (Figure 5). In addition, the solar radiation in the shady slope was relatively lower than that of the sunny slope, which would contribute to less soil evaporation [30]. The soil water storage in the shady slope was, therefore, higher than that of the sunny slope (Table 4), which is consistent with most previous studies [27]. The significant higher vegetation coverage associated with greater clay content (Table 1) was also considered to be one of the critical factors for shady slopes to conserve higher water content compared to sunny slopes. Gabarrón-Galeote et al. [23] showed that plant density was three times higher in the shady slope compared to the sunny slope, and this phytomass would contain a higher amount of water, leading to significantly more accumulation in the shady slope.
Our study found that the responses of soil water dynamics to rainfall in different slope positions were dependent on the slope aspects (Figure 3). In the shady slope, the response time of soil water in the middle slope to rainfall lagged compared to that in the upper slope, and vice versa for the peak values of soil water (Figure 3). This was mainly related with the redistribution process of rainfall water on the slope [2,31]. Runoff can be generated easily from the upper to the middle position after intensive rainfall events, and soil water in the lower positions is then increased due to the accumulation of runoff by the vegetation patches [32,33]. For example, Fan et al. [34] demonstrated that soil water storage in the lower positions (e.g., valley floors and swales) was significantly higher than on the upper positions, based on three years of continuous measurements in a forested catchment. In contrast, in the sunny slope, our results showed that soil water in the upper position was higher than that in the middle position (Table 4). Tao et al. [16] also found the soil water content in the upper part maintained a high level (0.3 to 0.4 m3/m3) compared with that in the lower part (0.15 to 0.25 m3/m3). This was mainly because soil erosion in the lower position was stronger than in the upper position [35]. The intensive water erosion will carry off the fine particles and organic matter of the soil, leading to soils with low organic content, porosity and infiltrating properties [36]. Our result showed that the soil clay content in the middle slope with bare area was only 5.49%, significantly lower than that in the upper slope position (Table 1). Rainwater then has difficulty infiltrating the soil, with less contribution to soil water in the lower slope positions. The weight of the soil column decreases from the upper slope to the lower slope due to the distribution of soil water, which will promote the generation of collapsing erosion [37].
Vegetation cover has been found to be a critical factor in determining the dynamics and spatial patterns of soil water [32,38,39]. In this study, the results showed that soil water content under vegetation cover was significantly higher than that under a bare area with the same slope aspects and positions (Figure 4 and Table 4). This was mainly because vegetation cover could alter the source-sink of rainwater distribution and improve soil resistance to concentrated flow erosion through the interactive effects of the root system and soil properties [40,41]. The soil clay content under vegetation area was significantly higher than that of bare area (Table 1). The stems and roots of plants not only increase the roughness of the surface soil and decrease flow velocity [42], but also improve the soil infiltrating properties to allow more rainwater into the soil [43]. For example, Zhang et al. [13] found that the restoration of plants Melinis minutifora and Chrysopogon zizanioides could effectively decrease flow velocities by 35.3% and 29.5%, and increase friction coefficients by 239.6% and 130.8%, respectively, compared to control treatments in a collapsing gully in southern China. However, in bare areas, soil hydraulic properties are relatively lower due to the impact from raindrops on the surface soil [44]. Raindrop impact can break the bonds connecting the soil particles and break down macro-aggregates, which may seal the soil surface by compacting and clogging the pores, resulting in lower infiltration and causing runoff and soil erosion [45,46].
The differences in the dynamics and storage of soil water between areas with vegetation cover and bare area with wet and dry cycles in the slope have been considered critical factors influencing slope stability [47]. They can even lead to collapsing erosion and landslides [1,37,48]. In this study, a mixed landscape with vegetation patches and bare areas were obvious in the middle position of the sunny slope, and the landscape was almost completely bare in the upper position (Figure 1 and Table 1). During wet periods, vegetation generally has a mitigating effect on soil erosion since plants can protect the soil surface from rain or runoff detachment and reduce runoff velocity and sediment transport by intercepting raindrops, increasing soil permeability and soil surface roughness and reinforcing soil mass stability [49]. Zhang et al. [24] also found that the plants of M. minutifora and C. zizanioides in the same study area could effectively reduce the soil sediment yield rate on steep colluvial deposits by 98.1% and 86.6%, respectively. The differences of soil water and soil hydraulic properties (e.g., soil infiltration capacity, soil shear resistance and soil aggregation) between vegetation cover areas and bare areas will accelerate the processes of soil erosion and collapse [17,50]. Therefore, attention should be paid to the bare areas in the middle positions of the sunny slopes, which suffer intensive erosion and would be the source for the generation of a collapsing gully. Vegetation restoration should, thus, be considered as an effective approach to control soil erosion, in that it affects soil detachment and resistance to water flow [41]. This is an important direction for the future work.

5. Conclusions

This study found that the dynamics and storage of soil water varied with the slope aspect, slope position and vegetation cover. Specifically, the response time of soil water to the intensive rainfall events on the sunny slope was shorter than on the shady slope, while the soil water storage in the sunny slope (27.91 ± 7.04 cm) was significantly lower than in the shady slope (34.71 ± 3.70 cm). For the different slope positions, the response time of soil water to intensive rainfall events on the upper slope was shorter than on the middle slope, while the soil water storage in the middle slope was significantly higher than in the upper slope. This was mainly because of the redistribution runoff from the upper slope to the middle slope, slowing the process by which rainwater infiltrated the soil layers. Moreover, vegetation significantly allayed the dynamics of soil water to intensive rainfall events, but increased the storage of soil water, owing to the protection of soil surface from rain and conservation of high soil clay content. The bare area in the middle position of the sunny slope was speculated to be the potential source of the collapsing gully, as it lacked the cover of vegetation. We expect that these findings will be helpful for understanding the mechanisms of the generation processes of collapsing gullies, and for optimizing soil conservation and managing erosion not only in southern China but also worldwide.

Author Contributions

Conceptualization, S.-Y.Z., Z.-Y.J., and B.H.; methodology, Z.-Y.J., X.-D.W., and S.-Y.Z.; validation, Z.-Y.J., and F.-L.K.; data curation, X.-D.W., D.F., and Y.-C.Z.; writing—original draft preparation, Z.-Y.J., X.-D.W., and S.-Y.Z.; writing—review and editing, Z.-Y.J., B.H., and X.-L.Z.; supervision, Z.-Y.J., and B.H.; project administration, S.-Y.Z., and B.H.; funding acquisition, Z.-Y.J., and S.-Y.Z.; All authors have read and agreed to the published version of the manuscript.

Funding

The study was financially supported by the National Natural Science Foundation of China (Grant No. 41977010, 41930865, and 41901027), the GDAS’ Project of Science and Technology Development (Grant No. 2020GDASYL-20200402003, 2020GDASYL-20200102013, 2020GDASYL-20200301003, 2020GDASYL-20200302007, and 2019GDASYL-0102002), Guangdong Foundation for Program of Science and Technology Research (Grant No. 2019B121205006, 2019B121201004, and 2018A030310517), and a project funded by China Postdoctoral Science Foundation (Grant No. 2018M643110).

Conflicts of Interest

The authors declare no conflict of interest.

References

  1. Xu, J.X. Benggang erosion: The influencing factors. Catena 1996, 27, 249–263. [Google Scholar]
  2. Liu, X.L.; Qiu, J.N.; Zhang, D.L. Characteristics of slope runoff and soil water content in benggang colluviums under simulated rainfall. J. Soils Sediments 2018, 18, 39–48. [Google Scholar] [CrossRef]
  3. Voarintsoa, N.R.G.; Cox, R.; Razanatseheno, M.O.M.; Rakotondrazafy, A.F.M. Relation between bedrock geology, topography and lavaka distribution in Madagascar. S. Afr. J. Geol. 2012, 115, 225–250. [Google Scholar] [CrossRef]
  4. Bacellar, L.A.P.; Netto, A.L.C.; Lacerda, W.A. Controlling factors of gullying in the Maracujá Catchment, Southeastern Brail. Earth Surf. Process. Landf. 2005, 30, 1369–1385. [Google Scholar] [CrossRef]
  5. Moretti, S.; Rodolfi, G. A typical “calanchi” landscape on the Eastern Apennine margin (Atri, Central Italy) geomorphological features and evolution. Catena 2000, 40, 217–228. [Google Scholar] [CrossRef]
  6. Liu, C.; Li, Z.W.; Chang, X.F.; He, J.J.; Nie, X.D.; Liu, L.; Xiao, H.B.; Wang, D.Y.; Peng, H.; Zeng, G.M. Soil carbon and nitrogen sources and redistribution as affected by erosion and deposition processes: A case study in a loess hilly-gully catchment, China. Agric. Ecosyst. Environ. 2018, 253, 11–22. [Google Scholar] [CrossRef]
  7. Bennett, S.J.; Wells, R.R. Gully erosion processes, disciplinary fragmentation, and technological innovation. Earth Surf. Process. Landf. 2019, 44, 46–53. [Google Scholar] [CrossRef] [Green Version]
  8. Liang, Y.; Ning, D.; Pan, X. Characteristics and management of Benggang in red soil region of southern China. Soil Water Conserv. China 2009, 1, 31–34, (In Chinese with English Abstract). [Google Scholar]
  9. Liao, Y.S.; Zheng, M.G.; Li, D.Q.; Wu, X.L.; Liang, C.; Nie, X.D.; Huang, B.; Xie, Z.Y.; Yuan, Z.J.; Tang, C.Y. Relationship of benggang number, area, and hypsometric integral values at different landform developmental stages. Land Degrad. Dev. 2020. [Google Scholar] [CrossRef]
  10. Gallart, F.; Marignani, M.; Pérez-Gallego, N.; Santi, E.; Maccherini, S. Thirty years of studies on badlands, from physical to vegetational approaches: A succinct review. Catena 2013, 106, 4–11. [Google Scholar] [CrossRef]
  11. Boardman, J. Soil erosion science: Reflections on the limitations of current approaches. Catena 2006, 68, 73–86. [Google Scholar] [CrossRef]
  12. Liao, Y.S.; Yuan, Z.J.; Zhuo, M.N.; Huang, B.; Nie, X.D.; Xie, Z.Y.; Tang, C.Y.; Li, D.Q. Coupling effects of erosion and surface roughness on colluvial deposits under continuous rainfall. Soil Tillage Res. 2019, 191, 98–107. [Google Scholar] [CrossRef]
  13. Zhang, S.Y.; Li, C.; Huang, B.; Liu, T.; Guo, T.L.; Yuan, Z.J.; He, B.; Li, D.Q. Flow hydraulic responses to near-soil surface components on vegetated steep red soil colluvial deposits. J. Hydrol. 2020, 582, 124527. [Google Scholar] [CrossRef]
  14. Jiang, F.S.; Huang, Y.H.; Wang, M.K.; Lin, J.S.; Zhao, G.; Ge, H.L. Effects of rainfall intensity and slope gradient on steep colluvial deposit erosion in Southeast China. Soil Sci. Soc. Am. J. 2014, 78, 1741–1752. [Google Scholar] [CrossRef]
  15. Wang, C.C.; Zhang, Y.Q.; Xu, Y.C.; Yang, Q.C. Is the “ecological and economic approach for the restoration of collapsed gullies” in Southern China really economic? Sustain. Sci. 2015, 7, 10308–10323. [Google Scholar] [CrossRef] [Green Version]
  16. Tao, Y.; He, Y.B.; Duan, X.Q.; Zou, Z.Q.; Lin, L.R.; Chen, J.Z. Preferential flows and soil moistures on a Benggang slope: Determined by the water and temperature co-monitoring. J. Hydrol. 2017, 553, 678–690. [Google Scholar] [CrossRef]
  17. Zhang, S.G.; Zhong, C.Z. The mechanism and types of the hillockcollapsing forming in Guangdong province. Bull. Soil Water Conserv. 1990, 10, 8–16, (In Chinese with English Abstract). [Google Scholar]
  18. Liu, H.H.; Ling, X.C. Characteristics of slope Benggang and its monitoring technology in Southern China. Sci. Soil Water Conserv. 2011, 3, 31–34, (In Chinese with English Abstract). [Google Scholar]
  19. Glaoss, R.J.; Nicholl, M.J.; Pringle, S.E.; Wood, T.R. Unsaturated flow through a fracture-matrix network: Dynamic preferential pathways in mesoscale laboratory experiments. Water Resour. Res. 2002, 38, 1–17. [Google Scholar] [CrossRef] [Green Version]
  20. Deng, Y.S.; Ding, S.W.; Liu, C.M.; Xia, D.; Zhang, X.M.; Lv, G.A. Soil moisture characteristics of collapsing gully wall in granite area of southeastern Hubei. J. Soil Water Conserv. 2015, 29, 132–137. [Google Scholar]
  21. Farrick, K.K.; Branfireun, B.A. Soil water storage, rainfall and runoff relationships in a tropical dry forest catchment. Water Resour. Res. 2014, 50, 9236–9250. [Google Scholar] [CrossRef]
  22. Ziadat, F.M.; Taimeh, A.Y. Effect of rainfall intensity, slope, land use and antecedent soil moisture on soil erosion in an arid environment. Land Degrad. Dev. 2013, 24, 582–590. [Google Scholar] [CrossRef]
  23. Gabarrón-Galeote, M.A.; Ruiz-Sinoga, J.D.; Quesada, M.A. Influence of aspect in soil and vegetation water dynamics in dry Mediterranean conditions: Functional adjustment of evergreen and semi-deciduous growth forms. Ecohydrology 2013, 6, 241–255. [Google Scholar] [CrossRef]
  24. Zhang, S.Y.; Zhuo, M.N.; Xie, Z.Y.; Yuan, Z.J.; Wang, Y.T.; Huang, B.; Liao, Y.S.; Li, D.Q.; Wang, Y. Effects of near soil surface components on soil erosion on steep granite red soil colluvial deposits. Geoderma 2020, 365, 114203. [Google Scholar] [CrossRef]
  25. Magliano, P.N.; Whitworth-Hulse, J.I.; Baldi, G. Interception, throughfall and stemflow partition in drylands: Global synthesis and meta-analysis. J. Hydrol. 2018, 568, 638–645. [Google Scholar] [CrossRef]
  26. Lieskovský, J.; Kenderessy, P. Modelling the effect of vegetation cover and different tillage practices on soil erosion in VineyArds: A case study in Vráble (Slovakia) using WATEM/SEDEM. Land Degrad. Dev. 2014, 25, 288–296. [Google Scholar] [CrossRef]
  27. Martins, M.A.S.; Verheijen, F.G.A.; Malvar, M.C.; Serpa, D.; González-Pelayo, O.; Keizer, J.J. Do wildfire and slope aspect affect soil water repellency in eucalypt plantations? —A two-year high resolution temporal dataset. Catena 2020, 189, 104471. [Google Scholar] [CrossRef]
  28. Zhou, X.J.; Ke, T.; Li, S.X.; Deng, S.Q.; An, X.L.; Ma, X.; Philippis, R.D.; Chen, L.Z. Induced biological soil crusts and soil properties varied between slope aspect, slope gradient and plant canopy in the Hobq desert of China. Catena 2020, 190, 104559. [Google Scholar] [CrossRef]
  29. Martínez-Murillo, J.F.; Gabarrón-Galeote, M.A.; Ruiz-Sinoga, J.D. Soil water repellency in Mediterranean rangelands under contrasted climatic, slope and patch conditions in southern Spain. Catena 2013, 110, 196–206. [Google Scholar] [CrossRef]
  30. Wang, L.; Wei, S.; Horton, R.; Shao, M.A. Effects of vegetation and slope aspect on water budget in the hill and gully region of the Loess Plateau of China. Catena 2011, 87, 90–100. [Google Scholar] [CrossRef]
  31. Graham, C.B.; Woods, R.A.; McDonnell, J.J. Hillslope threshold response to rainfall: (1) A field based forensic approach. J. Hydrol. 2010, 393, 65–76. [Google Scholar] [CrossRef]
  32. Ludwig, J.A.; Wilcox, B.P.; Breshears, D.D.; Tongway, D.J.; Imeson, A.C. Vegetation patches and runoff-erosion as interacting ecohydrological processes in semiarid landscapes. Ecology 2005, 86, 288–297. [Google Scholar] [CrossRef] [Green Version]
  33. Martín, L.; las Heras, M.M.; Espigares, T.; Nicolau, J.M. Overland flow directs soil moisture and ecosystem processes at patch scale in Mediterranean restored hillslopes. Catena 2015, 133, 71–84. [Google Scholar] [CrossRef] [Green Version]
  34. Fan, B.H.; Tao, W.H.; Qin, G.H.; Hopkins, I.; Zhang, Y.; Wang, Q.J.; Lin, H.; Guo, L. Soil micro-climate variation in relation to slope aspect, position, and curvature in a forested catchment. Agric. For. Meteorol. 2020, 290, 107999. [Google Scholar] [CrossRef]
  35. Cerdà, A. The influence of geomorphological position and vegetation cover on the erosional and hydrological processes on a Mediterranean hillslope. Hydrol. Process. 1998, 12, 661–671. [Google Scholar] [CrossRef]
  36. Prosdocimi, M.; Cerdà, A.; Tarolli, P. Soil water erosion on Mediterranean vineyards: A review. Catena 2016, 141, 1–21. [Google Scholar] [CrossRef]
  37. Liao, Y.S.; Yuan, Z.J.; Zheng, M.G.; Li, D.Q.; Nie, X.D.; Wu, X.L.; Huang, B.; Xie, Z.Y.; Tang, C.Y. The spatial distribution of Benggang and the factors that influence it. Land Degrad. Dev. 2019, 30, 2323–2335. [Google Scholar] [CrossRef]
  38. Jiang, Z.Y.; Li, X.Y.; Wu, H.W.; Zhang, S.Y.; Zhao, G.Q.; Wei, J.Q. Linking spatial distributions of the patchy grass Achnatherum splendens with dynamics of soil water and salt using electromagnetic induction. Catena 2017, 149, 261–272. [Google Scholar] [CrossRef]
  39. Montenegro-Díaz, P.; Ochoa-Sánchez, A.; Célleri, R. Impact of tussock grasses removal on soil water content dynamics of a tropical mountain hillslope. Ecohydrology 2019, 12, e2146. [Google Scholar] [CrossRef]
  40. Mayor, Á.G.; Bautista, S.; Small, E.E.; Dixon, M.; Bellot, J. Measurement of the connectivity of runoff source areas as determined by vegetation pattern and topography: A tool for assessing potential water and soil losses in drylands. Water Resour. Res. 2008, 44, W10423. [Google Scholar] [CrossRef]
  41. Guo, M.M.; Wang, W.L.; Wang, T.C.; Wang, W.X.; Kang, H.L. Impacts of different vegetation restoration options on gully head soil resistance and soil erosion in loess tablelands. Earth Surf. Process. Landf. 2020, 45, 1038–1050. [Google Scholar] [CrossRef]
  42. Zhao, C.H.; Gao, J.E.; Huang, Y.F.; Wang, G.Q.; Zhang, M.J. Effects of vegetation stems on hydraulics of overland flow under varying water discharges. Land Degrad. Dev. 2016, 27, 748–757. [Google Scholar] [CrossRef]
  43. Wang, B.; Zhang, G.H.; Zhang, X.C.; Li, Z.W.; Su, Z.L.; Yi, T.; Shi, Y.Y. Effects of near soil surface characteristics on soil detachment by overland flow in a natural succession grassland. Soil Sci. Soc. Am. J. 2014, 78, 589. [Google Scholar] [CrossRef] [Green Version]
  44. Wilson, G.V.; Zhang, T.Y.; Wells, R.R.; Liu, B.Y. Consolidation effects on relationships among soil erosion properties and soil physical quality indicators. Soil Tillage Res. 2020, 198, 104550. [Google Scholar] [CrossRef]
  45. Ela, S.D.; Gupta, S.C.; Rawls, W.J. Macropore and surface seal interactions affecting water infiltration into soil. Soil Sci. Soc. Am. J. 1992, 56, 714–721. [Google Scholar] [CrossRef]
  46. Liu, G.; Zheng, F.L.; Jia, L.; Jia, Y.F.; Zhang, X.C.; Hu, F.N.; Zhang, J.Q. Interactive effects of raindrop impact and groundwater seepage on soil erosion. J. Hydrol. 2019, 578, 124066. [Google Scholar] [CrossRef]
  47. Hayati, E.; Abdi, E.; Saravi, M.M.; Nieber, J.L.; Majnounian, B.; Chirico, G.B.; Wilson, B.; Nazaririad, M. Soil water dynamics under different forest vegetation cover: Implications for hillslope stability. Earth Surf. Process. Landf. 2018, 43, 2106–2120. [Google Scholar] [CrossRef]
  48. Sorbino, G.; Nicotera, M.V. Unsaturated soil mechanics in rainfall-induced flow landslides. Eng. Geol. 2013, 165, 105–132. [Google Scholar] [CrossRef]
  49. Vannoppen, W.; Vanmaercke, M.; De Baets, S.; Poesen, J.A. Review of the mechanical effects of plant roots on concentrated flow erosion rates. Earth Sci. Rev. 2015, 150, 666–678. [Google Scholar] [CrossRef] [Green Version]
  50. Chen, J.L.; Zhou, M.; Lin, J.S.; Jiang, F.S.; Huang, B.F.; Xu, M.K.; Ge, H.L.; Huang, Y.H. Comparison of soil physicochemical properties and mineralogical compositions between noncollapsible soils and collapsed gullies. Geoderma 2018, 317, 56–66. [Google Scholar] [CrossRef]
Figure 1. (a) The location of the study area. (b) The diagrammatic sketch of the experimental slope. (c) The image of studied collapsing slope with the five experimental sites. (d) The landscape of the five experimental sites.
Water 12 02272 g001
Figure 2. Rainfall and soil water content with five depths (5 cm, 15 cm, 30 cm, 60 cm and 100 cm) on the collapsing gully slope from January 2017 to December 2019.
Water 12 02272 g002
Figure 3. Response of soil water dynamics at five soil depths to five typical rainfall events with the rainfall of 3.5 mm (ad), 13.5 mm (eh), 19 mm (il), 43.5 mm (mp), and 104 mm (qt) at the five experimental sites, respectively. P is rainfall; I means rainfall intensity; D represents rainfall duration.
Water 12 02272 g003
Figure 4. Frequency distribution of soil water storage in the five experimental sites.
Water 12 02272 g004
Figure 5. Change of soil water storage (ΔSWS) in the five experimental sites after rainfall events.
Water 12 02272 g005
Table 1. The slope information, dominant species, undergrowth coverage, and soil particle size composition (USDA) for the five experimental sites.
SitesSlope AspectSlope PositionDominant SpeciesUndergrowth Coverage (%)Particle Size Composition (%)
ClaySiltSand
(<0.002 mm)(0.002–0.05 mm)(0.05–2 mm)
Su-U-BSunny slopeUpper of slopeBare land5 ± 1.327.66 ± 4.4529.10 ± 4.8343.24 ± 6.39
Su-M-BSunny slopeMiddle of slopeBare land5 ± 2.15.49 ± 1.1246.86 ± 7.6347.65 ± 4.39
Su-M-VSunny slopeMiddle of slopeP. massoniana, D. dichotoma75 ± 13.538.51 ± 6.3833.02 ± 5.7728.47 ± 3.44
Sh-U-VShady slopeUpper of slopeP. massoniana, D. dichotoma, B. frutescens, R. tomentosa.80 ± 17.642.48 ± 10.6514.63 ± 3.8242.89 ± 5.36
Sh-M-VShady slopeMiddle of slopeP. massoniana, D. dichotoma, B. frutescens, R. tomentosa.96 ± 16.251.64 ± 9.1223.53 ± 1.0924.83 ± 2.17
Note: Su and Sh mean sunny slope and shady slope; U and M represent upper of slope and middle of slope; B and V are bare land and vegetation area.
Table 2. Statistic of rainfall and rain frequency during the study period.
Year0–10 mm10–30 mm30–60 mm60–100 mm>100 mm
FrequencyRainfall mm/
Percentage%
FrequencyRainfall mm/
Percentage%
FrequencyRainfall mm/
Percentage%
FrequencyRainfall mm/
Percentage%
FrequencyRainfall mm/
Percentage%
2017100243.4/21.621338.8/30.111439.6/39.000/01104.0/9.2
201874157.4/10.334595.9/38.912475.8/31.12159.2/10.41142.8/9.3
201975201.5/10.833615.0/33.011450.5/24.14356/19.12242.5/13.0
Average83200.8/13.329516.6/34.311455.3/30.22171.7/11.41163.1/10.8
Table 3. Statistic values of soil water content in the five experimental sites of collapsing gully slope.
SitesSoil DepthAverageMaximumMinimumSDCVn
(cm)(m3/m3)(m3/m3)(m3/m3)(m3/m3)(%)
Su-U-B50.233c0.3250.1810.03414.6%6670
150.223b0.3170.1750.03515.6%6670
300.241d0.3340.2050.03313.8%6670
600.192a0.2390.1580.02513.0%6508
1000.280e0.2980.2340.0207.0%6670
Su-M-B50.200d0.3010.1580.03115.7%6670
150.209e0.2590.1760.02311.0%6670
300.194c0.2230.1710.0157.8%6670
600.170b0.1930.1560.0106.1%6670
1000.156a0.1770.1420.0096.0%6670
Su-M-V50.107a0.4470.0480.04441.0%6670
150.180c0.3820.0920.07441.3%6670
300.158b0.3780.0750.05635.5%6670
600.268d0.4120.1480.09334.6%6670
1000.292e0.3610.2430.03512.1%6670
Sh-U-V50.201a0.3560.1550.04823.9%6670
150.276c0.3480.2330.03613.0%6670
300.281d0.4110.2050.06121.6%6670
600.256b0.4380.1480.04316.8%6598
1000.292e0.4000.2510.03110.6%6670
Sh-M-V50.202a0.3810.1330.05828.6%6670
150.228b0.3700.1510.06528.5%6670
300.301c0.3430.2910.0061.9%6670
600.303d0.4630.2510.03511.5%6670
1000.311e0.4160.2630.0289.1%6670
Note: SD means standard deviation; CV is coefficient variation; Different letters in the same column indicate significant differences (p < 0.05).
Table 4. Statistic values of slope soil water storage in the collapsing gully slope.
SitesAverageMaximumMinimumSDCVn
(cm)(cm)(cm)(cm)(%)
Su-U-B27.7334.4822.033.7116.80%6508
Su-M-B21.1723.9518.941.306.53%6670
Su-M-V27.9144.9118.507.0433.26%6670
Sh-U-V31.9447.7424.296.1625.29%6598
Sh-M-V34.7149.0029.113.7012.66%6670

