Individual Rainfall Change Based on Observed Hourly Precipitation Records on the Chinese Loess Plateau from 1983 to 2012


 , , and
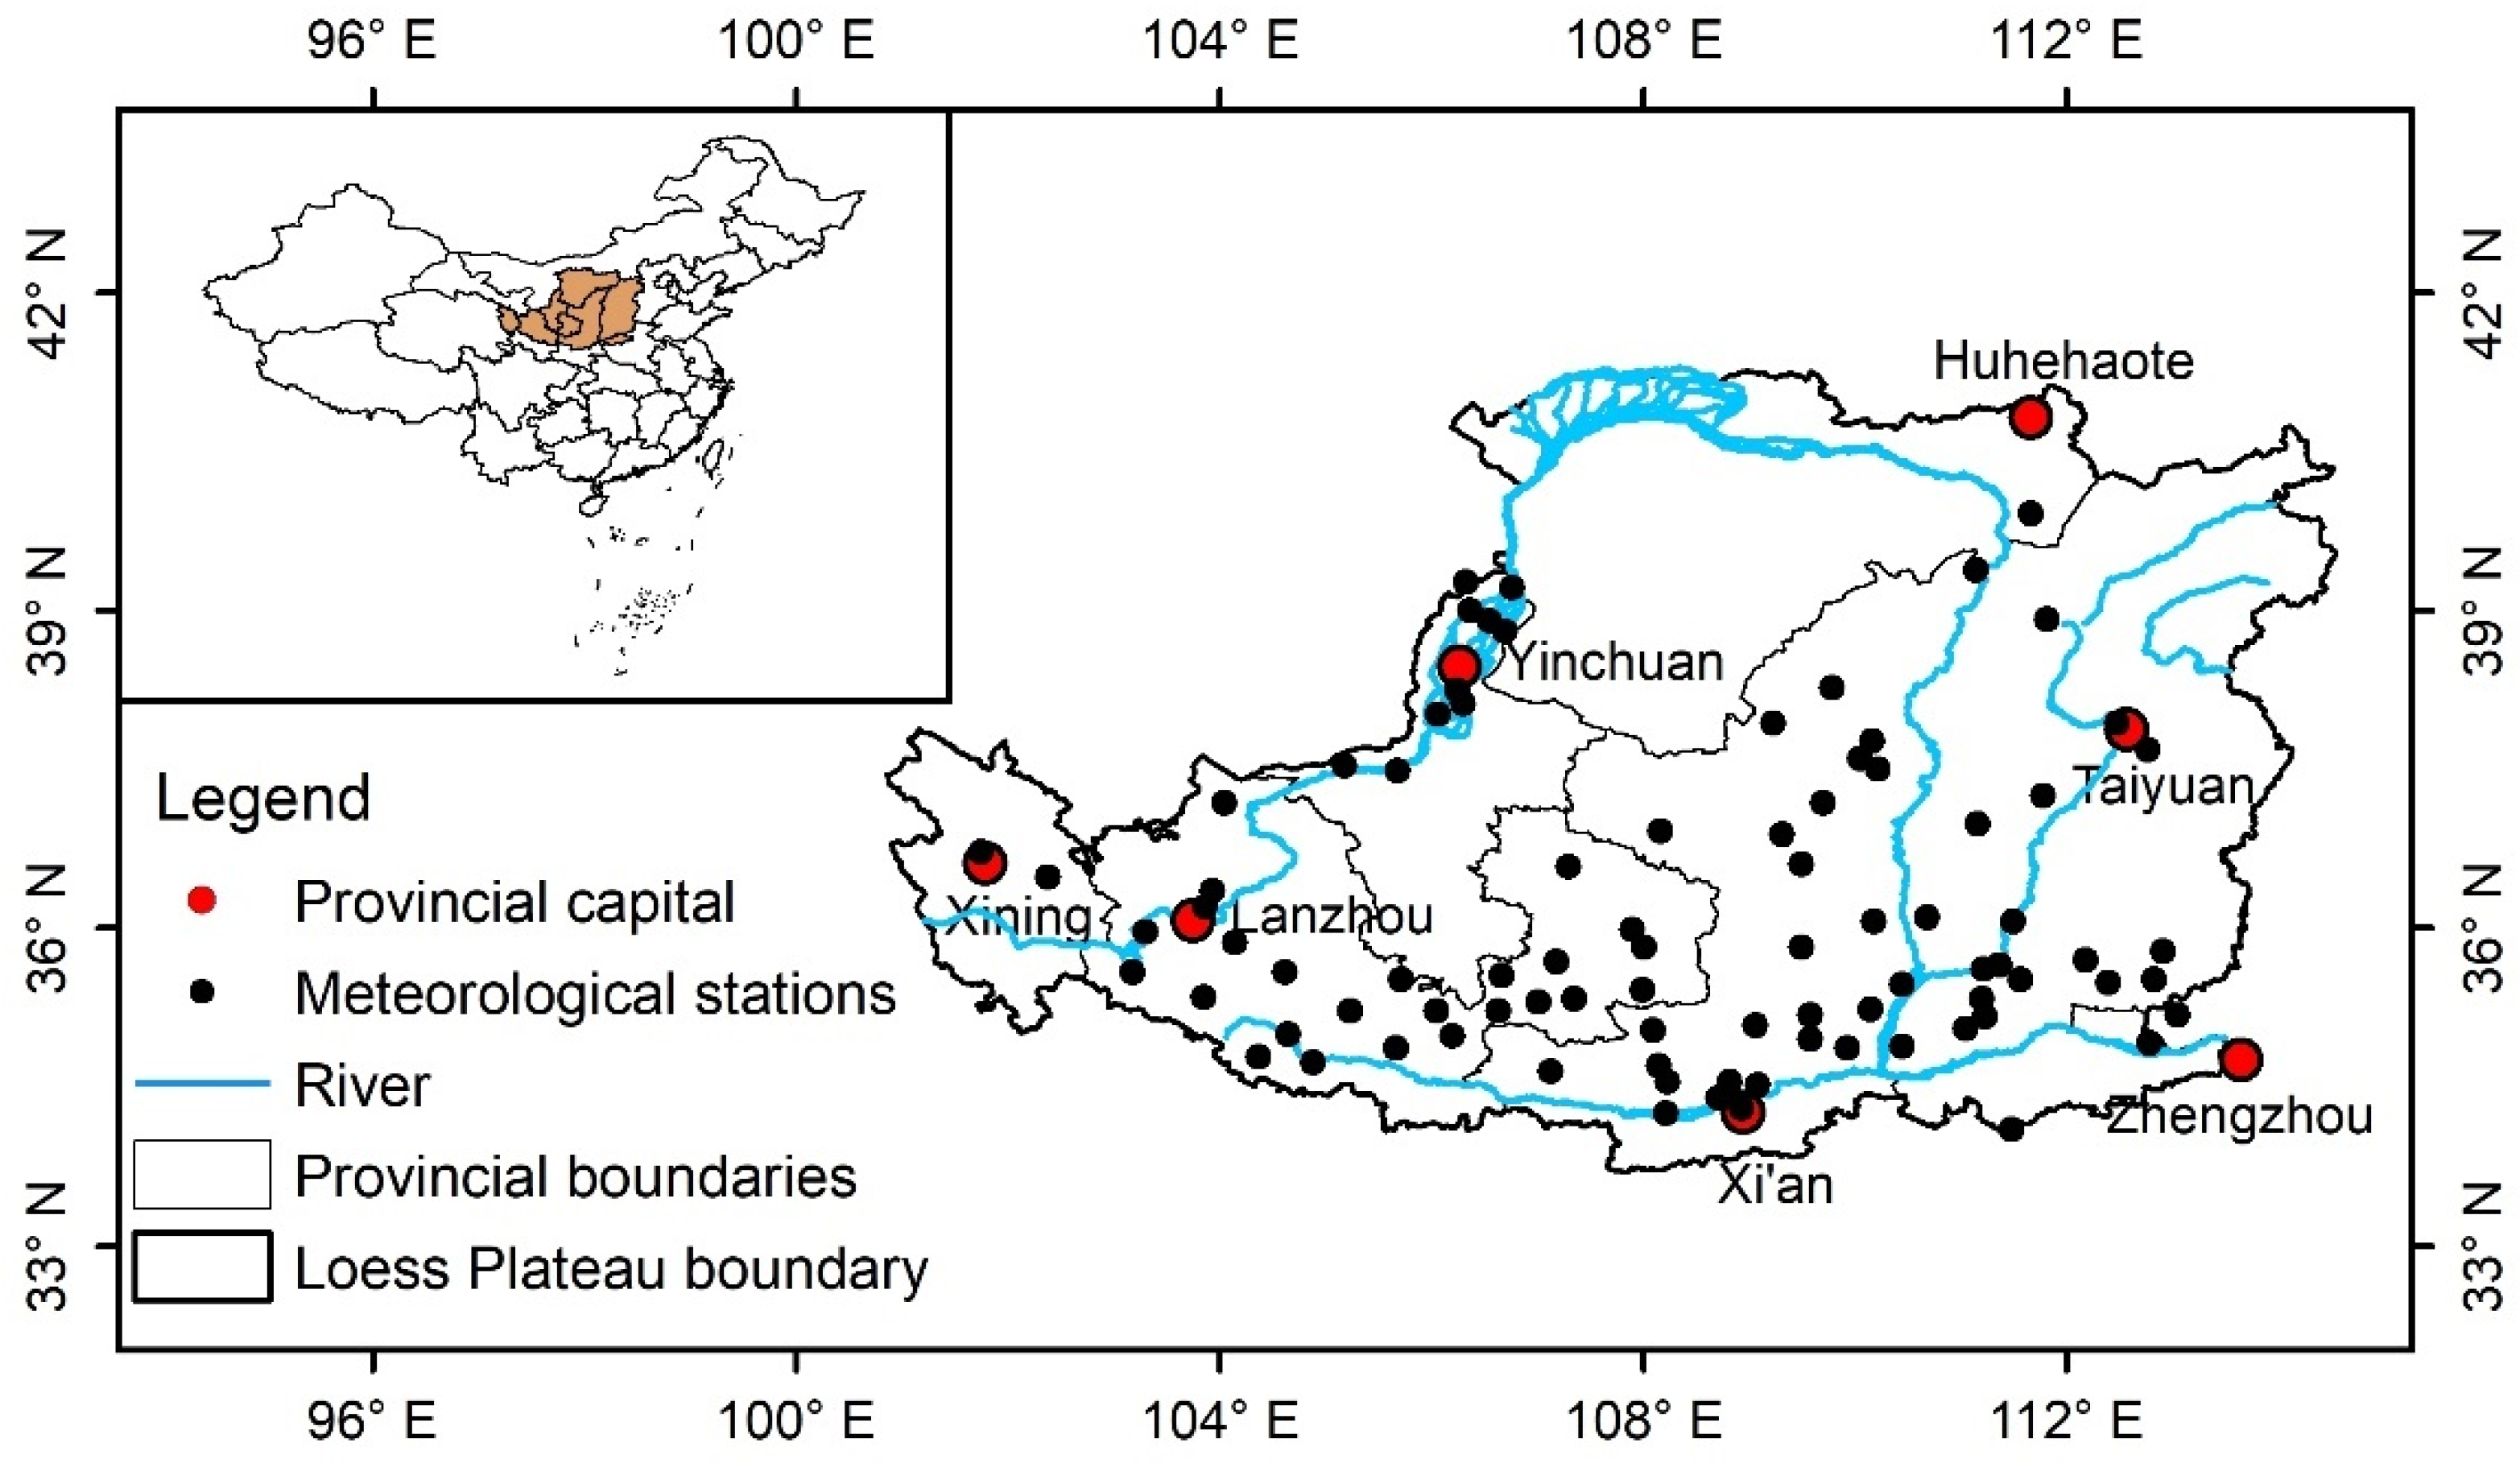
Abstract
1. Introduction
2. Materials and Methods
2.1. Study Area
2.2. Data
2.3. Methods
3. Results
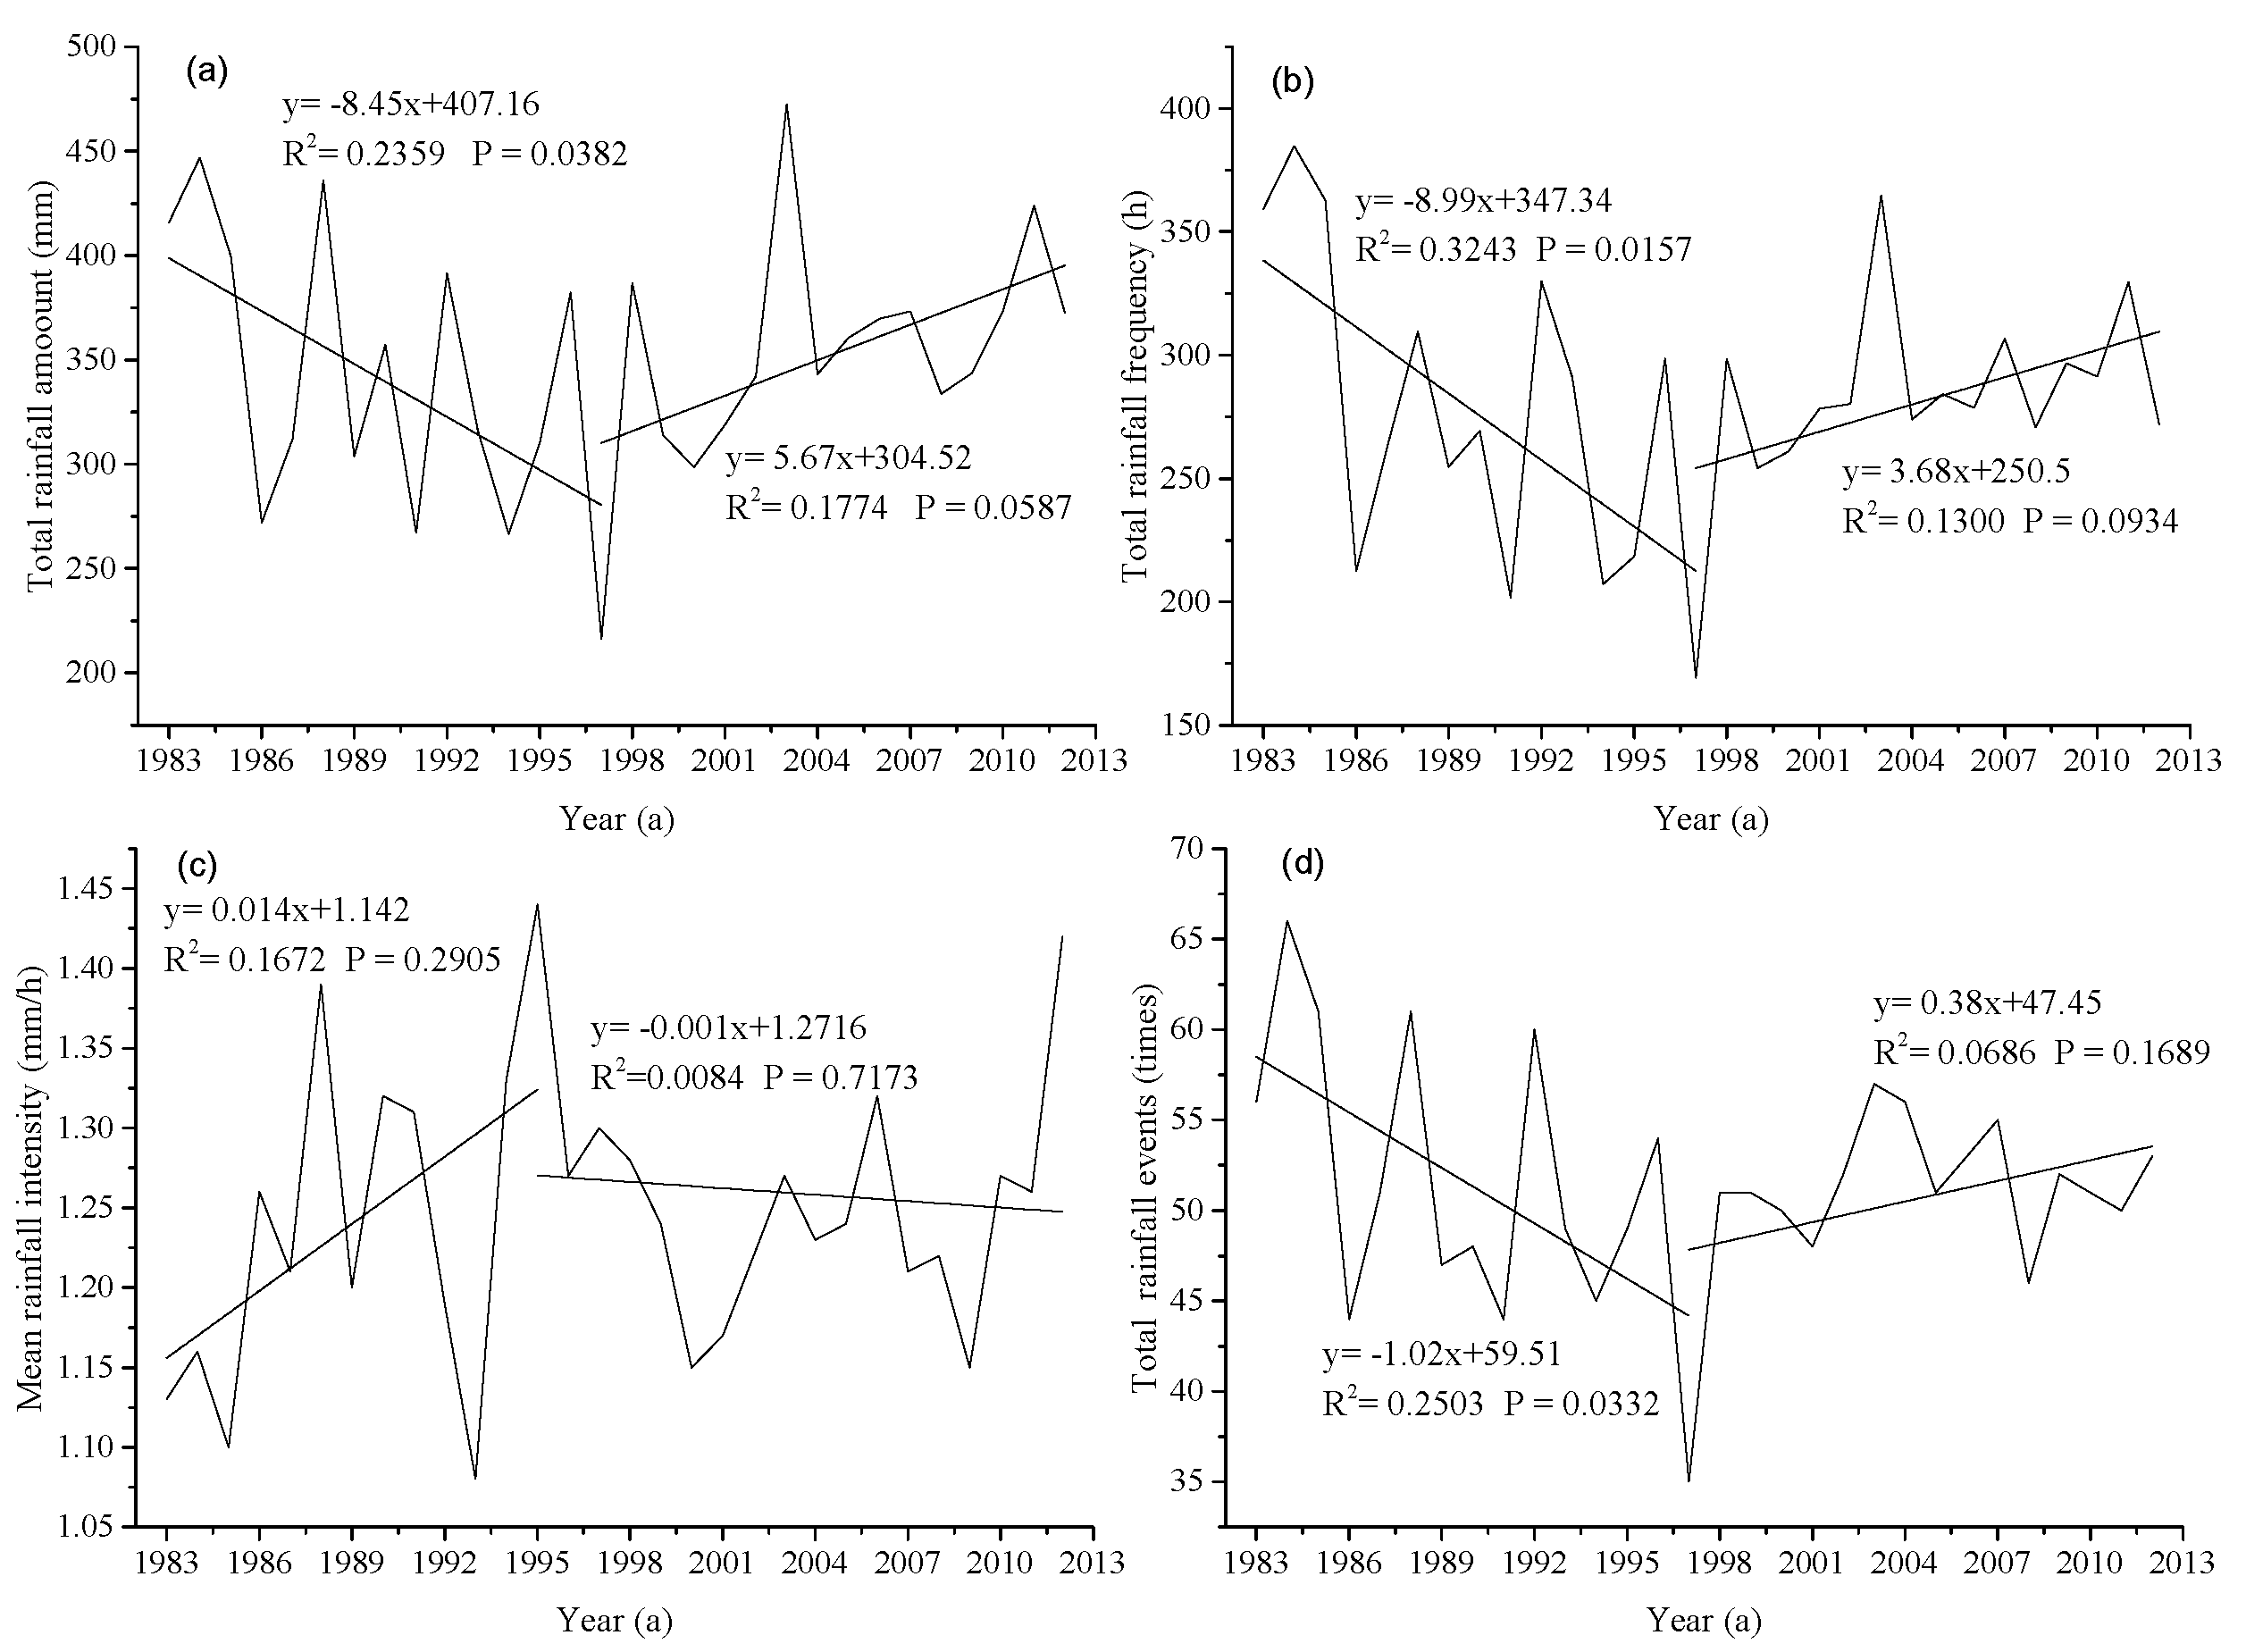
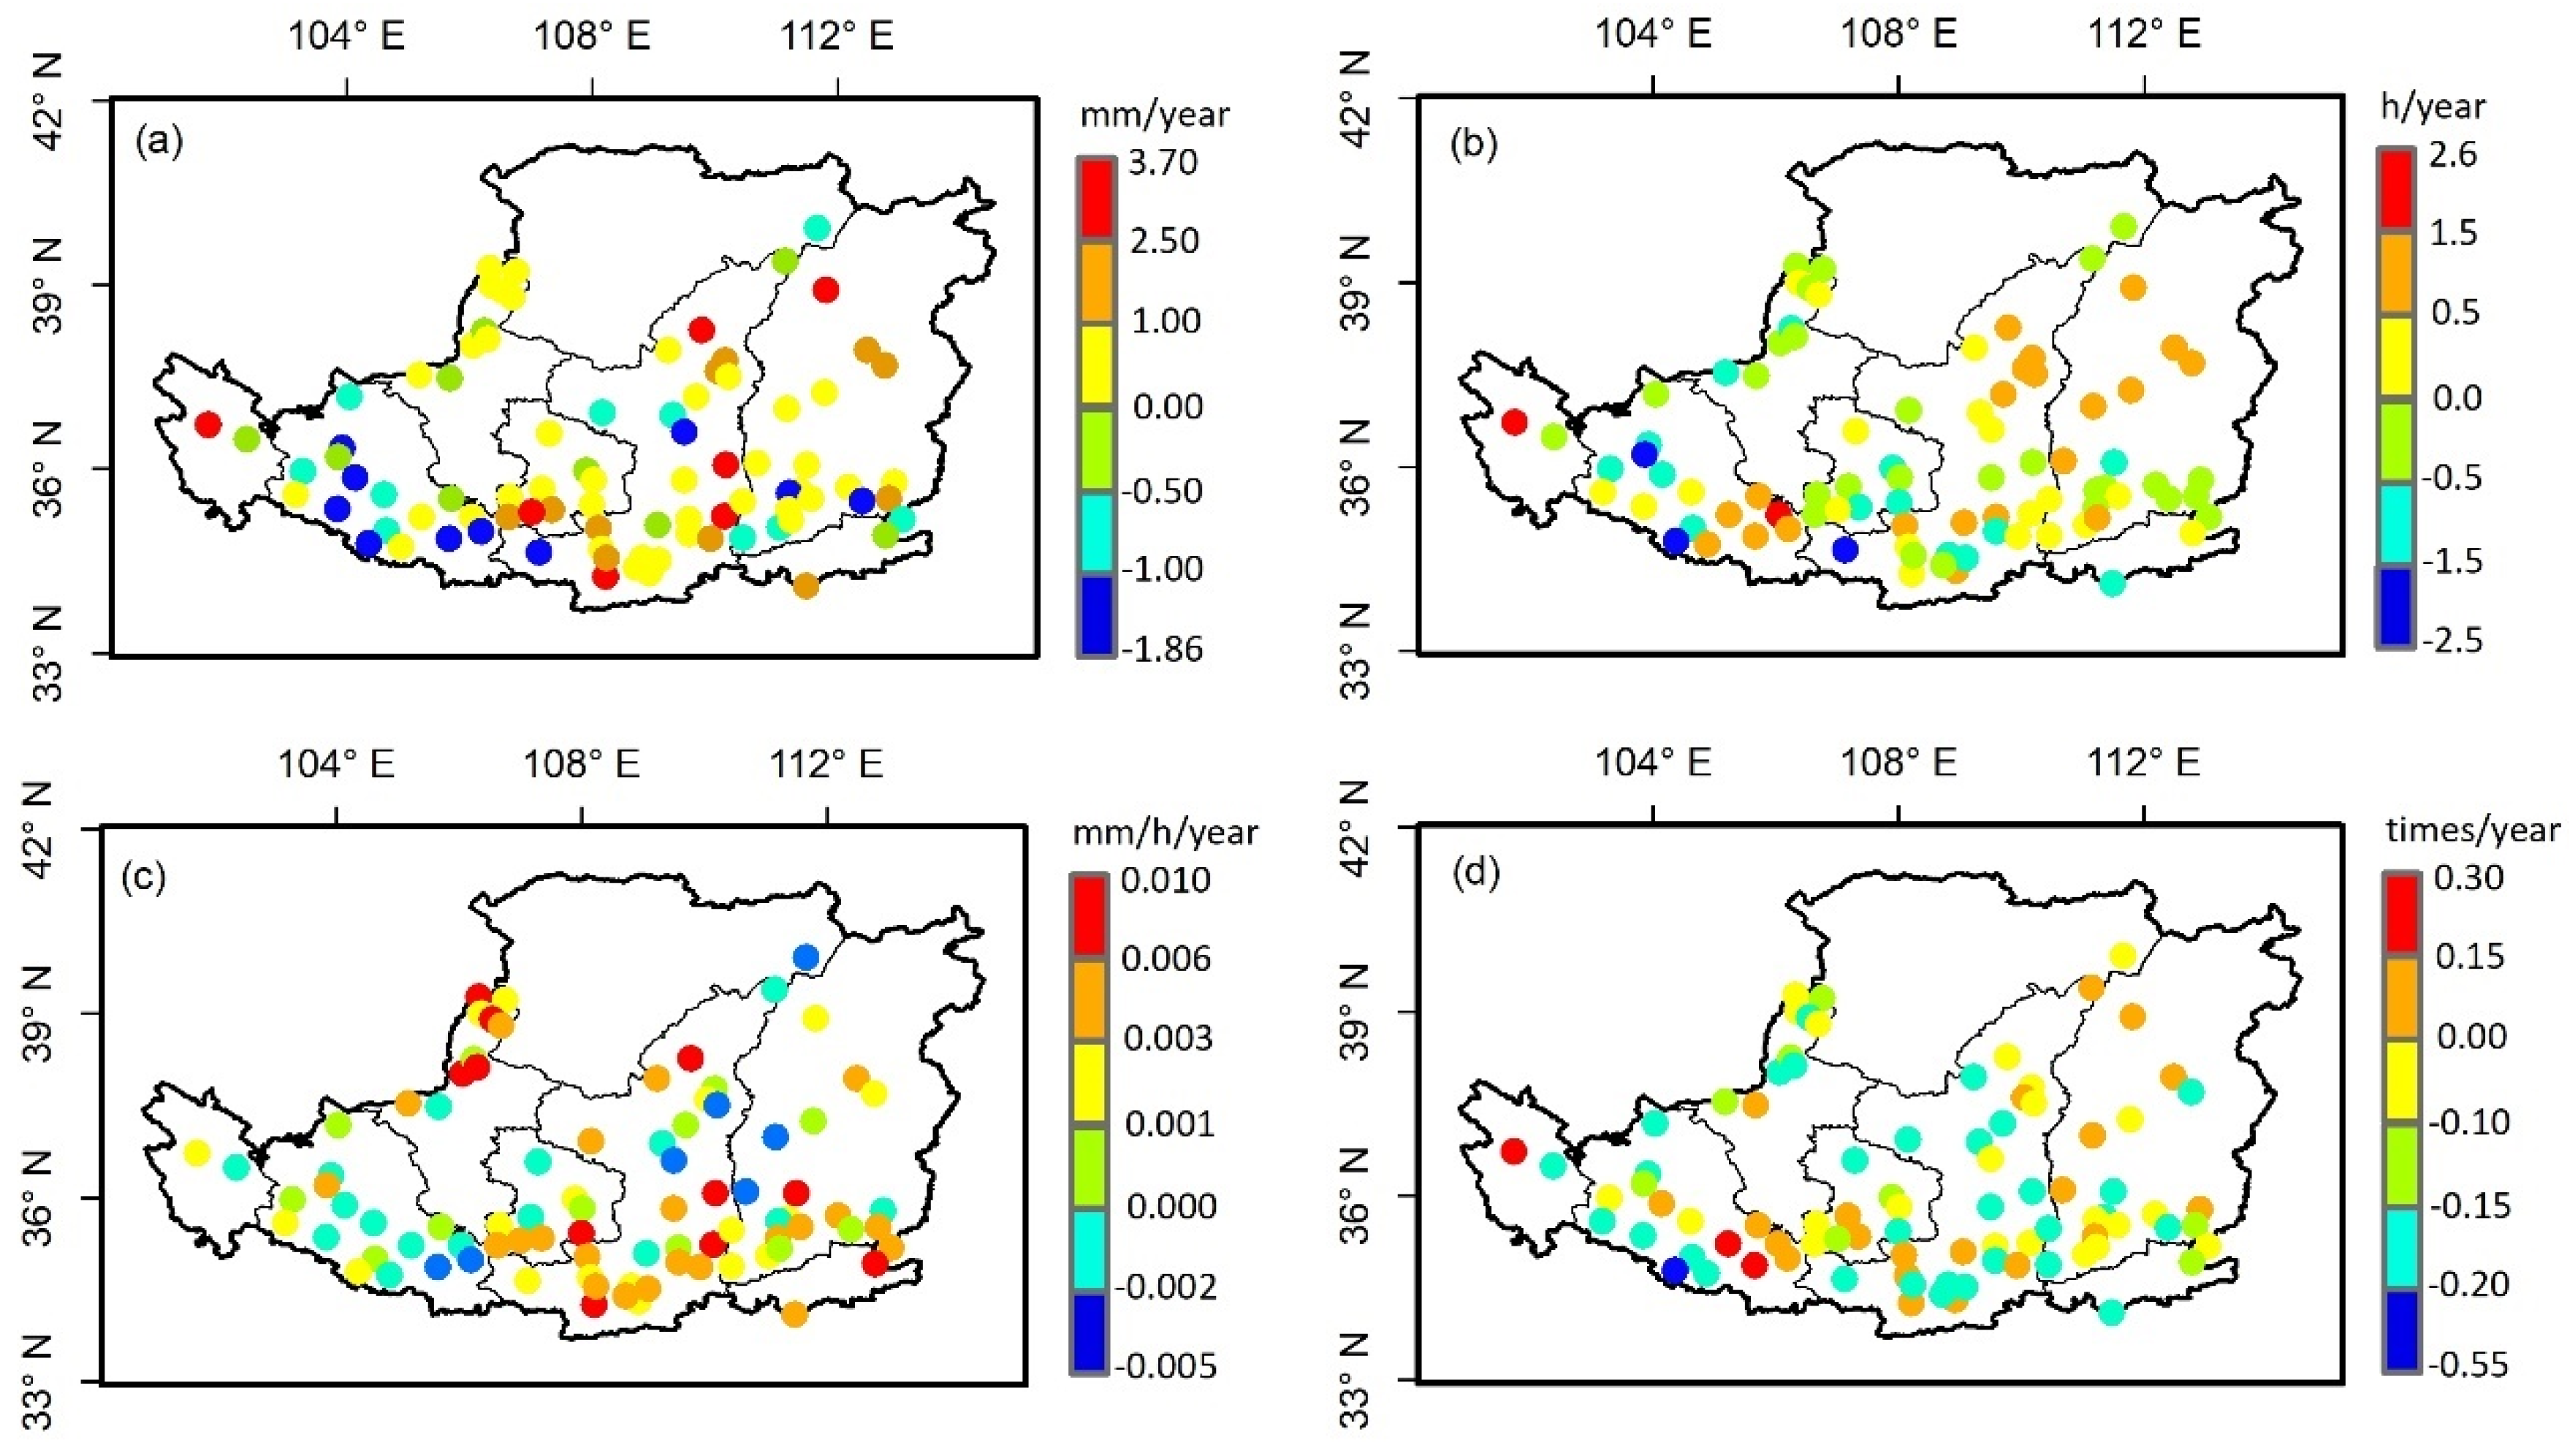
3.1. Spatiotemporal Variations of Individual Rainfall Events
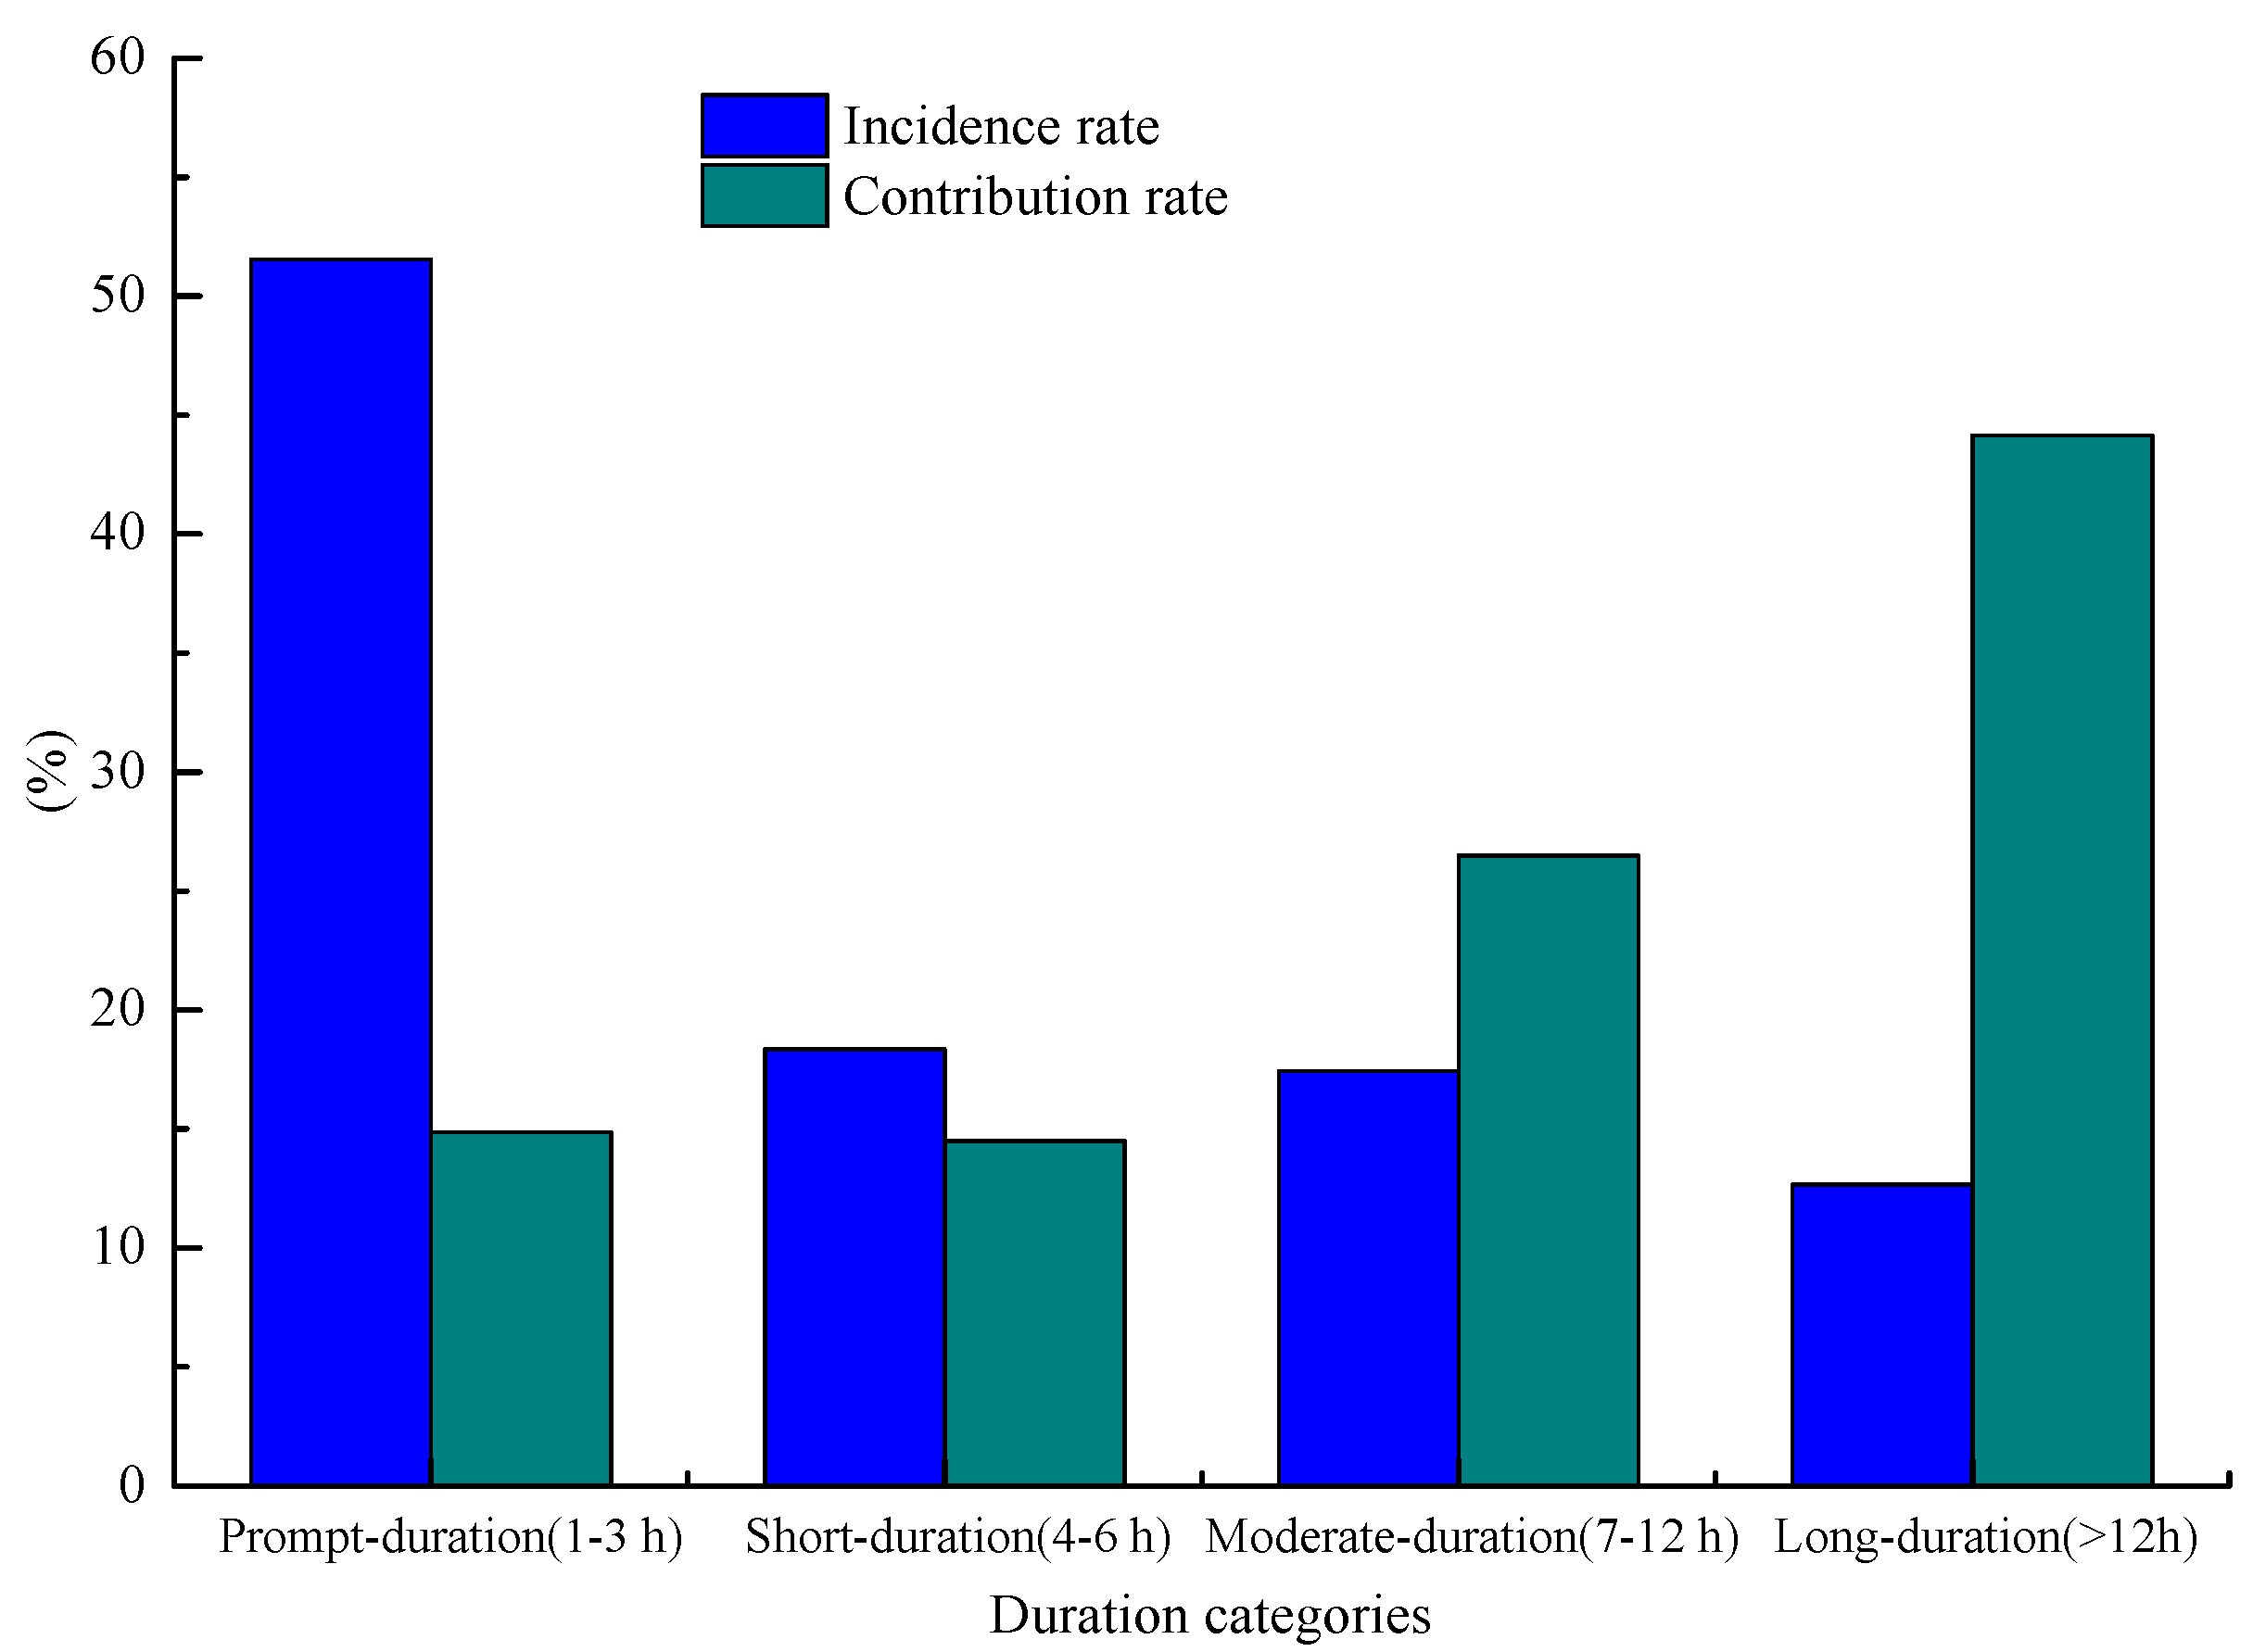
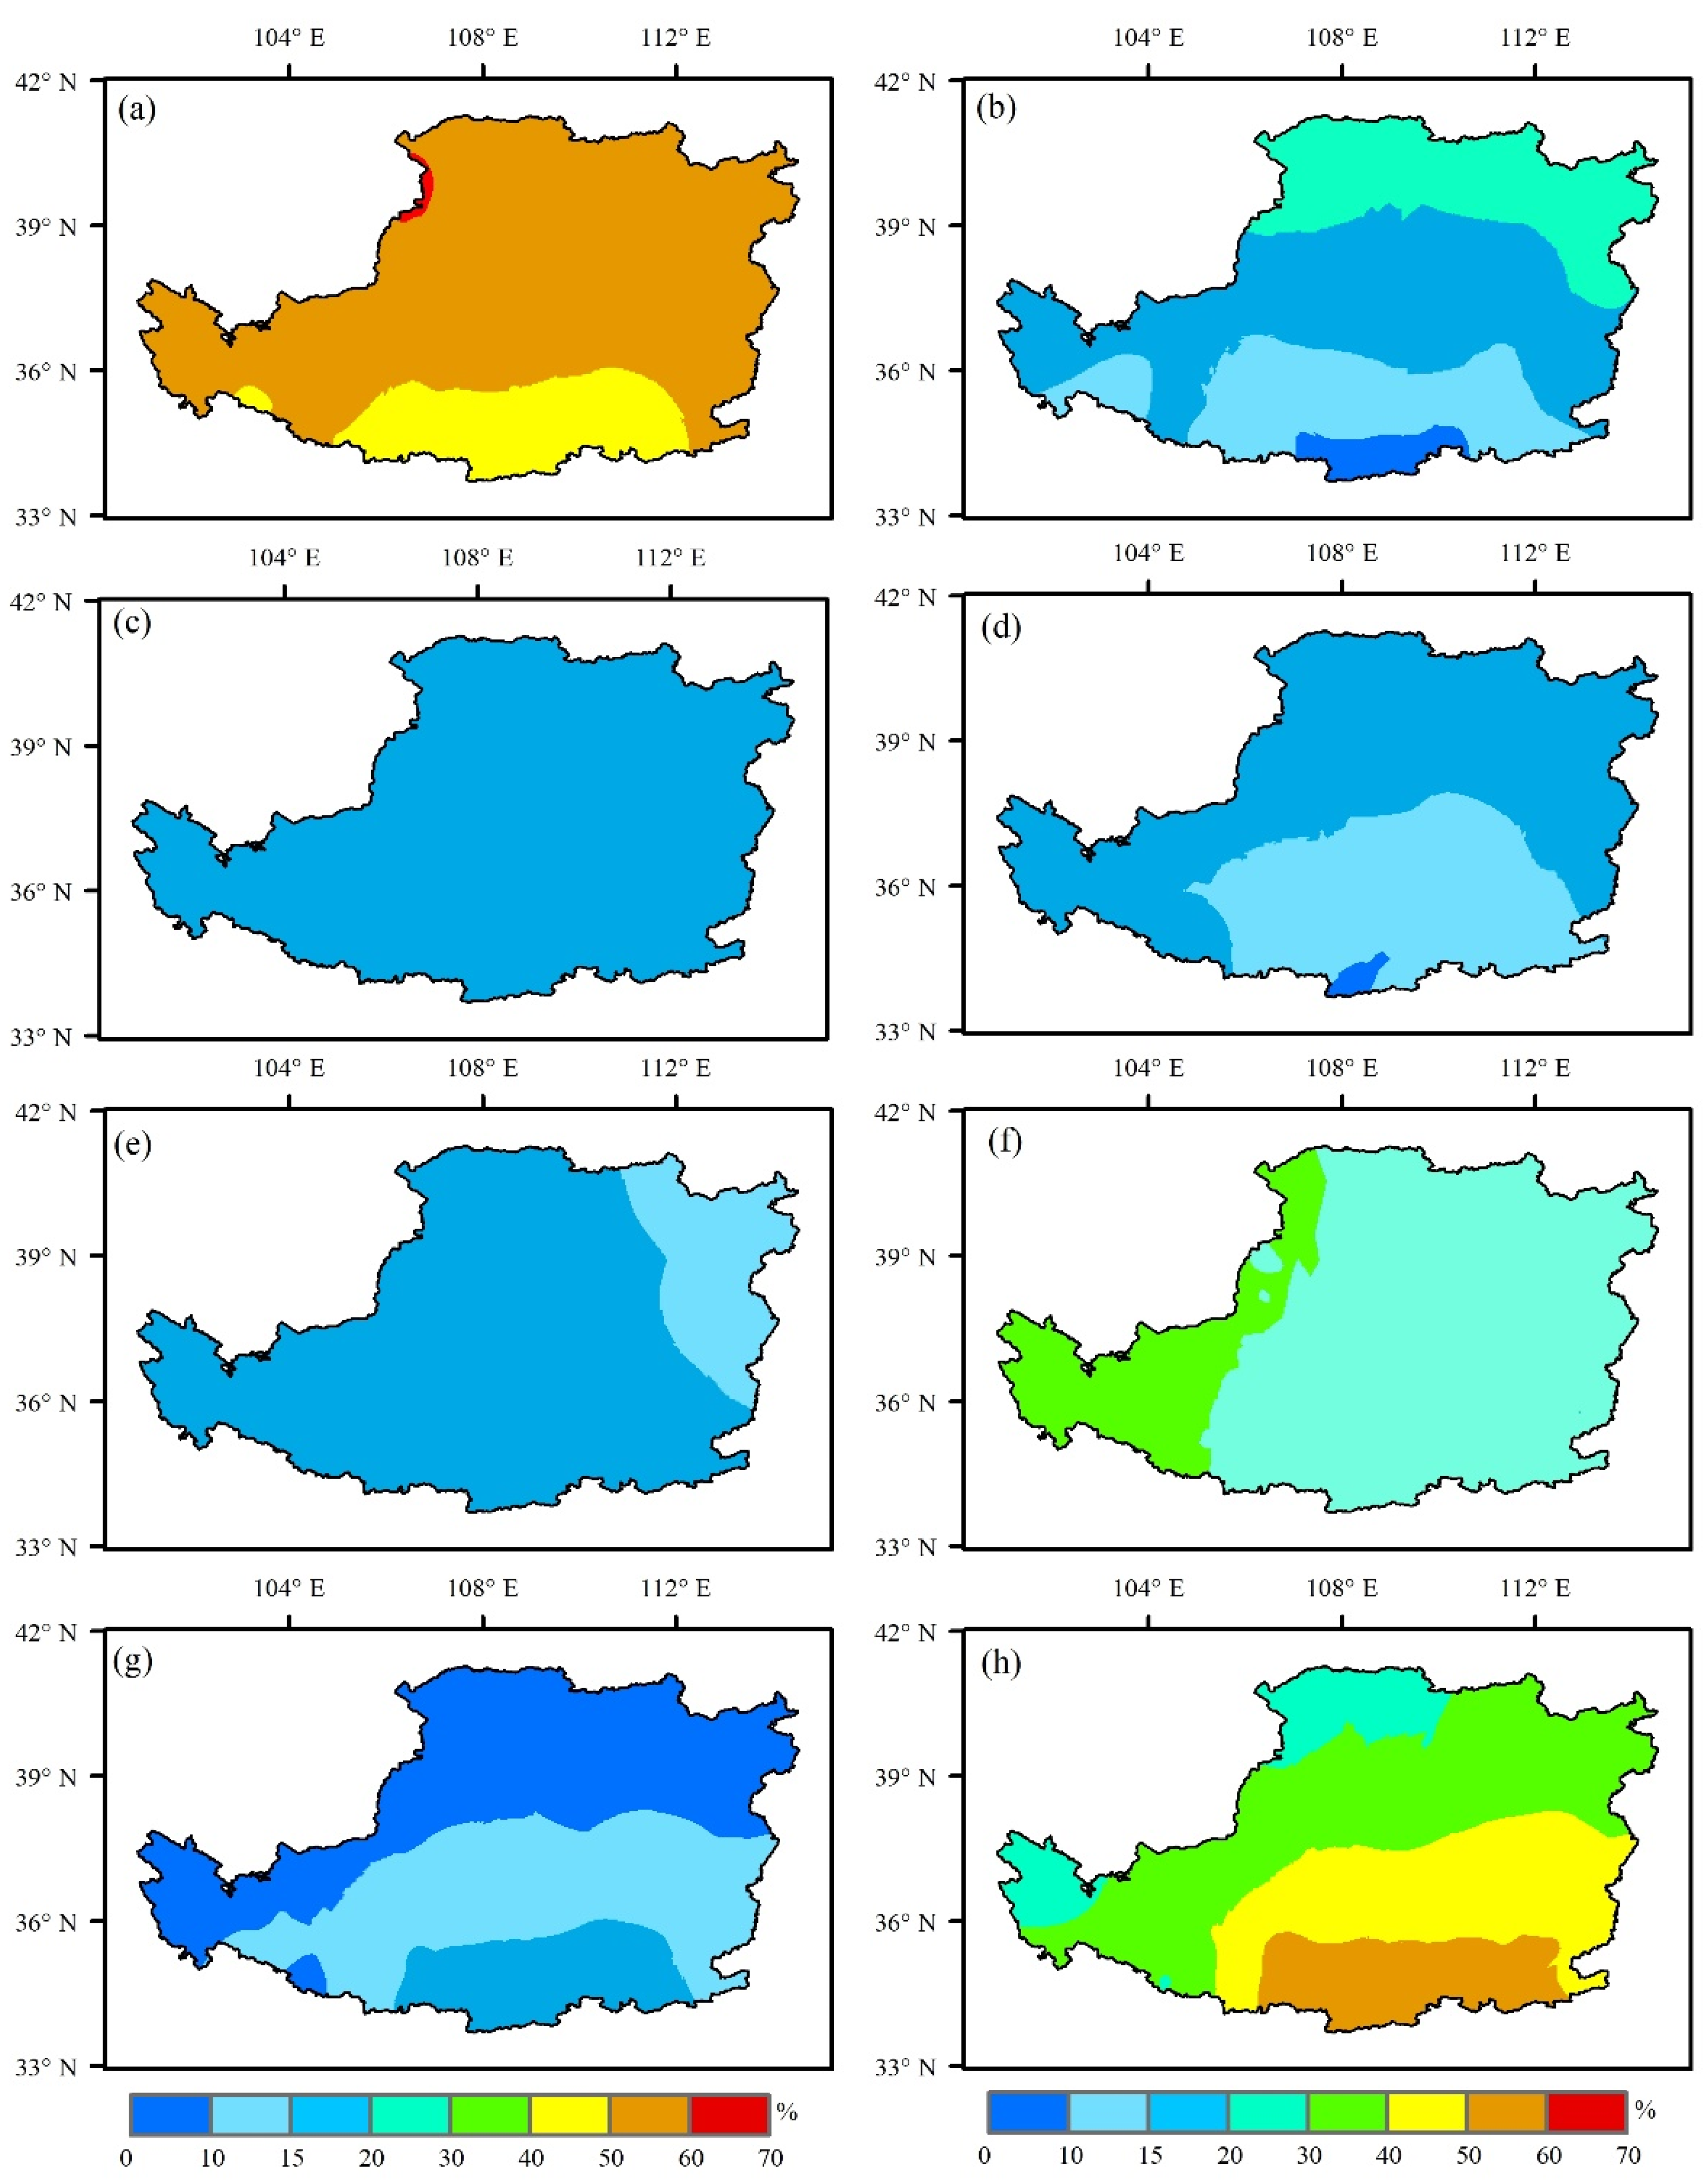
3.2. Incidence and Contribution Rates of Rainfall for Various Duration Bands
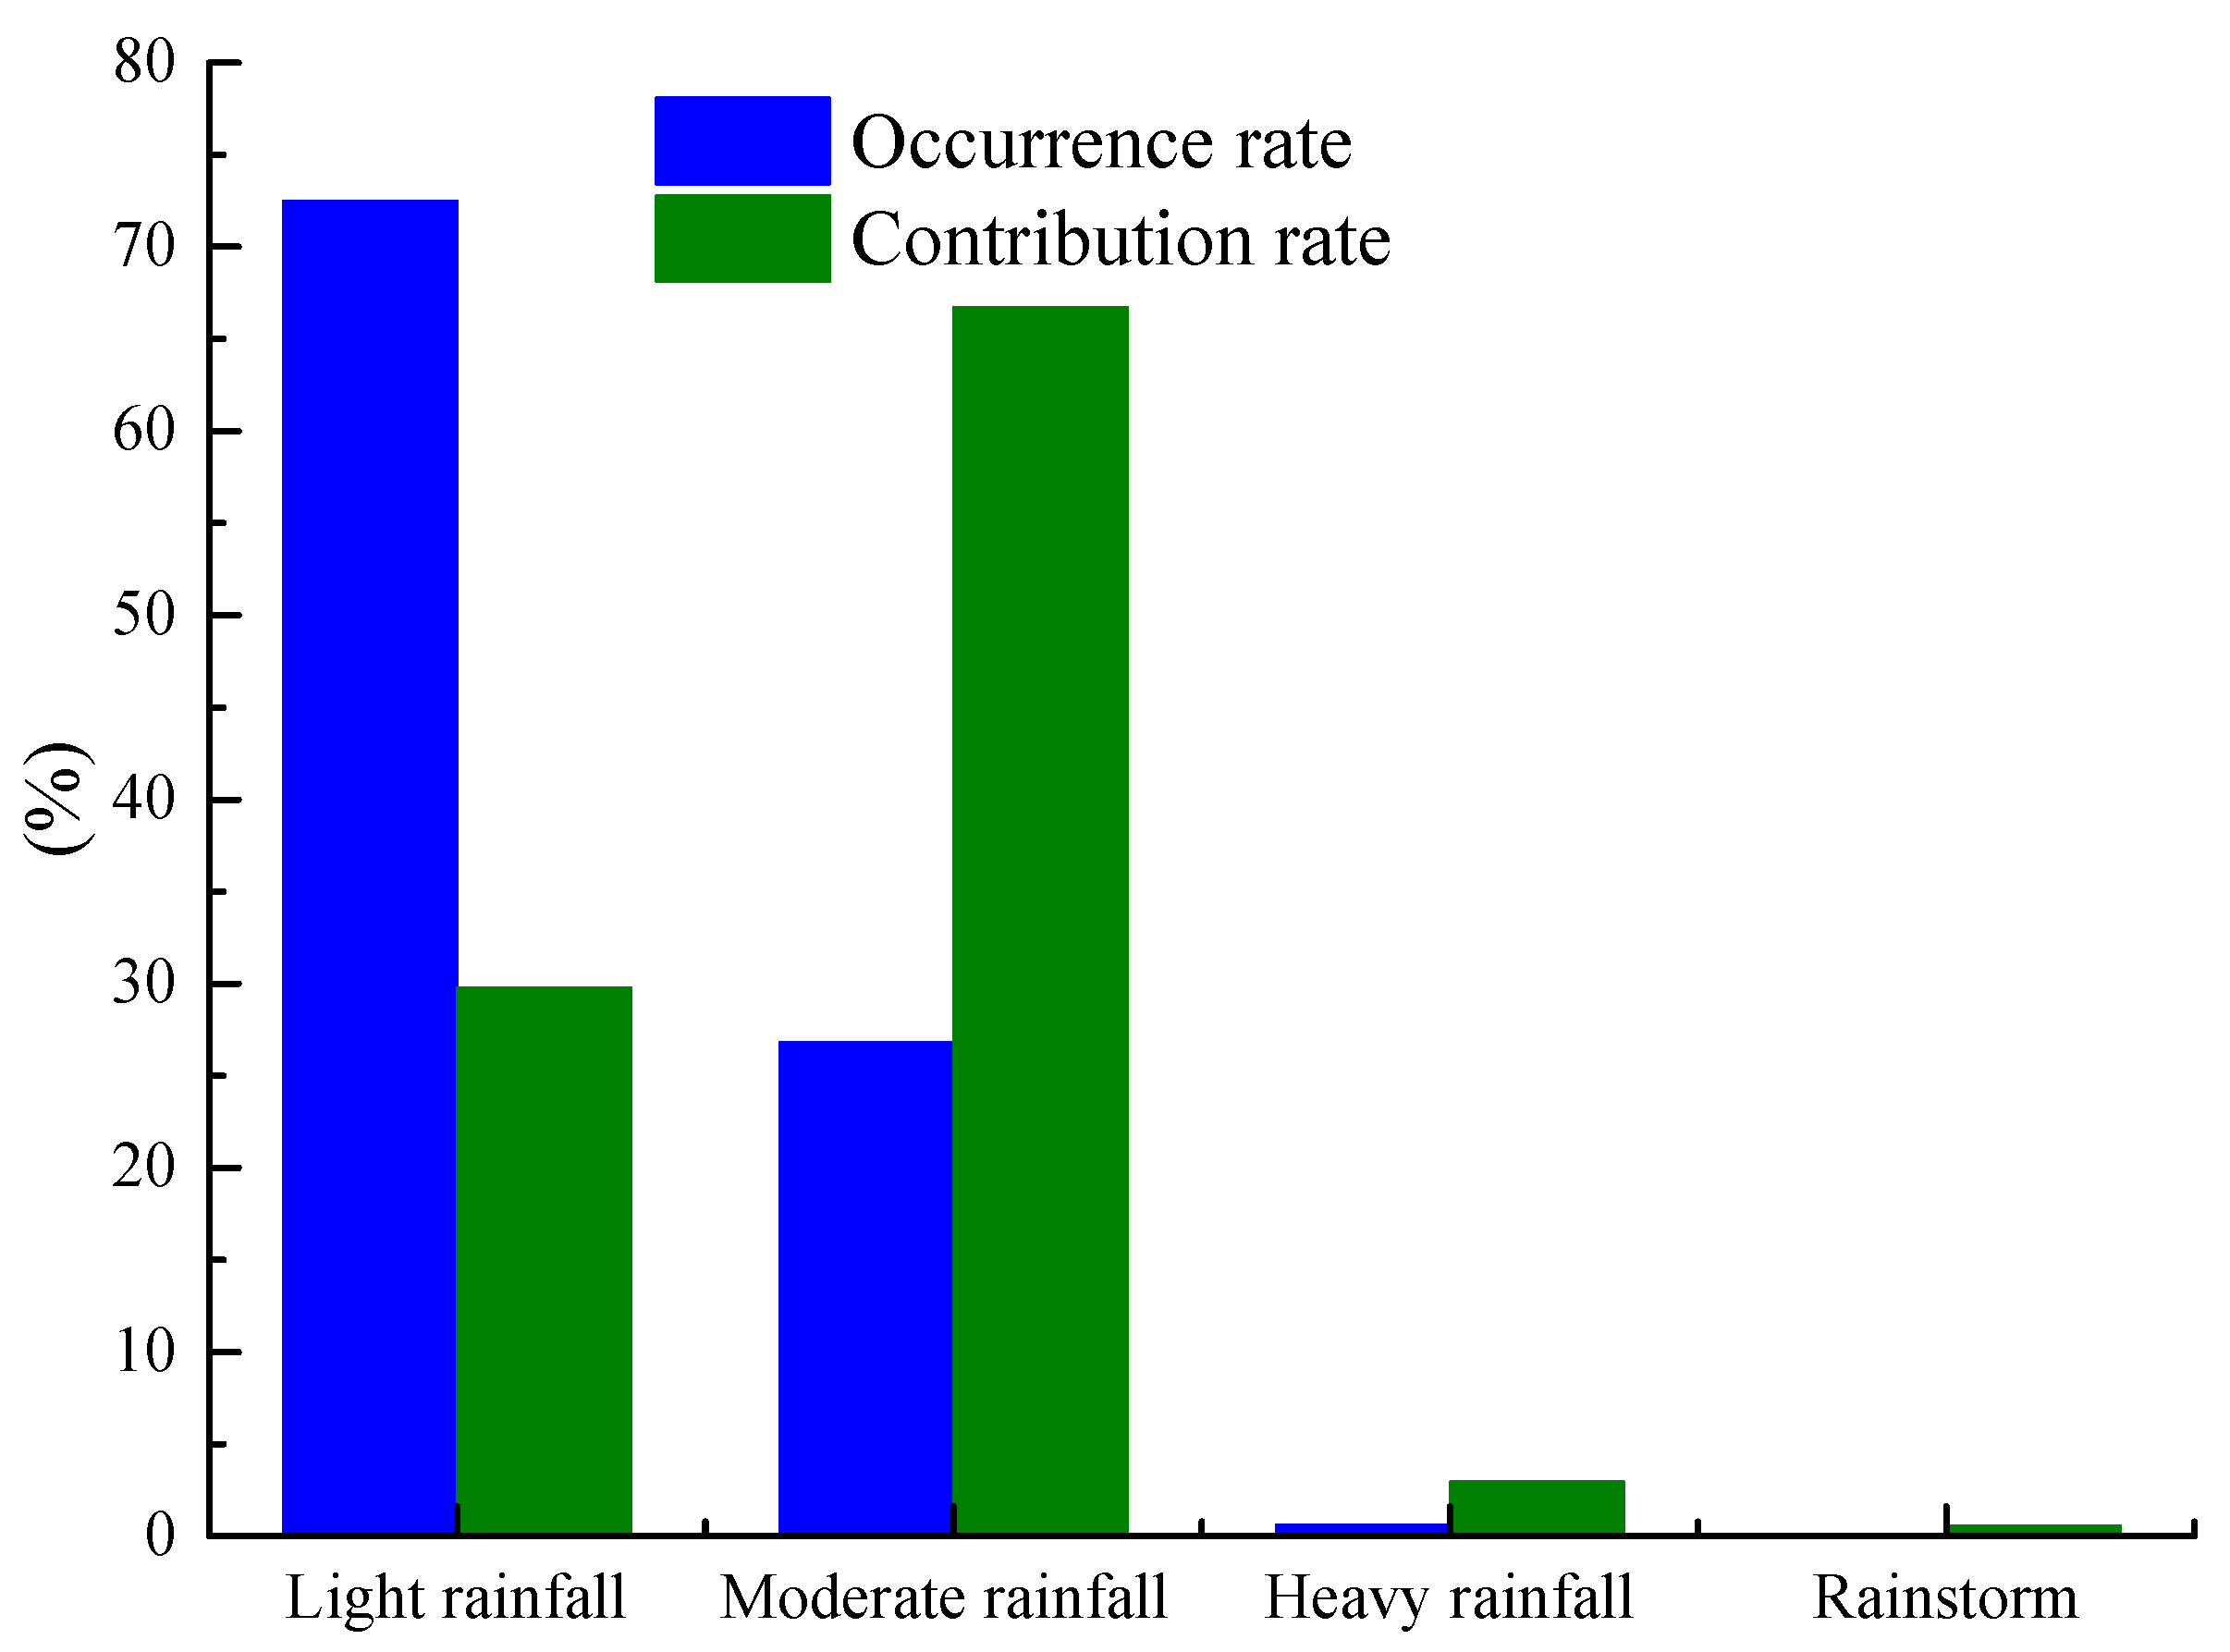
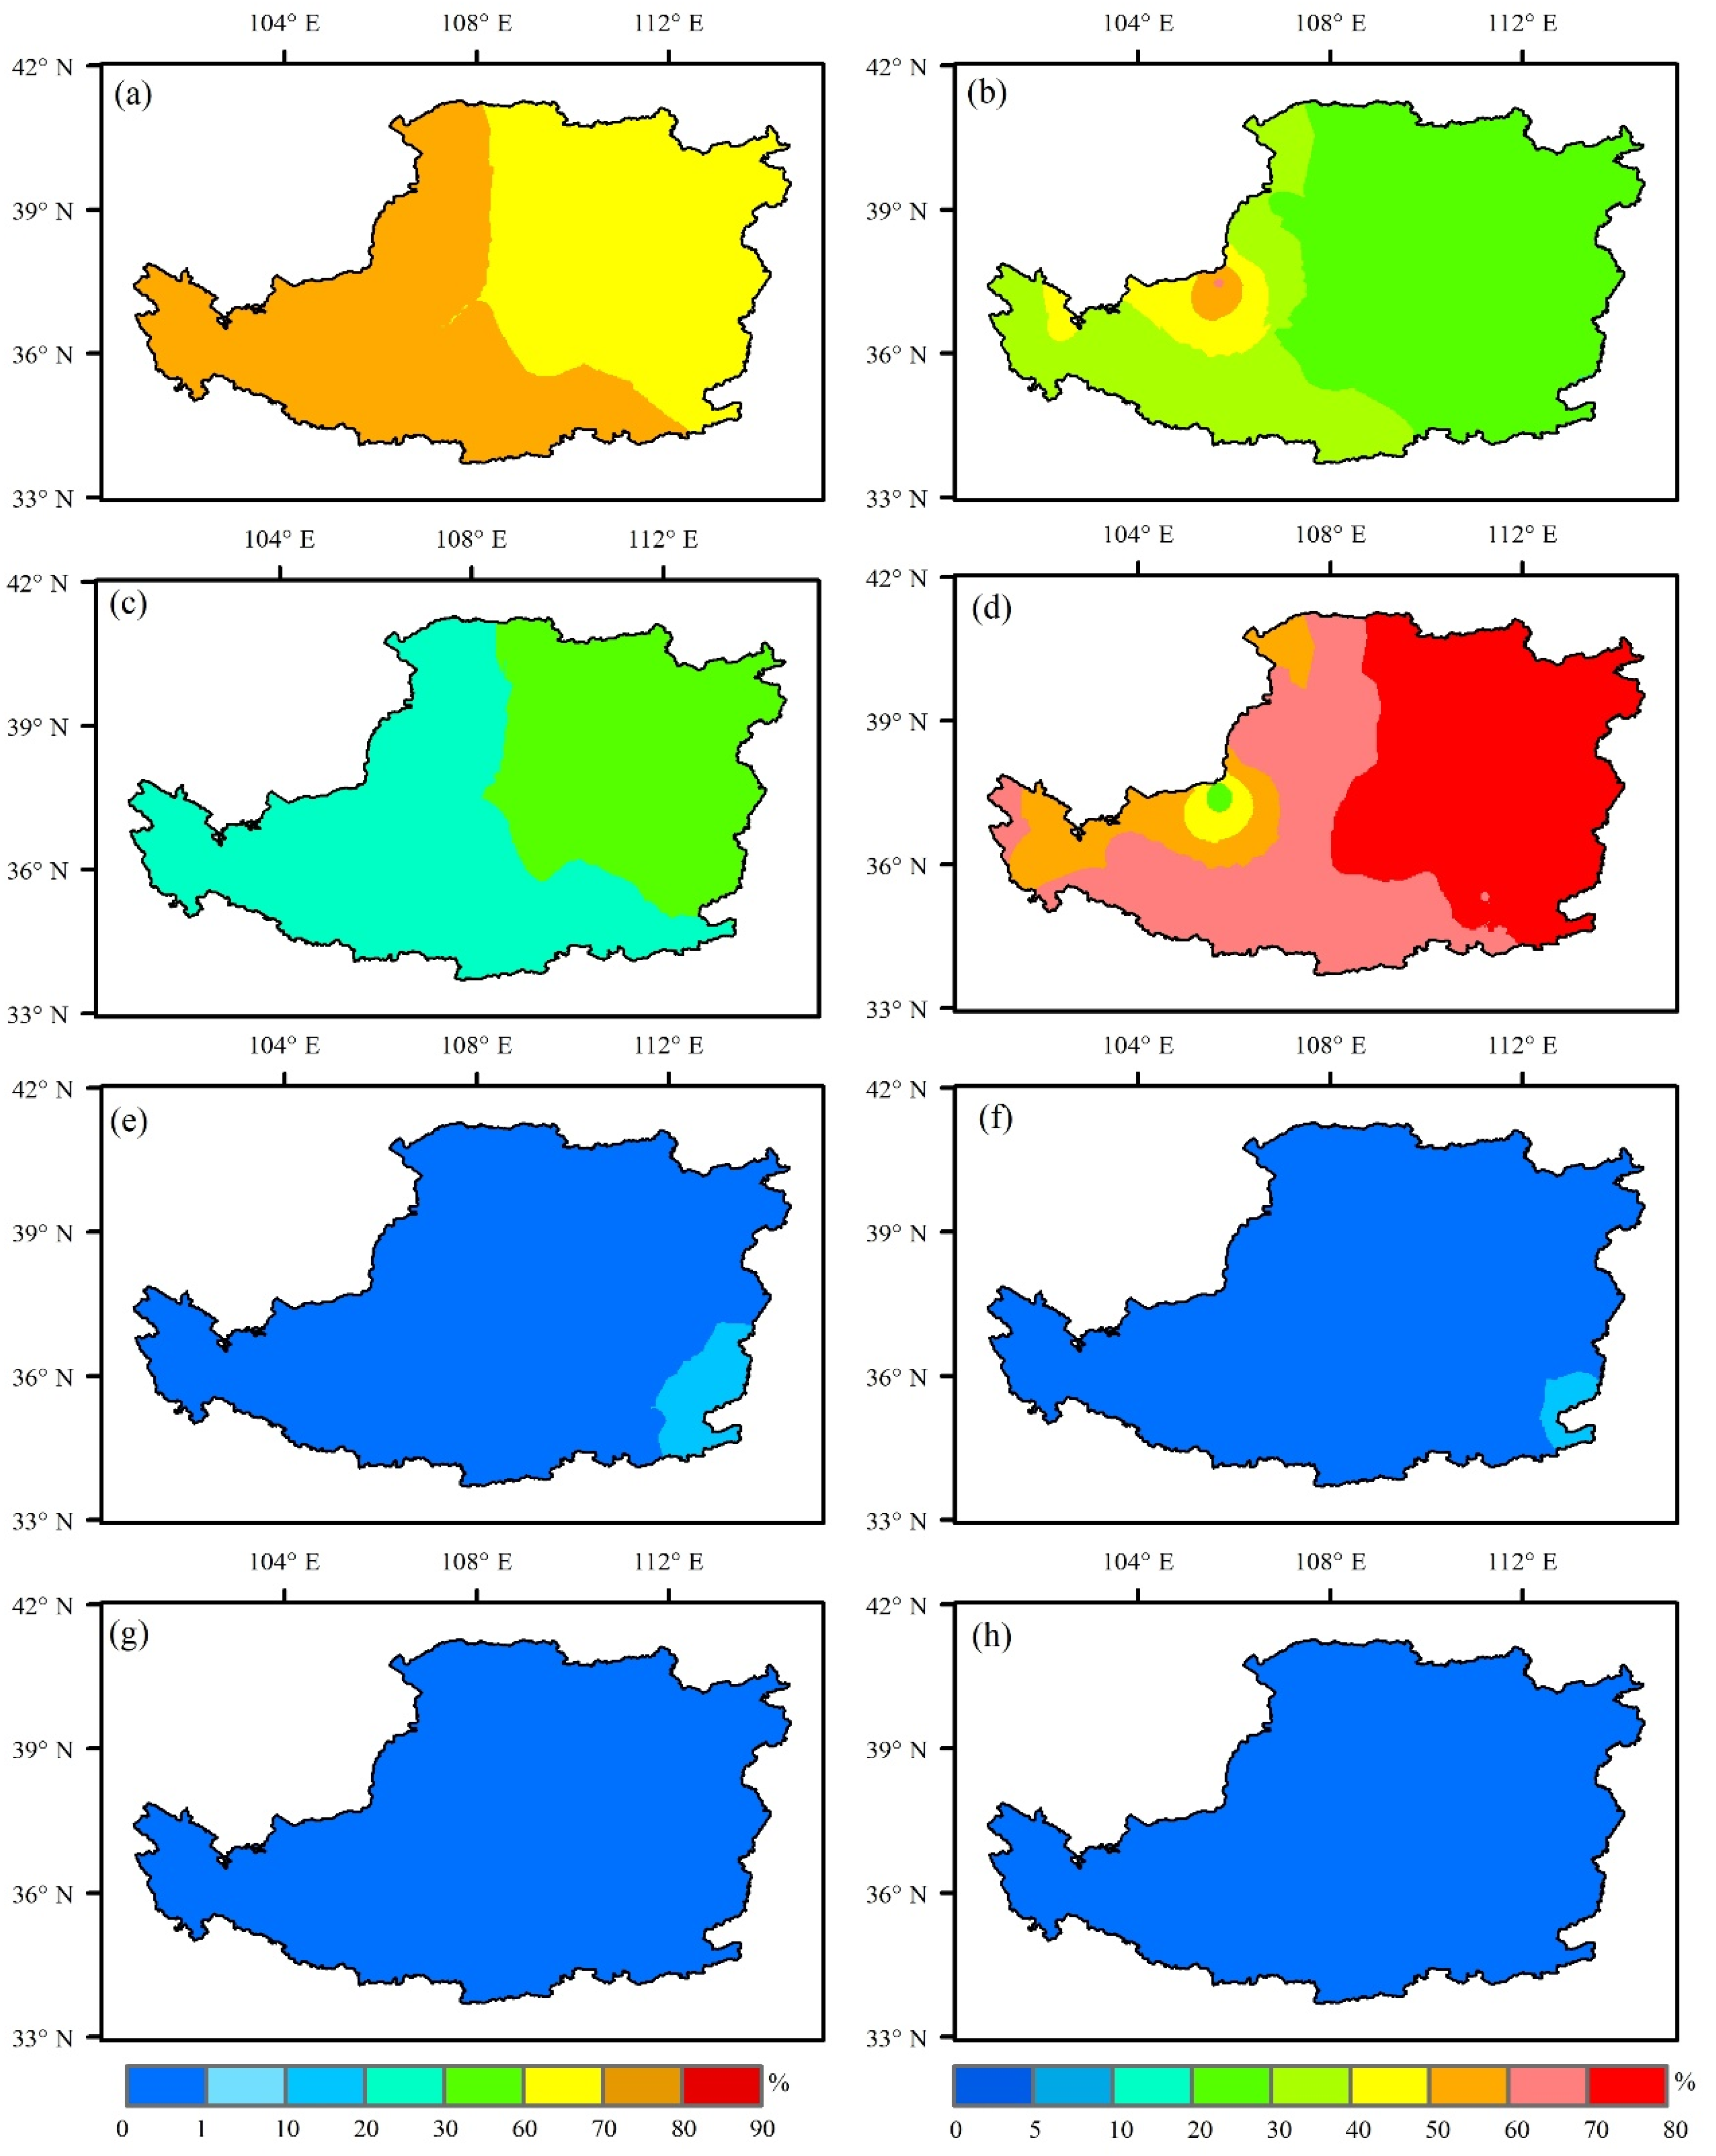
3.3. The Incidence and Contribution Rates for the Rainfall Intensity Classes
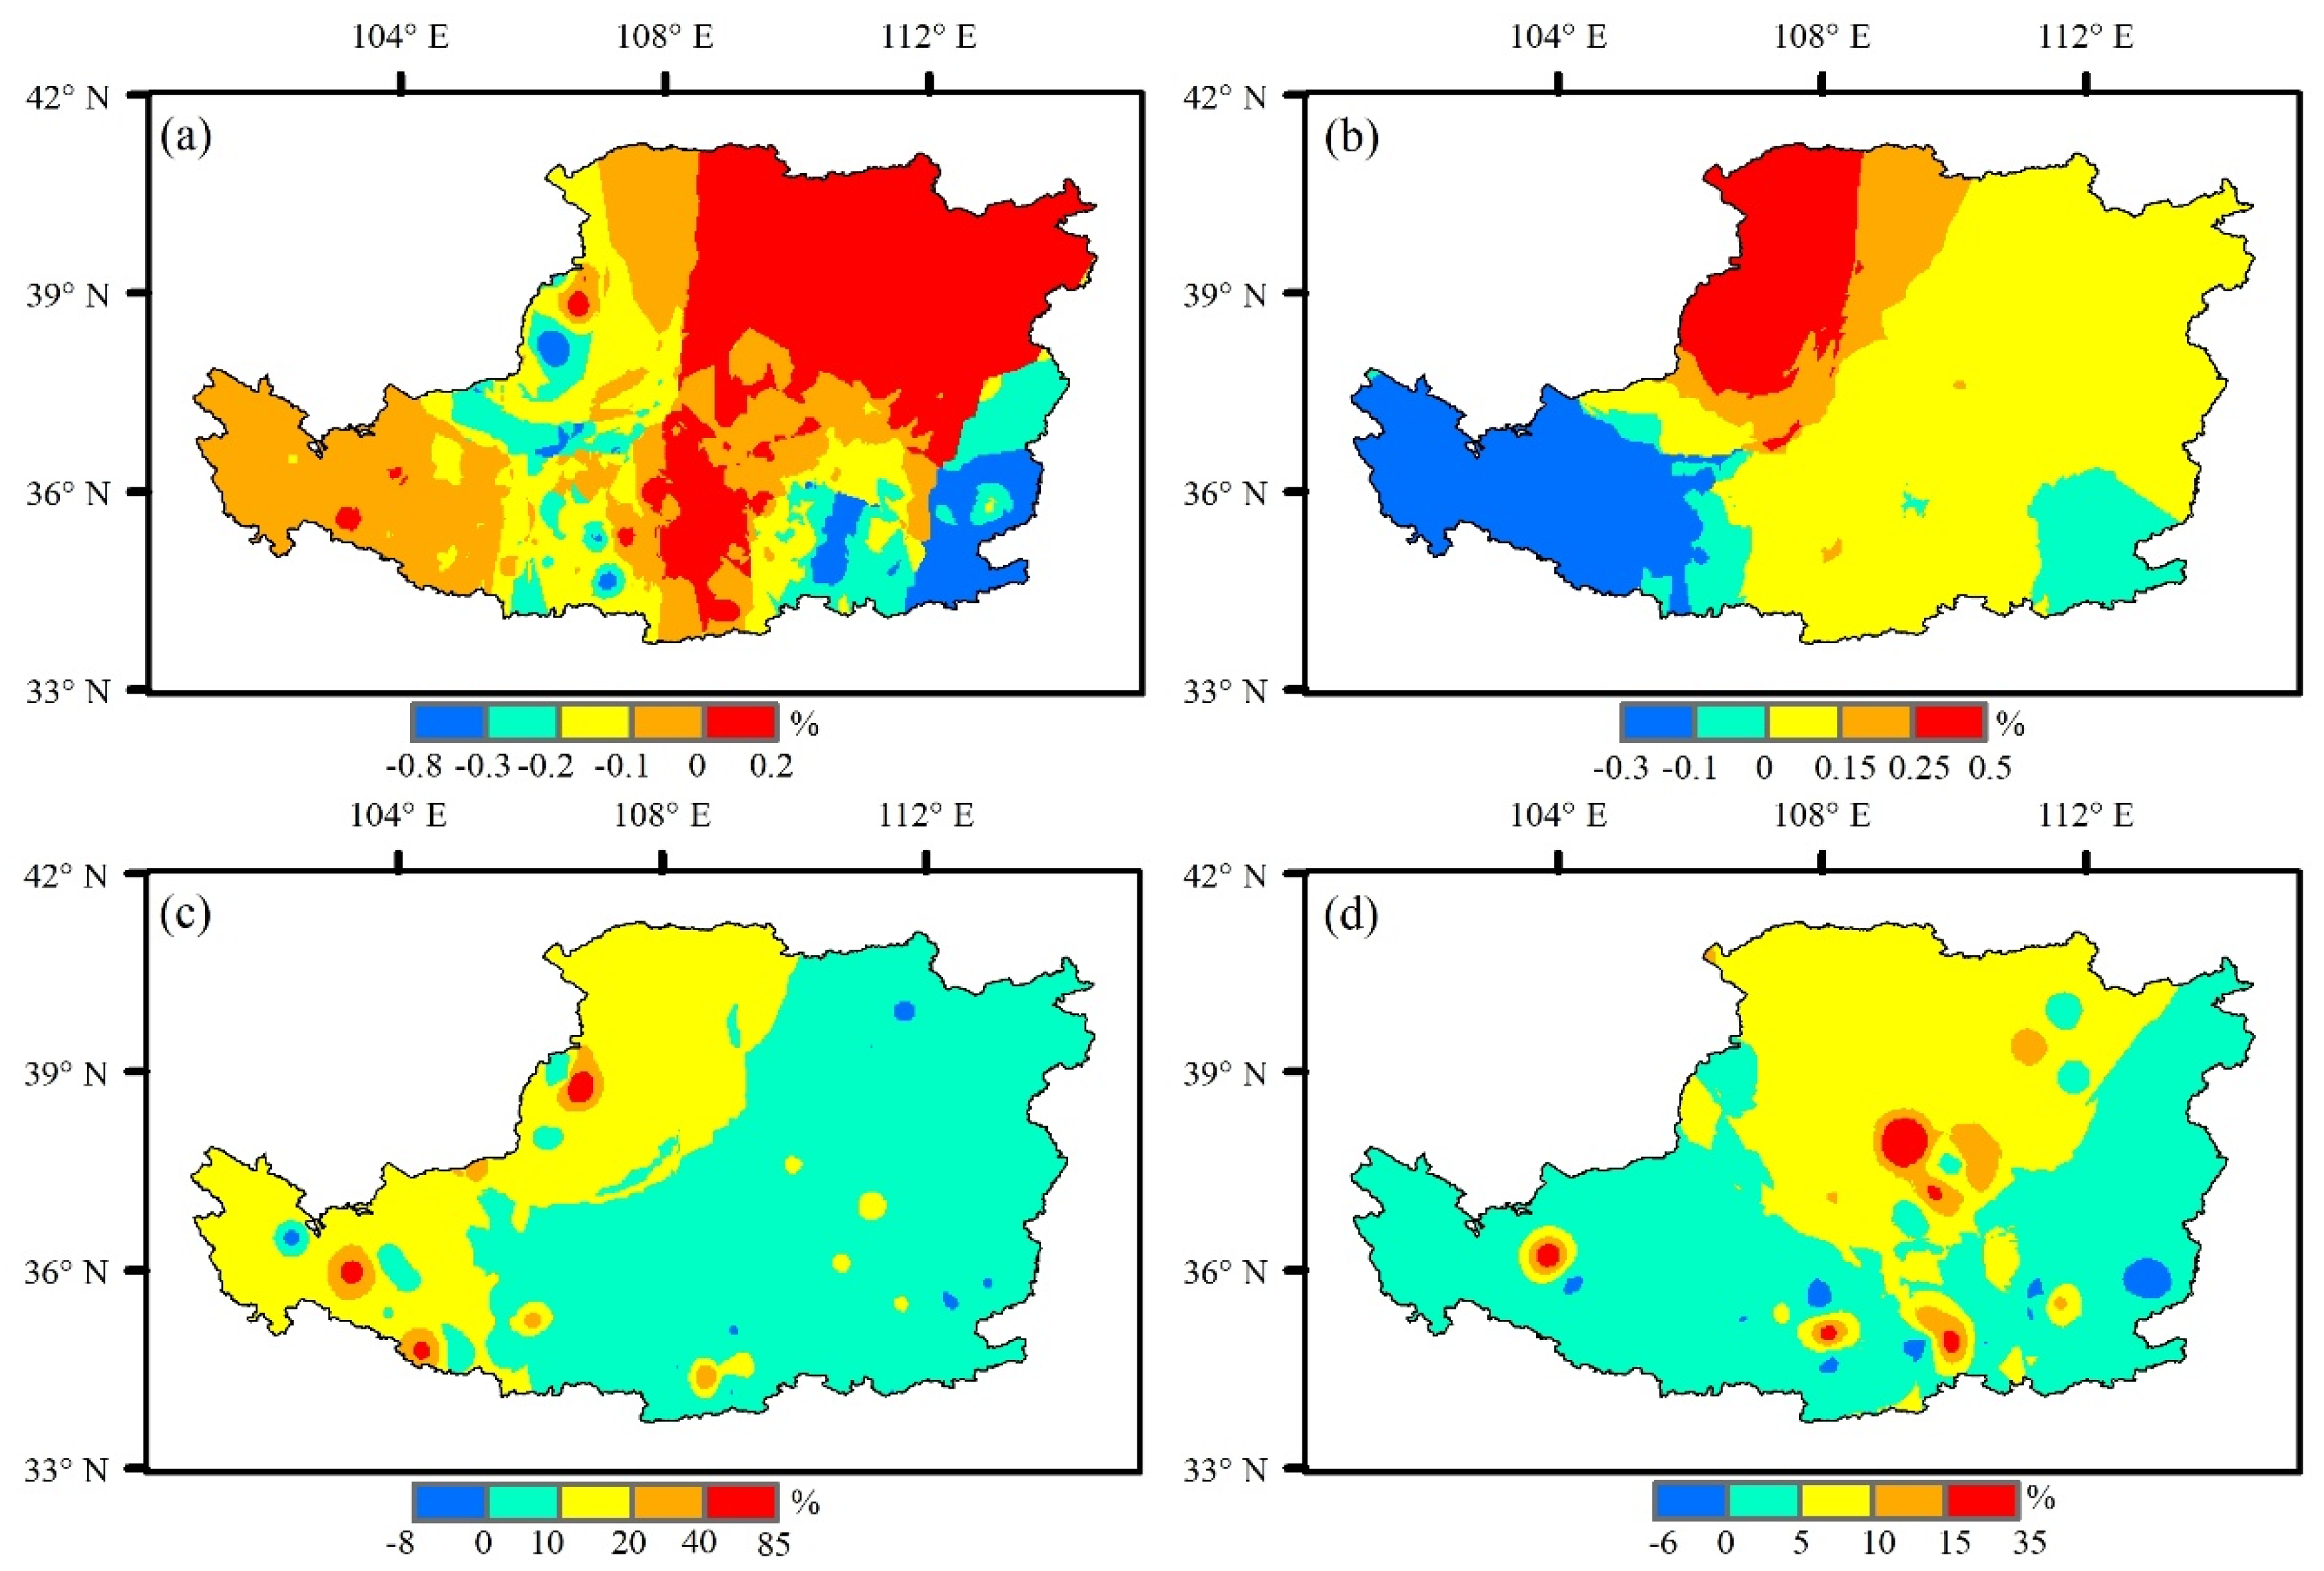
3.4. The Contributions of Rainfall Frequency and Intensity to Total Rainfall Amount Changes
3.5. The Contribution of Rainfall Events and Its Duration to Rainfall Frequency Variations
4. Discussions
4.1. Comparisons with Previous Studies
4.2. The Driving Factors in Interannual Rainfall Amount and Frequency Variability
5. Conclusions
Author Contributions
Funding
Acknowledgments
Conflicts of Interest
References
- Taikan, O.; Shinjiro, K. Global hydrological cycles and world water resources. Science 2006, 313, 1068–1072. [Google Scholar]
- Li, D.; Sun, J.; Fu, S.-M.; Wei, J.; Wang, S.; Tian, F. Spatiotemporal characteristics of hourly precipitation over central eastern China during the warm season of 1982–2012. Int. J. Clim. 2016, 36, 3148–3160. [Google Scholar] [CrossRef]
- Wang, C. Impact of anthropogenic absorbing aerosols on clouds and precipitation: A review of recent progresses. Atmos. Res. 2013, 122, 237–249. [Google Scholar] [CrossRef]
- Willems, P.; Arnbjerg-Nielsen, K.; Olsson, J.; Nguyen, V. Climate change impact assessment on urban rainfall extremes and urban drainage: Methods and shortcomings. Atmos. Res. 2012, 103, 106–118. [Google Scholar] [CrossRef]
- Tang, X.; Miao, C.; Xi, Y.; Duan, Q.; Lei, X.; Li, H. Analysis of precipitation characteristics on the loess plateau between 1965 and 2014, based on high-density gauge observations. Atmos. Res. 2018, 213, 264–274. [Google Scholar] [CrossRef]
- Sang, Y.-F.; Singh, V.P.; Gong, T.; Xu, K.; Sun, F.; Liu, C.; Liu, W.; Chen, R. Precipitation variability and response to changing climatic condition in the Yarlung Tsangpo River basin, China. J. Geophys. Res. Atmos. 2016, 121, 8820–8831. [Google Scholar] [CrossRef]
- Thomas, C.; MacCracken, J.S.; Perry; Ted, M. Encyclopedia of Global Environmental Change; Wiley & Sons: Chichester, UK, 2003; pp. 450–464. [Google Scholar]
- Liu, C.; Zheng, H. Changes in components of the hydrological cycle in the Yellow River basin during the second half of the 20th century. Hydrol. Process. 2004, 18, 2337–2345. [Google Scholar] [CrossRef]
- Koster, R.D.; Guo, Z.C.; Paul, A.D.; Gordon, B.; Edmond, C.; Peter, C.; Harvey, D.; Gordon, C.T.; Shinjiro, K.; Eva, K.; et al. GLACE: The Global Land-Atmosphere Coupling Experiment. Part I: Overview. J. Hydrom. 2006, 7, 590–610. [Google Scholar] [CrossRef]
- Guo, Z.C.; Paul, A.D.; Randal, D.K.; Gordon, B.; Edmond, C.; Peter, C.; Gordon, C.T.; Shinjiro, K.; Eva, K.; David, L.; et al. GLACE: The Global Land-Atmosphere Coupling Experiment. Part II: Analysis. J. Hydrom. 2006, 7, 611–625. [Google Scholar] [CrossRef]
- Martens, B.; Waegeman, W.; Dorigo, W.A.; Verhoest, N.E.C.; Miralles, D. Terrestrial evaporation response to modes of climate variability. Npj Clim. Atmos. Sci. 2018, 1, 1–7. [Google Scholar] [CrossRef]
- GianottiiD, D.J.S.; Akbar, R.; Feldman, A.F.; SalvucciiD, G.D.; Entekhabi, D. Terrestrial Evaporation and Moisture Drainage in a Warmer Climate. Geophys. Res. Lett. 2020, 47. [Google Scholar] [CrossRef]
- Gordon, L.J.; Steffen, W.; Jönsson, B.F.; Folke, C.; Falkenmark, M.; Ase, J. Human modification of global water vapor flows from the land surface. Proc. Natl. Acad. Sci. USA 2005, 102, 7612–7617. [Google Scholar] [CrossRef] [PubMed]
- Kevin, E.T. Changes in Precipitation with Climate Change. Clim. Res. 2011, 47, 123–138. [Google Scholar]
- Li, Z.; Zheng, F.-L.; Liu, W.; Flanagan, D.C. Spatial distribution and temporal trends of extreme temperature and precipitation events on the Loess Plateau of China during 1961–2007. Quat. Int. 2010, 226, 92–100. [Google Scholar] [CrossRef]
- Shrestha, A.; Babel, M.S.; Weesakul, S.; Vojinovic, Z. Developing Intensity–Duration–Frequency (IDF) Curves under Climate Change Uncertainty: The Case of Bangkok, Thailand. Water 2017, 9, 145. [Google Scholar] [CrossRef]
- Yu, R.; Chen, H.; Sun, W. The Definition and Characteristics of Regional Rainfall Events Demonstrated by Warm Season Precipitation over the Beijing Plain. J. Hydrometeorol. 2015, 16, 396–406. [Google Scholar] [CrossRef]
- Groisman, P.; Knight, R.W.; Easterling, D.R.; Karl, T.R.; Hegerl, G.C.; Razuvaev, V.N. Trends in Intense Precipitation in the Climate Record. J. Clim. 2005, 18, 1326–1350. [Google Scholar] [CrossRef]
- Trenberth, K.E.; Jones, P.D.; Ambenje, P.; Bojariu, R.; Easterling, D.; Klein, T.A.; Parker, D.; Rahimzadeh, F.; Renwick, J.A.; Rusticucci, M.; et al. Climate Change 2007: The Physical Science Basis. Contribution of Working Group I to the Fourth Assessment Report of the Intergovernmental Panel on Climate Change; Cambridge University Press: Cambridge, UK, 2007. [Google Scholar]
- Taschetto, A.S.; England, M.H. An analysis of late twentieth century trends in Australian rainfall. Int. J. Clim. 2009, 29, 791–807. [Google Scholar] [CrossRef]
- Barros, V.R.; Doyle, M.E.; Camilloni, I.A. Precipitation trends in southeastern South America: Relationship with ENSO phases and with low-level circulation. Appl. Clim. 2008, 93, 19–33. [Google Scholar] [CrossRef]
- Norrant, C.; Douguedroit, A. Monthly and daily precipitation trends in the Mediterranean (1950–2000). Appl. Clim. 2006, 83, 89–106. [Google Scholar] [CrossRef]
- Villar, J.C.E.; Ronchail, J.; Guyot, J.L.; Cochonneau, G.; Naziano, F.; Lavado, W.; De Oliveira, E.; Pombosa, R.; Vauchel, P.; Lavado-Casimiro, W. Spatio-temporal rainfall variability in the Amazon basin countries (Brazil, Peru, Bolivia, Colombia, and Ecuador). Int. J. Clim. 2009, 29, 1574–1594. [Google Scholar] [CrossRef]
- Van Haren, R.; Van Oldenborgh, G.J.; Lenderink, G.; Collins, M.; Hazeleger, W. SST and circulation trend biases cause an underestimation of European precipitation trends. Clim. Dyn. 2012, 40, 1–20. [Google Scholar] [CrossRef]
- Yao, C.; Yang, S.; Qian, W.; Lin, Z.; Wen, M. Regional summer precipitation events in Asia and their changes in the past decades. J. Geophys. Res. Space Phys. 2008, 113, 17107. [Google Scholar] [CrossRef]
- Yu, R.; Li, J.; Yuan, W.; Chen, H. Changes in Characteristics of Late-Summer Precipitation over Eastern China in the Past 40 Years Revealed by Hourly Precipitation Data. J. Clim. 2010, 23, 3390–3396. [Google Scholar] [CrossRef]
- Ye, J.; Li, W.; Li, L.; Zhang, F. “North drying and south wetting” summer precipitation trend over China and its potential linkage with aerosol loading. Atmos. Res. 2013, 125, 12–19. [Google Scholar] [CrossRef]
- Li, X.; Wen, Z.; Zhou, W. Long-term Change in Summer Water Vapor Transport over South China in Recent Decades. J. Meteorol. Soc. Jpn. 2011, 89, 271–282. [Google Scholar] [CrossRef]
- Zhai, P.M.; Zhang, X.B.; Wan, H.; Pan, X.H. Trends in total precipitation and frequency ofdaily precipitation extremes over China. J. Clim. 2005, 18, 1096–1108. [Google Scholar] [CrossRef]
- Liu, B.H.; Xu, M.; Henderson, M.; Qi, Y. Observed trends of precipitation amount, frequency, and intensity in china, 1960–2000. J. Geophys. Res. Atmos. 2005, 110. [Google Scholar] [CrossRef]
- Sui, Y.; Jiang, D.; Tian, Z. Latest update of the climatology and changes in the seasonal distribution of precipitation over China. Appl. Clim. 2012, 113, 599–610. [Google Scholar] [CrossRef]
- Xu, X.; Du, Y.; Tang, J.; Wang, Y. Variations of temperature and precipitation extremes in recent two decades over China. Atmos. Res. 2011, 101, 143–154. [Google Scholar] [CrossRef]
- You, Q.; Kang, S.; Aguilar, E.; Pepin, N.; Flügel, W.-A.; Yan, Y.; Xu, Y.; Zhang, Y.; Huang, J. Changes in daily climate extremes in China and their connection to the large scale atmospheric circulation during 1961–2003. Clim. Dyn. 2010, 36, 2399–2417. [Google Scholar] [CrossRef]
- Wang, Y.R.; Lv, S.H. Sensitivity Analysis of the Response of Precipitation to Climate Change over China Loess Plateau. J. Glaciol. Geocryol. 2008, 30, 43–51, (In Chinese with abstract). [Google Scholar]
- Li, L.-J.; Zhang, L.; Wang, H.; Wang, J.; Yang, J.-W.; Jiang, D.-J.; Li, J.-Y.; Qin, D.-Y. Assessing the impact of climate variability and human activities on streamflow from the Wuding River basin in China. Hydrol. Process. Int. J. 2007, 21, 3485–3491. [Google Scholar] [CrossRef]
- Wang, F.T.; Liu, W.Q. A Preliminary Study of Climate Vulnerability of Agro-Production in the Loess Plateau. Clim. Environ. Res. 2003, 1, 91–100, (In Chinese with abstract). [Google Scholar]
- Jia, X.; Shao, M.; Zhu, Y.; Luo, Y. Soil moisture decline due to afforestation across the Loess Plateau, China. J. Hydrol. 2017, 546, 113–122. [Google Scholar] [CrossRef]
- Feng, X.; Fu, B.; Piao, S.; Wang, S.; Ciais, P.; Zeng, Z.; Lü, Y.-H.; Zeng, Y.; Li, Y.; Jiang, X.; et al. Revegetation in China’s Loess Plateau is approaching sustainable water resource limits. Nat. Clim. Chang. 2016, 6, 1019–1022. [Google Scholar] [CrossRef]
- Wang, S.; Fu, B.; Piao, S.; Lü, Y.-H.; Ciais, P.; Feng, X.; Wang, Y. Reduced sediment transport in the Yellow River due to anthropogenic changes. Nat. Geosci. 2015, 9, 38–41. [Google Scholar] [CrossRef]
- Tan, H.; Wen, X.; Rao, W.; Bradd, J.; Huang, J. Temporal variation of stable isotopes in a precipitation-groundwater system: Implications for determining the mechanism of groundwater recharge in high mountain-hills of the Loess Plateau, China. Hydrol. Process. 2015, 30, 1491–1505. [Google Scholar] [CrossRef]
- Fu, G.; Chen, S.; Liu, C.; Shepard, D. Hydro-Climatic Trends of the Yellow River Basin for the Last 50 Years. Clim. Chang. 2004, 65, 149–178. [Google Scholar] [CrossRef]
- Qian, W.; Lin, X. Regional trends in recent precipitation indices in China. Appl. Clim. 2005, 90, 193–207. [Google Scholar] [CrossRef]
- Liu, Q.; Yang, Z.F.; Cui, B.S. Spatial and temporal variability of annual precipitation during 1961–2006 in Yellow River Basin, China. J. Hydrol. 2008, 361, 330–338. [Google Scholar] [CrossRef]
- Yang, D.; Li, C.; Hu, H.; Lei, Z.; Yang, S.; Kusuda, T.; Koike, T.; Musiake, K. Analysis of water resources variability in the Yellow River of China during the last half century using historical data. Water Resour. Res. 2004, 40, 308–322. [Google Scholar] [CrossRef]
- Wang, Q.-X.; Wang, M.-B.; Fan, X.; Zhang, F.; Zhu, S.-Z.; Zhao, T.-L. Trends of temperature and precipitation extremes in the Loess Plateau Region of China, 1961–2010. Appl. Clim. 2017, 129, 949–963. [Google Scholar] [CrossRef]
- Sun, W.Y.; Mu, X.M.; Song, X.Y.; Wu, D.; Cheng, A.F.; Qiu, B. Changes in extreme temperature and precipitation events in the Loess Plateau (China) during 1960–2013 under global warming. Atmos. Res. 2016, 168, 33–48. [Google Scholar] [CrossRef]
- Yan, G.; Qi, F.; Wei, L.; Aigang, L.; Yu, W.; Jing, Y.; Aifang, C.; Yamin, W.; Yubo, S.; Li, L.; et al. Changes of daily climate extremes in Loess Plateau during 1960–2013. Quat. Int. 2015, 371, 5–21. [Google Scholar] [CrossRef]
- Wang, Q.X.; Fan, X.H.; Wang, M.B. Precipitation trends during 1961–2010 in the Loess Plateau region of China. Acta Ecol. Sin. 2011, 31, 5512–5523, (In Chinese with abstract). [Google Scholar]
- Cooley, A.; Chang, H. Precipitation Intensity Trend Detection using Hourly and Daily Observations in Portland, Oregon. Climate 2017, 5, 10. [Google Scholar] [CrossRef]
- Li, Z.; Zheng, F.-L.; Liu, W.; Jiang, D.-J. Spatially downscaling GCMs outputs to project changes in extreme precipitation and temperature events on the Loess Plateau of China during the 21st Century. Glob. Planet. Chang. 2012, 82, 65–73. [Google Scholar] [CrossRef]
- Chen, L.; Wei, W.; Fu, B.; Lü, Y.-H. Soil and water conservation on the Loess Plateau in China: Review and perspective. Prog. Phys. Geogr. 2007, 31, 389–403. [Google Scholar] [CrossRef]
- Dai, A.; Giorgi, F.; Trenberth, K.E. Observed and model-sim Environ. ulated diurnal cycles of precipitation over the contiguous United States. J. Geophys. Res. Space Phys. 1999, 104, 6377–6402. [Google Scholar] [CrossRef]
- Chen, H.; Zhou, T.; Yu, R.; Li, J. Summer rain fall duration and its diurnal cycle over the US Great Plains. Int. J. Clim. 2009, 29, 1515–1519. [Google Scholar] [CrossRef]
- Yu, R.C.; Xu, Y.P.; Zhou, T.J.; Li, J. Relation between rainfall duration and diurnal cycle in the warm season precipitation over central eastern China. Geophys. Res. Lett. 2007, 34, 173–180. [Google Scholar] [CrossRef]
- Jin, W.X.; Li, W.J.; Sun, C.H.; Zuo, J.Q. Spatiotemporal Characteristics of Summer Precipitation with Different Durations in Central East China. Clim. Environ. Res. 2015, 20, 465–476, (In Chinese with abstract). [Google Scholar]
- Zhu, X.; Zhang, Q.; Sun, P.; Singh, V.P.; Shi, P.; Song, C. Impact of urbanization on hourly precipitation in Beijing, China: Spatiotemporal patterns and causes. Glob. Planet. Chang. 2019, 172, 307–324. [Google Scholar] [CrossRef]
- Karl, T.R.; Knight, R.W. Secular Trends of Precipitation Amount, Frequency, and Intensity in the United States. Bull. Am. Meteorol. Soc. 1998, 79, 231–241. [Google Scholar] [CrossRef]
- Yue, S.; Pilon, P.; Cavadias, G. Power of the Mann–Kendall and Spearman’s rho tests for detecting monotonic trends in hydrological series. J. Hydrol. 2002, 259, 254–271. [Google Scholar] [CrossRef]
- Mann, H.B. Nonparametric Tests against Trend. Econ. J. Econ. Soc. 1945, 13, 245–259. [Google Scholar] [CrossRef]
- Kendall, M.G. Rank Correlation Methods; Charles Griffin: London, UK, 1975. [Google Scholar]
- Tamaddun, K.A.; Kalra, A.; Kumar, S.; Ahmad, S. CMIP5 Models’ Ability to Capture Observed Trends under the Influence of Shifts and Persistence: An In-Depth Study on the Colorado River Basin. J. Appl. Meteorol. Clim. 2019, 58, 1677–1688. [Google Scholar] [CrossRef]
- Tamaddun, K.; Kalra, A.; Ahmad, S. Identification of Streamflow Changes across the Continental United States Using Variable Record Lengths. Hydrology 2016, 3, 24. [Google Scholar] [CrossRef]
- Tamaddun, K.; Kalra, A.; Bernardez, M.; Ahmad, S. Effects of ENSO on Temperature, Precipitation, and Potential Evapotranspiration of North India’s Monsoon: An Analysis of Trend and Entropy. Water 2019, 11, 189. [Google Scholar] [CrossRef]
- Gocic, M.; Trajkovic, S. Analysis of changes in meteorological variables using Mann-Kendall and Sen’s slope estimator statistical tests in Serbia. Glob. Planet. Chang. 2013, 100, 172–182. [Google Scholar] [CrossRef]
- Miao, C.Y.; Sun, Q.H.; Duan, Q.Y.; Wang, Y.F. Joint analysis of changes in temperature and precipitation on the Loess Plateau during the period 1961–2011. Clim. Dyn. 2016, 47, 3221–3234. [Google Scholar] [CrossRef]
- Guo, R.; Li, F.; He, W.; Yang, S.; Sun, G. Spatial and Temporal Variability of Annual Precipitation during 1958-2007 in Loess Plateau, China. Integr. Intern. Control. Inf. Syst. 2010, 345, 551–560. [Google Scholar]
- Zhao, W.; Yu, X.; Ma, H.; Zhu, Q.; Zhang, Y.; Qin, W.; Ai, N.; Wang, Y. Analysis of Precipitation Characteristics during 1957-2012 in the Semi-Arid Loess Plateau, China. PLoS ONE 2015, 10, e0141662. [Google Scholar] [CrossRef] [PubMed]
- Liu, Y.F.; Zhu, G.F.; Zhao, J.; Li, Q.; Hu, P.F.; Wang, K.; Pan, H.X. Spatial and Temporal Variation of Different Precipitation Type in the Loess Plateau Area. Sci. Geogr. Sin. 2016, 26, 1227–1233, (In Chinese with abstract). [Google Scholar]
- Roy, S.S. A spatial analysis of extreme hourly precipitation patterns in India. Int. J. Clim. 2009, 29, 345–355. [Google Scholar] [CrossRef]
- Qin, F.Y.; Jia, G.S.; Yang, J.; Na, Y.T.; Hou, M.T. Narenmandula. Spatiotemporal variability of precipitation during 1961–2014 across the Mongolian Plateau. J. Mt. Sci. 2018, 15, 992–1005. [Google Scholar] [CrossRef]
- Feng, Y.; Zhao, X. Changes in spatiotemporal pattern of precipitation over China during 1980–2012. Environ. Earth Sci. 2015, 73, 1649–1662. [Google Scholar] [CrossRef]
- Liu, S.; Wang, H.; Yan, D.; Ren, Q.; Wang, D.; Gong, B. Analysis of Spatiotemporal Evolution of Isolated Rainstorm Events in Huai River Basin, China. Adv. Meteorol. 2017, 2017. [Google Scholar] [CrossRef]
- Liu, B.; Chen, J.; Lu, W.; Chen, X.; Lian, Y. Spatiotemporal characteristics of precipitation changes in the Pearl River Basin, China. Appl. Clim. 2016, 123, 537–550. [Google Scholar] [CrossRef]
- Wan, L.; Zhang, X.P.; Ma, Q.; Zhang, J.J.; Ma, T.Y.; Sun, Y. Spatiotemporal characteristics of precipitation and extreme events on the Loess Plateau of China between 1957 and 2009. Hydrol. Process. 2013, 28, 4971–4983. [Google Scholar] [CrossRef]
- Sun, Q.; Miao, C.; Duan, Q.; Wang, Y. Temperature and precipitation changes over the Loess Plateau between 1961 and 2011, based on high-density gauge observations. Glob. Planet. Chang. 2015, 132, 1–10. [Google Scholar] [CrossRef]
- Xin, Z.B.; Lu, X.X. Spatiotemporal variation in rainfall erosivity on the Chinese Loess Plateau during the period 1956–2008. Reg. Environ. Chang. 2011, 11, 149–159. [Google Scholar] [CrossRef]
- Good, S.P.; Guan, K.; Caylor, K.K. Global Patterns of the Contributions of Storm Frequency, Intensity, and Seasonality to Interannual Variability of Precipitation. J. Clim. 2016, 29, 3–15. [Google Scholar] [CrossRef]
- Chen, X.Y.; Shang, K.Z.; Wang, S.G.; Yang, D.B. Analysis on the Spatiotemporal Characteristics of Precipitation under Different Intensities in China in Recent 50 Years. Arid. Zone Res. 2010, 27, 766–772, (In Chinese with abstract). [Google Scholar]
- Lin, Y.P.; Zhao, C.S. Trends of precipitation of different intensity in China. Acta Sci. Nat. Univ. Pekin. 2009, 45, 995–1002, (In Chinese with abstract). [Google Scholar]


© 2020 by the authors. Licensee MDPI, Basel, Switzerland. This article is an open access article distributed under the terms and conditions of the Creative Commons Attribution (CC BY) license (http://creativecommons.org/licenses/by/4.0/).
Share and Cite
Ding, W.; Wang, F.; Jin, K.; Han, J.; Yu, Q.; Ren, Q.; Shi, S. Individual Rainfall Change Based on Observed Hourly Precipitation Records on the Chinese Loess Plateau from 1983 to 2012. Water 2020, 12, 2268. https://doi.org/10.3390/w12082268
Ding W, Wang F, Jin K, Han J, Yu Q, Ren Q, Shi S. Individual Rainfall Change Based on Observed Hourly Precipitation Records on the Chinese Loess Plateau from 1983 to 2012. Water. 2020; 12(8):2268. https://doi.org/10.3390/w12082268
Chicago/Turabian StyleDing, Wenbin, Fei Wang, Kai Jin, Jianqiao Han, Qiang Yu, Qingfu Ren, and Shangyu Shi. 2020. "Individual Rainfall Change Based on Observed Hourly Precipitation Records on the Chinese Loess Plateau from 1983 to 2012" Water 12, no. 8: 2268. https://doi.org/10.3390/w12082268
APA StyleDing, W., Wang, F., Jin, K., Han, J., Yu, Q., Ren, Q., & Shi, S. (2020). Individual Rainfall Change Based on Observed Hourly Precipitation Records on the Chinese Loess Plateau from 1983 to 2012. Water, 12(8), 2268. https://doi.org/10.3390/w12082268