Effect of Distribution Uniformity and Fertigation Volume on the Bio-Productivity of the Greenhouse Zucchini Crop

 ,
, 


Abstract
1. Introduction
2. Materials and Methods
2.1. Experimental Site
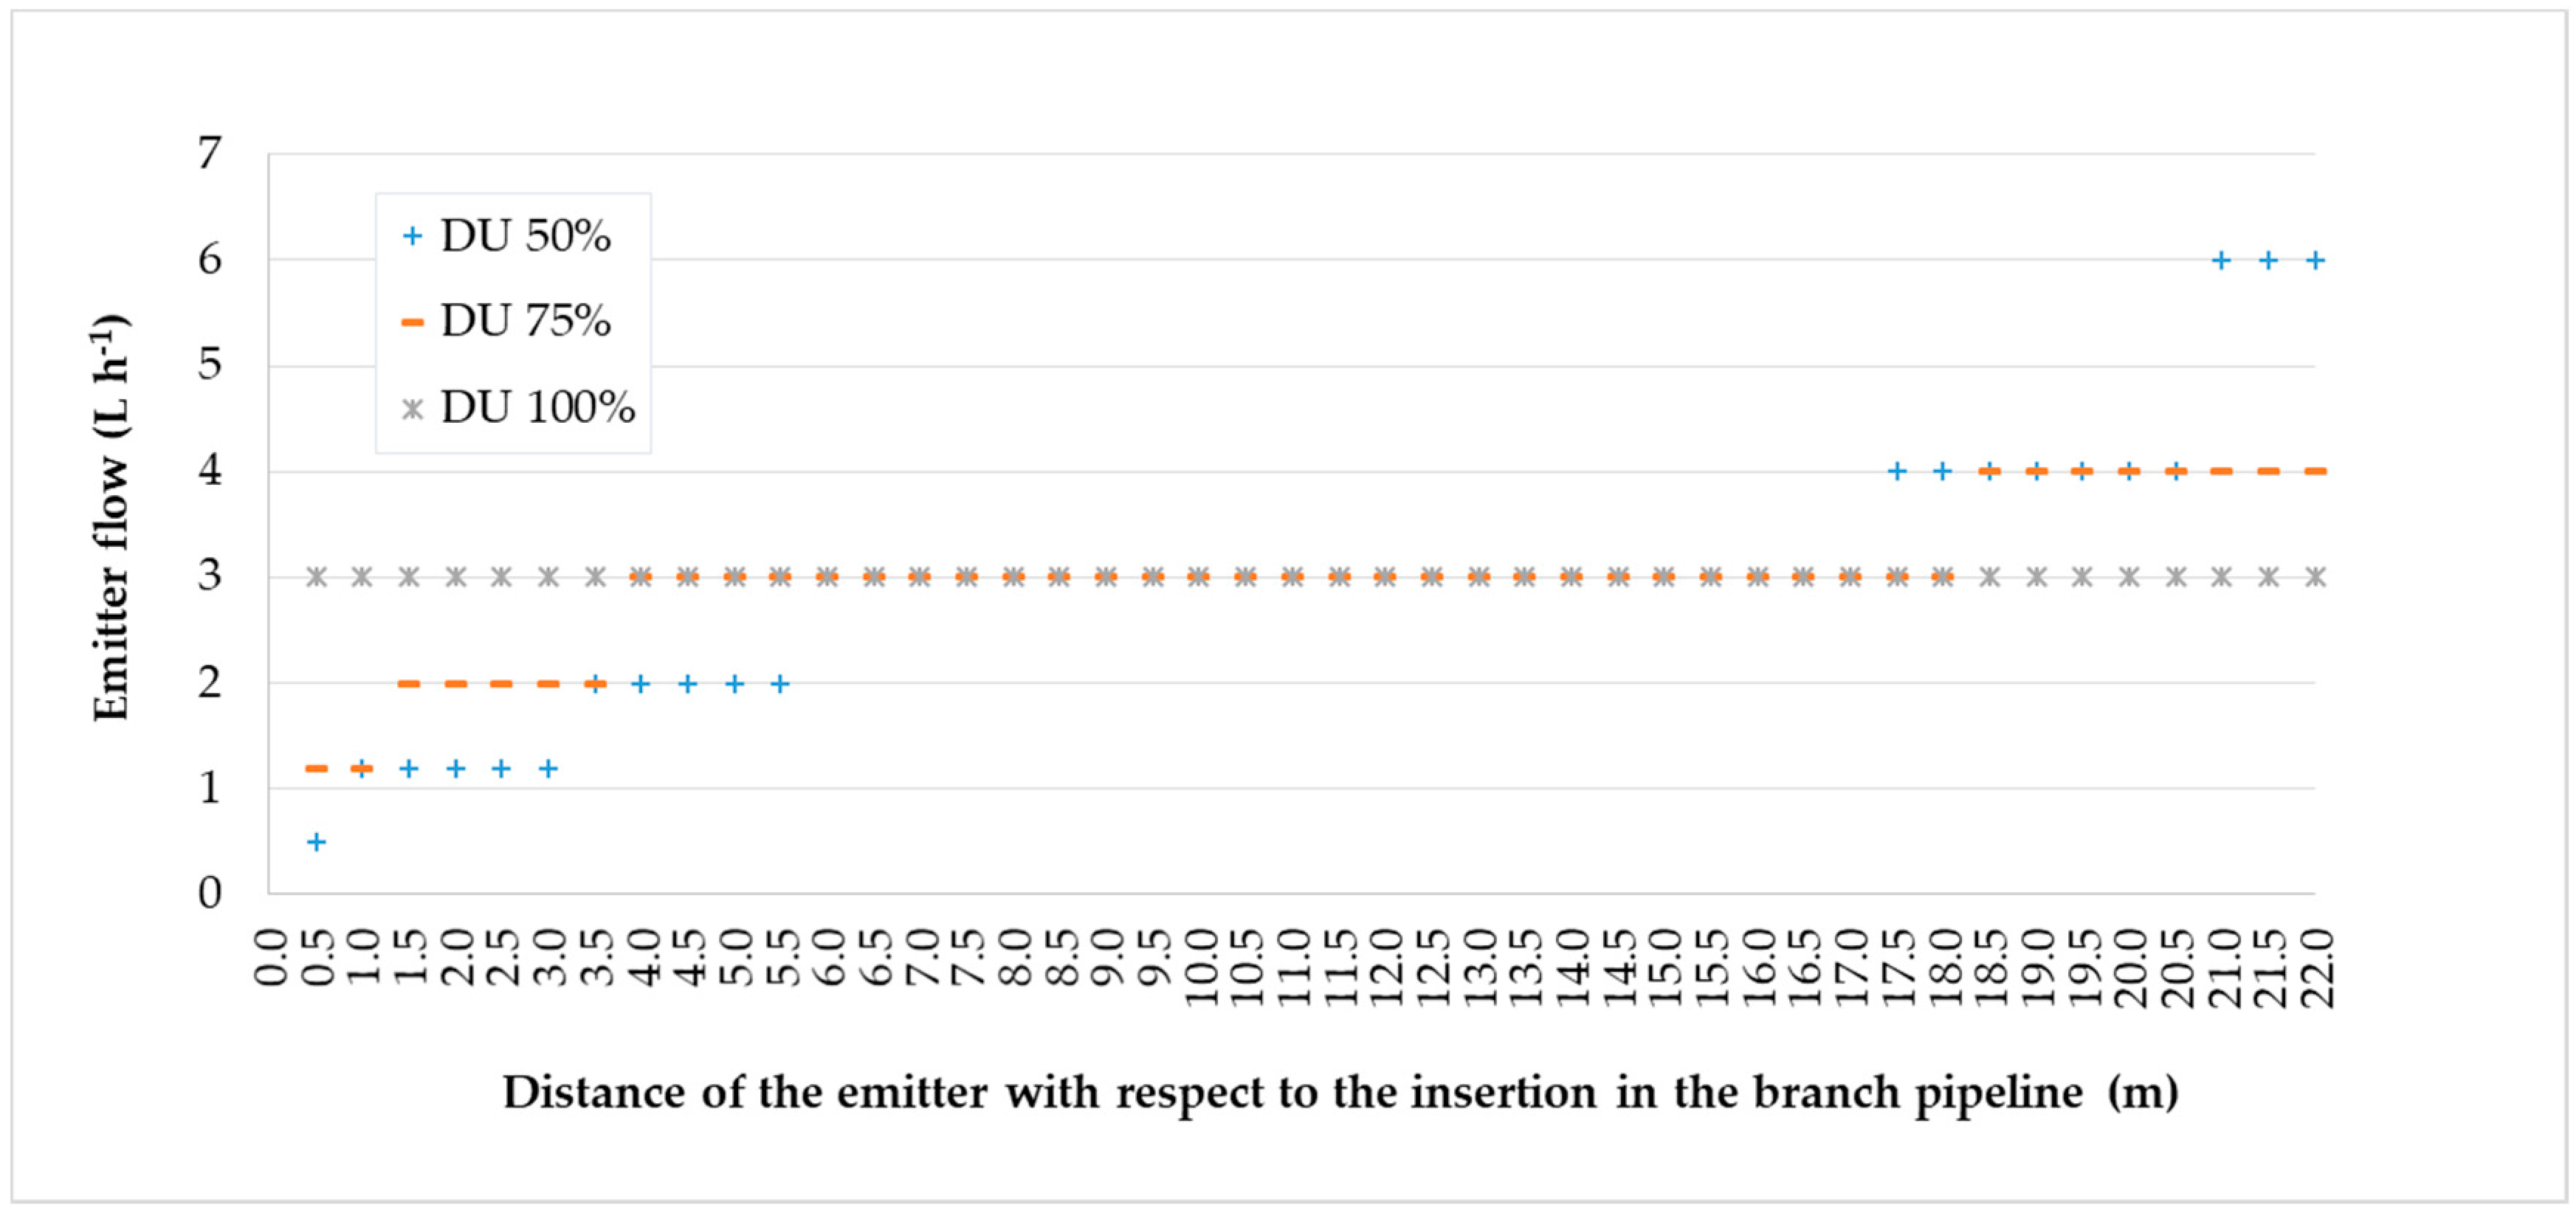
2.2. Experimental Design and Cropping Systems
- q25% = average discharge of the 25% of the emitters with the lowest flow rate (L h−1);
- qm = average discharge of all emitter tested (L h−1).
2.3. Measurements
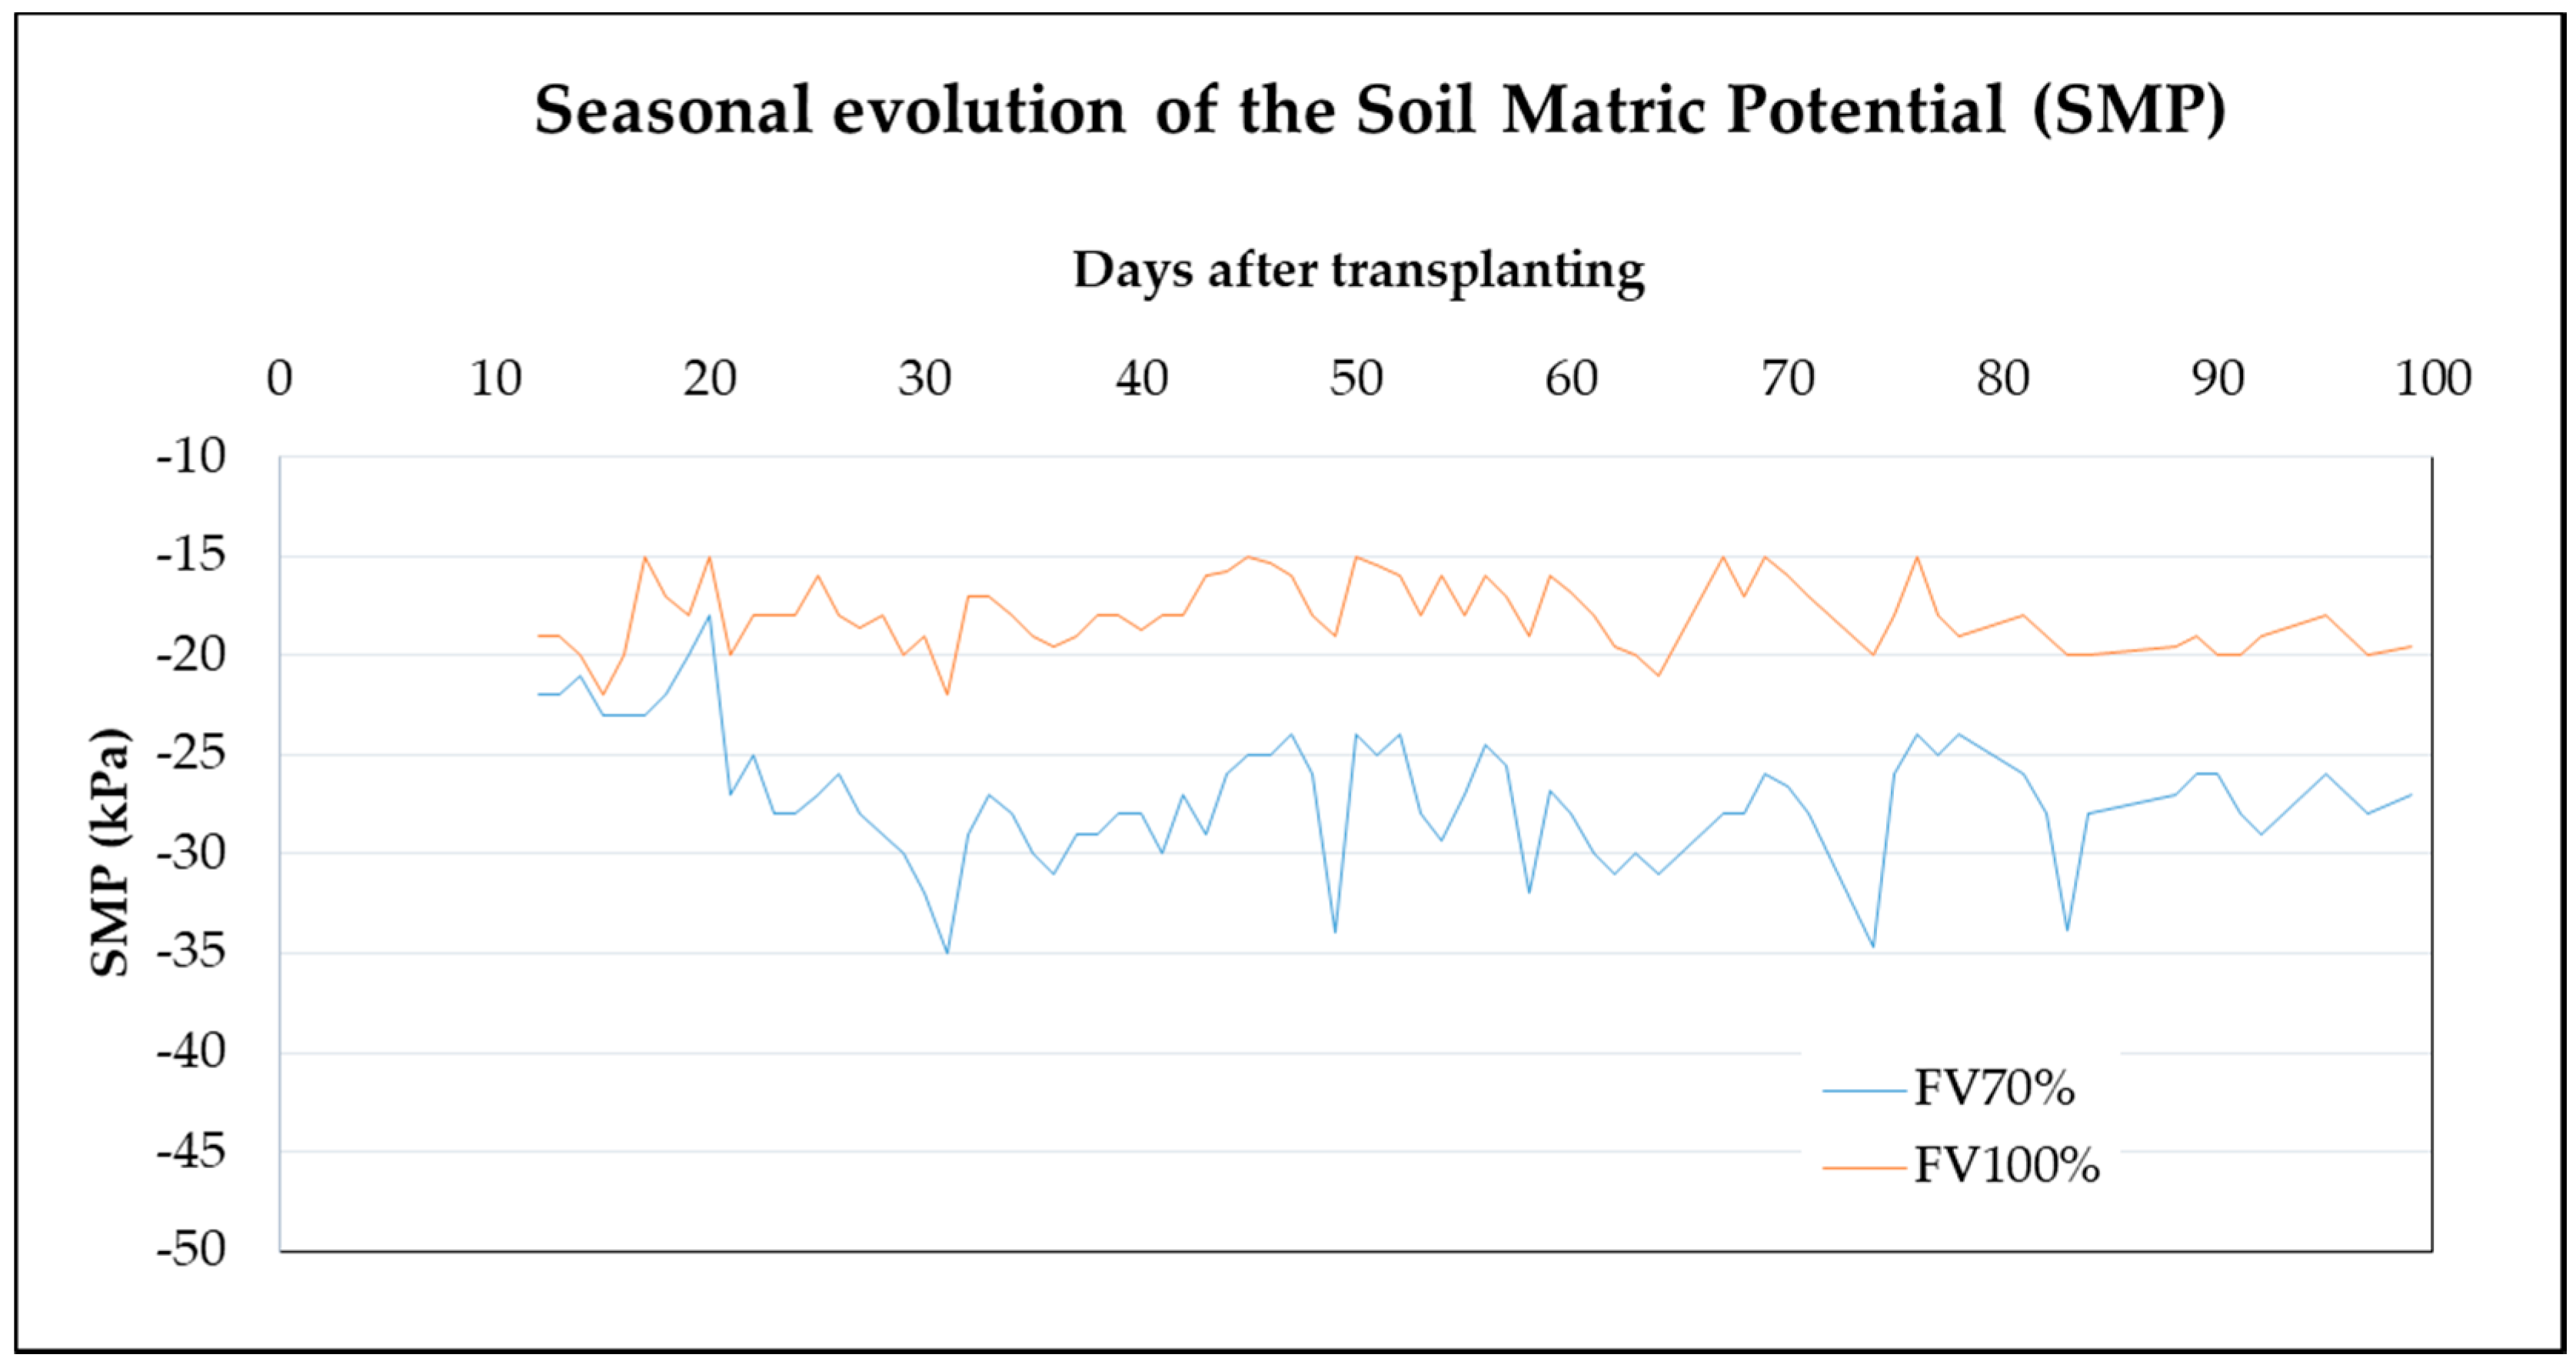
- Soil matric potential (SMP, kPa): the soil matric potential for each level of FV was measured using tensiometers during the entire crop cycle. Six soil moisture tensiometers—3 per level (Irrometer Co., inc. Riverside, CA, USA)—were installed. The measurements were recorded every day before the irrigation (around 9.00 a.m.). Tensiometers were installed at 15 cm from the base of the plant and 15 cm deep, an area of great root representativeness. The installation of the tensiometers was carried out on March 30, 15 days after the transplant to ensure the installation in plants that had adequate development.
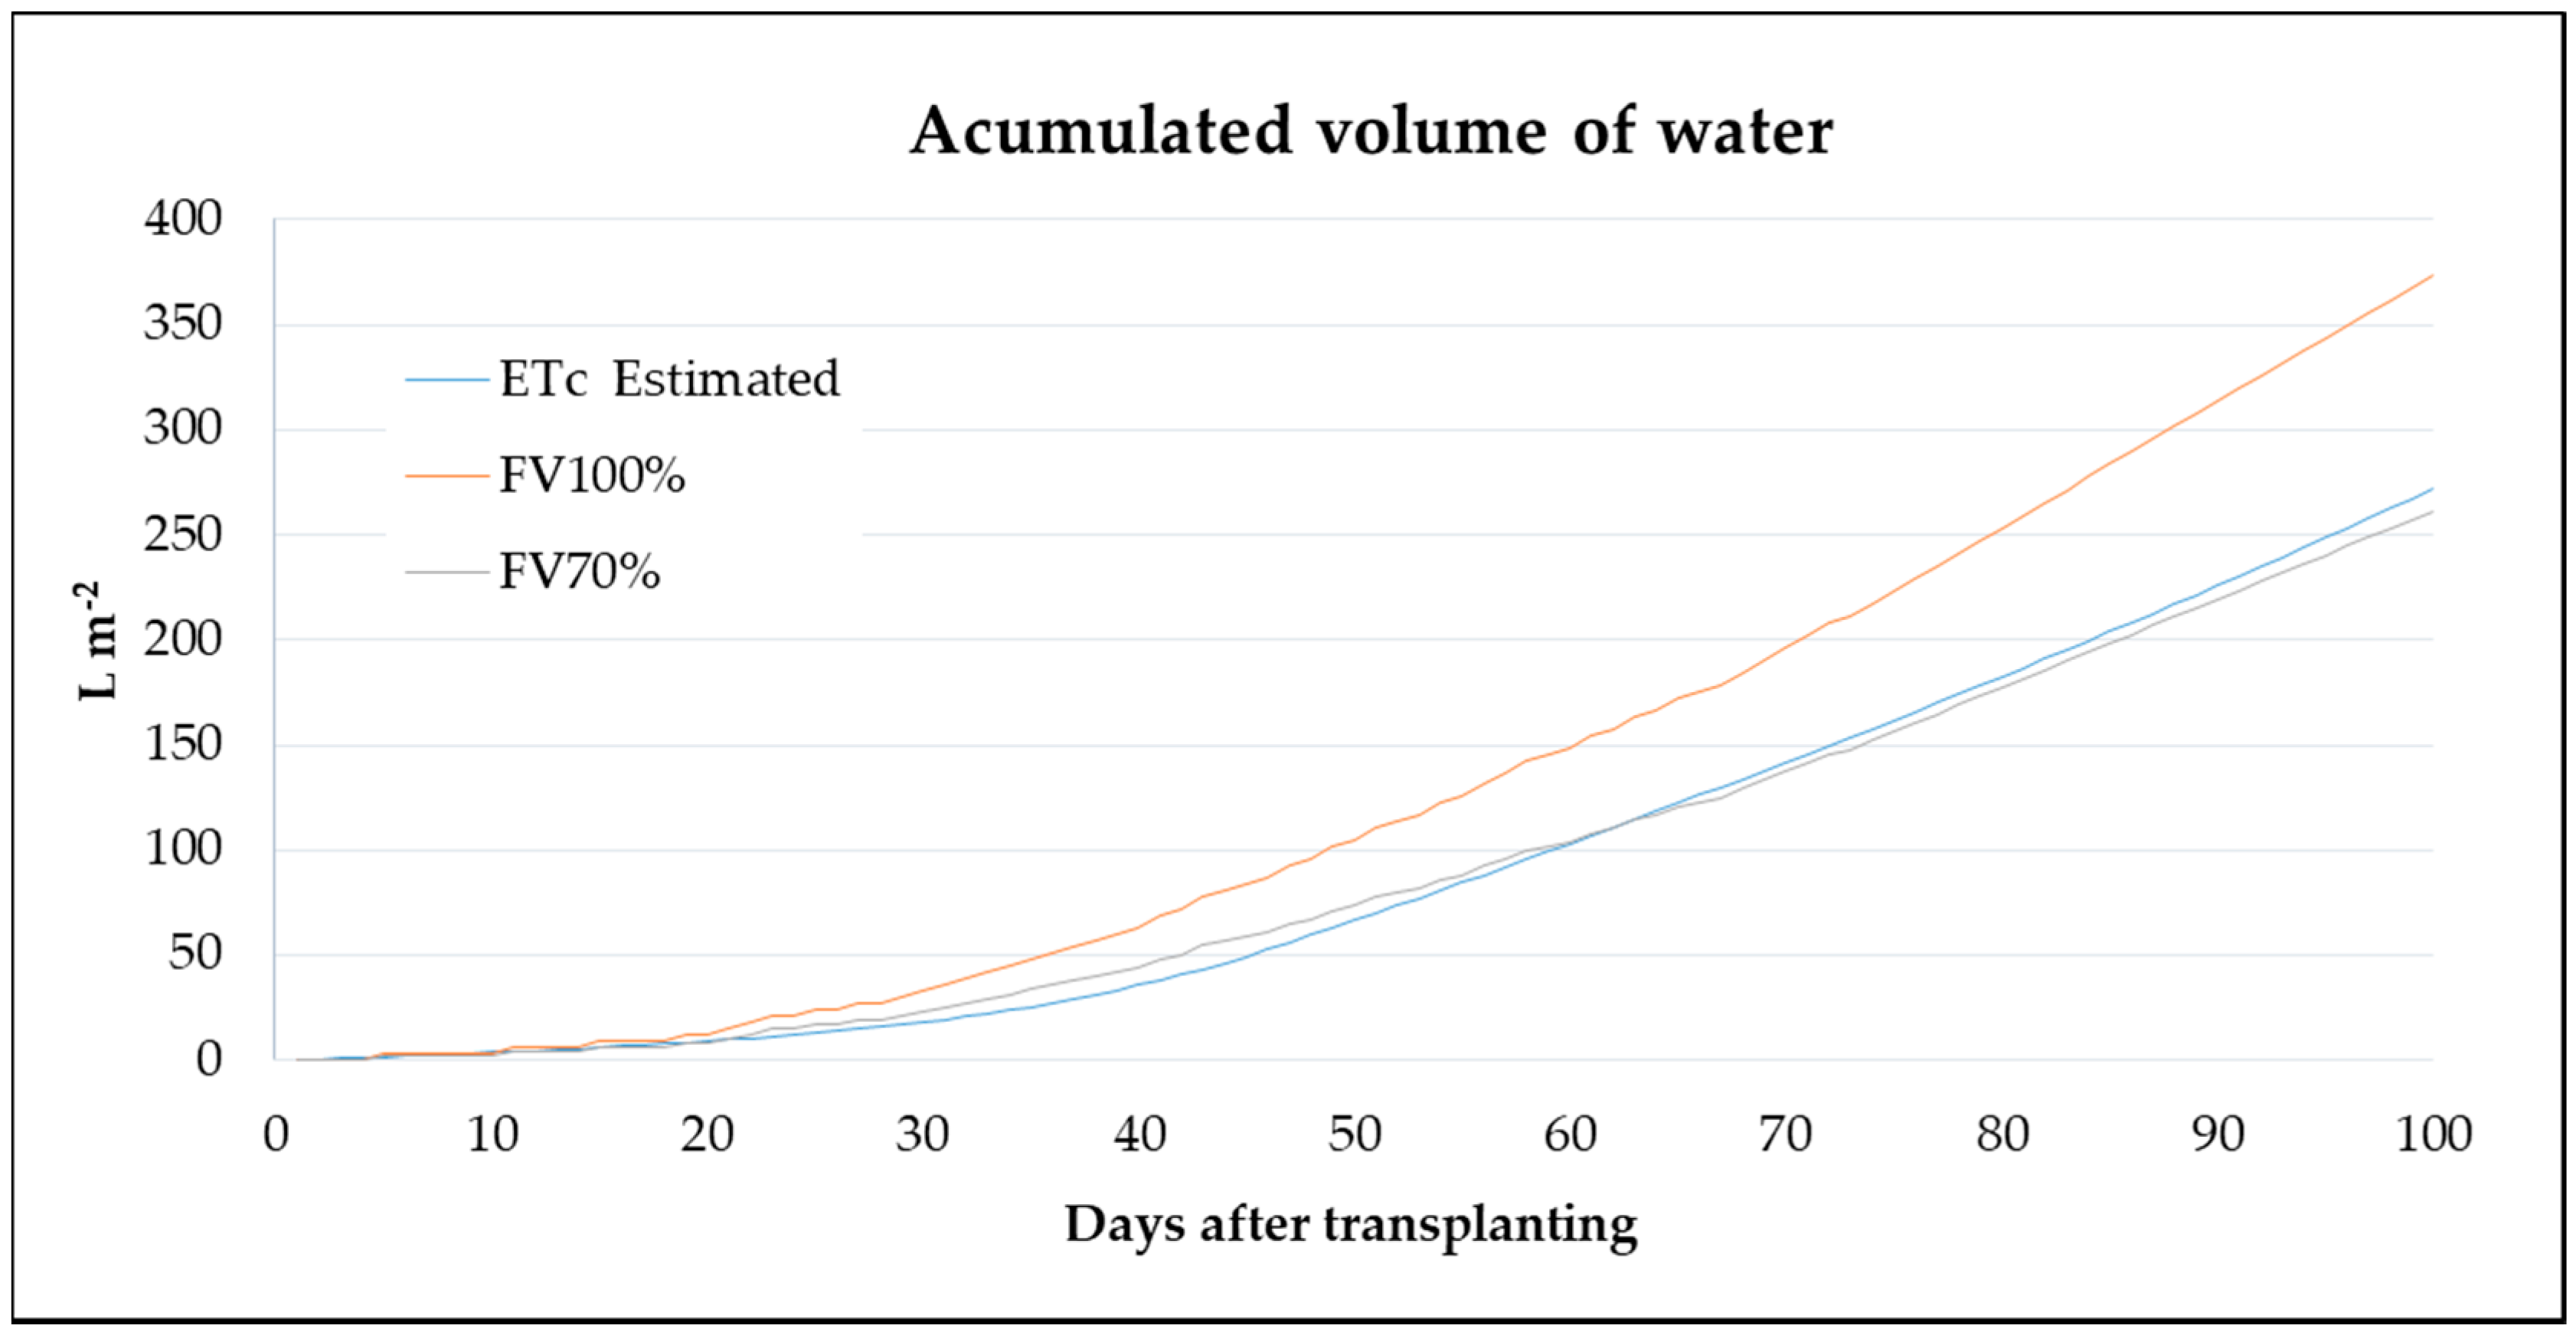
- Irrigation water and nutrients applied: the water applied (L m−2) was measured by installing three volumetric water meters (model M120 (Elster, Iberconta S.A., Guipúzcoa, Spain) for one level, which also checked and corroborated with the registration number of irrigations performed and the volume applied in each irrigation. The concentration of nutrients in the applied nutrient solution was analyzed in the laboratory weekly. The samples were collected at the outlet by the dropper, placing a carafe that collected the volume of fertigation applied weekly in each treatment. The EC (dS m−1), pH and concentration of NO3−, P, K+, Ca2+ and Mg2+ (mM) were determined.
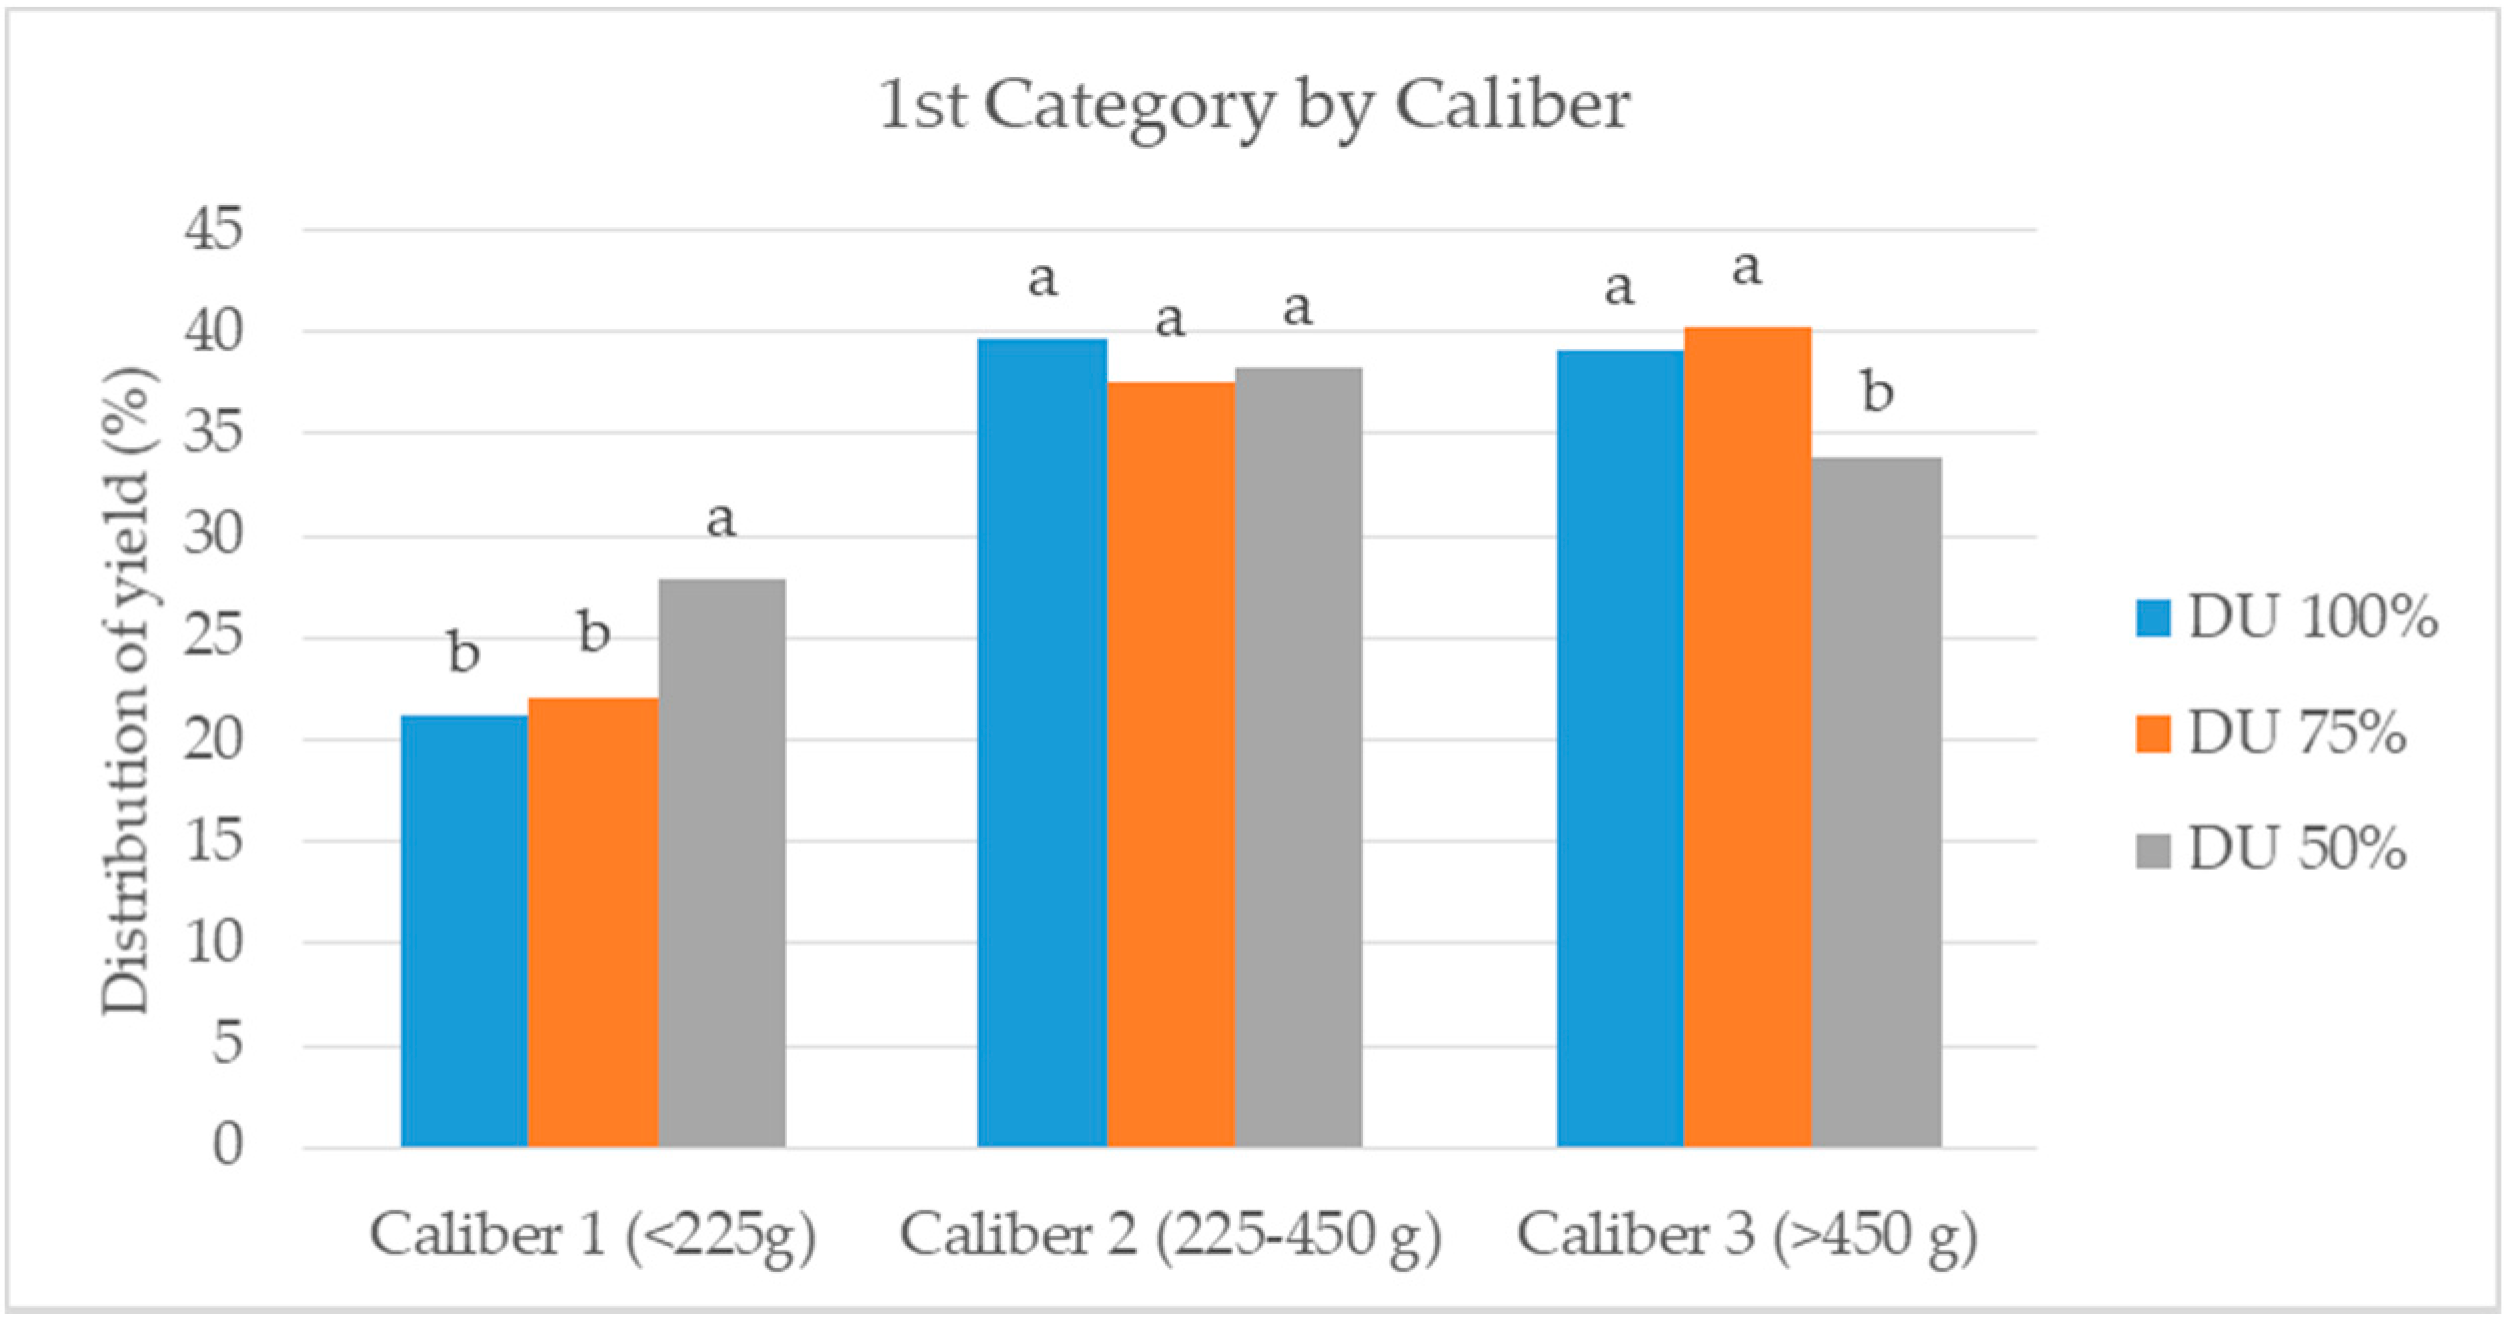
- Yield: fruit production was evaluated according to the following parameters: marketable yield by categories and calibers, and unmarketable yield. The 1st Category was of superior quality: well-developed, well-formed zucchini with the stalk neatly cut, a maximum length of 3 cm and free from defects, with the exception of very slight superficial defects. The 2nd Category was of good quality: zucchini included a stalk of a maximum length of 3 cm, but had a slight defect in shape, slight defects in coloration, slight skin defects and very slight defects due to diseases provided that they were not progressive and did not affect the flesh. The 1st Category was separated into calibers based on weight: Caliber 1 was fruits less than 225 g, Caliber 2 was fruits between 225 and 450 g and Caliber 3 was fruits lager than 450 g (fresh fruit weight (kg m−2) and number of fruits (Fruits m−2)). The fruits were manually harvested during the harvest period, controlling in all harvests the production of 44 plants (all plants of one whole pipeline) per plot, resulting in a total of 132 plants per level. The harvest period started on 15th April 2018 and ended on 15st June 2018, with a total of 26 harvests.
- Shoot biomass: whole plants, excluding the roots, were harvested from each experimental plot (six plants per replication) throughout the experiment. For the levels in which there were plants that received nutrient solutions with different emitter flow rates (FV75 and FV50), plants corresponding to all the emitter flows were selected, and the weighted average was calculated. Samples were partitioned into fruits (generative), leaves and stems. Harvested ripe fruits throughout the cycle were randomly selected at every harvesting, collecting 20 fruits per experimental plot. Fresh samples were dried at 70 °C to constant weight and dry biomass (DB, g m−2), and dry matter (DM, %) was determined.
- Harvest index (HI, g g−1): the harvest index was determined as the ratio between generative dry biomass and total shoot dry biomass.
- Water and nutrient use efficiency: water and nutrient use efficiency can be calculated in many ways [26,27,28,29,30]. We defined the efficiencies the following way:
- Water Use Efficiency (WUE, kg m−3) calculated according to Food and Agriculture Organization (FAO) [31]; Ym/Wcwhere:Ym is fruit marketable yield (kg m−2) and Wc is water applied (m3 m−2).
- Nitrogen Use Efficiency (NUE, kg kg−1); Ym/Ncwhere:Ym is fruit marketable yield (kg m−2) and Nc is nitrogen applied (kg m−2).
- Phosphorus Use Efficiency (PUE, kg kg−1); Ym/Pcwhere:Ym is fruit marketable yield (kg m−2) and Pc is phosphorus applied (kg m−2).
- Potassium Use Efficiency (KUE, kg kg−1); Ym/Kcwhere:Ym is fruit marketable yield (kg m−2) and Kc is potassium applied (kg m−2).
- Calcium Use Efficiency (CaUE, kg kg−1); Ym/Cacwhere:Ym is fruit marketable yield (kg m−2) and Cac is calcium applied (kg m−2).
- Magnesium Use Efficiency (MgUE, kg kg−1); Ym/Mgcwhere:Ym is fruit marketable yield (kg m−2) and Mgc is magnesium applied (kg m−2).
2.4. Statistical Analysis
3. Results
3.1. Soil Matric Potential (SMP)
3.2. Irrigation Water Applied and Nutrients
3.3. Yield
- DU Effect
- FV Effect
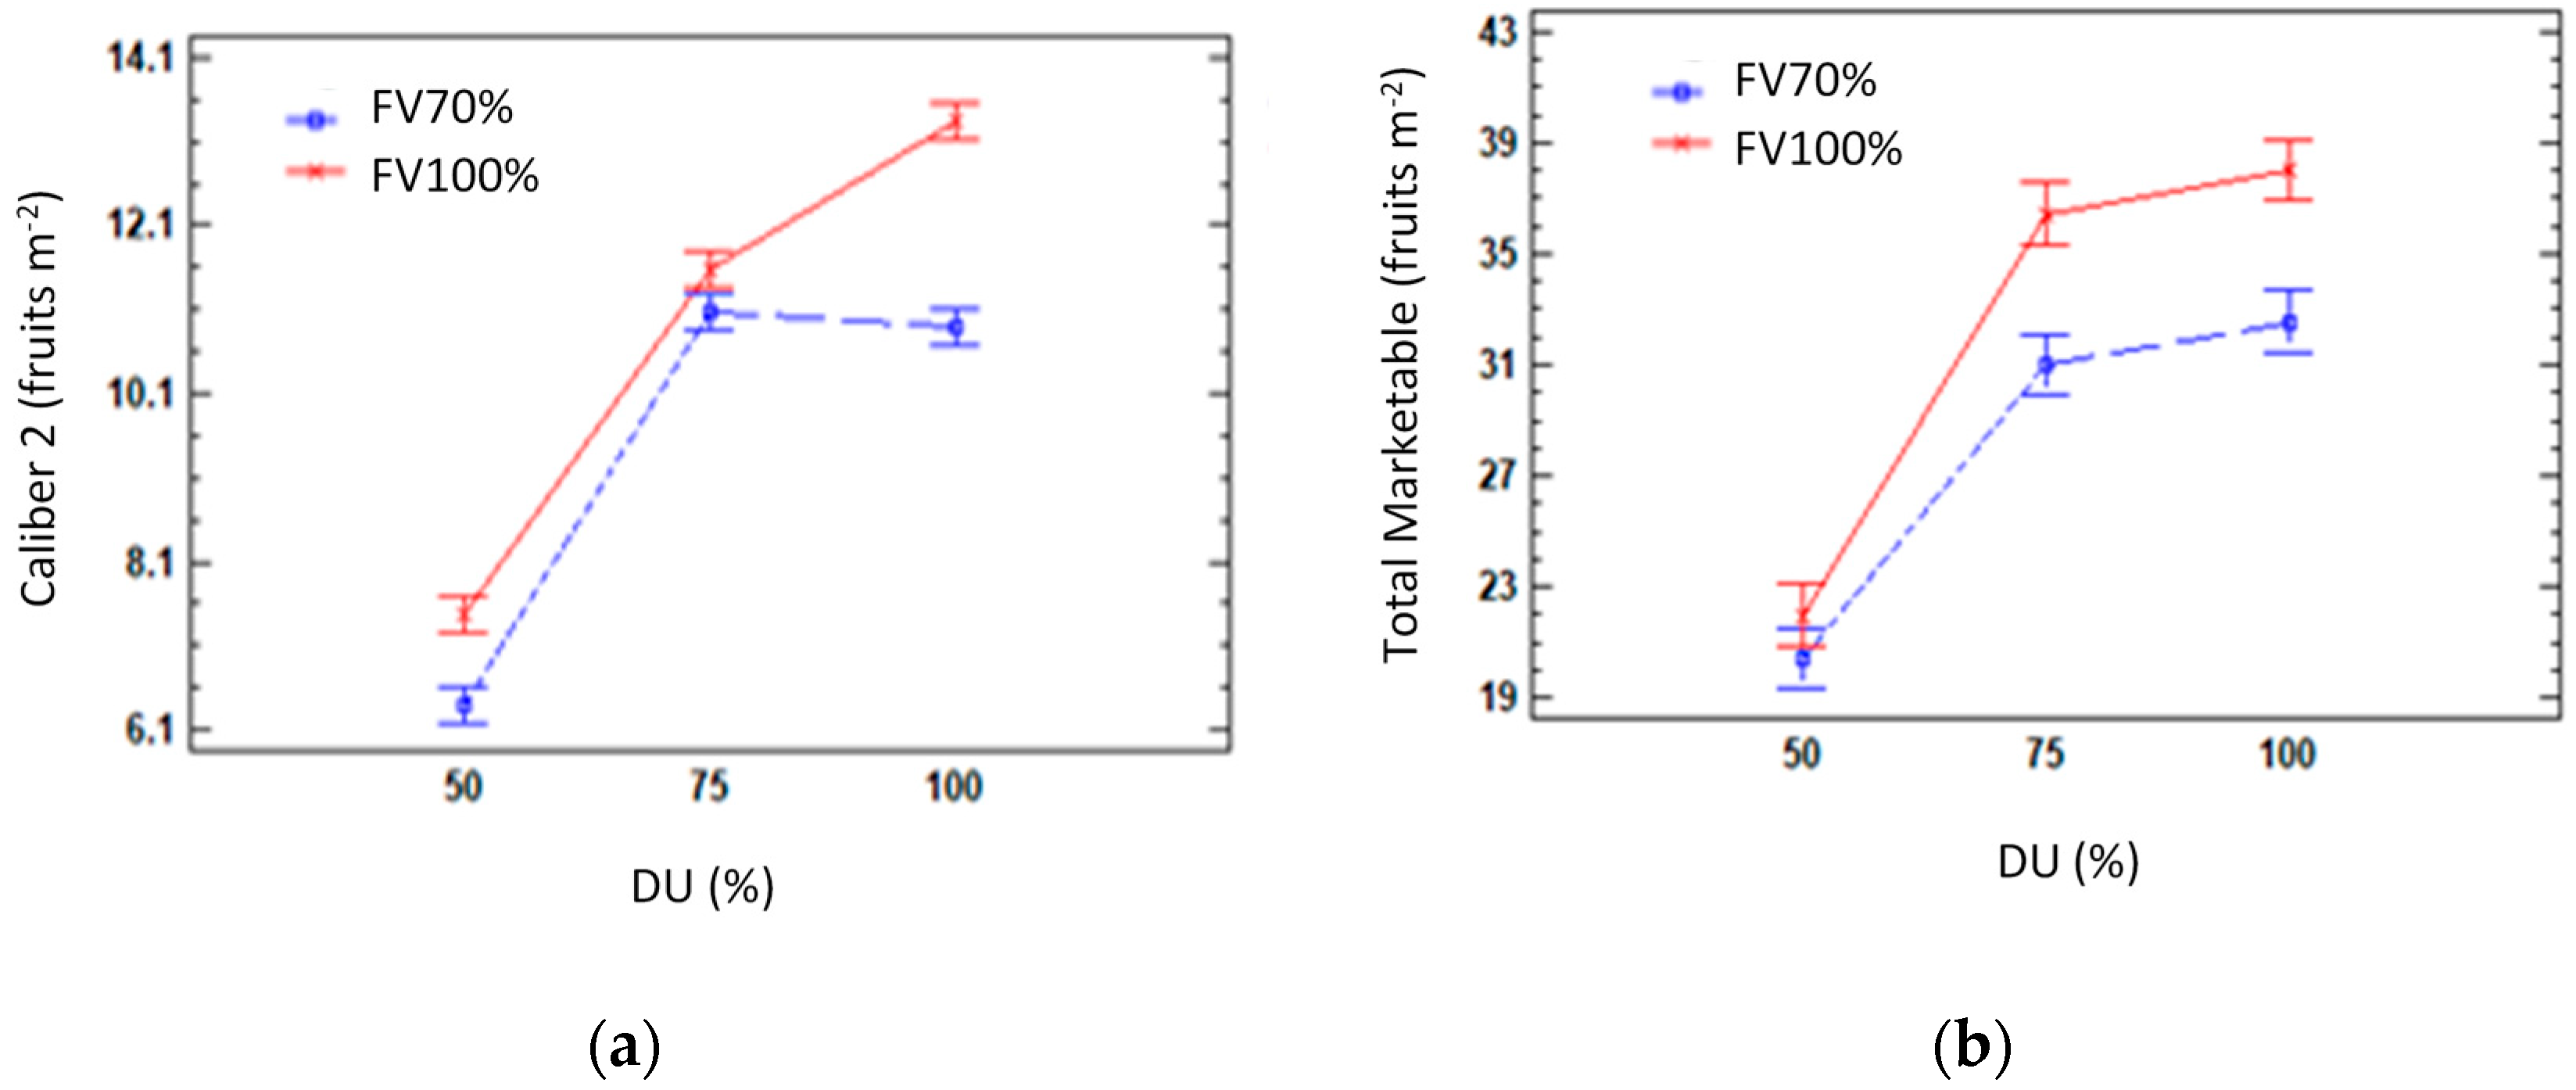
- Interaction Factors
3.4. Shoot Biomass
- DU Effect
- FV Effect
3.5. Water and Nutrient Use Efficiency
- DU Effect
- FV Effect
4. Discussion
4.1. DU Effect
4.2. FV Effect
5. Conclusions
Author Contributions
Funding
Acknowledgments
Conflicts of Interest
Abbreviations
| DU | Uniformity Distribution Coefficient |
| FV | Fertigation Volume |
| WUE | Water Use Efficiency |
| NUE | Nitrogen Use Efficiency |
| PUE | Phosphorus Use Efficiency |
| KUE | Potassium Use Efficiency |
| CaUE | Calcium Use Efficiency |
| MgUE | Magnesium Use Efficiency |
| HI | Harvest Index |
| DB | Dry Biomass |
| DM | Dry Matter |
References
- UNESCO. The Agenda 21 World Water Development Report 3: Water in a Changing World; World Water Assessment Programme; UNESCO: Paris, France, 2009. [Google Scholar]
- Evans, R.G. Microirrigacion; 24106 North Bunn Roas Prosser; Washington State University, Irrigated Agriculture Research and Extension Center: Washington, DC, USA, 2002. [Google Scholar]
- Contreras, J.I.; Alonso, F.; Cánovas, G.; Baeza, R. Irrigation management of greenhouse zucchini with different soil matric potential level. Agronomic and environmental effects. Agric. Water Manag. 2017, 183, 26–34. [Google Scholar] [CrossRef]
- Garcia-Caparros, P.; Contreras, J.I.; Baeza, R.; Segura, M.L.; Lao, M.T. Integral management of irrigation water in intensive horticultural systems of Almería. Sustainability 2017, 9, 2271. [Google Scholar] [CrossRef]
- Nederhoff, E.; Stanghellini, C. Water Use Efficiency of Tomatoes. Pract. Hydroponics Greenh. 2010, 115, 52. [Google Scholar]
- Baeza, R.; Gavilán, P.; Del Castillo, N.; Berenguel, P.; López, J.G. Programa de evaluación y asesoramiento en instalaciones de riego en invernadero con uso de dos fuentes distintas de agua: Subterránea y regenerada. In Proceedings of the XXVIII Congreso Nacional de Riegos, León, Spain, 15–17 June 2010; pp. 111–112. [Google Scholar]
- Baeza, R.; Cánovas, G.; Alonso, F.; Contreras, J.I. Evaluación de las instalaciones de riego en cultivos hortícolas intensivos del sureste de Andalucía. In El Agua en Andalucía. El agua, Clave Medioambiental y Socioeconómica; Tomo II; SIAGA; Instituto Geológico y Minero de España: Málaga, Spain, 2015. [Google Scholar]
- Baeza, R.; Contreras, J.I. Evaluation of Thirty-Eight Models of Drippers Using Reclaimed Water: Effect on Distribution Uniformity and Emitter Clogging. Water 2020, 12, 1463. [Google Scholar] [CrossRef]
- Lozano, D.; Ruiz, N.; Gavilán, P. Efecto de la Pendiente en la Calidad de un Riego Localizado. Formato digital (e-book). In Consejería de Agricultura, Pesca y Desarrollo Rural; Instituto de Investigación y Formación Agraria y Pesquera (Junta de Andalucia): Córdoba, Spain, 2018; pp. 1–20. [Google Scholar]
- Gavilán, P.; Ruiz, N.; Lozano, D. Innovación y cambio tecnológico en los sistemas agrarios intensivos mediterráneos. In El Regadío en el Mediterráneo Español. Una Aproximación Multidimensional, 1st ed.; Garrido, A., Pérez-Pastor, A., Eds.; Cajamar- Caja: Rural, Spain, 2019; Volume 38, pp. 181–206. [Google Scholar]
- Guan, H.; Li, J.; Li, Y. Effects of drip system uniformity and irrigation amount on cotton yield and quality under arid conditions. Agric. Water Manag. 2013, 124, 37–51. [Google Scholar] [CrossRef]
- Wang, Z.; Li, J.; Li, Y. Effects of drip system uniformity and nitrogen application rate on yield and nitrogen balance of spring maize in the North China. Plain. Field Crops Res. 2014, 159, 10–20. [Google Scholar] [CrossRef]
- Pérez-Ortolá, M.; Daccache, A.; Hess, T.M.; Knox, J.W. Simulating impacts of irrigation heterogeneity on onion (Allium cepa L.) yield in a humid climate. Irrig. Sci. 2015, 33, 1–14. [Google Scholar]
- Mateos, L.; Mantovani, E.C.; Villalobos, F.J. Cotton response to non-uniformity of conventional sprinkler irrigation. Irrig. Sci. 1997, 17, 47–52. [Google Scholar] [CrossRef]
- Bordovsky, J.P.; Porter, D.O. Effect of subsurface drip irrigation system uniformity on cotton production in the Texas High Plains. Appl. Eng. Agric. 2008, 24, 465–472. [Google Scholar] [CrossRef]
- Zhao, W.; Li, J.; Li, Y.; Yin, J. Effects of drip system uniformity on yield and quality of Chinese cabbage heads. Agric. Water Manag. 2012, 110, 118–128. [Google Scholar] [CrossRef]
- Fernández, M.D.; Orgaz, F.; Fereres, E.; López, J.C.; Céspedes, A.; Pérez, J.; Bonachela, S.; Gallardo, M. Programación del Riego de Cultivos Hortícolas bajo Invernadero en el Sudeste Español; Cajamar (Caja Rural Intermediterránea): Almería, Spain, 2001. [Google Scholar]
- Gavilán, P.; Estévez, J.; Berengena, J. Comparison of standardized reference evapotranspiration equations in Southern Spain. J. Irrig. Drain. Eng. 2008, 134, 1–12. [Google Scholar] [CrossRef]
- Fernández, M.D.; Bonachela, S.; Orgaz, F.; Thompson, R.; López, J.C.; Granados, M.R.; Gallardo, M.; Fereres, E. Measurement and estimation of plastic greenhouse reference evapotranspiration in a Mediterranean climate. Irrig. Sci. 2010, 28, 497–509. [Google Scholar] [CrossRef]
- González-Esquiva, J.M.; Oates, M.J.; García-Mateos, G.; Moros-Valle, B.; Molina-Martínez, J.M.; Ruiz-Canales, A. Development of a visual monitoring system for water balance estimation of horticultural crops using low cost cameras. Comput. Electron. Agric. 2017, 141, 15–26. [Google Scholar] [CrossRef]
- Observatorio de Precios y Mercados. Junta de Andalucia. Datos Basicos de Producto de Calabacín. Campaña 2018/19. Available online: https://www.juntadeandalucia.es/agriculturaypesca/observatorio/servlet/FrontController?action=List&table=11113&subsector=20&page=1&ec=default (accessed on 9 July 2020).
- Contreras, J.I.; Martín, F.; Zapata, A.J.; López, J.G.; Baeza, R. Caracterización de suelos enarenados para la producción de pimiento en invernadero en la comarca del Campo de Dalías (Almería). In Proceedings of the XXXII Congreso Nacional de Riegos, Madrid, Spain, 10–12 June 2014; pp. 1–8. [Google Scholar]
- Keller, J.; Karmeli, D. Trickle irrigation design parameters. Trans. ASAE 1974, 17, 678–0684. [Google Scholar] [CrossRef]
- Allen, R.G.; Pereira, L.S.; Raes, D.; Smith, M. Crop Evapotranspiration: Guidelines for Computing Crop Water Requirements; Food and Agriculture Organization of the United Nations: Rome, Italy, 1998. [Google Scholar]
- Camacho, F.F.; Fernández, E. Manual Práctico de Fertirrigación en Riego por Goteo; Ediciones Agrotécnicas: Madrid, Spain, 2008. [Google Scholar]
- Kang, S.; Zhang, J. Controlled alternate partial root-zone irrigation: Its physiological consequences and impact on water use efficiency. J. Exp. Bot. 2004, 55, 2437–2446. [Google Scholar] [CrossRef] [PubMed]
- Wang, D.; Kang, Y.; Wan, S. Effect of soil matric potential on tomato yield and water use under drip irrigation condition. Agric. Water Manag. 2007, 87, 180–186. [Google Scholar] [CrossRef]
- Fageria, N.K.; Baligar, V.C. Enhancing nitrogen use efficiency in crop plants. Adv. Agron. 2005, 88, 97–185. [Google Scholar]
- Van Eerd, L.L. Evaluation of different nitrogen use efficiency indices using field-grown green bell peppers (Capsicum annuum L.). Can. J. Plant Sci. 2007, 87, 565–569. [Google Scholar]
- Yasuor, H.; Ben-Gal, A.; Yermiyahu, U.; Beit-Yannai, E.; Cohen, S. Nitrogen management of greenhouse pepper production: Agronomic, nutritional, and environmental implications. HortScience 2013, 48, 1241–1249. [Google Scholar] [CrossRef]
- FAO. Crop water requirements. In Irrigation and Drainage Paper No. 24; FAO: Rome, Italy, 1982. [Google Scholar]
- Wang, J.; Li, J.; Guan, H. Evaluation of Drip Irrigation System Uniformity on Cotton Yield in an Arid Region using a Two-Dimensional Soil Water Transport and Crop Growth Coupling Model. Irrig. Drain. 2017, 66, 351–364. [Google Scholar] [CrossRef]
- Liu, H.; Yang, H.; Zheng, J.; Jia, D.; Wang, J.; Li, Y.; Huang, G. Irrigation scheduling strategies based on soil matric potential on yield and fruit quality of mulched-drip irrigated chili pepper in Northwest China. Agric. Water Manag. 2012, 115, 232–241. [Google Scholar] [CrossRef]
- Jia, J.; Kang, Y.; Wan, S. Effect of soil matric potential on wolfberry (Lycium barbarbum L.) yield, evapotranspiration and water use efficiency under drip irrigation. Afr. J. Agric. Res. 2013, 8, 5455–5463. [Google Scholar]
- Zheng, J.; Huang, G.; Jia, D.; Wang, J.; Mota, M.; Pereira, L.S.; Huang, Q.; Liu, H. Responses of drip irrigated tomato (Solanum lycopersicum L.) yield, quality and water productivity to various soil matric potential thresholds in an arid region of Northwest China. Agric. Water Manag. 2013, 129, 181–193. [Google Scholar] [CrossRef]
- Létourneau, G.; Caron, J.; Anderson, L.; Cormier, J. Matric potential-based irrigation management of field-grown strawberry: Effects on yield and water use efficiency. Agric. Water Manag. 2015, 161, 102–113. [Google Scholar] [CrossRef]
- Buttaro, D.; Santamaria, P.; Signore, A.; Cantore, V.; Boari, F.; Montesano, F.F.; Parente, A. Irrigation Management of Greenhouse Tomato and Cucumber Using Tensiometer: Effects on Yield, Quality and Water Use. Agric. Agric. Sci. Procedia 2015, 4, 440–444. [Google Scholar] [CrossRef]
- Bonachela, S.; González, A.M.; Fernández, M.D.; Cabrera-Corral, F.J. Vegetable Crops Grown under High Soil Water Availability in Mediterranean Greenhouses. Water 2020, 12, 1110. [Google Scholar] [CrossRef]


| pH | EC | HCO3− | Cl− | SO42− | NO3− | P | NH4+ | Ca2+ | Mg2+ | Na+ | K+ | |
|---|---|---|---|---|---|---|---|---|---|---|---|---|
| dS m−1 | mM | mM | mM | mM | mM | mM | mM | mM | mM | mM | ||
| Water | 7.69 | 0.48 | 2.00 | 2.23 | 0.21 | 0.08 | 0.00 | 0.00 | 0.72 | 0.41 | 2.48 | 0.20 |
| Solution F. | 6.00 | 2.49 | 0.50 | 2.23 | 2.27 | 12.0 | 1.50 | 0.00 | 4.50 | 1.50 | 2.48 | 6.50 |
| Marketable by Category | Total Marketable | Unmarketable | |||||||||||||
|---|---|---|---|---|---|---|---|---|---|---|---|---|---|---|---|
| 1st Category | 2nd Category | ||||||||||||||
| 1st Category by Caliber | Total | Total | 1st + 2nd Category | ||||||||||||
| Caliber 1 (<225g) | Caliber 2 (225–450 g) | Caliber 3 (>450 g) | |||||||||||||
| Fruits m−2 | kg m−2 | Fruits m−2 | kg m−2 | Fruits m−2 | kg m−2 | Fruits m−2 | kg m−2 | Fruits m−2 | kg m−2 | Fruits m−2 | kg m−2 | Fruits m−2 | kg m−2 | ||
| DU | * | * | * | * | * | * | * | * | * | * | * | * | * | * | |
| 100 | 13.4a | 2.39a | 12.1a | 4.47a | 7.3a | 4.41a | 32.9a | 11.27a | 2.4ab | 0.26ab | 35.3a | 11.54a | 2.3a | 0.26b | |
| 75 | 13.1a | 2.33a | 11.3b | 3.96b | 6.3a | 4.24a | 30.7b | 10.54a | 3.0a | 0.47a | 33.7a | 11.01a | 2.6a | 0.48a | |
| 50 | 9.1b | 1.72b | 6.9c | 2.36c | 3.5b | 2.09b | 19.6c | 6.17b | 1.6b | 0.16b | 21.2b | 6.35b | 0.7b | 0.12c | |
| FV | ns | ns | * | * | * | * | * | * | ns | ns | * | * | * | * | |
| 100 | 12.6a | 2.25a | 10.8a | 3.86a | 6.3a | 4.13a | 29.7a | 10.25a | 2.5a | 0.32a | 32.1a | 10.57a | 1.2b | 0.20b | |
| 70 | 11.2a | 2.04a | 9.4b | 3.33b | 5.1b | 3.04b | 25.8b | 8.42b | 2.2a | 0.28a | 28.0b | 8.70b | 2.5a | 0.38a | |
| Interaction (DUxFV) | ns | ns | * | ns | ns | ns | ns | ns | ns | ns | * | ns | ns | ns | |
| Vegetative Shoot Biomass | Generative Shoot Biomass | Total Shoot Biomass | HI | |||||||
|---|---|---|---|---|---|---|---|---|---|---|
| Leaves | Stems | Fruits | ||||||||
| DB | DM | DB | DM | DB | DM | DB | DM | |||
| g m−2 | % | g m−2 | % | g m−2 | % | g m−2 | % | g g−1 | ||
| DU | * | ns | * | ns | * | ns | * | ns | * | |
| 100 | 783a | 10.93a | 111a | 10.52a | 584a | 4.96a | 1478a | 7.39a | 0.40a | |
| 75 | 686b | 10.70a | 102ab | 10.50a | 553a | 4.82a | 1314a | 7.11a | 0.41a | |
| 50 | 606c | 10.47a | 92b | 10.29a | 303b | 4.70a | 1001b | 7.62a | 0.30b | |
| FV | ns | * | ns | ns | ns | * | ns | * | ns | |
| 100 | 711a | 9.91b | 108a | 10.50a | 505a | 4.67b | 1324a | 6.90b | 0.38 | |
| 70 | 672a | 11.49a | 960a | 10.38a | 454a | 4.99a | 1222a | 7.77a | 0.37 | |
| Interaction (DUxFV) | ns | ns | ns | ns | ns | ns | ns | ns | ns | |
| WUE | NUE | PUE | KUE | CaUE | MgUE | ||
|---|---|---|---|---|---|---|---|
| DU | * | * | * | * | * | * | |
| 100 | 36.75a | 218.78a | 790.44a | 144.99a | 204.19a | 1008.39a | |
| 75 | 34.93a | 207.97a | 751.38a | 137.82a | 194.10a | 958.55a | |
| 50 | 20.43b | 121.62b | 439.43b | 80.60b | 113.52b | 560.59b | |
| FV | * | * | * | * | * | * | |
| 100 | 28.22b | 168b | 606.99b | 111.34b | 156.80b | 774.36b | |
| 70 | 33.19a | 197.58a | 713.84a | 130.941a | 184.40a | 910.66a | |
| Interaction (DUxFV) | ns | ns | ns | ns | ns | ns | |
© 2020 by the authors. Licensee MDPI, Basel, Switzerland. This article is an open access article distributed under the terms and conditions of the Creative Commons Attribution (CC BY) license (http://creativecommons.org/licenses/by/4.0/).
Share and Cite
Contreras, J.I.; Baeza, R.; Alonso, F.; Cánovas, G.; Gavilán, P.; Lozano, D. Effect of Distribution Uniformity and Fertigation Volume on the Bio-Productivity of the Greenhouse Zucchini Crop. Water 2020, 12, 2183. https://doi.org/10.3390/w12082183
Contreras JI, Baeza R, Alonso F, Cánovas G, Gavilán P, Lozano D. Effect of Distribution Uniformity and Fertigation Volume on the Bio-Productivity of the Greenhouse Zucchini Crop. Water. 2020; 12(8):2183. https://doi.org/10.3390/w12082183
Chicago/Turabian StyleContreras, Juana I., Rafael Baeza, Francisca Alonso, Gema Cánovas, Pedro Gavilán, and David Lozano. 2020. "Effect of Distribution Uniformity and Fertigation Volume on the Bio-Productivity of the Greenhouse Zucchini Crop" Water 12, no. 8: 2183. https://doi.org/10.3390/w12082183
APA StyleContreras, J. I., Baeza, R., Alonso, F., Cánovas, G., Gavilán, P., & Lozano, D. (2020). Effect of Distribution Uniformity and Fertigation Volume on the Bio-Productivity of the Greenhouse Zucchini Crop. Water, 12(8), 2183. https://doi.org/10.3390/w12082183