Article

Event-Based Rainfall Interception Modeling in a Cerrado Riparian Forest—Central Brazil: An Alternative Approach to the IS Method for Parameterization of the Gash Model

by
Bruno Esteves Távora
1,* and
Sérgio Koide
2
1
Brazilian Prosecution Service—MPDFT, Brasília 700910-900, Brazil
2
Department of Civil and Environmental Engineering, University of Brasília, Brasília 70910-900, Brazil
*
Author to whom correspondence should be addressed.
Water 2020, 12(8), 2128; https://doi.org/10.3390/w12082128
Submission received: 8 June 2020 / Revised: 7 July 2020 / Accepted: 21 July 2020 / Published: 27 July 2020
(This article belongs to the Section Hydrology)

Abstract

:
Although being the second largest biome in South America, the Cerrado biome is understudied in terms of hydrological modeling of the interception processes of its different vegetation types. To better understand its net precipitation components, high-temporal-resolution throughfall data were used to parameterize the Gash Analytical Model on a per storm basis. Two different methods (Single Event Regression—SI, and Particle Swarm Optimization—PSO) for parametrizing the Gash model were tested. Simulated throughfall from 35 events showed the Nash coefficient ranging from 0.779 to 0.989, confirming the good phenomenological approach of the Gash model. One of the most important results presented in this work was the analysis of the variability of the parameters. Considering the PSO method, we observed a mean free throughfall ( ρ ) of 0.17, with a confidence interval ranging from 0.16 to 0.18. The storage (S) confidence intervals ranged from 1.11 mm to 1.62 mm, with a mean value of 1.37 mm. The observed saturation depth (P′G) mean value was 1.66 mm, with a confidence interval from 1.35 mm to 1.97 mm. Finally, the mean evaporation precipitation rate (E/R) was of 0.20, with confidence bands from 0.15 to 0.24. Overall, there were observed higher losses from the Cerrado compared to other Brazilian biomes such as the Amazon and Atlantic Forest. These findings can contribute to the parameterization of hydrological models applied to the Brazilian Cerrado.

1. Introduction

According to Véliz-Chávez et al. [1], net precipitation in forested areas can be described as the sum of three processes. The first, known as free throughfall, is more evident at the beginning of the rainfall event when most of the raindrops that reach the ground surface pass through the canopy openings. The second, known as Dripping, occurs when the rain hits the leaves and branches before dripping down to the ground surface. Dripping is observed during and after the rainfall event. The third, and last, process involves part of the rainfall flowing along the branches to the trunk until it reaches the ground. This portion of the net precipitation is known as stemflow [1]. Some authors, e.g., Helvey and Patric [2], usually designate throughfall as the combination of free throughfall and dripping. Interception, in turn, is the difference between gross precipitation and net precipitation. The amount stored in the canopy evaporates during and after the end of the rain event. Murakami [3] observed that about 10% to 40% of the rainfall evaporates during rainfall events under high humidity conditions. According to Murakami, this evaporation amount is possible because a number of small droplets are produced by splashes when raindrops hit the canopy. Small droplets evaporate even under a relative humidity of 95% and this mechanism is known as splash droplet evaporation. Without the canopy interception, the high energy of the droplets can promote disintegration of soil aggregates due to splash at the soil level. Higher soil particle loss due to the splash effect occurs with different rainfall intensities, causing erosion problems or soil compaction change [4,5].
The Rutter [6] and Gash [7] models are often applied in interception loss simulations. On the concept brought by Rutter, the canopy is regarded as capable of storing rainfall water on its surface. This storage is subject to evaporation during the rain event and after the end of the event. While Rutter’s model presents a phenomenological approach with more intense parameterization, the Gash model has brought an analytical approach without departing from the concepts of the Rutter model. Gash considered that the meteorological conditions prevailing during any wetting-up of the canopy are sufficiently similar to those prevailing for the rest of the storms. So the Gash model considers that the evaporation/precipitation rate is constant during the rainfall event. Howover, certain variability in the meteorological conditions between different rainfall events is expected. In addition, the canopy structure itself, in some vegetation types, show seasonal alteration (loss of leaves) with direct consequences on the storage capacity of the canopy. Those sources of variability were studied by authors such as Link [8] and Pypker [9].
According to Brutsaert [10], most studies dedicated to interception are applied to forested areas where this hydrological process is considered more relevant. Vegetation type, intensity, and duration of the precipitation all play a role in this hydrological process. In temperate latitudes, 30% to 40% of gross precipitation is intercepted in forested sites. In tropical forests, where high-intensity rainfall occurs, interception is expected to represent approximately 10% to 15% of the rainfall [10].
The Cerrado is the second largest biome in South America (2 million km2). Considered a global biodiversity hotspot, it has an abundance of endemic species and has been experiencing great habitat loss due to the land use change by the conversion of natural vegetation to agriculture. The Cerrado is formed by savanna type vegetation in most of the flat areas but the riparian zones are mostly occupied by dense forests (gallery forest) [11]. Despite the continental importance of this biome, there are few studies on interception processes of the Cerrado forest. An even smaller number of studies have been devoted to modeling this hydrological process in this vegetation type. Understanding the role of these forests on the water balance is an important element to parametrize watershed models.
Giglio and Kobiyama [12] conducted a review of interception studies in Brazilian biomes. The majority of these studies were concerned with the measurement of throughfall and stemflow, without modeling the interception process. Moreover, the current state of the art indicates that most studies (90%) are dedicated to rainforests (the Amazon and Atlantic Forest), and only a few are dedicated to the Cerrado.
In this regard, the present study aims at modeling the interception phenomenon by application of the Gash model on a rainfall event based on data from a Cerrado gallery forest. We also used a novel approach to obtain the model parameters, combining the canopy characterization by hemispheric photos suggested by Zimmermann [13] with Particle Swarm Optimization methods.

2. Materials and Methods

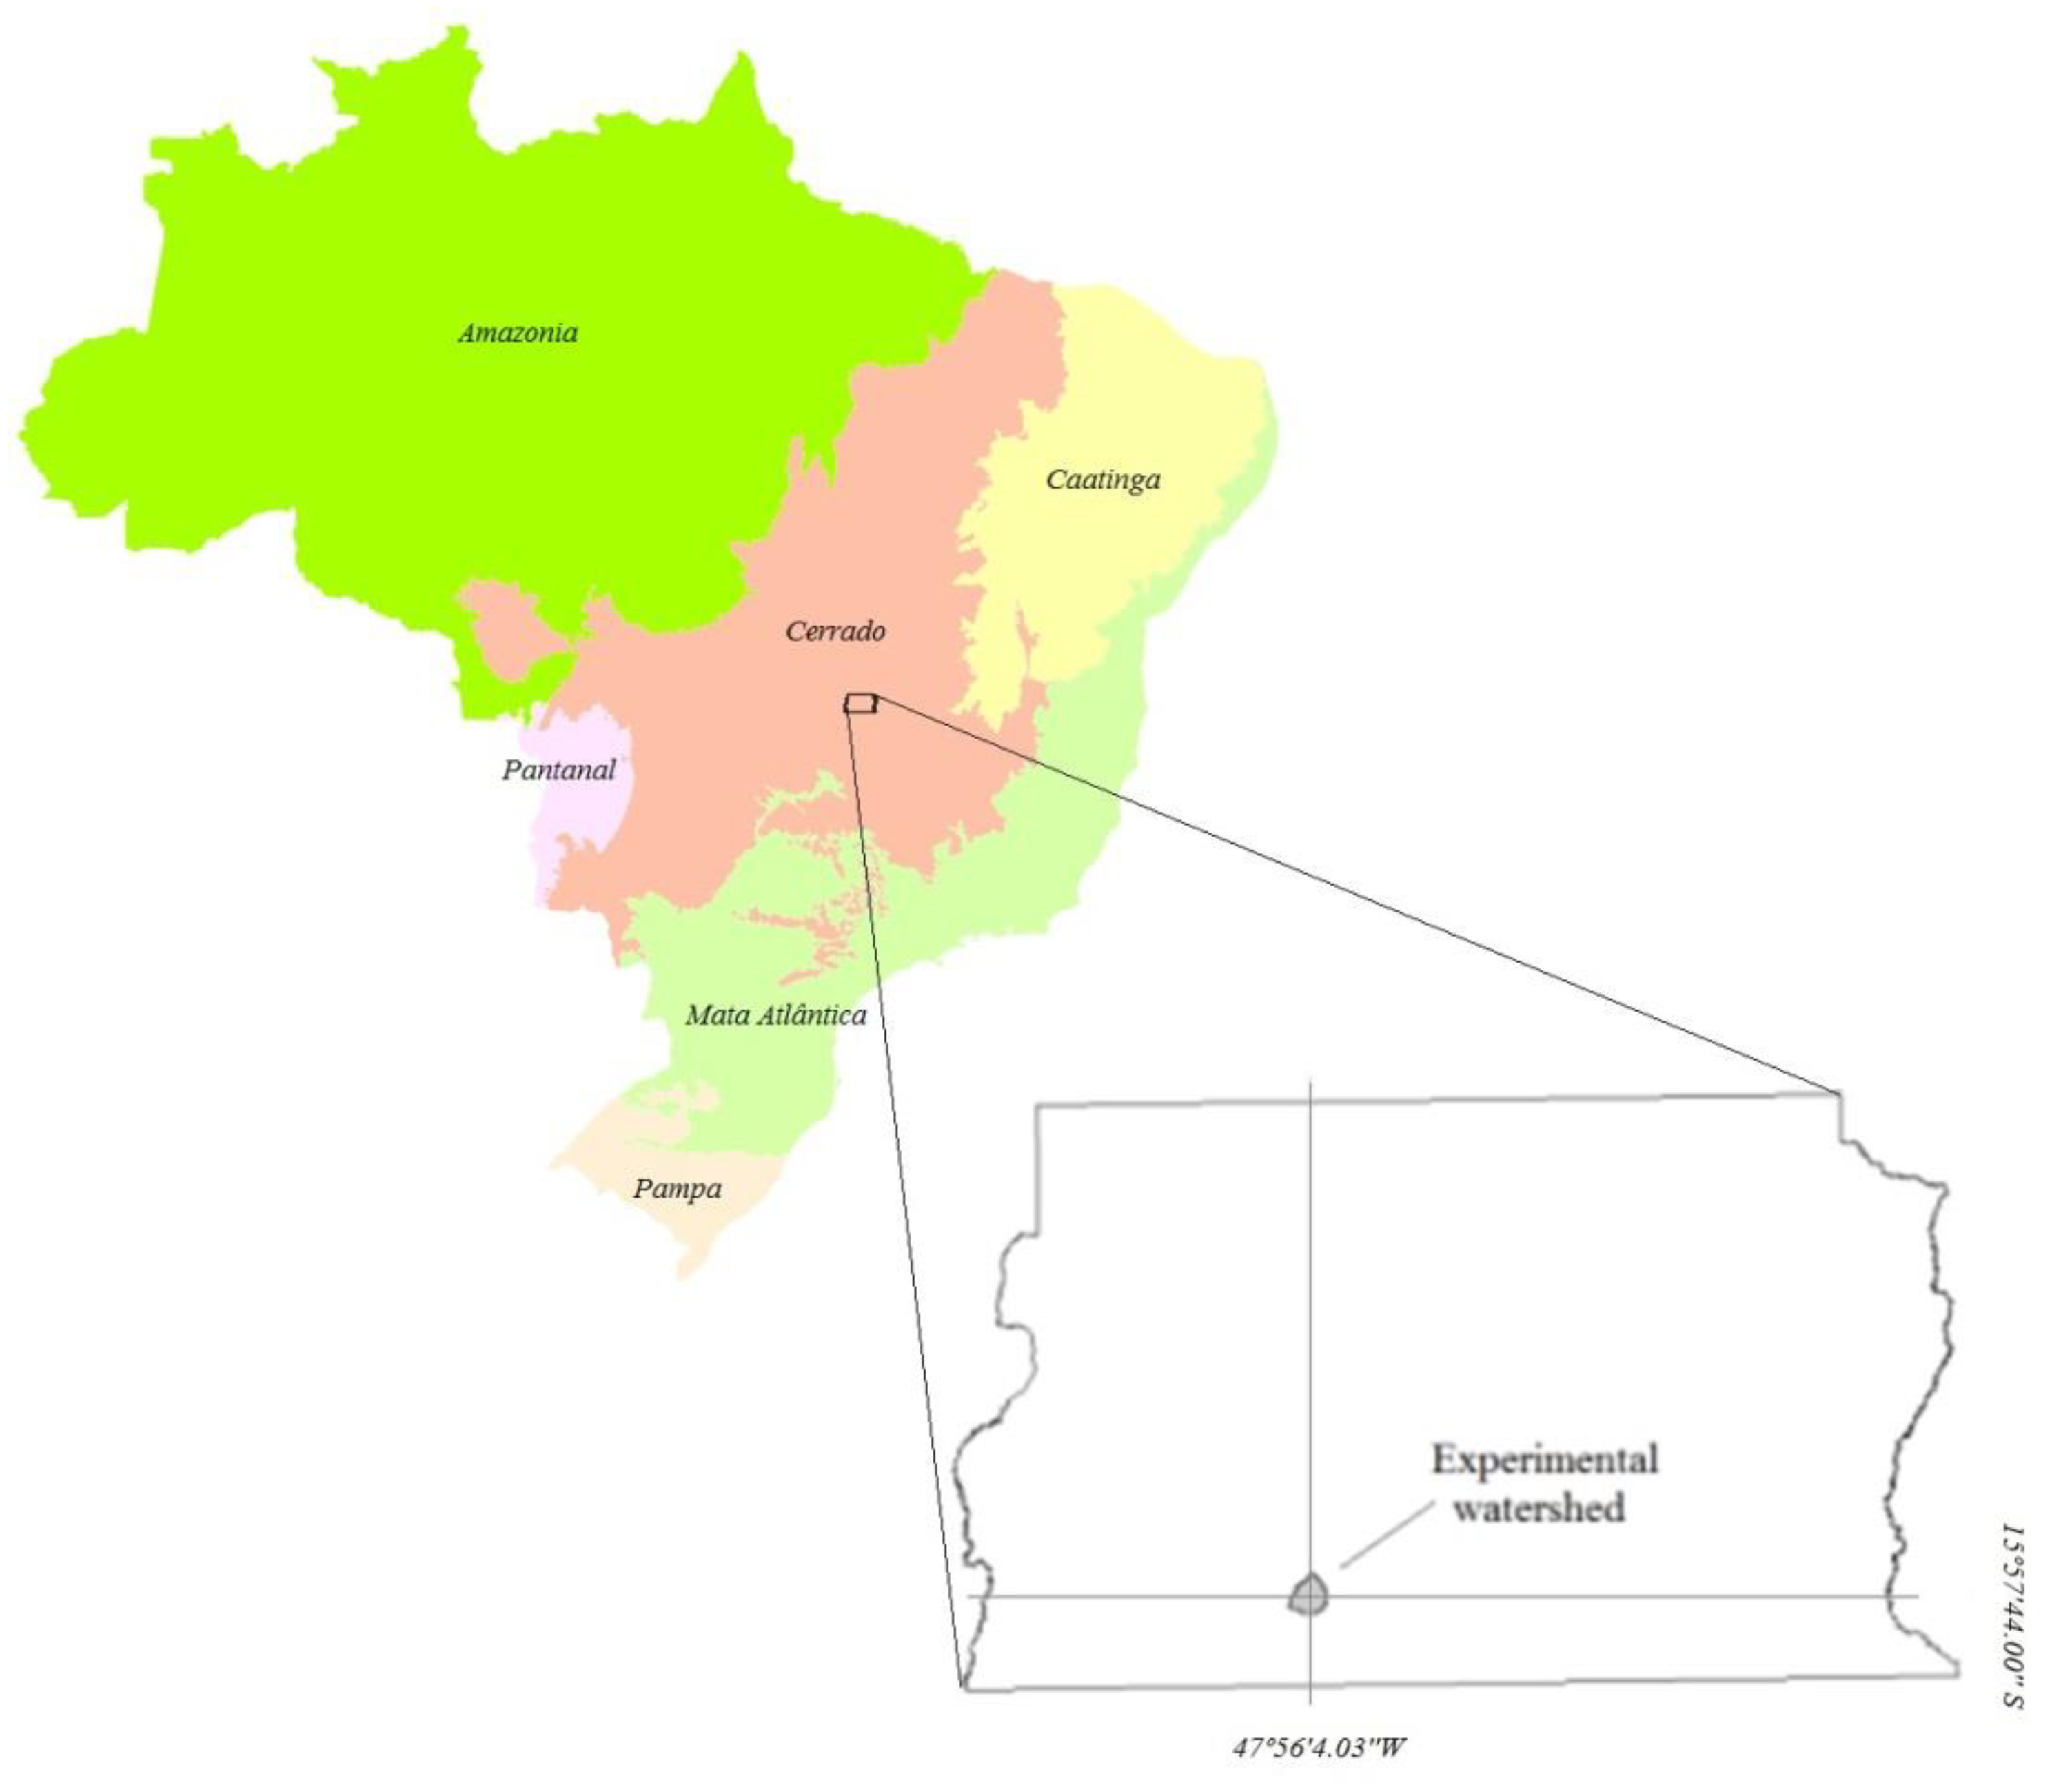
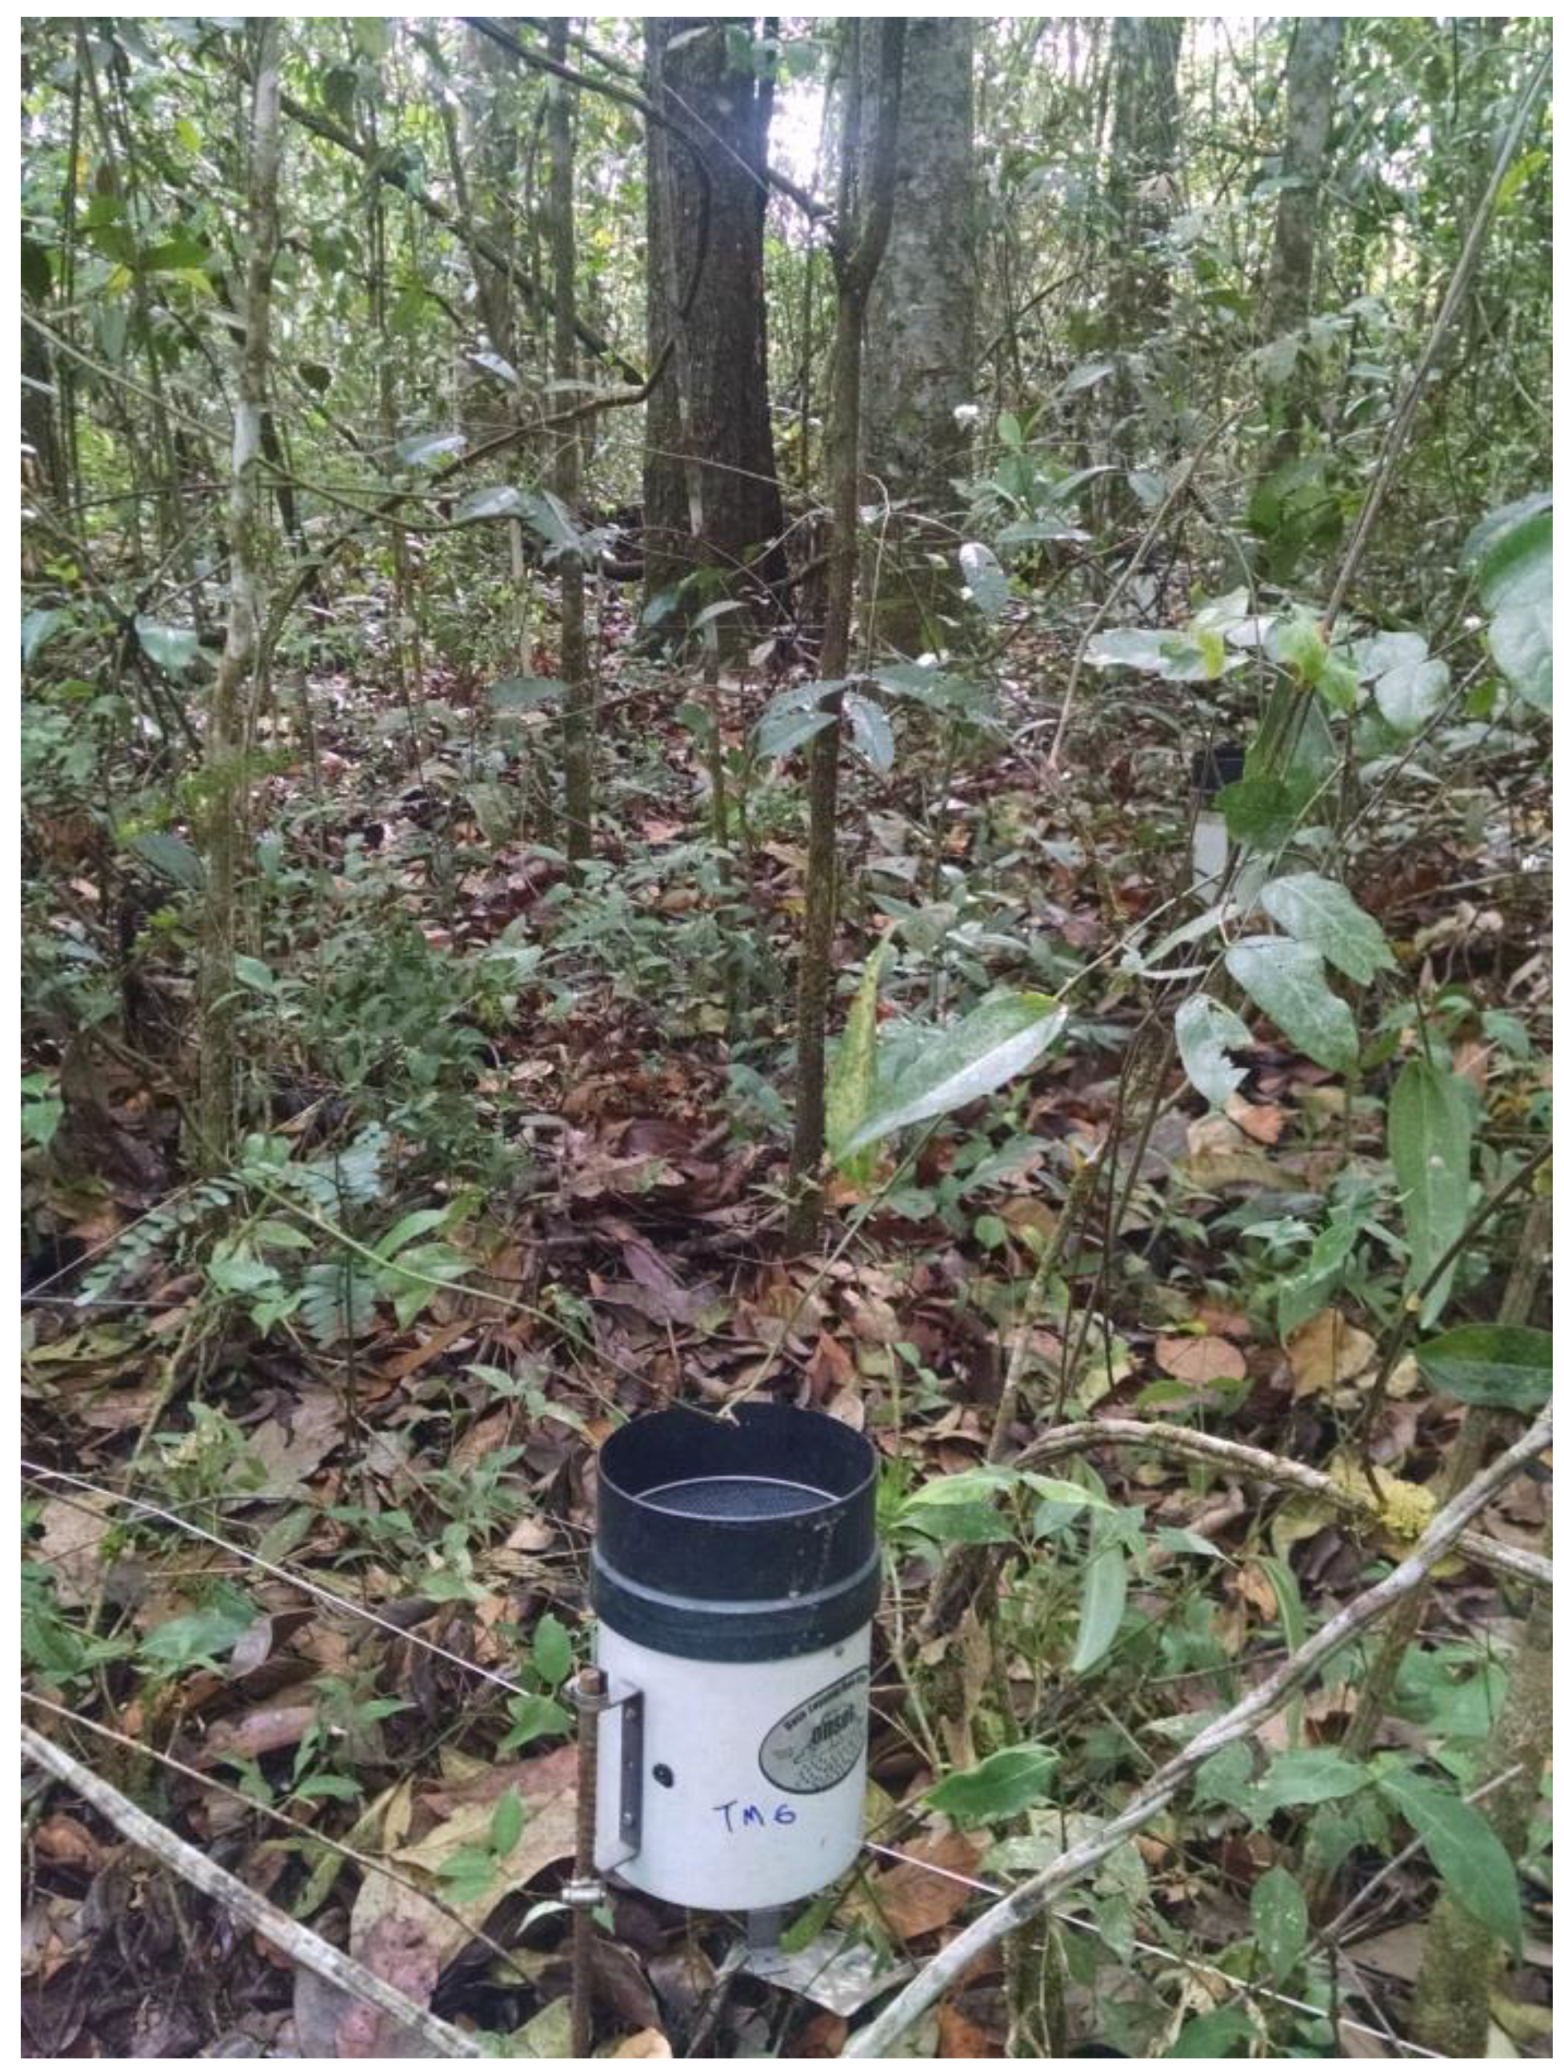
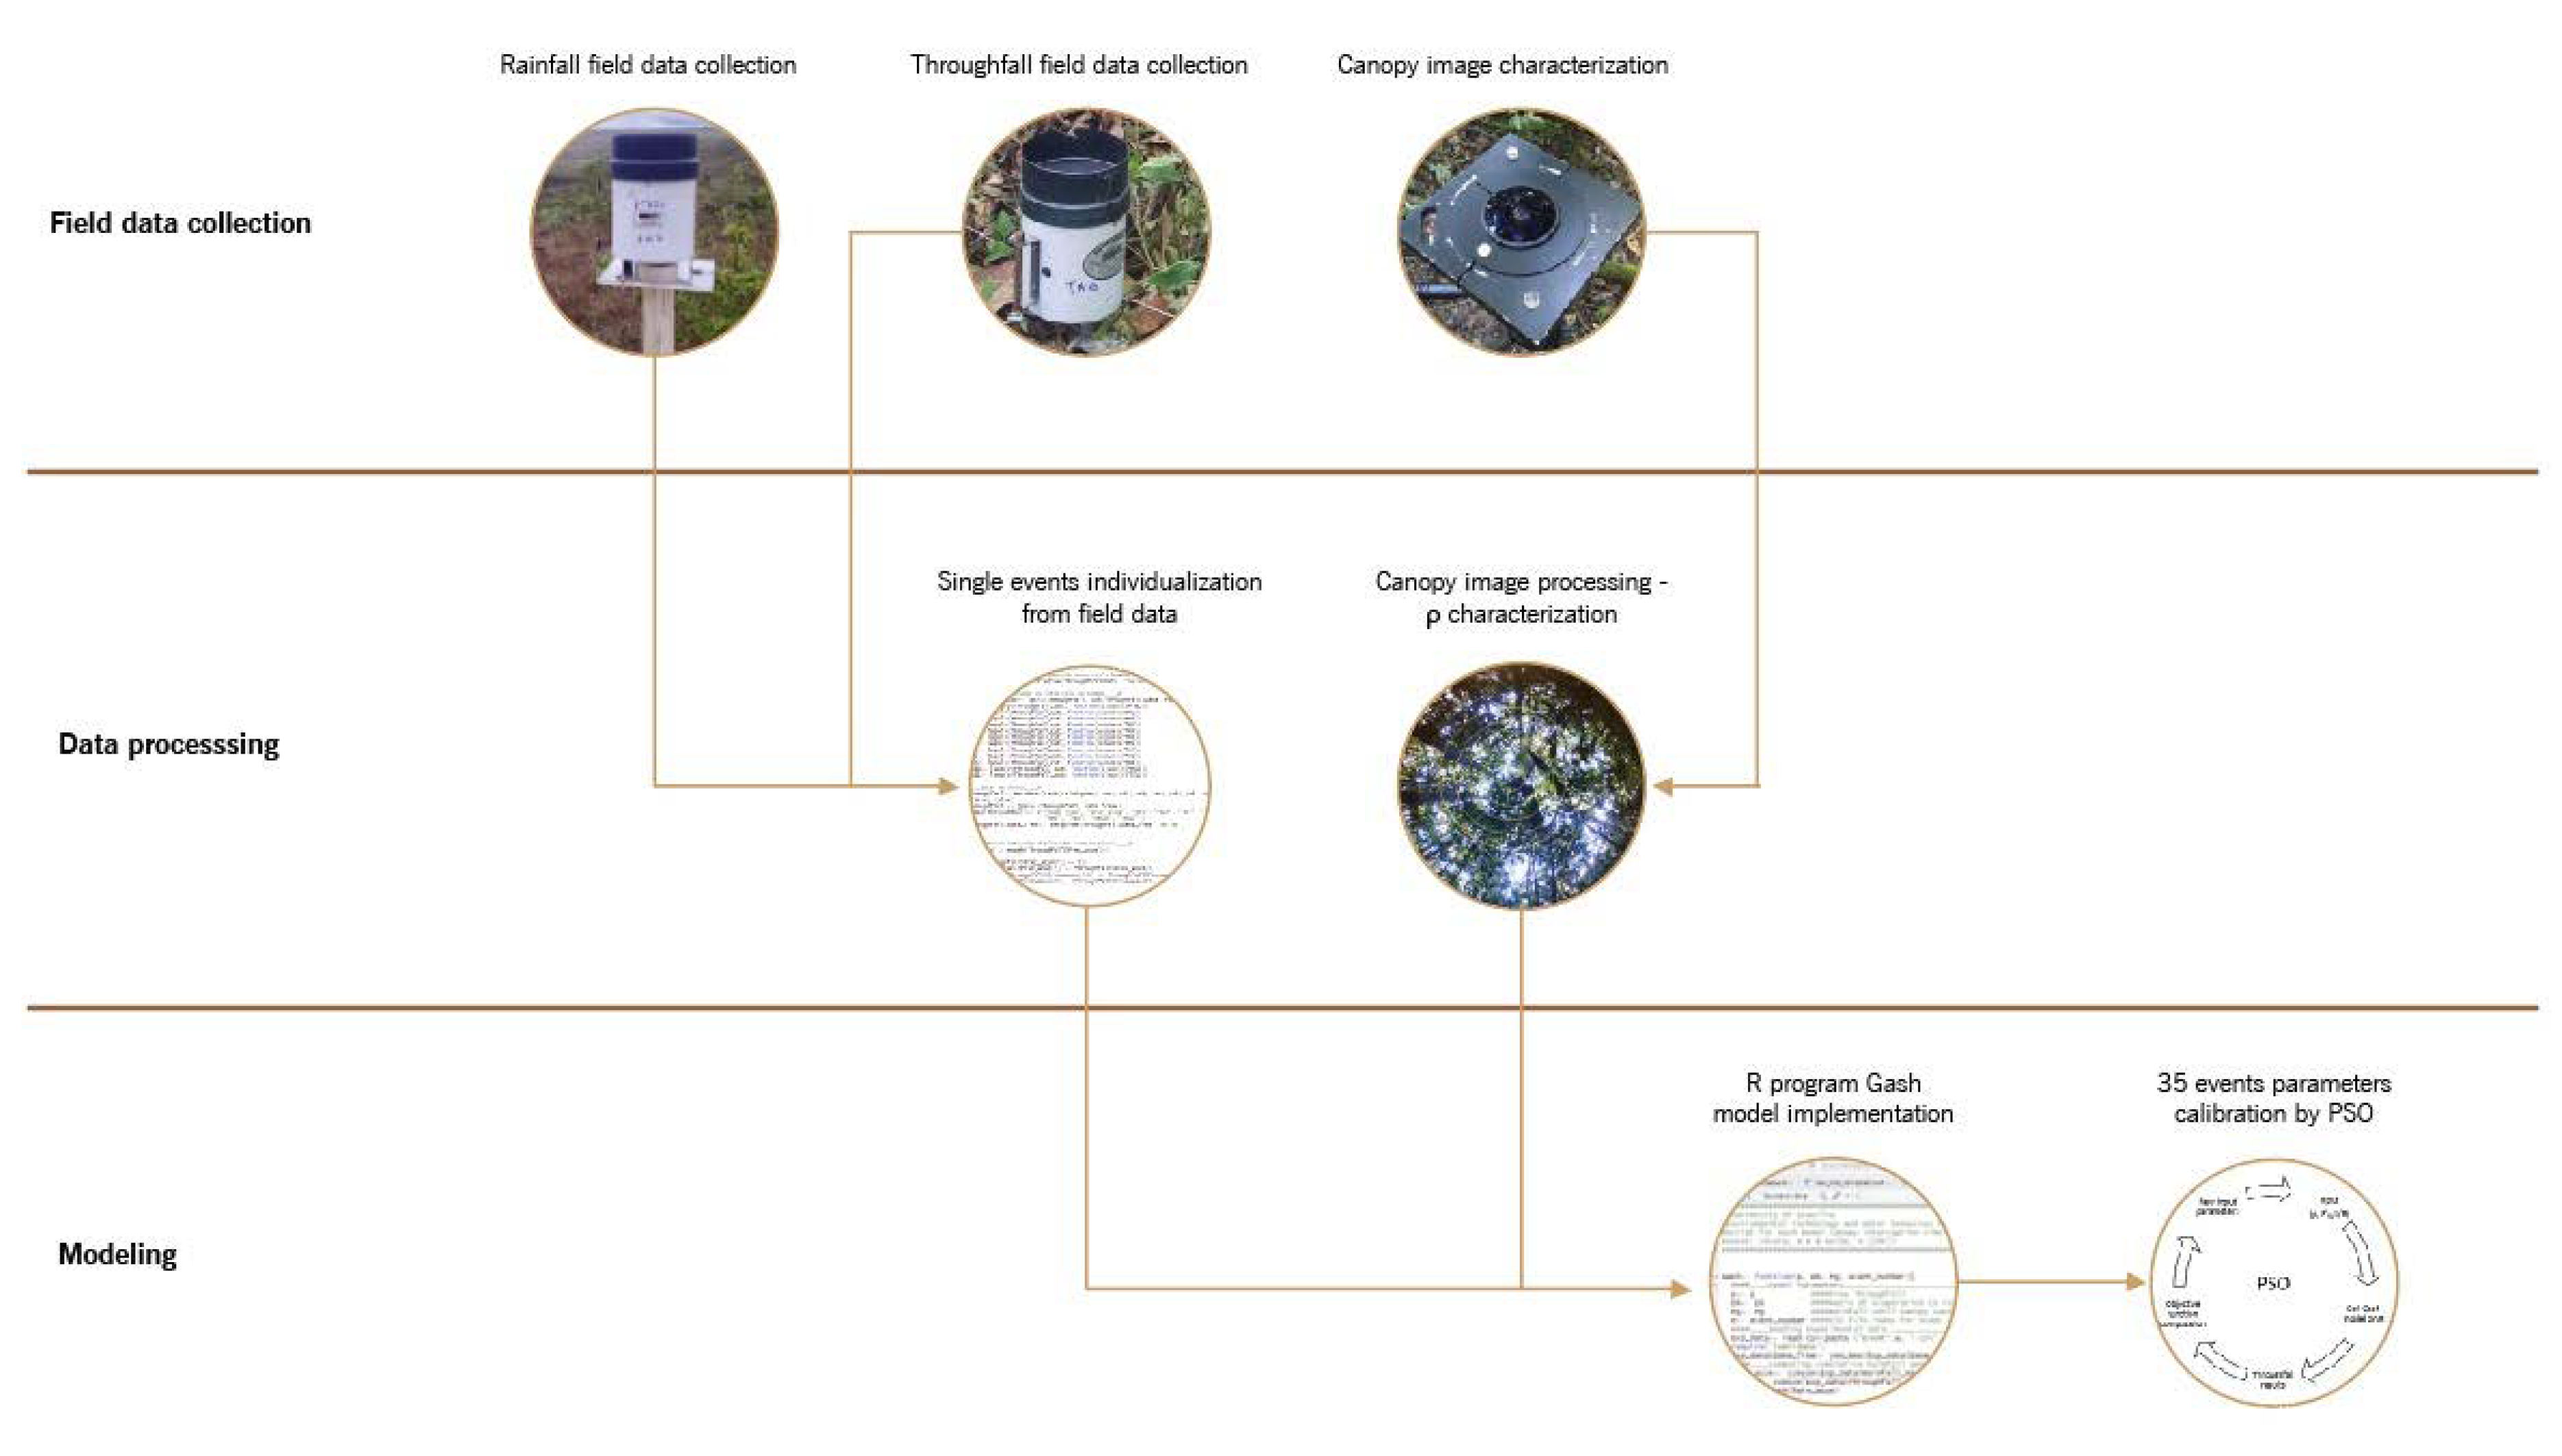
2.1. Site Description and Data Collection

This study was conducted in the Capetinga experimental watershed in central-west Brazil. This small experimental watershed (11 km2), maintained by the University of Brasilia, combines different vegetation types of the Cerrado biome under the legal protection of an environmental conservation unit. It is a part of the Federal District, a 5802 km2 autonomous region where the Brazilian capital is located. The Capetinga’s river gallery forest has a tree density of 1010 ind.ha−1, considering trees with diameter at breast higher than 5 cm. Approximately 86 species of trees have been recorded in the area. The most important species are: Amaioua guianensis, Piptocarpha macropoda, Protium heptaphyllum, Licania apetala, Aspidosperma parvifolium, Cryptocarya aschersoniana, Nectandra reticulata, Salacia elliptica, Cecropia pachystachia, Tapirira guianensis [14]. The canopy strata varied from 4 m to 21.5 m in height, with median strata at 10 m [15]. Figure 1 shows the location of the experimental watershed and the six biomes that cover the territory of Brazil.
As throughfall is quite variable in most forests, its accurate estimation is generally very difficult. It has been measured with a range of devices, from troughs of various sizes, to plastic funnels and standard rain gauges [16]. Some authors also suggest the use of a large plastic-sheet net rainfall collectors, to overcome the variability problems. For the present work we seek to overcome the issue of spatial variability with the use of several rain gauges located on a variable grid position.
The experiment was conducted in a 100 m2 plot located in the Capetinga River gallery forest (15°57’19.58″ S, 47°56’33.11″ W, WGS84). For the throughfall measurements, eleven Onset RG-2 (Onset Computer Corporation, Bourne, MA, USA) (0.2 mm/tip) tipping bucket rain gauges, with an internal diameter of 16.5 cm, were randomly located on the node of a regular 1 m × 1 m grid.
In the present work, the stemflow was not considered since extensive review work [12] points out that this process represents only 1.8% of the precipitation in the Amazon forest, 0.8% in the Atlantic Forest, and 6% in the Cerrado/Caatinga vegetation type. Although this latter reference cannot be considered small, this value presents a bias brought by the cerradão fitofisionomy. In the riparian vegetation of Cerrado, these authors pointed out stem flow values of 0.9% of the precipitation, reinforcing their small influence on the process under study.
As suggested by Helvey and Patric [2], the rain gauges were moved periodically to new random locations in order to gain precision and accuracy in estimating interception factors. The new positions were obtained using a uniform distribution algorithm that draws points between the limits of bottom left (0,0) and top right (10,10) local coordinates. Gross precipitation was obtained by another Onset RG-2M (Onset Computer Corporation, Bourne, MA, USA) (0.254 mm/tip) tipping bucket rain gauge placed in an open space approximately 150 m from the experimental plot. Data loggers were programmed to continuously register the tip time. Figure 2 shows one of the rain gauges placed under the forest canopy.
Data obtained from October 2015 to February 2016 were checked for inconsistencies caused by gauge obstruction, and abnormal values were not considered. This process consisted of the weekly verification of obstruction in the rain gauges recording them for a later graphical analysis. By plotting the suspicious data against non-obstructed rain gauges data, it is possible to determine the moment of unexpected deviation in a linear relation.
For an overall analysis of throughfall and interception variability, the data were tabulated considering daily rain. To apply the Gash model, a gap of 6 h between rainfall events was considered to separate individual storm events as suggested by Lloyd [17], Link, [8], and Marin [18]. The Gash model was applied individually to each rainfall event with a 5-min resolution for the precipitation and throughfall.
The sample size required for a certain population mean error is expressed using a Student t-distribution and the sample variance. Alternatively, Zimmermann [19] and Kimmins [20] applied a different approach based on the coefficient of variation (CV), instead of the variance, as described by Equation (1):
n = t 2 CV 2 d 2
in which n is the number of rain gauges distributed in the area, t is the desired critical value of Student’s t-distribution, CV is the sample coefficient of variation, and d is the percentage error between population and sample mean throughfall.

2.2. The Gash Analytical Model

The original Gash Analytical Model for interception is based on the way the rainfall is redistributed by the forest structure. The model considers rainfall to occur as a series of discrete events that wet up the canopy until saturation, followed by a period of drying out after the end of the specific rainfall event [21].
Before canopy storage capacity (S) is reached, the gross rainfall (PG) is portioned as free throughfall ( ρ ) and canopy wet up. Net precipitation (Pn) prior to saturation can be described by the following linear relation [8,9]:
P n =   ρ P G .
After gross precipitation reaches the amount necessary to saturate the canopy (P′G), the evaporation process becomes more relevant. Thus, for the saturation condition, when PG in greater than S, the throughfall is described as:
P n = ρ P G + ( 1 E R ) ( P G P G )
where E R is the ratio of evaporation to rainfall intensity. The canopy storage capacity in turn is computed by:
S = ( 1   ρ ) P G .
Interception loss can be computed by the difference between gross and net precipitation. Equations (1)–(3) present a simplification of the Gash model since stemflow was not considered.

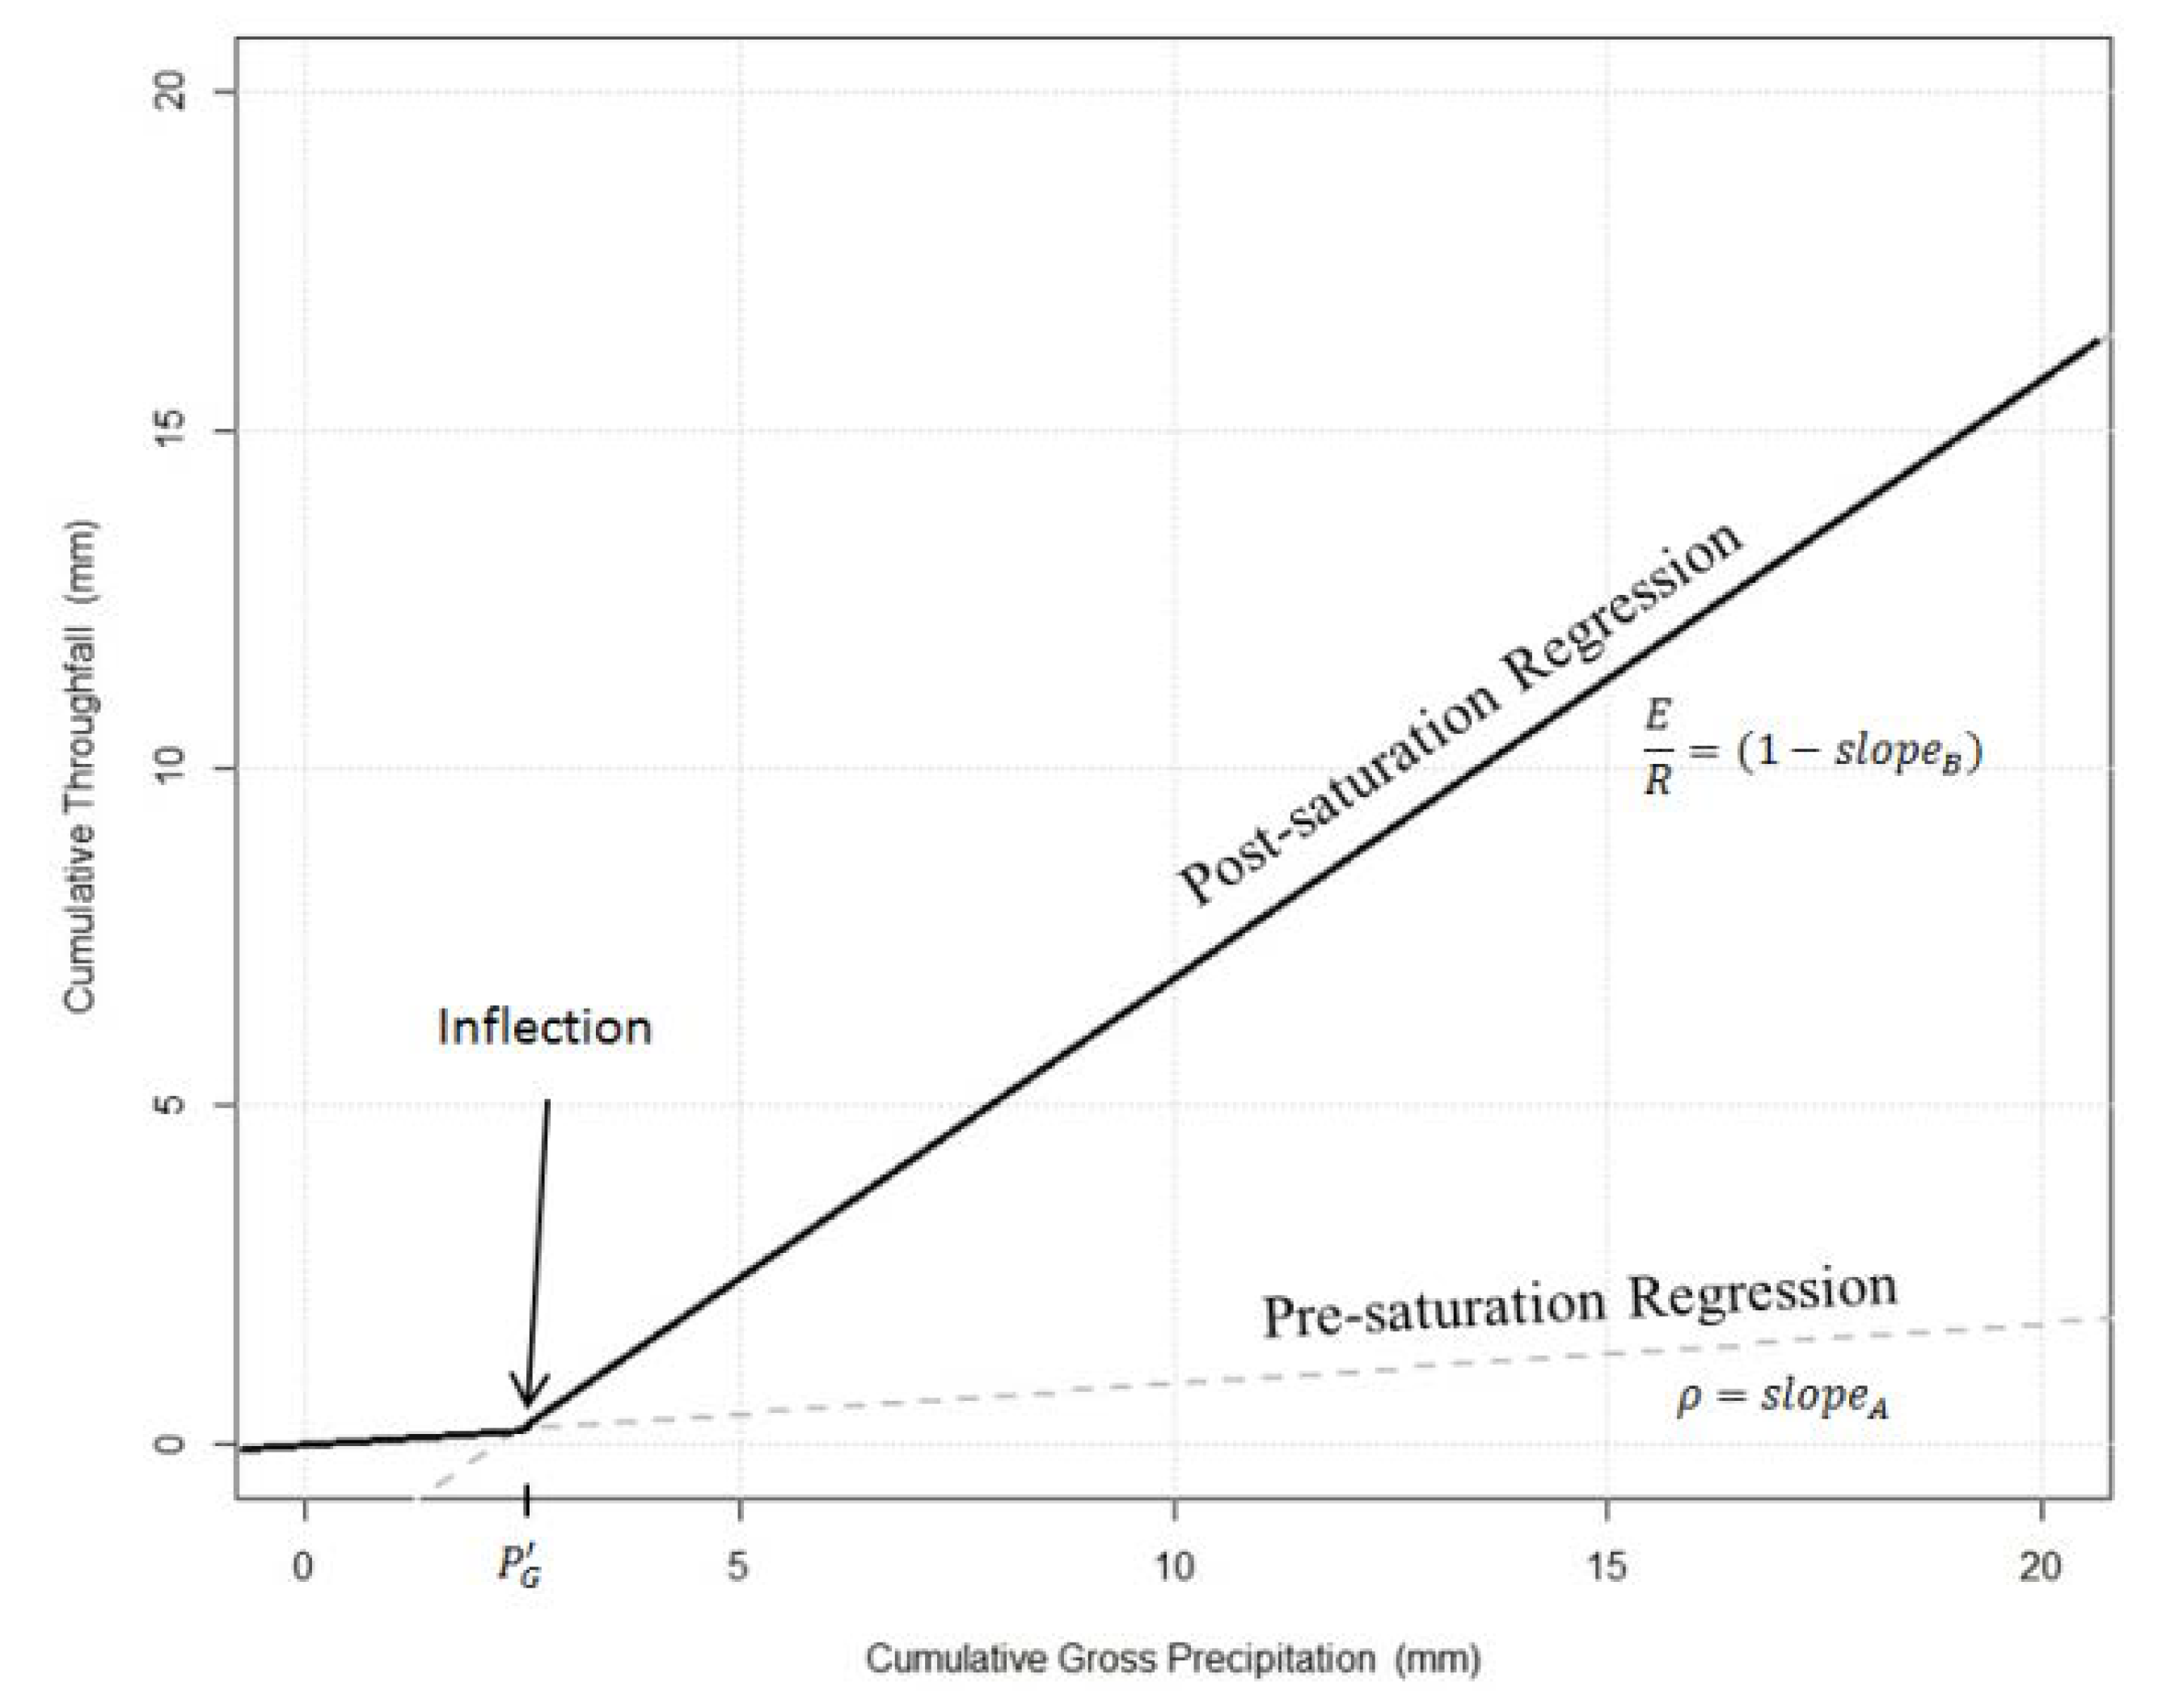
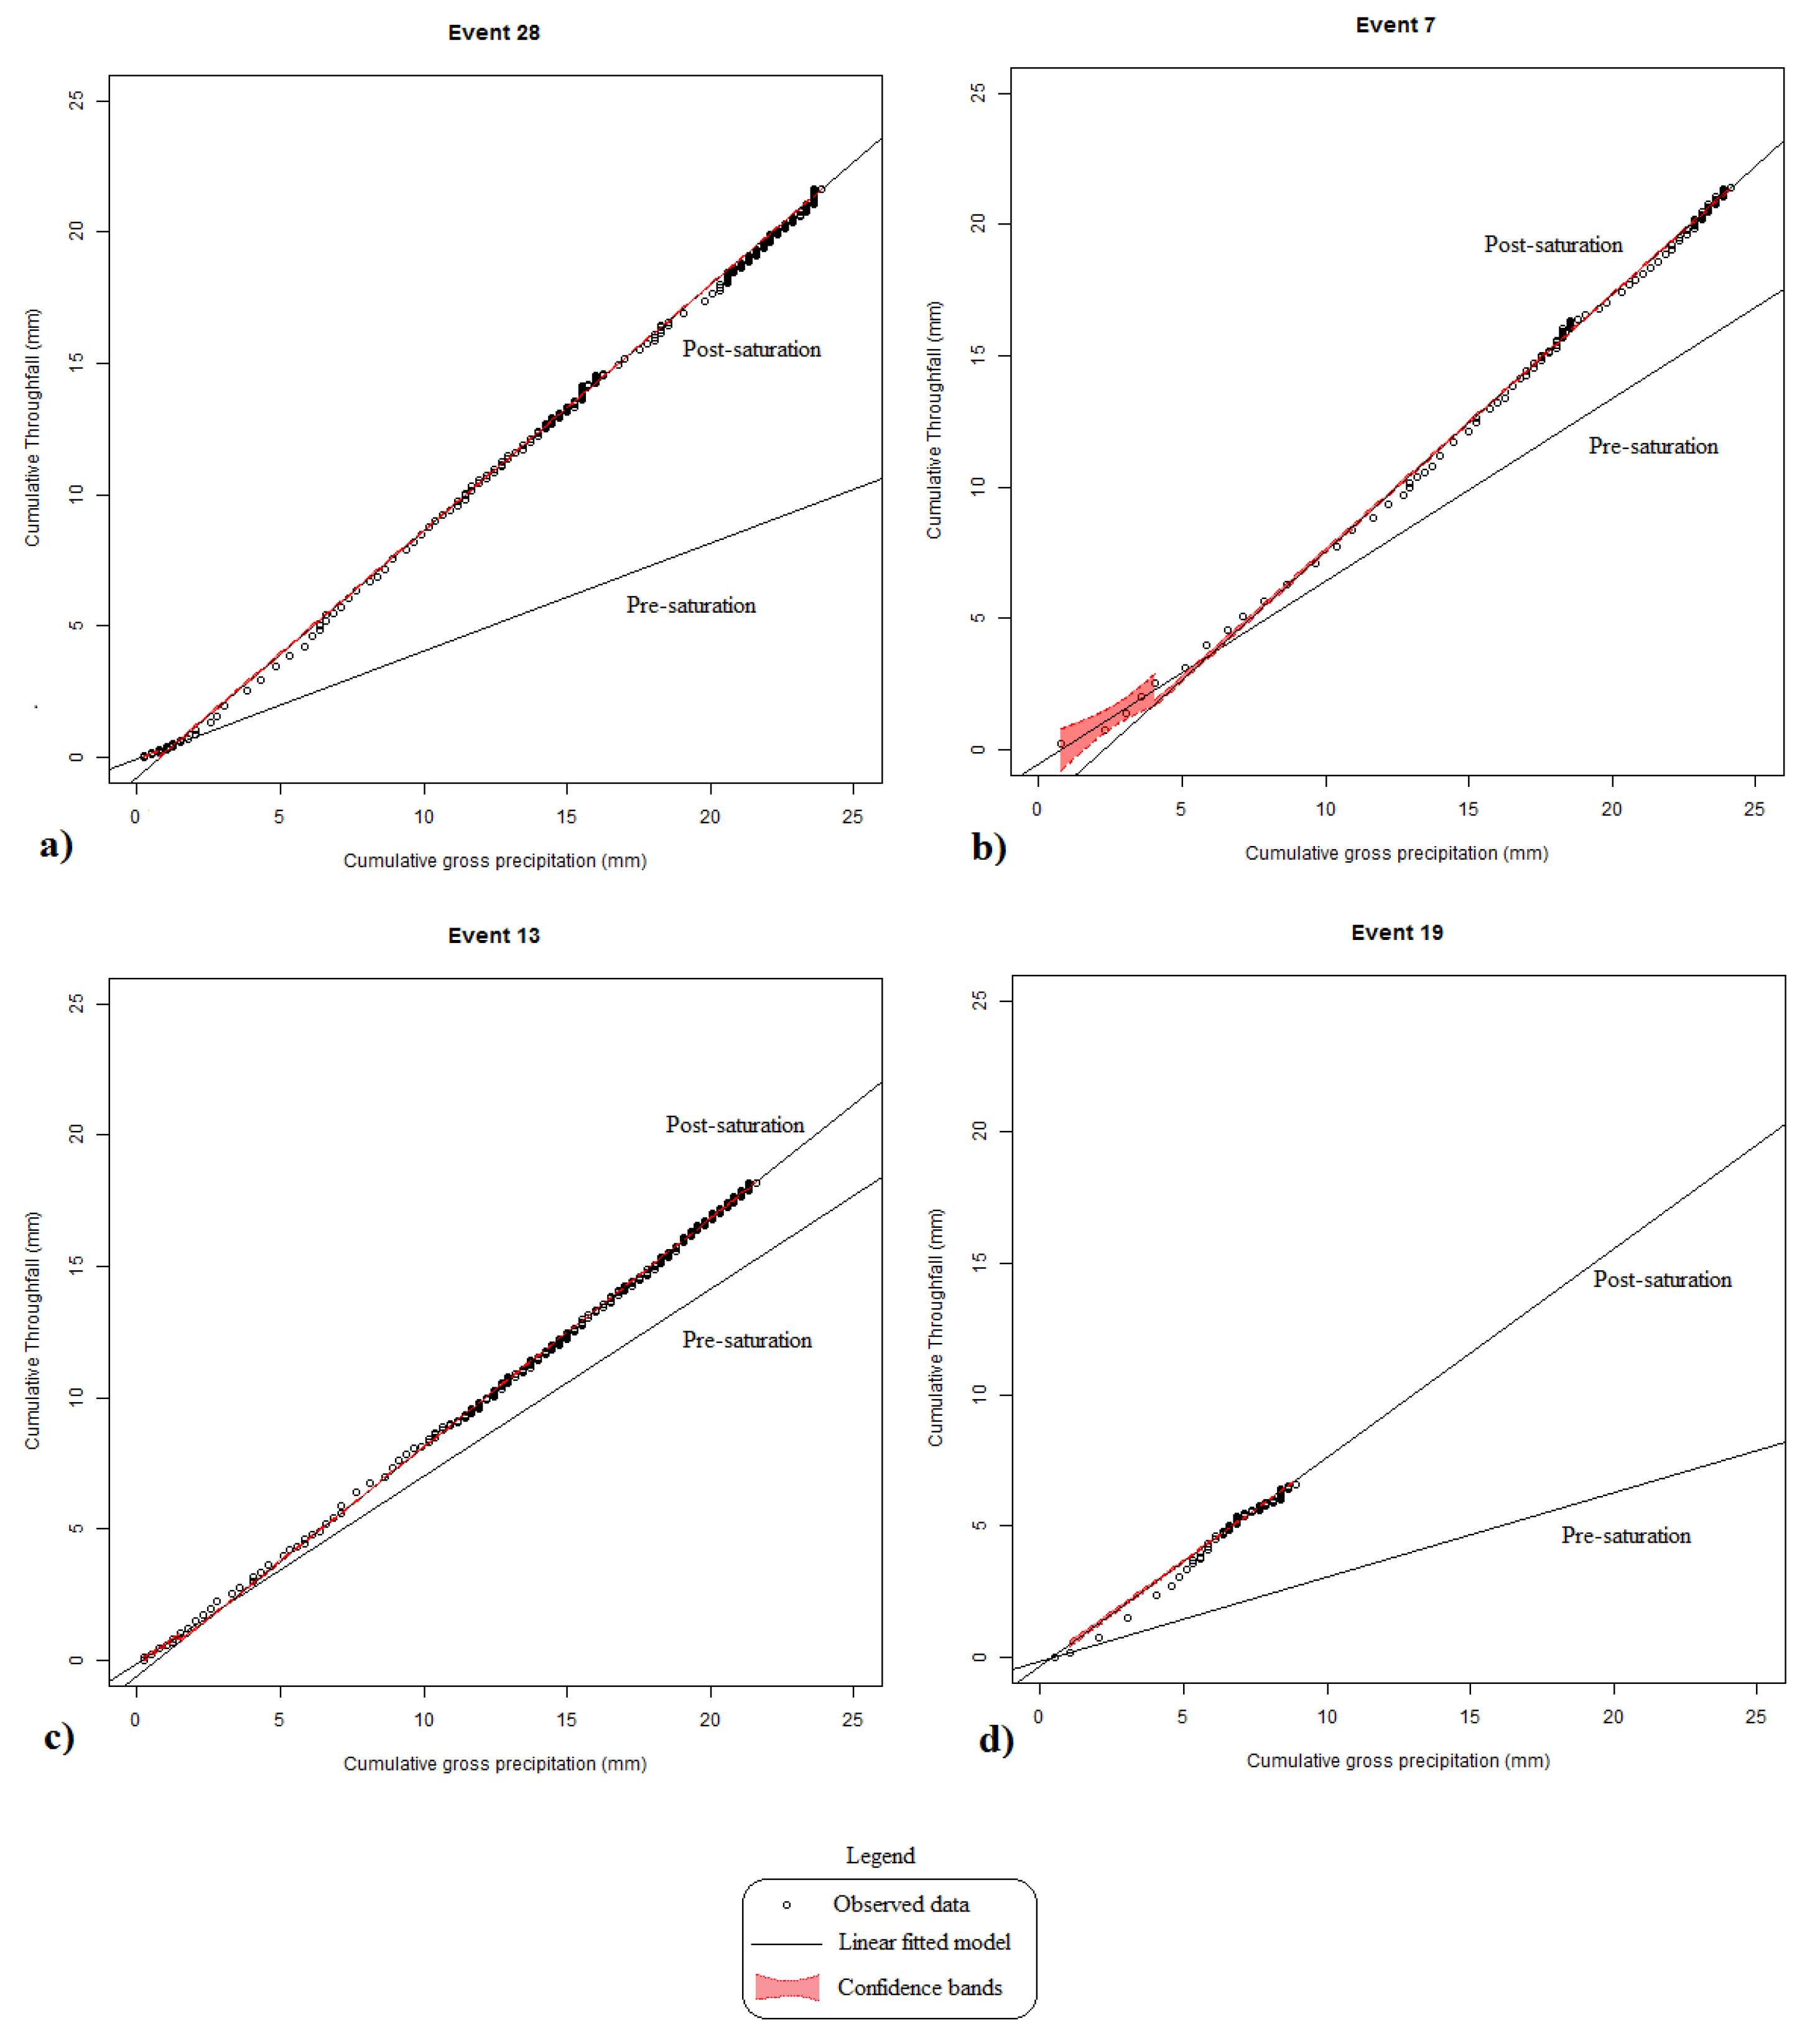
2.3. Model Parameterization—IS Linear Regression

To parameterize the canopy and energy variables, Link [8] proposed a method to derive P′G, S, ρ , and E R ¯ using a single event with high temporal resolution data. This individual storm (IS) method uses piecewise regression to fit two linear models between cumulative throughfall (Pn) and cumulative gross precipitation (PG). The first regression comprises the pre-saturation, while the second one covers the post-saturation canopy condition [9].
In the IS method (Figure 3), the slope of the pre-saturation line gives an estimate of ρ , while one minus the slope of the post-saturation line represents the E R ¯ rate. The cumulated gross precipitation value at the intersection point gives P′G, and finally, the difference between PG and Pn at the intersection point represents S.

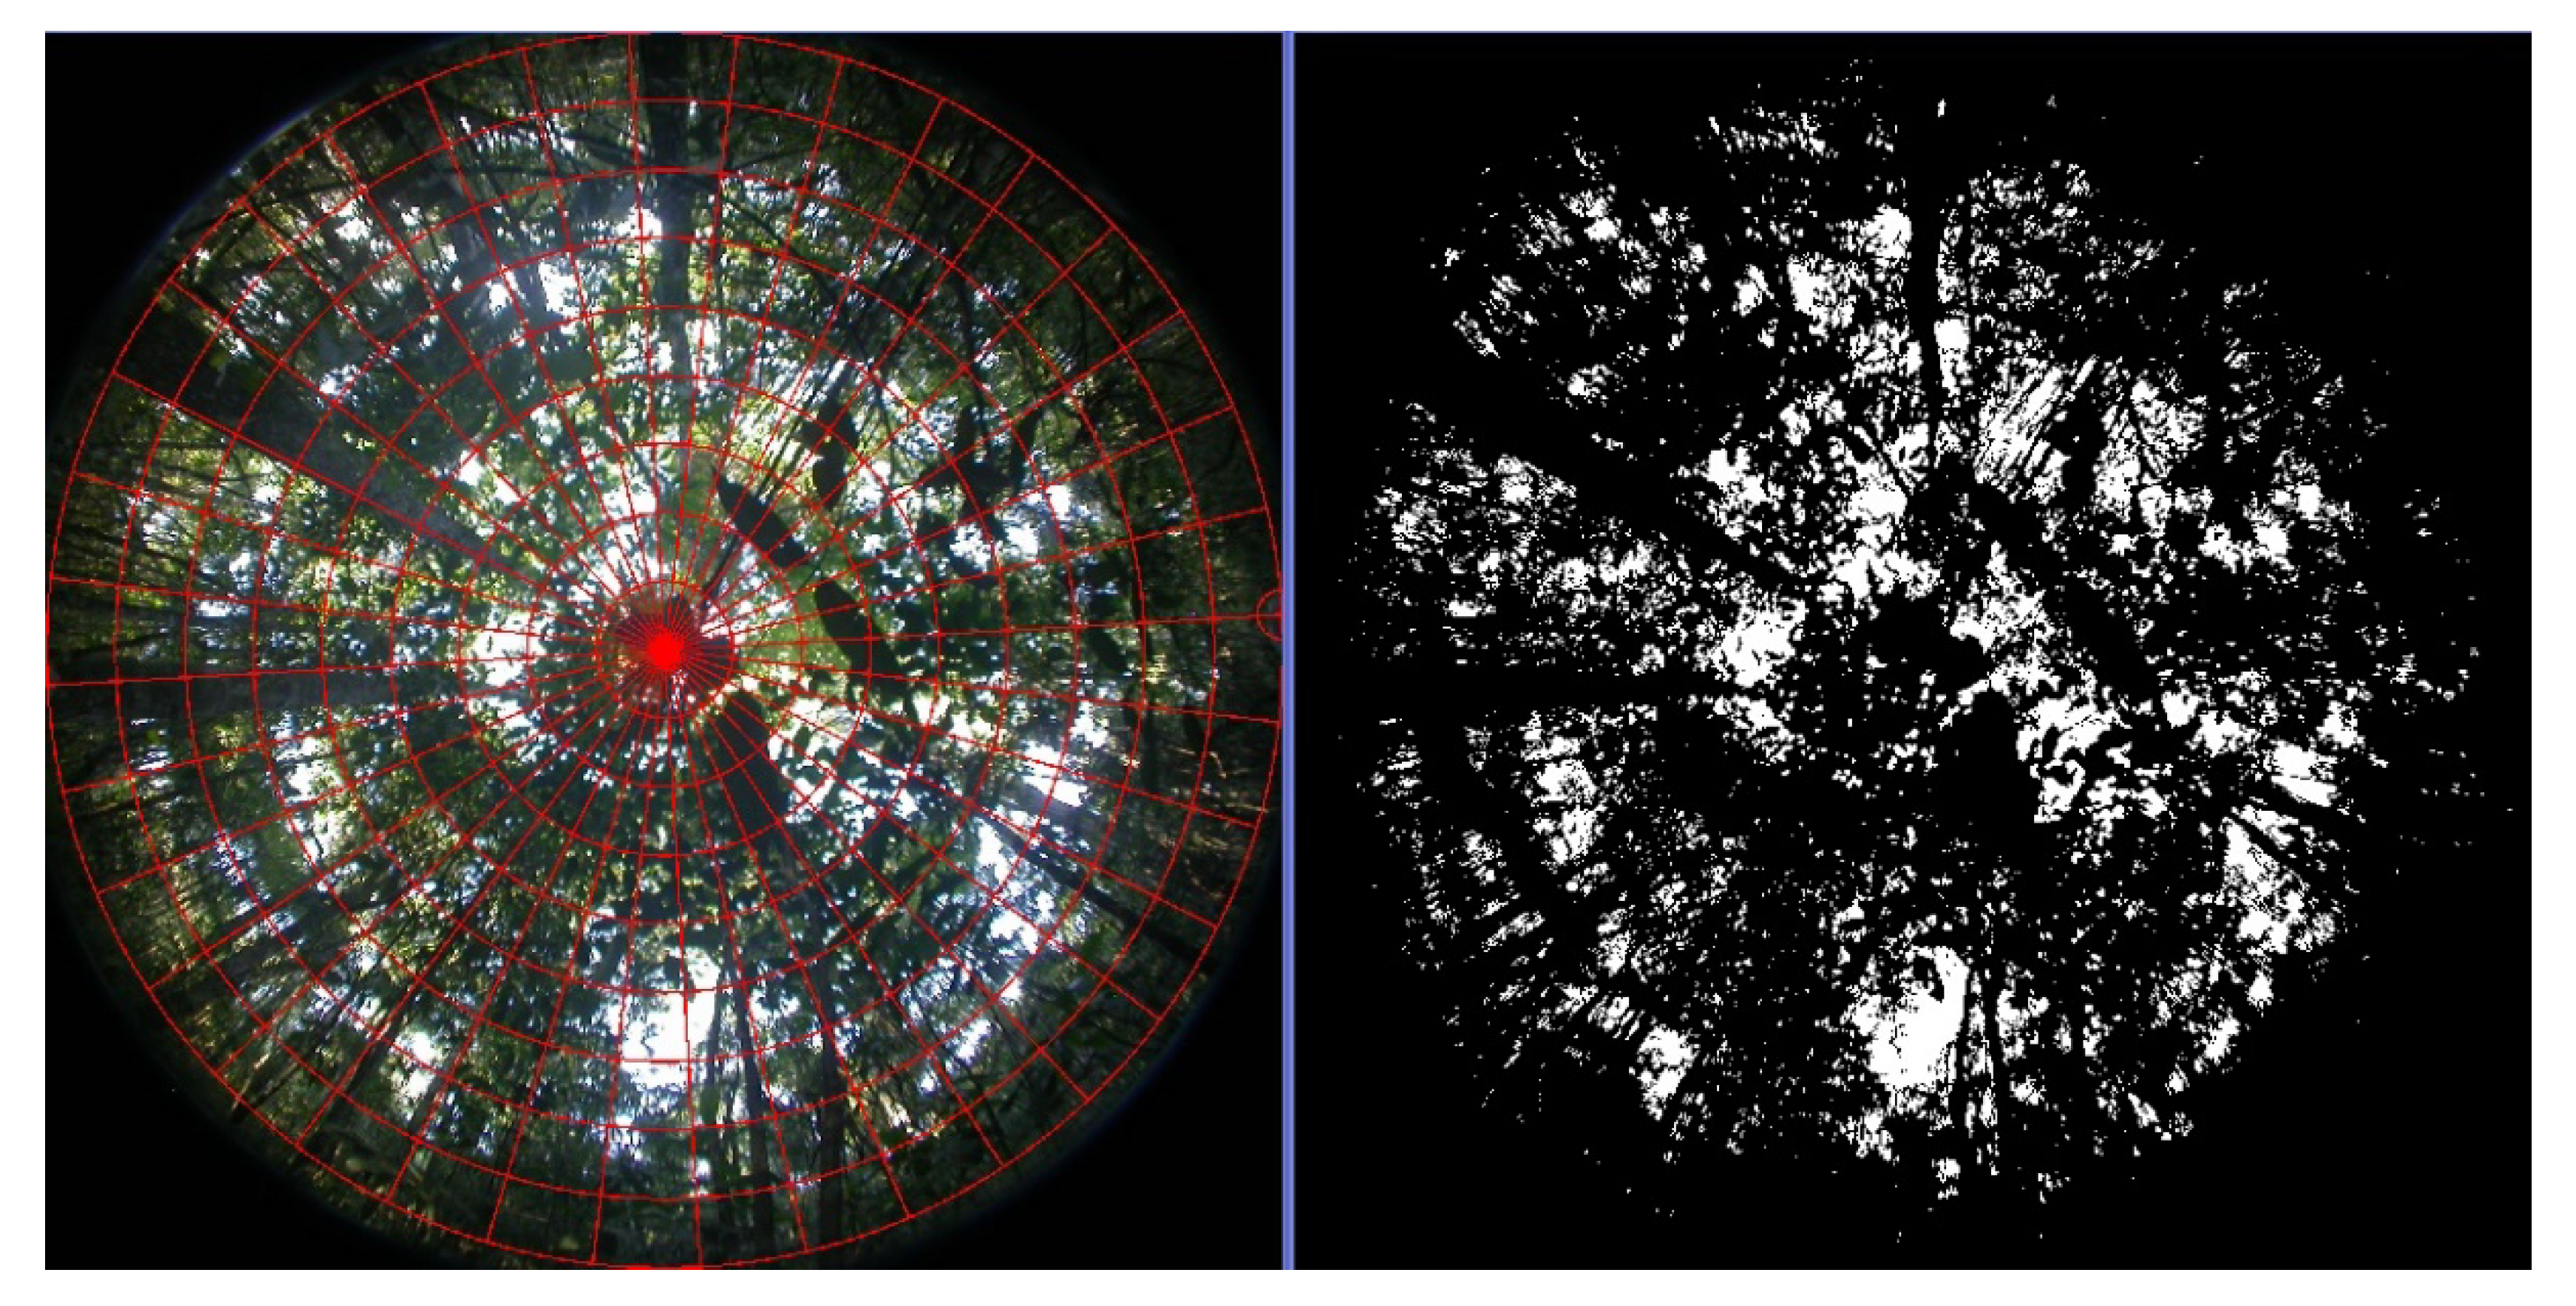
2.4. Gash Model Parameterization—Image-Based and Particle Swarm Optimization—PSO

Authors such as Zimmermann [13] and Cheng [22] use the direct measurement of the free throughfall coefficient ( ρ ) by analyzing the canopy structure of the trees, either using hemispheric photographs or by applying laser analyzers. The coefficient ρ of the Gash model reflects precisely the canopy openness, the free spaces between leaves and branches through which the precipitation freely reaches the soil.
In the present work, we performed a direct measurement of canopy openness at an experimental site as suggested by Zimmermann [13], using a Nikon Coolpix digital camera (Minato City, Tokyo, Japan) and a 180° fish-eye lens. The canopy openness index was calculated using Gap Light Analyzer 2.0 [23]. Figure 4 shows the image processing from the experimental plot.
The image-based approach only allows the canopy characterization. To work around this problem, we performed a calibration for the missing parameters (P′G, and E R ) using Particle Swarm Optimization (PSO). PSO is a population-based stochastic optimization technique inspired by social behavior of bird flocking, which shares some similarities with other evolutionary optimization techniques such as Genetic Algorithms (GA). In PSO, however, the multi-dimensional solution space is explored on the basis of individual and global best-known “particle positions” with no presence of evolution operators [24].
We wrote an R Program language code for computing throughfall using single event rainfall data and the Gash model parameters (P′G, ρ , and E R ) as input. The automatic calibration of the Gash model missing parameters was made using HydroPSO [24]. The canopy openness index and data of 35 observed events, with 5-min temporal resolution, were used for this propose. The code estimates, P′G and E R , maximizing the Nash–Sutcliffe Efficiency index (NSE) as the objective function. During the calibration process, we also allowed a small correction (±10%) of ρ incorporating natural variability of canopy structure, and inaccuracy of canopy openness measurements. Figure 5 presents a methodological diagram explaining this phase of the study. Computer code and field data are provided as supplementary material.

3. Results

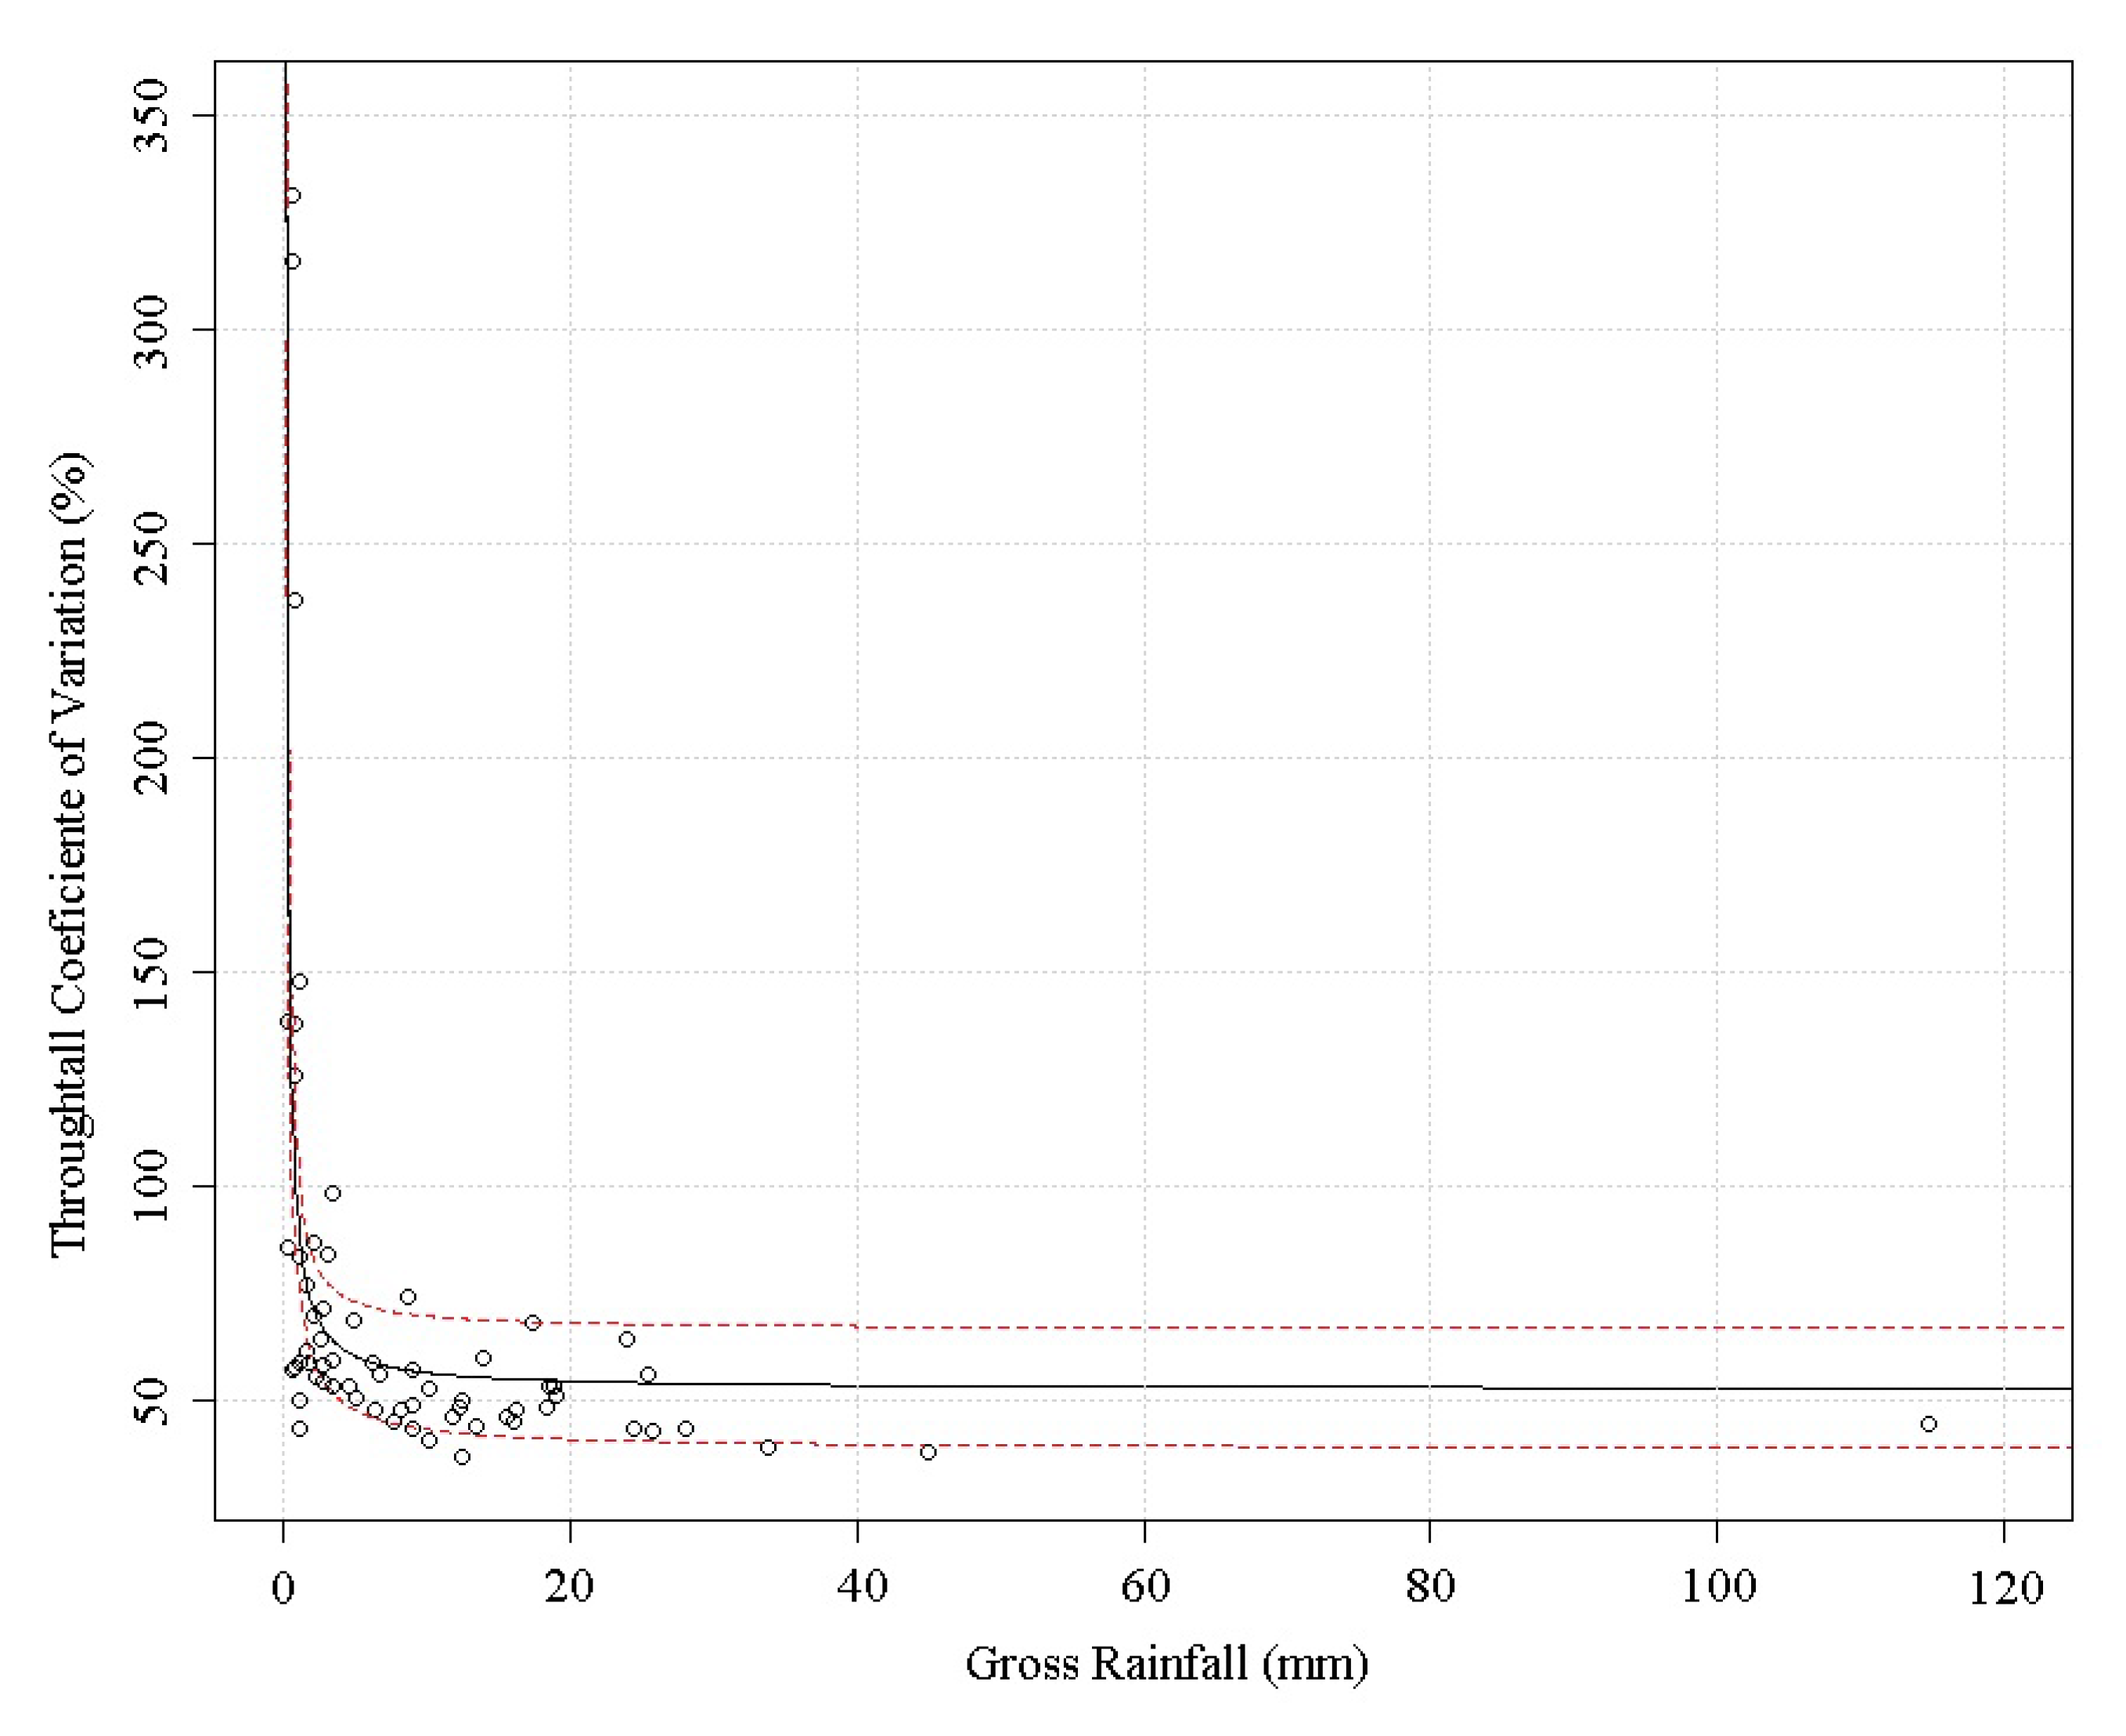
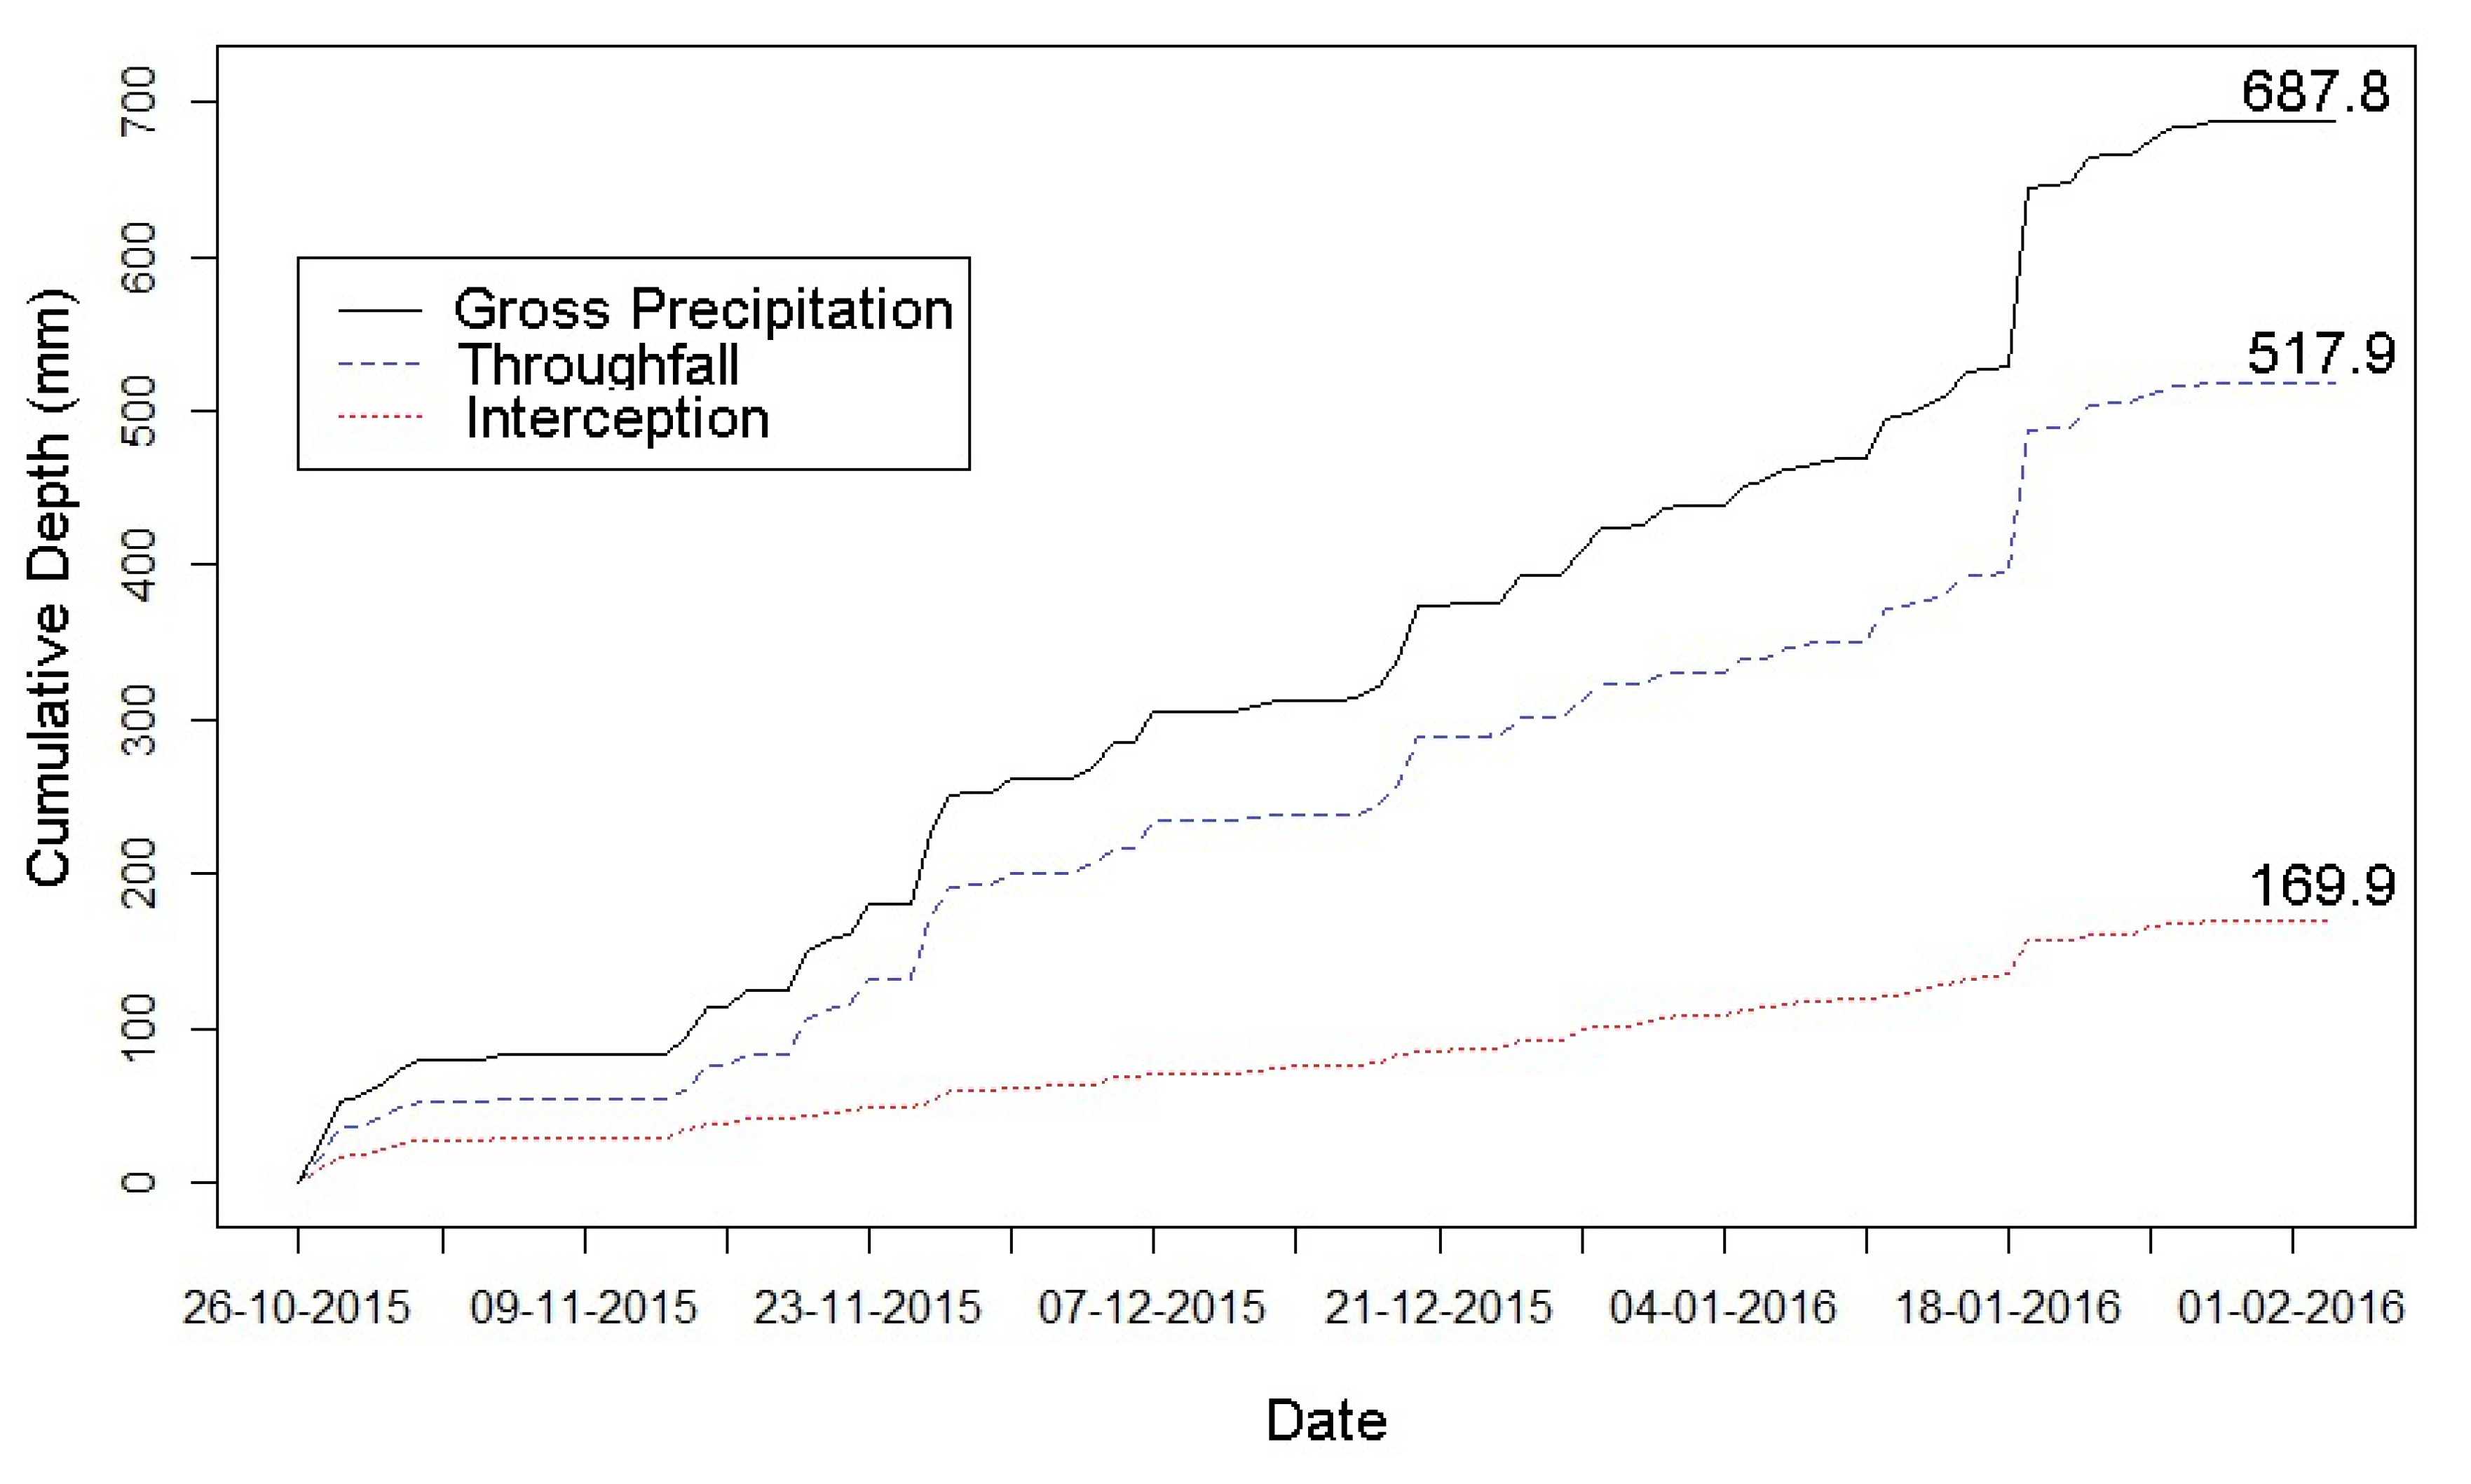
3.1. Sample Variability, Overall Throughfall, and Interception Behavior

As we can see in Figure 6, the fitted line (p-value: 2.21 × 10⁻⁶ with 62 Df—degrees of freedom) shows a very high coefficient of variation for small storms. The solid line indicates the least-squares fitting, while the dotted line represents the confidence interval of the model.
The results of this experiment confirm the observations of Helvey and Patric [2], Kimmins [16], and Jackson [25]. These authors detected that the spatial variability of the studied phenomenon is inversely proportional to the size of the rainfall event. It also demonstrates the high influence of the variability of canopy openness in throughfall. As the precipitation depth increases, the influence of free-throughfall on the overall throughfall is less important, and dripping is the main net precipitation mechanism. The lower influence of canopy openness is confirmed by the stabilization trend of the coefficient of variance.
With the fitted model presented in Figure 6, we applied Equation (1) to perform an analysis regarding the uncertainty around the true mean throughfall. For a sample size of 11 rain gauges (tc = 1.812, for 95% Confidence Interval - CI), we found a high mean error for small rainstorm depth, with a stabilization trend of approximately 20%, as the event depth increases. This indicates that studies of the Cerrado forest should increase sample sizes to reduce error around the mean to more acceptable values. This uncertainty around the throughfall value is related to the high variance in measurements resulting from the spatial variability of this phenomenon.
The linear regression of throughfall and gross precipitation along the observation period was statistically significant (p-value: <2.2 × 10⁻¹⁶ and 62 Df) with a slope coefficient of 0.82 (CI from 0.80 to 0.83) and an intercept of −0.46 (CI from −0.20 to −0.72), resulting in an R-squared of 0.98. This linear model indicates that in the gallery forest of Cerrado, 75.3% of the gross precipitation reaches the ground as throughfall and 24.7% is lost by interception (not considering stemflow). Figure 7 shows the time series of observed cumulative gross precipitation, throughfall, and interception on a daily basis.
This result indicates a higher interception from the Cerrado forest compared to forests in other Brazilian biomes. Giglio and Kobiyama [12] reported a throughfall median of 83.7% obtained from 16 references for the Amazon biome and 80.7% from 20 references for the Atlantic Forest biome. Vieira and Palmier [26], studying semi deciduous forest from the Cerrado biome, found a throughfall of 67 ± 8%. Oliveira [27] observed that 81.2% of gross precipitation was portioned as throughfall in a cerrado sensu-stricto. Interception of 23.6% (not considering stemflow) was observed in a Cerrado riparian forest by Carvalho [28]. This last reference, with same vegetation type is similar to those in the present work.

3.2. Event-Based Canopy Characterization and Gash Model Application

In the experimental period, a total of 35 events were observed considering an inter-event time of 6 h without rainfall (Table 1).
Five to six observation points prior to saturation were sufficient for a good fit with narrow confidence interval bands for the pre-saturation line (Figure 8a).
Finding the inflection point is the key element of the IS method. An automatic algorithm using the minimum global least square error suggested by Link et al. (2004) produced, in some cases, unrealistic breakpoints (Figure 8b–d). The problem is not the optimization process itself but the sampling limitation.
Since saturation occurs at the very beginning of rainfall (less than 3 mm), the linear model for the pre-saturation stage has more uncertainty. An example of this is shown in Figure 8b, where the red area represents the confidence interval for the linear model and the dark line represents the fitted linear model.
Even though the inflection point is reasonably reached with a root-mean-square—RMS reduction algorithm, the small number of observation points of the pre-saturation regression model leads to a wide confidence interval for the slope. This indicates a poor sampling of the free throughfall. So, therefore, even though we have previously discussed the high uncertainty of the real mean throughfall for small rainfall depth, it appears that the resolution (0.2 mm) of the rain gauges explains the lack of regression points before saturation. Using 0.1-mm-resolution rain gauges would probably have described the free throughfall in more detail. Another possible approach could be increasing the time resolution.
The 6 h inter-event period seems to be satisfactory to completely dry out the canopy in most of the observed events. However, for a few events, the absence of the pre-saturation condition indicates remaining moisture in the canopy (Figure 8c).
Lack of fit also occurs due to changes in the E/R rate during the event, causing a hydrologically unrealistic fit of the post-saturation line (Figure 8d).
For most events, the fitted coefficient ρ has a wide confidence interval denoted by the lower and upper bounds (lower CI, upper CI) (Table 1). The direct measurements by hemispheric photography of the experimental plot indicate a canopy ρ value of 0.18. The IS method, in turn, provides such high values as 0.67 and unrealistic low values such as −0.02, in complete disagreement with field measurements.
To overcome the limitation introduced by the uncertainty about the actual ρ values, we performed another approach using PSO optimization based on the field canopy image, allowing the algorithm to perform small adjustments of ρ , and major adjustments of P′G and E/R for each event.
Table 2 summarizes the result of the Gash model parameterization using the IS method and the PSO algorithm. From all observed events, the IS method was able to estimate the hydrological canopy parameters from 27 storms, while PSO optimization missed only 2 events out of a total of 35.
Concerning the ability of our models to fit the observed throughfall data, both methods provided good agreement with field data. The majority of modeled events exhibit a high Nash index. As we can see at Figure 9, parameterization using PSO has a narrower range for NSE with higher median value compared to IS method. The Gash model parameters are summarized by the box-plots in Figure 10.
Considering the spread of each data set, an F test to compare variances indicates a statistically significant variance reduction for ρ and P′G when PSO is the parameterization method (p-value—2.2 × 10⁻¹⁶, and p-value—0.04). For the storage (S) and E/R ratio, the statistic test does not show any differences.
For the IS method, the data distribution suggests a mean free throughfall of 0.32, with a confidence interval ranging from 0.26 to 0.37. The storage confidence intervals range from 1.48 mm to 2.1 mm, with a mean value of 1.79 mm. The saturation depth central position was 2.6 mm, with a confidence interval from 2.13 mm to 3.08 mm. The median observed E/R rate was of 0.19, with asymmetric confidence bands from 0.14 to 0.29.
Considering the PSO method, the results point to a mean free throughfall of 0.17, with a confidence interval ranging from 0.16 to 0.18. This narrow interval is due to the constrains imposed during the calibration so that the ρ value remained closer to the field image result. The storage confidence intervals range from 1.11 mm to 1.62 mm with a mean value of 1.37 mm. The saturation depth central position was 1.66 mm, with a confidence interval from 1.35 mm to 1.97 mm. The mean E/R rate was of 0.20, with asymmetric confidence bands from 0.15 to 0.24.
As pointed out before, the observed and calculated adherence measured by the NSE index only shows a small advantage of using PSO when a paired t-test was performed (Figure 9). Nevertheless, performing the same statistical test to the set of parameters shows more significant differences (Table 3). We can conclude, from those results, that both parameterization methods provided well-adjusted equations but with different parameter sets.
Using rainfall data and the calibrated model parameter from the PSO method, we performed a simulation of each event using the Gash model approach. Figure 11 exhibits some observed and modeled throughfall time series on an event basis. We observed that a 5 min time step simulation is sufficient to reach a high goodness of fit for the Nash coefficient index. The Gash model was able to precisely simulate the time series throughfall behavior on an event basis.
This model performance supports observations from Pypker [6] which indicated that when the Gash model incorporates the seasonal variation of ρ , S and E/R, average interception errors are slightly reduced.

4. Discussion and Conclusions

As noted by Giglio and Kobiyama [12], the understanding of the mechanisms involved in the interception process is still unsatisfactory, especially in tropical forests. Measurements of interception on a periodic basis presents fewer problems than estimation on an individual event basis because the variables that affect the values of throughfall and stemflow can change over very short periods, for example, the intensity and angle of rainfall, and wind speed and direction. However, carefully conducted event-based studies can quantify the influence of a number of variables [16]. The present study sought to contribute to an improvement in the knowledge of interception mechanisms in riparian forests of the Cerrado in support of hydrological modeling of this biome.
The rainfall interception process in a Cerrado riparian gallery forest was evaluated by reverse modeling using data from 35 rainfall events. The experimental setup indicated that 75.3% of the total precipitation is converted to net precipitation and 24.7% is intercepted by the canopy. Higher interception in the Cerrado forest compared to other Brazilian vegetation types have been attributed, in part, to a higher canopy storage and evaporative rates during rainfall events. The studied vegetation was presented as a mean free throughfall coefficient ( ρ ) of 0.17 with a storage (S) of 1.37 mm, a saturation depth (P′G) of 1.66 mm and evapotranspiration/rain rate (E/R) of 0.2. However, the different precipitation events analyzed suggest some variability in the set of parameters that govern the Gash model.
Previous work in the Amazon biome supports ρ values from 0.03 to 0.13 [17,29,30], indicating a slightly smaller contribution from this process to net precipitation when compared to the Cerrado forest ( ρ = 0.17). They also indicated a storage capacity from 0.74 mm to 1.049 mm. Although with greater openness, the Cerrado forest storage per unit area (S = 1.79 mm) was superior to that of the Amazon rainforest. Regarding the E/R rate, the study area exhibits much higher evaporation in the wet canopy condition—0.20—compared to those from the Amazon of 0.031 to 0.045. According to Dunkerley [31], considerable experimental evidence exists to show that impact droplets and microdroplets are produced in large numbers by energetic drop collisions such as would exist on the upper parts of plant canopies during rain. The author also points out that microdroplets are consumed by evaporation rapidly and they would not survive the distances of fall to the soil surface. Since the Cerrado has a climate characterized by low relative humidity, the role of the Splash droplet evaporation could explain this greater influence of evaporative processes in comparison with other Brazilian biomes. Further investigation is needed to account for the contribution of these specific processes.
Although the box-plot (Figure 10) shows an overlap of NSE from those different parameterization methods and a high correlation between the adherence index from the two methods (r −0.88, p-value—1.3 × 10⁻⁹), a paired t-test points to a small mean difference of –0.013 (p-value—0.016). Considering the parameterization method (IS × PSO), free throughfall ( ρ ), storage (S), saturation depth (P′G), and E/R presented a statistical significant correlation with an r value of 0.35 (p-value—0.03), 0.82 (p-value—8.05 × 10⁻⁸), 0.73 (p-value—1.08 × 10⁻⁵), and 0.93 (p-value—1.91 × 10⁻¹²), respectively.
When using the Gash model for the intercept simulation, the modeler should keep in mind that the average values presented in this work were associated with the high variability of the parameters and can lead to inexact results in the event scale simulations. For long-term simulations, less influence of this variability is expected when adopting the median values observed in the present study.
Sampling design was evaluated by the behavior of the mean error of the measured rainfall intensity. Sampling errors decreased with rainfall depth and a stabilization trend of around 20% error was observed for rainfall depths greater than 10 mm. This high uncertainty is associated with the variance of the throughfall due to its spatial variability below the canopy of the gallery forest. This observation indicates that future studies in Cerrado riparian forests should increase sampling points to reduce standard error values.
As noted in Table 3, when analyzing the parameters set for different events in a paired test, there are statistically significant differences between the parameterization methods (SI × PSO/Image), with the exception of the E/R parameter that did not show such differences. One hypothesis for this result is based on the small uncertainty in determining the slope of the canopy post-saturation function. Parameterization of ρ by the IS method often exhibited high uncertainty when establishing the slope of the pre-saturation line. From this, it seems to us that the determination of ρ by hemispheric image presents itself as an advantage in comparison with the IS regression method. In addition, the PSO automatic calibration algorithm was able to achieve results equivalent to the IS method for determining E/R.
The experimental design—using 11 rain gauges with a diameter of 16.5 cm—showed uncertainty in the measurements of the throughfall. As suggested by Crockford [16], the use of large plastic sheet net rainfall collectors can overcome the variability problems, but it is not clear how to deal with the accumulation of litter, that can be a source of interference in the measurement, or how to record continuously throughfall data considering the flow delays in this type of large collector. For future work, suggest an increase in the number of rain gauges or even the use of devices with a larger diameter to reduce the uncertainties.

Supplementary Materials

Computer code and field data are available on: https://github.com/brunoengamb/Gash_PSO.

Author Contributions

B.E.T.—experimental set up as part of PhD Thesis, writing—original draft preparation; S.K.—advisor, writing, review and editing. All authors have read and agreed to the published version of the manuscript.

Funding

This research was funded by National Council for Scientific and Technological Development, grant number 455789/2014-2

Acknowledgments

We would like to acknowledge the support of the Brazilian agencies and institution MPDFT, Finep, ANA, and particularly CNPq.

Conflicts of Interest

The authors declare no conflict of interest.

References

  1. Véliz-Chávez, C.; Mastachi-Loza, C.A.; González-Sosa, E.; Becerril-Piña, R.; Ramos-Salinas, N.M. Canopy Storage Implications on Interception Loss Modeling. Am. J. Plant Sci. 2014, 5, 3032–3048. [Google Scholar] [CrossRef] [Green Version]
  2. Helvey, J.D.; Patric, J.H. Design criteria for interception studies. Hydrol. Sci. Bull. Int. Assoc. Hydrol. Sci. 1966, 67, 131–137. [Google Scholar]
  3. Murakami, S. A proposal for a new forest canopy interception mechanism: Splash droplet evaporation. J. Hydrol. 2006, 319, 72–82. [Google Scholar] [CrossRef]
  4. Kavian, A.; Alipour, A.; Soleimani, K.; Gholami, L.; Smith, P.; Rodrigo-Comino, J. The increase of rainfall erosivity and initial soil erosion processes due to rainfall acidification. Hydrol. Process. 2019, 33, 261–270. [Google Scholar] [CrossRef] [Green Version]
  5. Beguería, S.; Angulo-Martínez, M.; Gaspar, L.; Navas, A. Detachment of soil organic carbon by rainfall splash: Experimental assessment on three agricultural soils of Spain. Geoderma 2015, 245–246, 21–30. [Google Scholar] [CrossRef] [Green Version]
  6. Rutter, A.J.; Kershaw, K.A.; Robins, P.C.; Morton, A.J. A predictive model of rainfall interception in forests, 1. Derivation of the model from observations in a plantation of Corsican pine. Agric. Meteorol. 1971, 9, 367–384. [Google Scholar] [CrossRef]
  7. Gash, J.H.C. An analytical model of rainfall interception by forests. Q. J. R. Meteorol. Soc. 1979, 105, 43–55. [Google Scholar] [CrossRef]
  8. Link, T.E.; Unsworth, M.; Marks, D. The dynamics of rainfall interception by a seasonal temperate rainforest. Agric. For. Meteorol. 2004, 124, 171–191. [Google Scholar] [CrossRef] [Green Version]
  9. Pypker, T.G.; Bond, B.J.; Link, T.E.; Marks, D.; Unsworth, M.H. The importance of canopy structure in controlling the interception loss of rainfall: Examples from a young and an old-growth Douglas-fir forest. Agric. For. Meteorol. 2005, 130, 113–129. [Google Scholar] [CrossRef]
  10. Brutsaert, W. Hydrology: An Introduction, 5th ed.; Cambridge University Press: Cambridge, UK, 2010; ISBN 0521824796. [Google Scholar]
  11. MMA—Ministry of Environment O Bioma Cerrado. Available online: http://www.mma.gov.br/biomas/cerrado (accessed on 16 May 2016).
  12. Giglio, J.N.; Kobiyama, M. Interceptação da Chuva: Uma Revisão com Ênfase no Monitoramento em Florestas Brasileiras. RBRH-Rev. Bras. Recur. Hídricos 2013, 18, 297–317. [Google Scholar] [CrossRef]
  13. Zimmermann, A.; Zimmermann, B.; Elsenbeer, H. Rainfall redistribution in a tropical forest: Spatial and temporal patterns. Water Resour. Res. 2009, 45, 1–18. [Google Scholar] [CrossRef] [Green Version]
  14. De Oliveira, M.C.; Felfili, J.M.; da Silva Júnior, M.C. Análise florística e fitossociológica da comunidade arbórea da Mata de Galeria do Capetinga, após vinte anos de passagem de fogo, na Fazenda Água Limpa, Brasília—DF. Heringeriana 2011, 5, 19–31. [Google Scholar]
  15. Seabra, H.F.; Encinas, J.M.; Felfili, J.M. Análise estrutural da mata ciliar do Córrego Capetinga—DF, habitat de Callithrix jacchus penicillata. Pesqui. Agropecuária Bras. 1991, 26, 11–17. [Google Scholar]
  16. Crockford, R.H.; Richardson, D.P. Partitioning of rainfall into throughfall, stemslow∠d interception effect of forest type, ground cover and climate. Hydrol. Process. 2000, 14, 2903–2920. [Google Scholar] [CrossRef]
  17. Lloyd, C.R.; Gash, J.H.C.; Shuttleworth, W.J. The measurement and modelling of rainfall interception by Amazonian rain forest. Agric. For. Meteorol. 1988, 43, 277–294. [Google Scholar] [CrossRef]
  18. Marin, C.T.; Bouten, W.; Sevink, J. Gross rainfall and its partitioning into throughfall, stemflow and evaporation of intercepted water in four forest ecosystems in western Amazonia. J. Hydrol. 2000, 237, 40–57. [Google Scholar] [CrossRef]
  19. Zimmermann, B.; Zimmermann, A.; Elsenbeer, H. Sampling procedures for throughfall monitoring: A simulation study. Water Resour. Res. 2010, 46, 1–15. [Google Scholar] [CrossRef] [Green Version]
  20. Kimmins, J.P. Some Statistical Aspects of Sampling Throughfall Precipitation in Nutrient Cycling Studies in British Columbian Coastal Forests. Ecology 1973, 54, 1008–1019. [Google Scholar] [CrossRef]
  21. Gash, J.H.; Lloyd, C.R.; Lachaud, G. Estimating sparse forest rainfall interception with an analytical model. J. Hydrol. 1995, 170, 79–86. [Google Scholar] [CrossRef]
  22. Chen, S.; Chen, C.; Zou, C.B.; Stebler, E.; Zhang, S.; Hou, L.; Wang, D. Application of Gash analytical model and parameterized Fan model to estimate canopy interception of a Chinese red pine forest. J. For. Res. 2013, 18, 335–344. [Google Scholar] [CrossRef]
  23. Frazer, G.; Canham, C.; Lertzman, K. Gap Light Analyzer (GLA): Imaging software to extract canopy structure and gap light transmission indices from true-colour fisheye photographs. Program 1999, 36. [Google Scholar]
  24. Zambrano-Bigiarini, M.; Rojas, R. Particle Swarm Optimisation, with Focus on Environmental Models. R Package Version 0.3-4 2013. [Google Scholar] [CrossRef]
  25. Jackson, I.J. Problems of throughfall and interception assessment under tropical forest. J. Hydrol. 1971, 12, 234–254. [Google Scholar] [CrossRef]
  26. Vieira, C.P.; Palmier, L.R. Medida e Modelagem da Interceptação da Chuva em uma Área Florestada na Região Metropolitana de Belo Horizonte, Minas Gerais. Rev. Bras. Recur. Hídricos 2006, 11, 101–112. [Google Scholar] [CrossRef]
  27. Oliveira, P.T.S.; Wendland, E.; Nearing, M.A.; Scott, R.L.; Rosolem, R.; Da Rocha, H.R. The water balance components of undisturbed tropical woodlands in the Brazilian cerrado. Hydrol. Earth Syst. Sci. 2015, 19, 2899–2910. [Google Scholar] [CrossRef] [Green Version]
  28. Carvalho, F.; da Assunção, H.F.; Scopel, I. Partição Pluviométrica Em Fitofisionomias Do Cerrado. Mercator 2013, 12, 135–147. [Google Scholar] [CrossRef]
  29. Germer, S.; Elsenbeer, H.; Moraes, J.M. Throughfall and temporal trends of rainfall redistribution in an open tropical rainforest, south-western Amazonia (Rondônia, Brazil). Hydrol. Earth Syst. Sci. Discuss. 2005, 2, 2707–2738. [Google Scholar] [CrossRef] [Green Version]
  30. Cuartas, L.A.; Tomasella, J.; Nobre, A.D.; Hodnett, M.G.; Waterloo, M.J.; Múnera, J.C. Interception water-partitioning dynamics for a pristine rainforest in Central Amazonia: Marked differences between normal and dry years. Agric. For. Meteorol. 2007, 145, 69–83. [Google Scholar] [CrossRef]
  31. Dunkerley, D.L. Evaporation of impact water droplets in interception processes: Historical precedence of the hypothesis and a brief literature overview. J. Hydrol. 2009, 376, 599–604. [Google Scholar] [CrossRef]
Figure 1. Experimental watershed in the context of Brazilian biomes.
Water 12 02128 g001
Figure 2. Tipping bucket rain gauge at the experimental plot.
Water 12 02128 g002
Figure 3. Graphic method for Gash model parameterization.
Water 12 02128 g003
Figure 4. Hemispheric image from the plot area. Left image displays the geometric adjustment grid for lens distortions. The image on the right shows the product of high contrast processing for classification of areas with leaf coverage (black) and sky (white).
Water 12 02128 g004
Figure 5. Methodological steps for numerical modeling.
Water 12 02128 g005
Figure 6. Throughfall coefficient of variance for different rain depth.
Water 12 02128 g006
Figure 7. Gross precipitation, throughfall and interception time series from the Cerrado gallery forest.
Water 12 02128 g007
Figure 8. Examples of field data fit to IS method: (a) Event 28; (b) Event 7; (c) Event 13; and (d) Event 19.
Water 12 02128 g008
Figure 9. Boxplot of fit goodness from IS and PSO parameterization methods.
Water 12 02128 g009
Figure 10. Box plot of Gash model parameters with IS and particle swarm optimization (PSO) parameterization methods: (a) ρ ; (b) S; (c) P′G; and (d) E/R.
Water 12 02128 g010
Figure 11. Some throughfall simulation results from PSO/Image-based parameterization. (a) event 1; (b) event 2, (c) event 10, (d) event 21.
Water 12 02128 g011
Table 1. Summary of the rainfall events and canopy free throughfall (ρ) coefficient obtained by the individual storm (IS) method.
Observed DataIS Method Adjusted Coefficient Statistics
EventPrecipitation (mm)Throughfall (mm)ρLower CIUpper CIp-Value
124.3816.280.210.040.382.99 × 10−2
227.9418.940.250.190.311.90 × 10−5
313.218.70.120.040.21.29 × 10−2
412.455.540.080.030.146.59 × 10−3
51613.580.50.340.672.40 × 10−3
610.167.780.350.230.472.50 × 10−3
724.1321.4NANANANA
86.64.90.11−0.020.238.16 × 10−2
94.833.550.510.390.638.91 × 10−4
1018.816.030.440.350.532.48 × 10−7
1143.6940.46NANANANA
124.321.820.360.210.526.13 × 10−4
1321.5918.16NANANANA
1410.166.80.380.260.497.17 × 10−4
156.354.8NANANANA
1616.2611.80.220.210.232.20 × 10−16
1719.317NANANANA
184.572.60.460.380.549.00 × 10−5
198.896.55NANANANA
2017.2712.530.30.130.471.09 × 10−2
2133.7830.470.560.530.592.20 × 10−16
2216.7612.94NANANANA
2315.249.550.160.110.21.58 × 10−5
2413.5610.160.440.410.472.27 × 10−9
2512.197.670.270.140.396.43 × 10−3
2610.677.380.220.110.337.84 × 10−3
279.656.60.170.050.292.16 × 10−2
2823.8821.630.410.370.452.20 × 10−16
296.353.53NANANANA
308.135.780.230.210.262.20 × 10−16
3113.729.30.310.210.42.25 × 10−5
32115.5793.70.450.410.482.20 × 10−16
3314.9913.080.480.340.614.08 × 10−3
348.644.60.230.150.311.27 × 10−3
356.3540.470.440.52.20 × 10−16
Table 2. Summary of the rainfall events and Gash model parameters obtained by the IS method and PSO optimization.
Observed DataIndividual Storm—ISParticle Swarm Optimization—PSO
EventPrecipitation (mm)Throughfall (mm) ρ S (mm)P′G (mm)E/RNash ρ S (mm)P′G (mm)E/RNash
124.3816.280.212.723.230.260.920.162.462.930.250.93
227.9418.940.251.161.450.290.950.181.471.790.270.97
313.218.70.122.482.740.190.90.162.42.860.160.87
412.455.540.081.521.610.490.80.161.371.630.480.72
51613.580.52.253.53−0.030.970.22.392.970.010.98
610.167.780.352.353.39−0.010.950.22.4130.050.96
724.1321.4NANANANANA0.161.251.50.110.97
86.64.90.110.450.50.220.960.170.530.640.250.96
94.833.550.511.012.060.060.940.170.370.440.180.86
1018.816.030.441.682.740.070.860.160.921.10.130.89
1143.6940.46NANANANANA0.180.630.760.010.97
124.321.820.360.971.390.520.940.190.851.050.550.95
1321.5918.16NANANANANA0.20.230.290.140.91
1410.166.80.381.191.690.20.840.20.760.940.230.87
156.354.8NANANANANA0.180.060.080.260.98
1616.2611.80.220.80.940.240.920.160.851.010.20.91
1719.317NANANANANANANANANANA
184.572.60.461.452.780.220.88NANANANANA
198.896.55NANANANANA0.161.311.560.110.94
2017.2712.530.32.433.320.160.990.192.422.980.160.99
2133.7830.470.562.335.140.040.940.162.282.720.040.91
2216.7612.94NANANANANA0.20.821.020.180.94
2315.249.550.162.6330.260.890.172.092.520.350.88
2413.5610.160.442.64.450.040.950.161.922.290.180.97
2512.197.670.274.115.310.040.940.162.5130.190.95
2610.677.380.222.12.560.140.930.161.481.770.240.95
279.656.60.171.241.460.210.850.171.311.580.210.90
2823.8821.630.410.821.260.060.930.161.471.760.080.94
296.353.53NANANANANA0.160.380.460.420.69
308.135.780.231.661.950.060.810.191.411.730.110.80
3113.729.30.311.522.10.210.780.171.071.290.270.80
32115.5793.70.451.793.020.170.980.21.481.840.180.98
3314.9913.080.481.983.3600.890.181.241.50.090.90
348.644.60.231.521.870.360.930.161.281.530.410.97
356.3540.471.823.610.20.990.21.922.390.210.98
Table 3. Paired t-test summary statistics.
Parameterst-Valuedfp-ValueMean of the Differences
ρ 5.412251.29 × 10−50.142
S2.864258.34 × 10−30.249
P′G4.269252.48 × 10−40.708
E/R−3.941255.77 × 10−4−0.040

