Abstract
We address the issue of characterizing experimentally entrainment and disentrainment of sediment particles of cohesionless granular beds in turbulent open channel flows. Employing Particle Image Velocimetry, we identify episodes of entrainment and of disentrainment of bed particles by analysing the raw PIV images. We define a reference velocity for entrainment or disentrainment by space-averaging the flow field in the vicinity of the (entrained or disentrainned) particle and by time-averaging that space-average over a short duration encompassing the observed episode. All observations and measurements took place under generalized movement conditions and in non-controlled geometrical set-ups, resulting in unique databases of conditionally sampled turbulent flow kinematics associated with episodes of particle entrainment and of particle disentrainment. Exploring this database, the objective of this paper is to prove further insights on the dynamics of fluid-particle and particle-particle interactions at entrainment and disentrainment and to polemicize the use of a reference velocity to serve as a proxy for hydrodynamics actions responsible for entrainment or disentrainment. In particular, we quantify the reference velocity associated with entrainment and disentrainment episodes and discuss its potential to describe the observed motion vis-a-vis local bed micro-topography and the type of entrainment or disentrainment event. Entrainment may occur at a wide range of reference velocities, including smaller than mean (double-averaged) velocities. Anecdotal evidence was collected for some typologies of entrainment: (i) momentum transfer from flow to a single particle, (ii) momentum transfer from a perturbed local flow to a single particle, (iii) collective entrainment associated to momentum transfer between a moving and a resting particle and (iv) collective entrainment considered to be a dislodgment of several particles involving momentum transfer from other particles. In some of these cases, e.g., (ii) and (iii), the use of a reference velocity seems inadequate to characterize the entrainment episode. A word of caution about the use of entrainment models based on reference velocities is henceforth issued and contextualized. In the case of disentrainment, a reference velocity seems to constitute a better descriptor of the observed behaviour. The scatter in the observed values seems to express the contribution of bed micro-topography. All particles were found to experience frictional contacts with the resting bed surface particles, but some particles were stopped more abruptly due to the presence of an obstacle along their path. Most disentrainment of particles took place when the near-bed flow was featuring ejection events.
1. Introduction
An advanced understanding of bedload transport and fluid-sediment interactions is required to predict how the riverbed evolves in time and what patterns forms in space. Some of the classical formulae for the mean bedload transport are expressed by empirical equations derived by a judicious combination of dimensional analysis, laboratory data production, field data collection and data fitting (e.g., [1,2,3,4]). Most were cast within the bounds of theoretical principles, e.g., Bagnold [5], Engelund and Hansen [6], Rijn [7], Wiberg and Smith [8]. The particular path of understanding the physics of individual particles to formulate, employing statistical reasoning, the “laws” that govern the mean or bulk traits of the moving ensemble has been a frequently traveled one, and for which a special mention to Einstein [9,10] is due. It can be argued that Einstein’s works constituted the first research program, in the sense of Lakatos [11], addressing, in a way that is still valid today, the physics of mobile sediment boundaries, autonomously from Hydraulics and Geomorphology, and paving the way to modern Fluvial Hydraulics. At the core of his research program is the simple mass conservation statement that the mean bedload transport rate, , can be calculated as the product of the mean entrainment (or pick-up) rate, and the mean length traveled by individual particles, , if the variables that describe fluid motion and particle bed mobility and bed morphology are, in a loose sense, in equilibrium, which implies statistical stationarity over a range of time and spatial scales. Symbolically:
Einstein employed an idealization of turbulent statistics to estimate the probability of the lift force overcoming the particle weight, which was then used to formulate the mean entrainment rate. It is in this limited sense that Einstein’s (1950) bedload formula is probabilistic, while having far reaching impact over subsequent research. Engelund and Fredsoe [12], Cheng and Chiew [13], among others, refined the model for the probability of lift exceeding particle weight. Other authors proposed more complexity in the description of the geometry of the destabilized particle and corresponding hydrodynamic actions [8,14,15]. In this line of thought, Ferreira et al. [16] attempted to articulate Einstein’s Equation (1) with Paintal [17] probabilistic view that the mean bedload transport rate is determined by the probability density functions (pdfs) of the bed shear stress (representing the destabilizing effect) and of the resisting forces per unit bed area. The latter probability density expresses grain resistance as it varies with bed structure (Schmeeckle et al. [18]—resistance not futile). The pdf of flow velocities is then not considered universal but a function of the particular bed structure. The marginal probabilities of exceeding the threshold velocity for entrainment are integrated for all parameterized bed conditions. The bedload formula of Ferreira et al. [16] assumes that entrainment occurs when the destabilizing hydrodynamic actions overcome the stabilizing forces originated by particle weight and local geometry. This is incomplete, at best, as it was demonstrated beyond doubt that entrainment requires that the particle overcomes a potential energy wall, thus leaving its pocket to move unconstrained [19]. In other words, the threshold set by force or momentum equilibrium is a necessary but not sufficient condition for entrainment, a finite period of time is necessary to transfer enough momentum to the particle for actual entrainment to take place [20].
Defining the threshold for entrainment based on the work of the vertical forces to overcome the potential energy wall does not solve the fundamental problem associated with the project of deriving mean bedload transport formulas based on the probability of exceeding that threshold. The most serious caveat is very limited knowledge of the statistical representation of the hydrodynamic actions on bed particles, despite the early efforts by Chepil [21] and recent CFD-based studies (e.g., [22]). To compensate for this lack of knowledge, fluid flow velocities in the vicinity of the particle—a competent velocity, to use a classical term [23]—were used as proxies of forces, generally converted into forces through the use of lift and drag coefficients [14,16,19,24,25]. This approach overlooks the obvious difficulty that fluid momentum is passed on to the particle, in a finite time interval, through the development and adjustment of the particle boundary layer and eventual lee flow separation, generating viscous stresses and pressure imbalances that can be integrated into forces on an appropriate coordinate system. This process involves mobilizing fluid inertia, associated with boundary layer “memory”, and may have different outcomes depending on the shape of the particle [25], its geometrical arrangement and local bed micro-topography [18]. Hence, the same flow may or may not be able to entrain a sediment particle. A model based on the concept of competent velocity would capture the correct outcome only if it could estimate the correct values of the drag and lift coefficients specific for that particle and location.
This is a major concern and one of the key motivations of this study. Formulas developed from sound grain-scale physical principles and well-formulated probabilistic techniques have not been shown to perform significantly better than more ad hoc empirical approaches presumably because they also rely on parameters for which information is insufficient. In general, whether purely empirical or physically based, all mean bedload transport rate formulas may fail to predict the actual bedload rate by one order of magnitude [26], when tested with data outside their calibration range. We believe that the mean entrainment rate can be a key ingredient to construct better physically-based formulas within a probabilistic paradigm but only if the interaction of fluid flow and bed particles is better understood, which calls for a closer observation.
We also note that the mean bedload transport rate is not enough to characterize morphology and sediment dynamics of a stream, as bedload fluctuations may be more than 10-fold the mean bedload discharge rate [27]. To make matters still more complex, the time or space windows employed to, in practical terms and avoiding ergodicity issues [28], define the mean bedload transport rate may introduce bias in its value and certainly determine the quantification of the fluctuations.
Fluctuations in the value of the bedload transport rate arise from imbalance between entrainment and disentrainmemt rates. They are not necessarily caused be turbulence, as they were registered in laminar fluid flows [29], and are probably associated with positive feedback effects born out of particle-particle interactions. Ancey et al. [30] was able to retrieve this highly fluctuating behaviour (actually, non-Gaussian) by employing a birth–death–emigration–immigration Markov processes to estimate the probability of registering a given number of particles moving in a finite control volume at a given instant. In this model, the entrainment rate includes two processes: momentum transferred directly from the fluid flow or momentum imparted by moving particles. In this context, collective entrainment came to signify the process whose rate was proportional to the number of particles already in motion.
Positive feedback (increased entrainment due to collective motion) and also negative feedback (particle disentrainment due to interactions with bed), both promoting the enhancement of the magnitude of bedload fluctuations, were seen to cause clustering [31] and induce the onset of bed instability leading to the formation of sediment waves, if moving patches created by the local imbalance between entrainment and disentrainment grows beyond a critical height [32]. The motion of sediment waves and, in general, the evolution of bed morphology, for instance as a response to flow unsteadiness or in gradually varied flows, is described by Exner equation, which in “entrainment form” can be written as:
where is the local bed elevation (loosely, the elevation of the crests of the non-moving particles), and D and E are the disentrainment and the entrainment rates, respectively, and is the bed surface void fraction. The conservation of the mass of moving particles is linked to Equation (2) as:
where is the particle activity (volume of particles in motion per unit streambed area, [24,33]) and is the particle velocity.
Realistic bed forms, including longitudinal bars and dunes or anti-dunes, can be generated computationally within the numerical solution of morphological models based on the shallow-water equations and on Equations (2) and (3) but not for all formulations of wall resistance and bedload transport rates [34]. Of special significance for this text is the fact that bed forms can be generated if the actual bedload discharge rate at a given instant and location is not an injective function of the flow velocity at that instant and location [35]. This can be achieved by expressing the imbalance between E and D in Equation (2) as relaxation source term in the form where is an “equilibrium” or “saturation” bedload discharge (as opposed to the actual bedload discharge ) and is a relaxation parameter [36,37,38,39]. The issue of “non-locality” of bedload transport was formulated within a probabilistic framework by Furbish et al. [33], Bohorquez and Ancey [40], among others. Starting from a differential account of the Markovian birth–death–emigration–immigration processes or from a definition of local bedload discharge rate as in which each factor can be decomposed into an average and a fluctuating part, the main result is that the mean bedload transport rate can be expressed as:
where is a particle diffusivity. The second term in the left hand side of Equation (4) is a diffusive bedload contribution and guaranties “non-locality”, i.e., that the mean bedload discharge is not a simple function of the ensemble averaged local flow velocity.
To emphasise this point of non-locality, Furbish et al. [28] argue that admitting a fluctuating component of particle velocity amounts to admitting that only non-local transport exists, i.e., “particles moving across a surface at any instant in time (...) started their motions ‘nonlocally’ from many positions and previous instances”. While it is certainly true that the morphological consequences of the imbalance between entrainment and disentrainment are seen only down the stream, there is a fundamental issue of “locality” to be addressed—the fact that one needs to close the source term , which should involve (or may benefit from involving) considerations on the local fluid flow field and particle motion and how momentum is imparted to particles resulting in entrainment. This configures the second main concern that motivates this research—the condition of possibility to express the imbalance between E and D based on the local flow field and, in particular, based on a competent velocity.
In this respect, we note that entrainment was subjected to a great deal of attention while disentrainment was the object of very little dedicated research. To the best of our knowledge, the most complete experimental description of disentrainment processes can be found in Cecchetto et al. [41]. They investigated experimentally the role of both the flow field and the bed arrangement in the disentrainment of bedload particles and found that lower values of instantaneous longitudinal velocities were linked to disentrainment events. Investigating the disposition of resting sediments over an area, they found that the depositional processes are driven by bed roughness and that deposited grains were characterized by a non-random spatial distribution. Given that the measurements of Cecchetto et al. [41] were taken at more than particle diameters above the bed, it may be difficult to formulate a link between local flow velocity and disentrainment. Yet, while one can develop a formula for the mean bedload transport rate based on the assumption [10], to deal with unsteady flows or complex stream morphologies, it is necessary to close both E and D in Equation (2).
Acknowledging this state of affairs, we propose a step back to observe actual entrainment and disentrainment events of sediment particles in turbulent open-channel flows over cohesionless granular beds. We believe this observation constitutes a preliminary step in the formulation of a theory that may or may not involve a reference velocity to express the deterministic threshold of entrainment or disentrainment. We propose to conduct this observation in a transport system purged of many accessory complexity (at this stage)—a “minimal system”, in the sense of Ancey [42], that features spherical smooth particles arranged in a lattice, while at rest in the bed, in a prismatic channel that is wide enough to render negligible the effects of lateral walls and secondary currents. The observation protocol was designed in order to be the least intrusive as possible. We do not place particles in controlled exposed positions. Instead, we define an observation window, we observe the flow as imaged by a laser sheet and record its configuration every time an entrainment or disentrainment event occurs. We thus seek to collect as much information as possible from events that spontaneously take place in the observation window. In the case of entrainment, we obtained databases in generalized transport conditions which is relatively rare, compared to those obtained under incipient motion conditions (in the sense of Kramer [43]) or obtained with a test particle in an otherwise fixed bed. Our databases possess the advantage of allowing for the discussion of the interactions among moving particles. Furthermore, for the objective of studying disentrainment, our observation protocol is particularly adequate. In this sense, for both entrainment and disentrainment, the observations allow for a unique discussion of the merits and difficulties of employing a reference velocity as a proxy for hydrodynamic force or power.
We thus aim at providing further insights on the dynamics of fluid-particle and particle-particle interactions at entrainment and disentrainment and to polemicize the use of a reference velocity to be used as a proxy for hydrodynamic actions responsible for entrainment or disentrainment. It must be stated that the goal is not to infer a general model of particle entrainment/disentrainment, but rather to have a more complete picture of the fluid-particle and particle-particle interactions naturally occurring in the flume’s bed.
The paper is organized as follows: Section 2 is dedicated to the description of the experimental setup and procedures. In Section 3 the concept of reference velocity is discussed and two approaches to define it are presented. In Section 4 the obtained experimental results are presented with focus on (i) the evaluation of the critical assessment of a reference velocity as a proxy of hydrodynamic actions to describe entrainment events, on (ii) the detailed discussion of 4 different types of entrainment events and on (iii) the reporting and analysing of disentrainment events. The paper is closed by a set of main conclusions, Section 5.
2. Experimental Setup
The experimental work was carried out in a m long and m wide glass-sided flume at the Laboratory of Hydraulics and Environment of Instituto Superior Técnico, Lisbon. The initial 7 m long fixed-bed reach comprised m of large boulders (50 mm average diameter), m of smooth bottom (PVC) and m of one layer of glued spherical glass beads (5.0 mm diameter); 4 m of the remaining flume were filled with 5 layers of mm diameter glass beads, with density , packed (with some vibration) to a void fraction of , typical of random packing. Figure 1 depicts the packed loose bed.
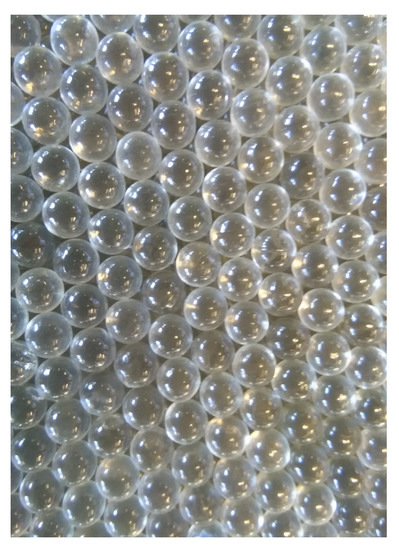
Figure 1.
Example of the loose bed glass spherical particles with 5 mm diameter.
Water and sediments were recirculated through independent circuits. At the flume outlet sediment particles are collected and recirculated through a dedicated pumping circuit. This dedicated circuit transported the sediment particles from the flume outlet back to the flume upstream, dropping the sediments through the free surface at the section measured from the water inlet. To measure the solid flow rate, a particle counter device capable of measuring bedload discharges was installed at the downstream end of the mobile bed reach. Details on the particle counter device (mechanical system and firmware), included device’s installation and validation, can be consulted in Mendes et al. [44].
A 2-D component Particle Image Velocimetry (PIV) system was employed both for a general characterization of the flow field of the experimental tests (obtaining longitudinal u and vertical w instantaneous flow velocities) and for the spatial and temporal definition of the flow velocities associated with entrainment and disentrainment events. In the former case, the observation window covered the entire flow depth and a length comprises between 6 cm and 12 cm, depending on the test. The duration of each observation was 5 min corresponding to 4500 image couples. The measurements were carried on the channel centerline, located at cm from the channel window. An extra test PIV acquisition run with a duration of 20 min was carried out to compute statistics of possible large scale velocity fluctuations.
The PIV system consisted of an 8 bit CCD camera and a double-cavity Nd-YAG laser with pulse energy of 30 mJ at wavelength of 532 nm. The system was operated at 15 Hz with a time between pulses within the range from 380 s to 500 s. Polyurethane particles with mean diameter of m in a range from m to m and specific density of 1.31 g cm were used as seeding. Dantec Dynamics’ DynamicStudio software allowed for processing image pairs with adaptive correlation algorithm. The initial interrogation area was of px, while the final was of px, with an overlap of 50%. Corresponding to a spatial resolution of mm for a field of view (FoV) of , and a resolution of about 1 mm for the wider field of view tested (). An acetate sheet was placed on the water surface to ensure optical stability and absence of laser sheet reflections. The presented experiments corresponded to the case of a nearly uniform flow. Free surface elevation and bed level were measured with 0.5 mm resolution point gage in 5 transversal sections of the flume and in 3 lateral positions per cross-section. Two experimental tests, T1 and T2, whose flow characteristics are reported in Table 1, are presented in this paper. Variables in Table 1 are the flow discharge, Q, the mean flow depth, h, the depth-averaged mean longitudinal velocity, U, the friction velocity and bed shear stress calculated from the vertical turbulent stresses profile, and , respectively. Non-dimensional hydraulic parameters are the Froude number, , Shields parameter, , Reynolds number of the mean flow, , bed Reynolds number, and the non-dimensional mean bedload discharge, , where d is the particle diameter, g is the gravitational acceleration, is the water kinematic viscosity and is the ratio between the sediment and water densities. As seen in Table 1, the experiments are conducted in generalized transport conditions.

Table 1.
Hydraulic parameters characterizing the mean flow.
The mean bedload rate was determined from the time series of particle hits which for each test, comprised more than 10 consecutive hours of observations.
Entrainment and disentrainment events were not imposed. The present approach consisted of detecting and identifying, by means of a careful visual inspection of the PIV images, individual sediment particle at entrainment and at disentrainment events, naturally occurring in the PIV field of view. The dynamic conditions of these naturally occurring events were then measured. A total count of 44 particle dislodgments (15 in test T1 and 29 in test T2) and 11 particle disentrainments (test T1). From these set of data, 6 events were chosen as example and presented in the next section.
3. The Reference Velocity
The proposed observation protocol comprised the monitoring of the turbulent flow field in proximity of the crest of the particles about to be entrained or just disentrained. There were no test particles placed or pre-arranged geometries. Observations were meant to acquire information from sediment particles that spontaneously were entrained or disentrained while located on the plane of the PIV laser sheet. A visual inspection of the PIV footage allowed to include in the analysis only particles entrained resulting in brighter shade and discard those not properly illuminated by the laser sheet.
A competent velocity for entrainment is often the key element that allows for a practical formulation of the energy balance [19] or the limit force or momentum equilibrium for one particle at destabilization conditions (e.g., [45]). This velocity is normally measured in the vicinity of the particle susceptible to be entrained. We call this a “reference flow velocity”, sampled from the particle near-field.
We decided that the reference velocity should be susceptible to be converted into a drag or lift force, through the application of suitable coefficients (e.g., [46]), and susceptible to be measured with no special or intrusive apparatus. Considering different possibilities [47], and considering we did not want to employ test particles, we opted to measure above the specific particle that we had seen being entrained or disentrained. We tested but we ruled out measuring in front of the particle, namely at the elevation of the plane of its equator, because the view to that position was frequently obstructed by other particles out of the laser plane located above the particle crest at a certain reference height.
We thus opted to measure at approximately an elevation above the crest of the entrained particle (defined in the last frame where it appears immobile) or of the disentrained particle (defined at the first frame where it appeared immobile), as seen in Figure 2. This elevation can be considered to be a compromise between the quality of the data and the adequateness to represent the near-particle flow. Defining the reference velocity nearer the crest of the particle would make it susceptible to bad data, as seeding depletion, lower velocities and reflections from bed particles affect negatively the PIV signal. Measuring further above might reduce its explanatory value as the shear rate of the double-average longitudinal velocity is very high in this near-bed region. As an example, had we measured at 8 mm above the crests, as in Cecchetto et al. [41], the double averaged velocity would be 37% larger.
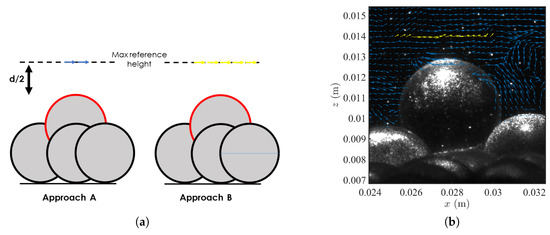
Figure 2.
(a) Scheme of the velocity vectors considered in the spatial average in approach A and B; velocity vectors averaged in approach A are reported in blue, while those averaged in approach B in yellow. (b) PIV image with velocity vectors superimposed; velocity vectors averaged in approach B are reported in yellow.
We underline that the reference elevation was not fixed. We stand by this option as it is makes the reference velocity comparable among entrainment events and it is not difficult to enforce, either in post-processing PIV data or in tests with pre-arranged geometries. We note that we opted to use the PIV data closer to the elevation above the crest of the particle (but always below that elevation) instead of interpolating the data at exactly the plane . This again is a compromise imposed by the (sometimes poor) quality of the data at lower interrogation area rows (Figure 2). Finally, we opted to consider that the reference velocity is a time average of the instantaneous velocities acquired across the entrainment or disentrainment event. This average involves the last observation in which the particle was immobile/moving and the first two for which it was moving/immobile, respectively for entrainment/disentrainment. Given the PIV time rate (15 Hz) this means that the reference time window is s.
Reference flow velocities at the specified reference elevation were computed by two different methods:
- Approach A: as the spatial average between the two velocity vectors in adjacent interrogation areas located above the top-center of the particle.
- Approach B: as the spatial average of velocity vectors of all interrogation windows directly above the particle (spanning its diameter) located at the same reference height of approach A.
A scheme of the two approaches is depicted in Figure 2a, while Figure 2b depicts a PIV image with velocity vectors superimposed: instantaneous velocity vectors are represented in blue, whereas those averaged in approach B are reported in yellow.
The reference velocity vector has two orthogonal components in the wall-normal and in the along-wall directions. We use the later to serve as proxy for hydrodynamic forces. However, it may be relevant to know what kind of contribution to the shear stress is associated with the measured reference velocity and it is surely relevant to understand specific events whether the motion is characterized by velocities higher or lower than the double-averaged velocity above the plane of the crests. For that purpose, we employed a quadrant analysis to jointly discuss and , the fluctuations of the along-wall and wall-normal components of the reference velocity. We employ the usual terms Nakagawa and Nezu [48] of outward interaction (, , ), ejection (, , ), inward interaction (, , ) and sweep (, , ). Please note that since the reference velocity is a space-time average at the scale of the particle, the contributions to the space-averaged instantaneous shear stress are only approximate.
As for the double-averaged velocity, we consider the intrinsic space-time average of the flow field at an elevation equal to above the initial spatially averaged bed particles crest level, as seen in the PIV calibration images. The intrinsic average was obtained from the superficial average by dividing by the the space-time porosity , representing the ratio of fluid to total averaging domain [49]:
where and are respectively the averaging period and the averaging domain, and if the region is occupied with fluid and , otherwise. Please note that the reference velocities for entrainment and disentrainment are not acquired necessarily at the elevation of the double-averaged velocity, as it depends on the elevation of initial/resting position of the crest of the entrained/disentrained particle. The difference, however, is small and since the bed surface did not develop bedforms and remained essentially planar.
4. Observations
4.1. The Big Picture
To characterize possible turbulent large scales responsible for relevant fluctuations of particle activity, we measured flow velocities for 20 min in the central plane of the channel. Focusing on near-bed processes, we averaged the velocities registered at an elevation of above the crests of the initial bed and we averaged in space over the length of the PIV FoV (about 10 cm). We further averaged these velocities on intervals of 1 s, for reasons that will be clear next. A times series of this space-time filtered velocity is shown in Figure 3.
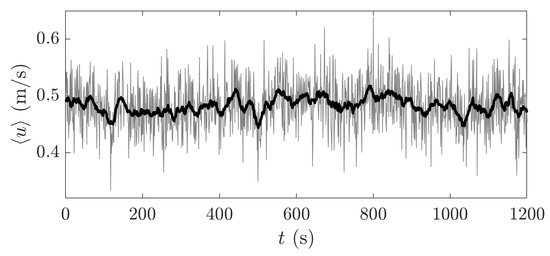
Figure 3.
Velocity time seriesfor test T2 at above the crests of the initial bed averaged in space over the length of the PIV FoV.
The bedload discharge meter described in Mendes et al. [44] was employed to measure a long time series of bedload discharge rates. As it is a particle counter, we opted to group counts registered in a 1 s interval. This justifies the choice of the averaging window employed on the velocity time series. The resulting time series of bedload discharge can be observed in Figure 4. The time average applied to these measurements work as a low-pass filter, keeping only large-scale fluctuations. The additional spatial average applied to the velocity measurements was meant to compensate for particle diffusion between the location of the measurements and the location of the pressurized boxes where bedload was measured. A moving-average filter with a window of 21 s was then employed and its results superimposed to the previous time series, just to guide the eye and underline the main fluctuations in Figure 3 and Figure 4.
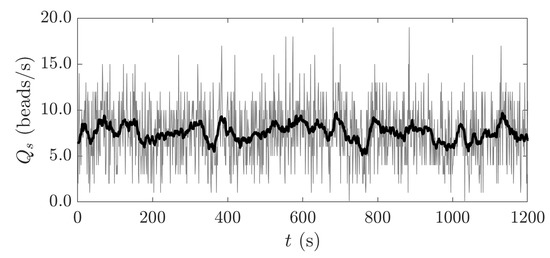
Figure 4.
Sediment discharge time series measured during test T2 at the channel centerline with the bedload discharge meter described in Mendes et al. [44].
Observing Figure 3 it is evident that this low-pass filtered velocity exhibits periods where it consistently remains above the local average for several seconds and also below the average for several seconds. We do not know the origin of these very large fluctuations (we do not know, in particular, if they are very large-scale of motion (VLSM), in the sense of Kim and Adrian [50]).
Given its time permanence, we did expect to see an increase or a decrease in particle activity (and bedload transport rates) associated with these fluctuations. Observing Figure 4, we rest assured that these large scale fluctuations are also present in the bedload time series. These measurements were not synchronous, so we could not measure the time correlation, but a simple inspection reveals that both series exhibit sustained periods of lower than average and higher than average values, connected by equally long, albeit intermittent, transitions.
Therefore, the overall picture is that there is a general agreement between flow momentum and particle activity. That is fully in agreement with empirical formulas that were derived from this principle [51].
A closer look reveals that the fluctuations of the bedload discharge are much larger than those of the filtered velocity. This, again, is in accordance with what is expected from the bulk behaviour of water streams, as the bedload transport rate is a non-linear function of the of fluid flow variables. For instance if the particle rate was formulated as a function of the third power of the flow velocity, the observed maximum fluctuations of 35% on the flow velocity would be translated into 140% fluctuations of bedload, which matches reasonably well the observed maximum fluctuations of the latter.
However, analysing the probability distribution functions (pdf) of these low-pass filtered signals—Figure 5 for the case of velocities and Figure 6 for the case of the bedload transport rate in the central 10 cm, ,—one finds a fundamental difference. The velocity pdf is symmetrical, while the pdf of the bedload is (slightly) positively skewed with a longer tail events much larger than the mean.
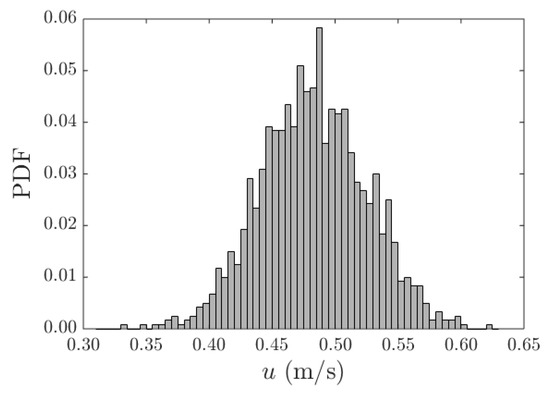
Figure 5.
Normalized histogram of the lowpass filtered longitudinal velocity obtained at the reference elevation in test T2.
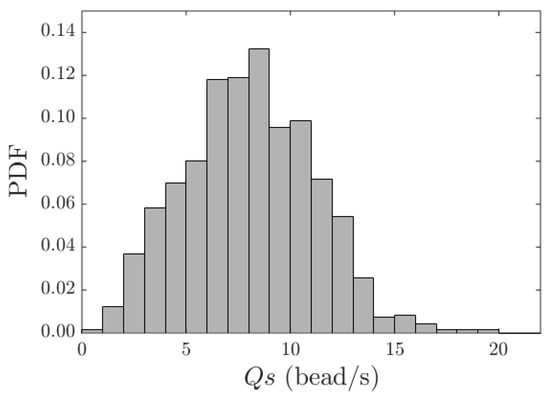
Figure 6.
Normalized histogram of the bedload discharge, , in particles per second, registered, in test T2, across the central 10 cm of the flume.
This can be a result of the positive feedback arising from collective entrainment [30]. Higher near-bed velocities induce a stronger particle activity which, in turn, induces even larger activity by direct momentum transfer among particles, amplified local turbulence or increased exposure. Perhaps the negative feedback envisaged by Cecchetto et al. [31], as particles seem to be stopped where other particles the have stopped before, forming clusters, is not so effective.
In any case, should positive feedback be relevant, it may constitute a difficulty for models that employ a competent velocity as a proxy for force or energy thresholds of entrainment. It may be the case that, when particle activity is larger, a relevant proportion of moving particles had been entrained by processes other than momentum transfer from the fluid.
We note, however, that there is no strong empirical evidence that allows for a quantification of the modes of collective entrainment. Simultaneous entrainment of several particles, as a result of sweep events, has been reported in the literature for several decades now (e.g., [52,53,54]). Enhanced motion due to particle-particle interactions has also been well documented [30,55], but an empirical formulation of the rate of collective entrainmemt, as a linear function of particle activity or otherwise, has not been achieved yet. This calls for a closer observation of particle entrainment and, given that bedload fluctuations are caused by the imbalance between entrainment and disentrainment rates, a direct observation of disentrainment becomes also necessary. We offer a contribution, along these lines, in the next section.
4.2. Local Observations of Entrainment
The first question to be answered with our observations concerns the magnitude of the competent velocity for entrainment, namely if entrainment is associated with exceptional events only or it may occur at relatively mild velocities. Figure 7 and Figure 8 depicts the reference velocity fluctuations and associated with particle entrainment event (red dots) for tests T1 and T2. Figure 7a,b are relative to approaches A and B, respectively, applied to test T1, and Figure 8a,b are the same, applied to test T2. In the background of these quadrant plots are the contour lines of the two-dimensional histogram of temporal fluctuations of the spatially averaged velocity around the double-averaged velocity at the initial reference height. To compute the double-averaged velocity, 2,729,484 data points were considered in test T1 and 3,917,061 in test T2.
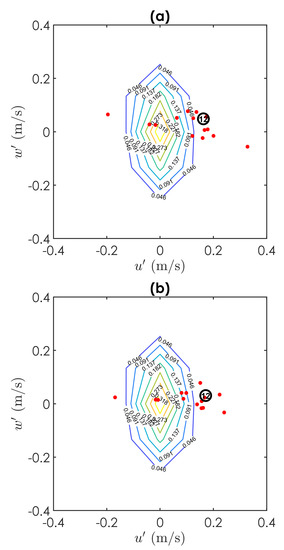
Figure 7.
Reference velocity fluctuations (red dots) characterizing: (a) test T1-Approach A; (b) test T1-Approach B. Contour lines represent the 2D histogram of the velocity time fluctuations at the reference height for the entire set of PIV images.
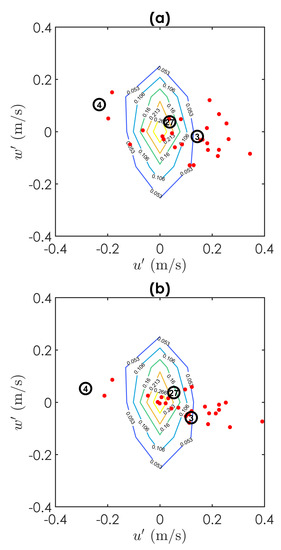
Figure 8.
Reference velocity fluctuations (red dots) characterizing: (a) test T2-Approach A; (b) test T2-Approach B. Contour lines represent the 2D histogram of the velocity time fluctuations at the reference height for the entire set of PIV images.
Entrainment occurs at a wide range of reference flow velocities, but a prevalence of sweep and outward interactions (longitudinal velocities larger than the mean) can be observed for both tests. Some particles were entrained even in the presence of negative values of longitudinal velocity, i.e., they were entrained by flows with velocities lower than the mean flow. However, in this case, fluctuations associated with negative vertical fluctuations are rare. Most of the recorded lower-than-mean flow entrainments were associated with ejections.
For identical particles with the same skin roughness, geometry of contacts in the lee side and pivoting axis, as illustrated in Cases 1 and 2 of Figure 9, the forces promoting their destabilization are the same [16]. In that case, differences in the competent velocity for entrainment can only be due to different drag and lift coefficients, due to different boundary layer development histories, different exposures (Cases 1, 2 and 4 of Figure 9) or different persistence of the hydrodynamic actions. In this latter case, Diplas et al. [20], Valyrakis et al. [56], among others, argued that the presence of peak values in the fluctuating hydrodynamic actions is not a sufficient condition for particle entrainment: grain removal is closely related with the duration of energetic near-bed turbulent events, namely the impulse of hydrodynamic forces (the momentum variation). Exceeding a certain critical magnitude value is not enough to promote entrainment. Sufficient momentum transfer is needed to remove the particle out of its initial bed location, or as Valyrakis et al. [19] formulates it, the work of the hydrodynamic forces has to be sufficiently high to endow the particle with enough potential energy to place it above the crest of the downstream obstacle. In this case, an adequate parameterization of the local bed micro-topography, including the geometry (and the spatial probability distribution) of the downstream obstacles would still allow for using a competent velocity as a proxy of a threshold of hydrodynamic actions. Particle exposure, here defined as the difference between the height of the crest of the neighbor particle located upstream and the crest of the particle about to be entrained (Figure 9), is evidently a major influence for particle entrainment. The same near-field fluid flow may be effective or ineffective for entrainment depending on the exposed area available to effective hydrodynamic actions. The problem, however, can be more complex, since particles with the same exposure (Figure 9 cases 1 and 3) may develop quite different pressure differences between the front and lee sides, and hence different pressure drag contributions, depending on the influence of the geometry of the downstream neighbors on boundary layer separation. A major difference between Cases 1 and 3 of Figure 9 is evidently the downstream support plane and pivoting axis but that can be taken into account by an adequate formulation of the geometry in the force (or their work) or momentum balance at threshold conditions. The variation of the lift or drag coefficient is a more complex matter for which available information is still scarce. In this respect, the work of Dwivedi et al. [46] is a major step forward. Should these advances on the parameterization of lift and drag coefficients be able to be integrated in threshold models, the case for the use of a competent velocity for entrainment is strengthened.
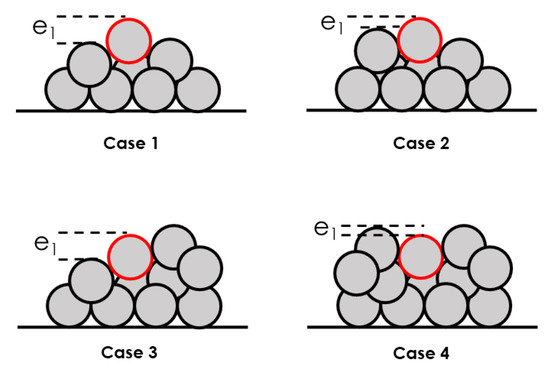
Figure 9.
Influence of particle bed topography on particle entrainment. Four cases are reported here, in which the particle at entrainment is identified by red contours and represents the particle exposure: in case (1) the particle at entrainment is characterized by greater exposure with respect to case (2); in case (3) the exposure is the same as in case (1), but the presence of an obstacle downstream hampers particle entrainment—for the same particle-exposure and fluid pressure a larger impulse is needed to overcome the potential energy wall created by the protruding downstream particle. Finally, at case (4), the particle has a negative exposure and a protruding downstream particle; it will require a strong lift force, sustained in time so that its work is able to overcome the potential energy wall.
Yet more subtle is the effect of the history of boundary layer development on individual particles. It may be the case that identical near-bed flows acting on identically exposed particles produce different hydrodynamic actions, depending on the past of the flow and local geometry. For instance, a particle might find itself exposed, e.g., because of the removal of an upstream neighbor, inducing a very large pressure imbalance and, ultimately, entrained. A particle exposed similarly and experiencing a gradual build-up of fluid velocity might not experience such a strong pressure imbalance, as the lee side flow might have time to adjust, and hence the particle would remain in the bed. This is merely speculative, we do not have data to quantify this possibility, but we believe it is an argument to keep in mind when discussing the possibility of finding an adequate reference velocity to serve as competent velocity for entrainment.
Should our choice of reference velocity be adequate to express the hydrodynamic actions registered at entrainment, the exposure observed at the instant of entrainment should match the exposure calculated by a theoretical model with that reference velocity as competent velocity. A visual inspection of the PIV images enabled computing the particle exposure as the difference between the entrained particle crest level before entrainment and the crest level of the closer particle located immediately upstream for all the sample of entrainment events. The model by Ferreira et al. [16] was employed to determine the theoretical exposure, assuming that the measured reference velocity is the theoretical competent velocity for entrainment , i.e., the velocity that expresses a threshold condition for particle stability, given local geometry and drag and lift coefficients. For spherical particles in nearly horizontal streams, the model equations are
for a force threshold (sliding instability), or
for a moment threshold (rolling instability). Variables and parameters in Equations (6) and (7) are , the exposure coefficient (defined above), , the submerged particle specific gravity, g the acceleration of gravity, d, the particle diameter, and , lift and drag coefficients, respectively, , the particle’s angle of support, the angle expressing skin roughness and , the angle between the vertical plane and the plane that encompasses the centre of mass of the particle and the pivoting axis.
In Figure 10a,b, for tests T1 and T2, respectively, the computed and measured exposure coefficients are plotted against the ratio between longitudinal velocity fluctuations obtained with approach B and the longitudinal double-averaged velocity. For the theoretical model, the following typical values were adopted: , , and (Dwivedi et al. [46]).
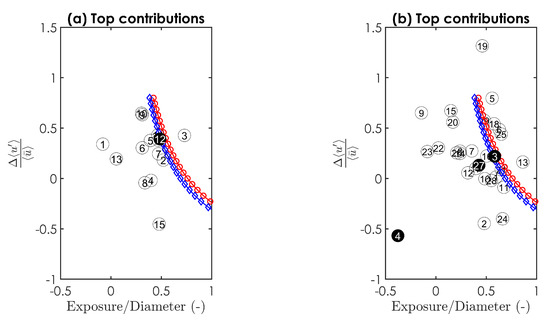
Figure 10.
Ratio between longitudinal velocity fluctuations obtained with approach B and the longitudinal double-averaged velocities (averaged first in time and then in space-along the velocity reference level) as a function of the ratio between particle exposure and particle diameter for: (a) test T1; and (b) test T2. Each entrainment event corresponds to a numbered open circle. Curves corresponding to the theoretical exposure model proposed by Ferreira et al. [16] are preented as red circles model for sliding instability (Equation (6)) and as blue diamonds for rolling instability (Equation (7)).
Figure 10 shows that there is little agreement between the derived and the measured exposure coefficients. There should be a very slight positive correlation as, for this sample, the expected value of is lower when the exposure is very high. This means that, for the entrainment events detected in this study, the reference velocity defined as we did, is not useful to express threshold conditions and thus integrate bedload models based on assigning a probability to this threshold.
In our opinion, this line of research should not be abandoned but extra efforts will be needed to:
- i.
- inspect the performance of other definitions of reference velocity.
- ii.
- place resources on the experimental characterization of drag and lift on sediment particles, taking into account local unsteadiness brought about by turbulence; the study of the inertia of the boundary layer should deserve some attention as this may have a strong impact on lift and drag coefficients.
- iii.
- investigate how representative is entrainment due to fluid-particle momentum transfer, relatively to other forms of imparting momentum to bed particles, e.g., by particle-particle interactions.
- iv.
- investigate in what other ways the flow field can be modified in the vicinity of the entrained bed particle without affecting the reference velocity measured above it.
In what concerns items iii. and iv., observations of the current database may help in devising future research paths. In particular, our observations allow for a closer scrutiny of each entrainment event, including the history of near-bed flow field and the typology of the entrainment, namely if occurred as a singular or a collective event [30]. A discussion of representative observations is presented in the next section.
4.3. Representative Types of Particle Entrainment
We consider that most entrainment events in our database could be grouped in four representative types:
- A
- singular events associated with non-locally generated hydrodynamic actions.
- B
- singular events associated with locally generated hydrodynamic actions.
- C
- collective entrainment events due to particle-particle momentum transfer collision.
- D
- collective entrainment associated with strong fluid flow events.
A description of specific examples is presented next.
4.3.1. Type A: Non-Local Hydrodynamic Actions
The first type considered responsible for particle entrainment has long been discussed in the literature, as already pointed out in Section 1. The extreme values of fluctuating turbulent forces are a key consideration in understanding particle entrainment. As seen before, particles can be entrained by a wide spectrum of hydrodynamic forces. Should entrainment occur at low velocities, the role played by the bed topography is surely significant. An example of particle dislodgement due to hydrodynamic forces is reported in Figure 11. This specific entrainment event belongs to Test T1 and is marked in Figure 7a,b with number 12.

Figure 11.
Particle entrained because of hydrodynamic forces (Type A; particle 12, Test T1). Sequence of three PIV images respectively showing (from (a–c)): at time (2 time instants, corresponding to s, before entrainment) the bright particle located in the centre of the image is at rest in the bed; at time (1 time instant, corresponding to s, before entrainment) the particle is still at rest in the bed; at time the particle has already left the bed and is rolling. (For clarity only 1 out of 2 vectors are depicted.)
Particle entrainment occurred with positive streamwise and vertical velocity fluctuations, respectively m s and m s and m s and m s, corresponding with outward interaction, although evidence of the presence of a sweep event in vicinity of the particle is observed in Figure 12, where the instantaneous Reynolds shear stresses, , computed for the same sequence of images of Figure 11 are reported.

Figure 12.
Instantaneous Reynolds shear stress maps with vectors superimposed representing velocity fluctuations obtained for Type A; (particle 12, Test T1) for the sequence of three PIV images reported in Figure 11. The sediment bed is masked in white. (For clarity only 1 out of 2 vectors are depicted.) (a) At time a sweep event ( and ), is clearly identifiable in blue on the middle/top and left side of the image, is approaching. The remaining of that is observed in the next instant (b) on the upstream side of the particle about to be dislodged. In the next instant (c) the particle has already been dislodged and parcels of fluid characterized by intense Reynolds stresses (in blue) at the location previously occupied by the particle.
An accurate inspection of all three plots shown in Figure 12, allowed us to reconstruct the history of this specific entrainment event. At time a sweep event ( and ), is clearly identifiable in blue on the middle/top and left side of the image, is approaching. The remaining of that is observed in the next instant on the upstream side of the particle about to be dislodged.
Meanwhile a major recirculation area of negative Reynolds shear stresses is produced just downstream of the particle, resulting in dissipation of turbulent kinetic energy. On top of the particle positive streamwise and vertical velocity fluctuations are observed, as mentioned above. Although the turbulent structures seem to be not overly strong, particle entrainment is facilitated by the significant particle exposure (one particle radius, as detailed in Figure 10a) together with the configuration of the downstream neighbor. In the next instant the particle has already been dislodged and parcels of fluid characterized by intense Reynolds stresses (in blue) at the location previously occupied by the particle. At the instant before entrainment, as sweep approaches, the pore pressure increases. A few milliseconds later, the sweep passes over the particle and the pressure on top decreases; the combination of lift and direct drag causes particle dislodgement.
4.3.2. Type B: Locally Influenced Hydrodynamic Actions
Another mechanism observed in the PIV database consists in particle entrainment promoted by other sediment particles rolling or saltating nearby the particle at rest. The trajectory of the perturbing sediments is out of the plane of the laser sheet but close enough to disturb the flow field around the particle and cause its dislodgement. This mechanism may occur at low flow velocities, as the case of the particle removed from its rest position shown in Figure 13 and characterized by positive streamwise and negative vertical velocity fluctuations ( m s and m s in approach A and m s and m s in approach B).
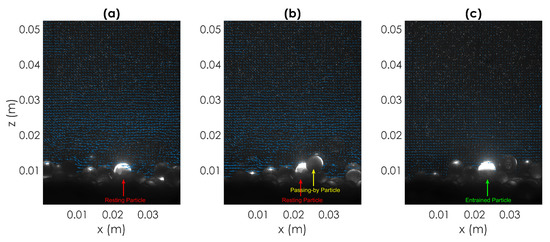
Figure 13.
Particle entrained because of particle passing-by (Type B; Particle 3, Test T2). Sequence of three PIV images respectively showing (from (a–c)): at time (2 time instants, corresponding to s, before entrainment) the bright particle located in the centre of the image is at rest in the bed; at time (1 time instant, corresponding to 0.067 s, before entrainment) the particle is still at rest in the bed and a particle perturbating the flow field passes nearby; at time the particle starts its entrainment. (For clarity only 1 out of 2 vectors are depicted.)
This event belongs to Test T2 and is marked in Figure 8a,b with number 3.
As for Type A, the instantaneous Reynolds shear stresses, , computed for the same sequence of images of Figure 13 are reported in Figure 14. In this case, PIV measurements in the plan (parallel to the bed) would have enabled a better understanding of the dynamics of the flow originated by the disturbing particle since it may have been the case that the particle may have been exposed to highly asymmetric actions that displaced it laterally to a position of greater exposure.

Figure 14.
Instantaneous Reynolds shear stress maps with vectors superimposed representing velocity fluctuations obtained for Type B (Particle 3, Test T2) for the sequence of three PIV images reported in Figure 13. (For clarity only 1 out of 2 vectors are depicted.) (a) Instantaneous Reynolds stresses around particle at rest. (b) Flow disturbed by passing-by particle. (c) Instantaneous Reynolds stresses at the moment particle at rest is entrained.
More information can be provided analysing the flow velocity fluctuations obtained as the difference between instantaneous velocities and spatial average velocity (Figure 15) within the area represented in Figure 14 and corresponding instantaneous Reynolds shear stresses.
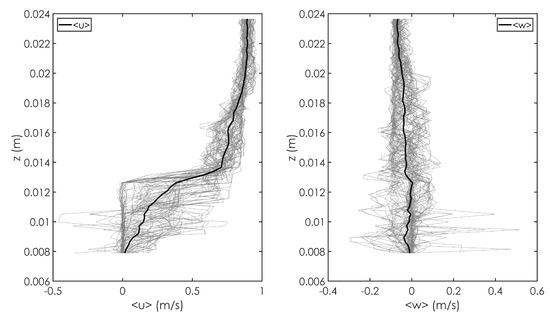
Figure 15.
Instantaneous velocity profiles used to compute the spatial mean velocity (solid black line) in the region of interest (Figure 14).
4.3.3. Type C: Collective Entrainment Due to Particle Collision
The PIV data set includes several cases of particle dislodgement characterized by direct collisions between moving particles and particles at rest leading to the destabilization of the latter, especially in Test T2 where the bedload rate is much more significant.
This mechanism was already identified experimentally and in field surveys by Drake et al. [57], Böhm et al. [58] and investigated by Ancey et al. [30], who defined the entrainment of particles from the bed as the contribution of two processes: singular entrainment (at rate ); collective entrainment, for instance associated with momentum of moving particles and transferred to resting particles (at rate ).
Particle marked with number 27 in Figure 8a,b is considered hereafter as example of collective entrainment and depicted in Figure 16.
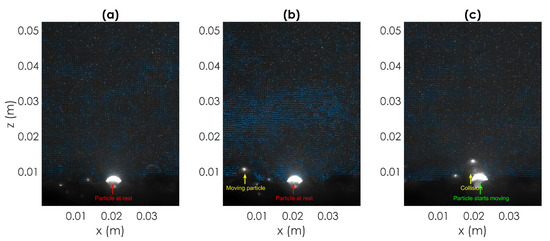
Figure 16.
Particle entrained because of collective entrainment (Type C, Particle 27, Test T2). Sequence of three PIV images respectively showing (from (a–c)): at time (2 time instants, corresponding to s, before entrainment) the bright particle located in the center of the image is at rest in the bed; at time (1 time instant, corresponding to s, before entrainment) the particle is still at rest in the bed and another particle is approaching; at time + 2t the travelling particle collides with the particle at rest; the bright particle starts its entrainment. (For clarity only 1 out of 2 vectors are depicted.)
From the instantaneous Reynolds shear stresses, , computed for the same sequence of images of Figure 16 and reported in Figure 17 it can be observed that no particular hydrodynamic event contributes to mobilise the particle and therefore the momentum imparted by the colliding particle seems the only cause responsible for particle entrainment. This means that the positive streamwise and vertical velocity fluctuations associated with this specific entrainment event shown in Figure 8c,d would not be sufficiently effective to pick up the particle without the extra momentum transmitted by sediment impact.

Figure 17.
Instantaneous Reynolds shear stress maps with vectors superimposed representing velocity fluctuations obtained for Type C (Particle 27, Test T2) for the sequence of three PIV images reported in Figure 16. (For clarity only 1 out of 2 vectors are depicted.) (a) Instantaneous Reynolds stresses and particle at rest. (b) Instantaneous Reynolds stresses with particle at rest while moving particle is approaching. (c) Instantaneous Reynolds stresses during particles’ collision.
4.3.4. Type D: Collective Entrainment Associated to Strong Fluid Flow Events
Although both types C and D are in this text denoted by collective entrainment, in the former the entrainment regards just a single particle and is generated by particle collisions, while in the latter dislodgement consists in simultaneous pickup of several sediments-characterized by a time scale varying between 0.067 s and 0.2 s (corresponding respectively with 1/15 s and 3/15 s) and occurs mainly because of two different causes:
- Presence of high-speed gust mobilizing more than one particle at the same time.
- Collisions between travelling particles and sediments at rest promoting the motion of the latter.
The entrainment of particle 4 of Test T2 belongs to the second situation. In Figure 18 the sequence of images representing this mechanism is reported, as well as the instantaneous Reynolds shear stresses, , in Figure 19.
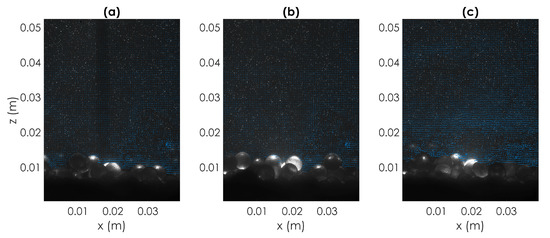
Figure 18.
Particle entrained because of collective entrainment (Type D, particle 4, Test T2). Sequence of three PIV images respectively showing (from (a–c)): at time (2 time instants, corresponding to 0.1333 s, before entrainment) the bright particle located in the centre of the image is at rest in the bed (partially hidden by another particle); at time (1 time instant, corresponding to s, before entrainment) the particle is still at rest in the bed and travelling particles are about to collide with sediments in the bed; at time several particles, included the bright one, are mobilized because of the impact. (For clarity only 1 out of 2 vectors are depicted.)

Figure 19.
Instantaneous Reynolds shear stress maps with vectors superimposed representing velocity fluctuations obtained for Type D (particle 4, Test T2) for the sequence of three PIV images reported in Figure 18. (For clarity only 1 out of 2 vectors are depicted.) (a) Initial instantaneous Reynolds stresses. A ejection event is observed close to the particle at rest. (b) Induced instantaneous Reynolds stresses by passing particles. (c) Several particles are mobilized and corresponding instantaneous Reynolds stresses.
In fact, the entrainment of particle 4 is related to ejections, which are negative longitudinal velocity fluctuations ( with the first approach and with the second one) and positive vertical velocity fluctuations (respectively and ).
4.4. Disentrainment: Data Analysis and Results
At present little is known about causes and mechanics related with this disentrainment of bedload particles phenomenon. Disentrainment events are much more difficult to be identified either in field or in laboratory environments. In the present work, a visual inspection of the PIV footage allowed to select a sample of 11 sediment particles of test T1 going to deposit into the bed and analyse the flow field in their vicinity. The flow field related with disentrainment is assumed above the particle about to rest, namely the velocity vectors of the last frame before disentrainment in accordance with the second approach proposed in Section 4.3 for the case of sediment entrainment.
The quadrant plot obtained for disentrainment is depicted in Figure 20, where the instantaneous velocity fluctuations associated with particle disentrainment are represented with red dots.
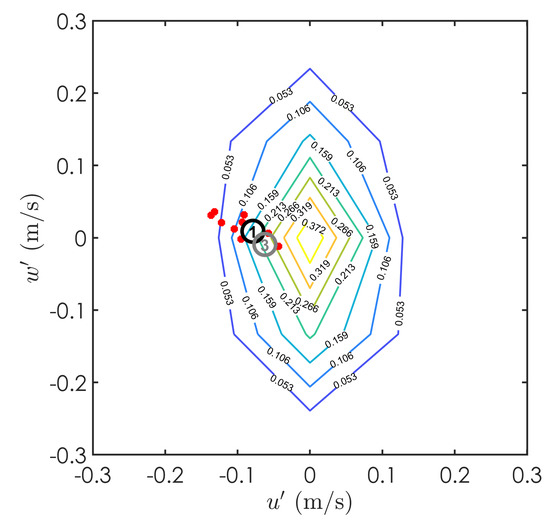
Figure 20.
Instantaneous velocity fluctuations characterizing test T1—Approach B. Red dots represent the turbulent flow field associated with deposited particles. Disentrainment events discussed later are marked with numbered open circles: particle 1 (black) and particle 3 (gray).
Negative values of instantaneous velocity fluctuations in streamwise direction () are observed for all the observed events, while a larger range of turbulent velocities (positive and negative) can be noted for the component, corresponding to ejections and inward interactions. Ejections seem to be the prevalent flow state when disentrainment occurs. Only three of the registered events ocurred during inward interactions. This observation should be generalised with some care since the size of database is relatively small.
Relatively to entrainment, disentrainment events occur at al smaller range of along-wall velocities. Disentrainment seems to be much influenced by bed topography, as can be noted in the PIV footage: sediments in motion are more likely to become trapped within pockets if bed depressions are found along their path or if obstacles (bed particles particularly exposed) are responsible for their stop. This is in line with experimental findings of Cecchetto et al. [41].
Two disentrainment events among the sample of particles going at rest are hereafter analyzed. The sequence of images representing the disentrainment and associated instantaneous Reynolds stresses are reported in Figure 21, Figure 22, Figure 23 and Figure 24, respectively for particle 1 (Figure 21 and Figure 22) and particle 3 (Figure 23 and Figure 24), whose velocity fluctuations are marked in Figure 20.

Figure 21.
Particle deposited because of hydrodynamic forces (particle 1, Test T1). Sequence of three PIV images respectively showing (From (a–c)): at time (2 time instants, corresponding to s, before disentrainment) the particle is in motion within the field of view; at time (1 time instant, corresponding to s, before disentrainment) the particle is approaching its rest location; at time the particle is at rest in the bed.

Figure 22.
Instantaneous Reynolds shear stress maps with vectors superimposed representing velocity fluctuations obtained for disentrainment event number 1-Test T1 for the sequence of three PIV images reported in Figure 21. (a) the moving particle starts decelerating and a ejection event is observed downstream of the particle location. (b) The ejection event has passed and particle approaches its rest locatin. (c) The particle is at rest.

Figure 23.
Particle deposited because of the presence of a cluster (particle 3, Test T1). Sequence of three PIV images respectively showing (From (a–c)): at time (2 time instants, corresponding to s, before disentrainment) the particle is in motion within the field of view; at time (1 time instant, corresponding to s, before disentrainment) the particle is approaching its rest location; at time the particle is at rest in the bed.(For clarity only 1 out of 2 vectors are depicted.)

Figure 24.
Instantaneous Reynolds shear stress maps with vectors superimposed representing velocity fluctuations obtained for disentrainment event number 3-Test T1 for the sequence of three PIV images reported in Figure 23. (For clarity only 1 out of 2 vectors are depicted.) (a) The moving particle enters the FoV. (b) As it aproaches a cluster of particles the instantaneous Reynolds shear stresse are significantly higher, as seen by the blue area close to the cluster. Ejection events are observed. (c) The moving particle stops due to the obstacle.
In the first case the particle in motion begins a deceleration phase until its complete rest due to the frictional contact with sediments constituting the bed. Particle disentrainment occurs when the inertial forces, that are momentum imparted by the fluid, pressure drag (depending on the relative velocity between particle and fluid) and viscous forces, are overcome by frictional contacts. Figure 22 shows the instantaneous Reynolds shear stresses next to particle 1 respectively at two and one instant before disentrainment (left and centre plots) and at the instant of rest (right plot). The fluctuation of the streamwise velocity is negative and the wall-normal is positive. This is thus a representative case of disentrainment during ejection, the most frequent state of near-bed fluid motion associated to disentrainment in our database.
In the second case the particle goes to rest occurs because of the presence of another sediment located along its path and enough exposed to constitute a barrier to the motion of particle 3, as observed in Figure 23. The obstacle provides force against motion and particle acceleration becomes abruptly to zero. Inward interaction is associated also with this event. Instantaneous Reynolds shear stresses are reported in Figure 24.
Disentrainment is associated with lower values of streamwise velocity fluctuations, although a key role in the process is played by the bed topography. Hydrodynamic forces alone do not determine the disentrainment of sediments in the bed. Local barriers or bed depressions or friction between rolling particles and sediment bed are the main causes related with this mechanism.
5. Conclusions
The experimental analysis reported in the present article aimed to investigate the kinematics of entrainment and disentrainment of uniform granular media subjected to a turbulent open-channel flow. Special consideration was given to the mechanisms promoting those events, as fluid-particle interactions, sediment collisions and the influence of the natural bed particle morphology.
The experimental program was designed to not compromise between fundamental features of sediment particles taking into account of the natural morphology of the sediment bed. The PIV technique was employed to characterize the longitudinal and vertical instantaneous turbulent fluctuations associated with sediment dislodgement and disentrainment and to determine a reference velocity above the particles crest.
Concerning particle entrainment, it was observed that sediment entrainment occurred at a wide range of turbulent flow velocities, with a prevalence of sweep and outward interactions. From our limited database it seems that entrainment may occur at velocities lower than average, but only in ejections events. From the same database, inward interaction events were almost not present.
A visual inspection of the PIV datasets enabled computing particle exposure and it was seen that an increase of particle exposure does not necessarily imply low flow velocities associated with particle dislodgement.
The factors involved in sediment entrainment are in fact multiple and several of these are not directly quantifiable, as the persistence of hydrodynamic actions or the influence of the downstream bed topography. Four types of particle entrainment were identified from the acquired PIV databases: (i) the classic case of entrainment caused by hydrodynamic forces (Type A); (ii) the entrainment promoted by other sediments rolling or saltating nearby the particle at rest and therefore perturbing the flow field close to the particle and causing its dislodgement by imparting momentum transversally (Type B); (iii) sediment entrainment due to direct collisions between moving particles and those at rest in the bed (Type C) and (iv) entrainment due to simultaneous pickup of several sediment included the particle located under the plane of the laser sheet (Type D).
Cases (ii) and (iii) show the limitation of the reference velocity approach as a mean to determine the energy transfer from the flow to the particle, thus suggesting that further research is needed in the physics of flow-particle interaction in particular with respect to the drag and lif coefficients.
The flow field related with disentrainment events was analyzed as well: negative values of instantaneous velocity fluctuations in streamwise direction are observed for all the sample of particles, while both positive and negative vertical fluctuation components were found.
Bed topography also plays, in this case, a key role on the disentrainment events: sediments in motion were more likely to become trapped within pockets if bed depressions are found along their path or in presence of sediment barriers.
Author Contributions
Methodology: R.M.L.F.; bibliography research: F.A., R.M.L.F.; data acquisition: F.A. and A.M.R.; data processing software: R.A. Data Analysis: R.A., F.A., A.M.R., R.M.L.F.; writing and reviewing: R.A., F.A., A.M.R. and R.M.L.F. All authors have read and agreed to the published version of the manuscript.
Funding
This work was financially supported by: Project PTDC/ECM-HID/6387/2014–POCI-01-0145-FEDER-016825—funded by FEDER funds through COMPETE2020—Programa Operacional Competitividade e Internacionalização (POCI) and by national funds through FCT—Fundação para a Ciência e a Tecnologia, I.P. and partially supported by Portuguese and European funds, within the COMPETE 2020 and PORL-FEDER programs, through project RiverCure PTDC/CTA-OHR/29360/2017.
Conflicts of Interest
The authors declare no conflict of interest.
Abbreviations
The following abbreviations are used in this manuscript:
| CFD | Computational Fluid Dynamics |
| FoV | Field of View |
| PIV | Particle Image Velocimetry |
| VLSM | Very Large-Scale Motion |
References
- Meyer-Peter, E.; Müller, R. Formulas for bedload transport. In Proceedings of the 2nd Meeting of the International Association for Hydraulic Research, Stockholm, Sweden, 7–9 June 1948. [Google Scholar]
- Wong, M.; Parker, G. Reanalysis and Correction of Bed-Load Relation of Meyer-Peter and Mü ller Using Their Own Database. J. Hydraul. Eng. 2006, 132, 1159–1168. [Google Scholar] [CrossRef]
- Smart, G.M. Sediment transport formula for steep channels. J. Hydraul. Eng. 1984, 110. [Google Scholar] [CrossRef]
- Recking, A. An analysis of nonlinearity effects on bed load transport prediction. J. Geophys. Res. Earth Surf. 2013, 118, 1264–1281. [Google Scholar] [CrossRef]
- Bagnold, R.A. An Approach to the Sediment Transport Problem from General Physics; USGS Numbered Series Professional Paper; U.S. Government Printing Office: Washington, DC, USA, 1966. [CrossRef]
- Engelund, F.; Hansen, E. A Monograph on Sediment Transport in Alluvial Stream; Teknisk Forlag: Copenhagen, Denmark, 1967. [Google Scholar]
- Rijn, L.C.V. Sediment transport part I bed load transport. J. Hydraul. Eng. 1984, 110. [Google Scholar] [CrossRef]
- Wiberg, P.C.; Smith, J.D. Model for calculating bed load transport of sediment. J. Hydraul. Eng. 1989, 115. [Google Scholar] [CrossRef]
- Einstein, H.A. Die eichung des im Rhein verwendeten geschiebefangers (The calibration of bed-load traps used in the Rhine). Schweiz. Bauztg. 1937, 110, 167–170. [Google Scholar]
- Einstein, H.A. The Bed-Load Function for Sediment Transportation in Open Channel Flows; US Department of Agriculture: Washington, DC, USA, 1950; Volume 1026.
- Lakatos, I. Falsification and the methodology of scientific research programmes. In Can Theories Be Refuted? Essays on the Duhem-Quine Thesis; Springer: Berlin/Heidelberg, Germany, 1976. [Google Scholar] [CrossRef]
- Engelund, F.; Fredsoe, J. A sediment transport model for straight alluvial channels. Hydrol. Res. 1976. [Google Scholar] [CrossRef]
- Cheng, N.S.; Chiew, Y.M. Pickup Probability for Sediment Entrainment. J. Hydraul. Eng. 1998, 124. [Google Scholar] [CrossRef]
- Yalin, M.S. Mechanics of Sediment Transport; Pergamon Press: Oxford, UK, 1972. [Google Scholar]
- Dancey, C.L.; Balakrishnan, M.; Diplas, P.; Papanicolaou, A.N. The spatial inhomogeneity of turbulence above a fully rough, packed bed in open channel flow. Exp. Fluids 2000, 29, 402–410. [Google Scholar] [CrossRef]
- Ferreira, R.M.; Hassan, M.A.; Ferrer-Boix, C. Principles of Bedload Transport of Non-cohesive Sediment in Open-Channels. In Rivers-Physical, Fluvial and Environmental Processes; Rowinsky, P., Radecki-Pawlick, A., Eds.; Springer: Berlin/Heidelberg, Germany, 2015; Chapter 13; pp. 323–372. [Google Scholar]
- Paintal, A.S. A stochastic model of bed load transport. J. Hydraul. Res. 1971, 9, 527–554. [Google Scholar] [CrossRef]
- Schmeeckle, M.W.; Nelson, J.M.; Shreve, R.L. Forces on stationary particles in near-bed turbulent flows. J. Geophys. Res. Earth Surf. 2007, 112. [Google Scholar] [CrossRef]
- Valyrakis, M.; Diplas, P.; Dancey, C.L. Entrainment of coarse particles in turbulent flows: An energy approach. J. Geophys. Res. Earth Surf. 2013, 118, 42–53. [Google Scholar] [CrossRef]
- Diplas, P.; Dancey, C.L.; Celik, A.O.; Valyrakis, M.; Greer, K.; Akar, T. The role of impulse on the initiation of particle movement under turbulent flow conditions. Science 2008, 322, 717–720. [Google Scholar] [CrossRef] [PubMed]
- Chepil, W.S. Equilibrum of soil grains at the threshold of movement by wind. Soil Sci. Soc. Am. J. 1959, 23, 422–428. [Google Scholar] [CrossRef]
- Leonardi, A.; Pokrajac, D.; Roman, F.; Zanello, F.; Armenio, V. Surface and subsurface contributions to the build-up of forces on bed particles. J. Fluid Mech. 2018, 851, 558–572. [Google Scholar] [CrossRef]
- Rubey, W.W. The Force Required to Move Particles on a Stream Bed; Professional Papers; U.S. Geological Survey: Reston, VA, USA, 1938; pp. 121–141.
- Bridge, J.S.; Dominic, D.F. Bed Load Grain Velocities and Sediment Transport Rates. Water Resour. Res. 1984, 20, 476–490. [Google Scholar] [CrossRef]
- Papanicolaou, A.; Diplas, P.; Evaggelopoulos, N.; Fotopoulos, S. Stochastic incipient motion criterion for spheres under various bed packing conditions. J. Hydraul. Eng. 2002, 128, 369–380. [Google Scholar] [CrossRef]
- Recking, A. A comparison between flume and field bed load transport data and consequences for surface-based bed load transport prediction. Water Resour. Res. 2010, 46, W03518. [Google Scholar] [CrossRef]
- Ancey, C.; Bohorquez, P.; Heyman, J. Stochastic interpretation of the advection diffusion equation and its relevance to bed load transport. J. Geophys. Res. Earth Surf. 2015, 120, 2529–2551. [Google Scholar] [CrossRef]
- Furbish, D.J.; Fathel, S.L.; Schmeeckle, M.W. Particle Motions and Bedload Theory. In Gravel-Bed Rivers: Processes and Disasters; Wiley: Hoboken, NJ, USA, 2017; pp. 97–120. [Google Scholar]
- Houssais, M.; Ortiz, C.P.; Durian, D.J.; Jerolmack, D.J. Onset of sediment transport is a continuous transition driven by fluid shear and granular creep. Nat. Commun. 2015, 6, 1–8. [Google Scholar] [CrossRef]
- Ancey, C.; Davison, A.; Böhm, T.; Jodeau, M.; Frey, P. Entrainment and motion of coarse particles in a shallow water stream down a steep slope. J. Fluid Mech. 2008, 595, 83–114. [Google Scholar] [CrossRef]
- Cecchetto, M.; Tregnaghi, M.; Busolin, A.B.; Tait, S.; Marion, A. Statistical Description on theRole of Turbulence and Grain Interference on Particle Entrainment from Gravel Beds. J. Hydraul. Eng. 2017, 143, 06016021. [Google Scholar] [CrossRef]
- Coleman, S.; Nikora, V.I. Fluvial dunes: Initiation, characterisation, flow structure. Earth Surf. Process. Landf. 2011, 36, 39–57. [Google Scholar] [CrossRef]
- Furbish, D.J.; Haff, P.K.; Roseberry, J.C.; Schmeeckle, M.W. A probabilistic description of the bed load sediment flux: 1. Theory. J. Geophys. Res. Earth Surf. 2012, 117. [Google Scholar] [CrossRef]
- Soares-Frazão, S.; Canelas, R.; Cao, Z.; Cea, L.; Chaudhry, H.M.; Moran, A.D.; el Kadi, K.; Ferreira, R.; Cadórniga, I.F.; Gonzalez-Ramirez, N.; et al. Dam-break flows over mobile beds: Experiments and benchmark tests for numerical models. J. Hydraul. Res. 2012, 50, 364–375. [Google Scholar] [CrossRef]
- Andreotti, B.; Claudin, P.; Devauchelle, O.; Durán, O.; Fourriere, A. Bedforms in a turbulent stream: Ripples, chevrons and antidunes. J. Fluid Mech. 2011, 690, 94–128. [Google Scholar] [CrossRef]
- Daubert, A.; Lebreton, J.C. Étude éxperimentale et sur modele mathematique de quelques aspects du calcul des processus d‘erosion des lits alluvionaires en regime permanent et non permanent. In Proceedings of the 12th Congress of IAHR, Fort Collins, CO, USA, 11–14 September 1967; Volume 3, pp. 26–37. [Google Scholar]
- Phillips, B.C.; Sutherland, A. Spatial lag effects in bed load sediment transport. J. Hydraul. Res. 1989, 27, 113–115. [Google Scholar] [CrossRef]
- Charru, F.; Muilleron-Arnould, H.; Eiff, O. Erosion and deposition of particles on a bed sheared by a viscous flow. J. Fluid Mech. 2004, 519, 55–80. [Google Scholar] [CrossRef]
- Canelas, R.; Murillo, J.; Ferreira, R.M.L. Two-dimensional depth-averaged modelling of dambreak flows over mobile beds. J. Hydraul. Res. 2013, 51, 392–407. [Google Scholar] [CrossRef]
- Bohorquez, P.; Ancey, C. Stochastic-deterministic modeling of bed load transport in shallow water flow over erodible slope: Linear stability analysis and numerical simulation. Adv. Water Resour. 2015, 83, 36–54. [Google Scholar] [CrossRef]
- Cecchetto, M.; Tait, S.; Tregnaghi, M.; Marion, A. The mechanics of bedload particles deposition over gravel beds. In Proceedings of the International Conference On Fluvial Hydraulics (River Flow 2016), St. Louis, MO, USA, 12–15 July 2016. [Google Scholar]
- Ancey, C. Bedload transport: A walk between randomness and determinism. Part 2. Challenges and prospects. J. Hydraul. Res. 2020, 58, 18–33. [Google Scholar] [CrossRef]
- Kramer, H. Sand mixtures and sand movement in fluvial model. Am. Soc. Civ. Eng. 1935, 100, 873–878. [Google Scholar]
- Mendes, L.; Antico, F.; Sanches, P.; Alegria, F.; Aleixo, R.; Ferreira, R.M. A particle counting system for calculation of bedload fluxes. Meas. Sci. Technol. 2016, 27, 125305. [Google Scholar] [CrossRef]
- Ferreira, R.M.L. The von Kármán constant for flows over rough mobile beds. Lessons learned from dimensional analysis and similarity. Adv. Water Resour. 2015, 81, 19–32. [Google Scholar] [CrossRef]
- Dwivedi, A.; Melville, B.W.; Shamseldin, A.Y.; Guha, T.K. Analysis of hydrodynamic lift on a bed sediment particle. J. Geophys. Res. Earth Surf. 2011, 116. [Google Scholar] [CrossRef]
- Antico, F. Laboratory Investigations on the Motion of Sediment Particles in Cohesionless Mobile Beds under Turbulent Flows. Ph.D. Thesis, Instituto Superior Técnico, Universidade de Lisboa, Lisboa, Portugal, 2019. [Google Scholar]
- Nakagawa, H.; Nezu, I. Prediction of the contributions to the Reynolds stress from bursting events in open-channel flows. J. Fluid Mech. 1977, 80, 99–128. [Google Scholar] [CrossRef]
- Nikora, V.; Ballio, F.; Coleman, S.; Pokrajac, D. Spatially averaged flows over mobile rough beds: Definitions, averaging theorems, and conservation equations. J. Hydraul. Eng. 2013, 139, 803–811. [Google Scholar] [CrossRef]
- Kim, K.C.; Adrian, R.J. Very large-scale motion in the outer layer. Phys. Fluids 1999, 11, 417–422. [Google Scholar] [CrossRef]
- Schoklitsch, A. Handbuch des Wasserbaues; Springer: Berlin/Heidelberg, Germany, 1962. [Google Scholar]
- Gyr, A.; Schmid, A. The different ripple formation mechanisms. J. Hydraul. Res. 1989, 27, 61–74. [Google Scholar] [CrossRef]
- Séchet, P.; Guennec, B.L. Bursting phenomenon and incipient motion of solid particles in bed-load transport. J. Hydraul. Res. 1999. [Google Scholar] [CrossRef]
- Nelson, J.M.; Shreve, R.L.; McLean, S.R.; Drake, T.G. Role of near-bed turbulence structure in bed load transport and bed form mechanics. Water Resour. Res. 1995, 31, 2071–2086. [Google Scholar] [CrossRef]
- Ancey, C.; Böhm, T.; Jodeau, M.; Frey, P. Statistical description of sediment transport experiments. Phys. Rev. E 2006, 74, 011302. [Google Scholar] [CrossRef] [PubMed]
- Valyrakis, M.; Diplas, P.; Dancey, C.L.; Greer, K.; Celik, A.O. Role of instantaneous force magnitude and duration on particle entrainment. J. Geophys. Res. Earth Surf. 2010, 115. [Google Scholar] [CrossRef]
- Drake, T.G.; Shreve, R.L.; Dietrich, W.E.; Whiting, P.J.; Leopold, L.B. Bedload transport of fine gravel observed by motion-picture photography. J. Fluid Mech. 1988, 192, 193–217. [Google Scholar] [CrossRef]
- Böhm, T.; Ancey, C.; Frey, P.; Reboud, J.L.; Ducottet, C. Fluctuations of the solid discharge of gravity-driven particle flows in a turbulent stream. Phys. Rev. E 2004, 69, 061307. [Google Scholar] [CrossRef]
© 2020 by the authors. Licensee MDPI, Basel, Switzerland. This article is an open access article distributed under the terms and conditions of the Creative Commons Attribution (CC BY) license (http://creativecommons.org/licenses/by/4.0/).