Abstract
Pasteurisation was investigated as a process to achieve high microbial quality standards in the recycling of water from unfiltered secondary effluents from a wastewater treatment plants in Melbourne, Australia. The relative heat sensitivity of key bacterial, viral, protozoan and helminth wastewater organisms (Escherichia coli, Enterococcus, FRNA bacteriophage, adenovirus, coxsackievirus, Cryptosporidium, and Ascaris) were determined by laboratory scale tests. The FRNA phage were found to be the most heat resistant, followed by enterococci and E. coli. Pilot scale challenge testing of a 2 ML/day pasteurisation pilot plant using unfiltered municipal wastewater and male specific coliphage (MS2) phage showed that temperatures between 69 °C and 75 °C achieved log reductions values between 0.9 ± 0.1 and 5.0 ± 0.5 respectively in the contact chamber. Fouling of the heat exchangers during operation using unfiltered secondary treated effluent was found to increase the energy consumption of the plant from 2.2 kWh/kL to 5.1 kWh/kL. The economic feasibility of pasteurisation for the current municipal application with high heat exchanger fouling potential can be expected to depend largely on the available waste heat from co-generation and on the efforts required to control fouling of the heat exchangers.
1. Introduction
Recycled water is widely used in Australia for various purposes such as toilet flushing, domestic gardening, irrigation of parks and sportsgrounds, and in peri-urban agriculture. Due to the high risk of direct human exposure to the water, or to incidental ingestion of the water, the highest level of treatment (Class A) is required for this recycled water. The microbial water quality objectives for Class A water are determined by a quantitative microbial risk assessment (QMRA), consistent with the Australian Guidelines for Water Recycling [1]. The ability of a treatment process to render the water safe to use for a specific purpose is a key feature of the QMRA. This is commonly determined by the performance in challenge tests. Other key features of the QMRA are the feed water quality and variability, the likely level of exposure, and infection rates of pathogens.
The safe treatment of sewage and the delivery of safe recycled water for reuse or for environmental discharge requires a considerable energy input. Energy use is largely in the form of electricity to run pumps and other process equipment, and for disinfection if the water is to be reused. Under financial pressures from growing energy costs and regulatory pressures to reduce greenhouse gas emissions, many wastewater treatment plants are keen to implement renewable energy sources and improve the energy efficiency of their operations. The on-site electricity generation from biogas gives rise to large quantities of waste heat that can be utilised for other processes, such as disinfection via pasteurisation.
Wastewater pasteurisation (WP) is an emerging disinfection technology that may have considerable cost and environmental advantages over traditional wastewater treatment processes. It can utilise waste heat from on-site electricity generation using biogas or gas from city or community supply to heat the wastewater for inactivating the pathogens of concern. Pasteurisation technology has been extensively used in the food industry for many years but its large-scale application to wastewater treatment has emerged only recently. In the US, WP technology was granted California Title 22 approval for disinfection of filtered secondary effluent in 2007 [2]. It has been demonstrated at the city of Santa Rosa’s Laguna Wastewater Reclamation Plant, where validation testing was conducted as part of the California Department of Public Health (CDPH, now called the Division of Drinking Water (DDW)) program to review new technologies for wastewater treatment for water reuse and provide conditional approval (often referred to as “Title 22” approval) [3]. More recently, WP technology has been adopted in the northern California town of Graton [2]. The adoption of this technology in the US state of California for the treatment of filtered effluent suggests that that it may have economic and/or environmental advantages (i.e., fewer disinfection by-products) over more established wastewater disinfection technology. It is, however, difficult to find supporting evidence of this in the peer-reviewed scientific literature, and the performance of WP for treatment of unfiltered secondary effluent is not documented.
One of the advantages of using pasteurization to disinfect wastewater is that it does not lead to harmful effects of unreacted disinfectant chemicals and to the formation of harmful disinfection by-products (DBPs). Chlorination and ozonation are currently commonly used for wastewater disinfection and their extensive use has led to the production of very harmful DBPs. The DBPs from chlorination are harmful to both humans and the environment, and cause measurable effect of acute toxicity from even low levels of residual chlorine [4,5,6]. The DBPs from ozonation result from the oxidation of halogens, leading to the formation of carcinogens such as bromate at concentrations as low as 20 µg/L [7]. The other commonly used wastewater disinfection method, UV disinfection, has not been shown to lead to measurable quantities of DBPs [8]. The UV disinfection of turbid wastewater with low UV transmittance, however, requires powerful UV systems that are both capital and energy intensive, and necessitate pre-treatment to reduce turbidity and organic content.
The heating of pathogens brings about denaturation of macromolecules and structures that are required for microbial function. The extent of denaturation of pathogen macromolecules, and the resulting inactivation of pathogens, depends on both temperature and time. The higher the temperature, the less time is required for this denaturation to take place. Wastewater contains a wide variety of pathogens, each with its own tolerance to heat, and the required heat treatment for disinfection is that which can kill even the most tolerant of these pathogens. Furthermore, the salt content, the phase of growth of the organisms, the solution pH and the presence of suspended solid matter may have a protective effect. Salt content of the order of 1 to 2% w/v has been found to be protective to bacteria and viruses [9,10,11,12]. Bacteria in late stationary phase of growth have been found to be more heat resistant than log phase cells [13]. Bacterial resistance to heat has been found higher for acid grown bacteria than for cells grown at higher pH values [14]. Performance of the WP process has been reported to be worse in unfiltered feedwaters than in filtered feedwaters [15].
Due to the large rate of production of wastewater from most municipal wastewater treatment plants, WP technology usually needs to operate at high flow rates which, in turn, requires high temperatures and short contact time to achieve the desired level of inactivation. The selection of the appropriate temperature and contact time to inactivate even the most heat resistant of pathogens requires knowledge of the heat tolerance of the wide variety of pathogens present in the wastewater. Once the most heat resistant organism is known, this organism can be tested for in the treated water and can be used as a surrogate for the other organisms of concern and an indicator of plant performance. This research identified the most heat tolerant organisms in the various classes of organisms (bacteria, virus, protozoa and helminths) found in wastewater and then experimentally tested their tolerance to heat in different wastewater matrices, allowing the selection of appropriate surrogate organisms for industrial-scale challenge testing of existing WP technology. Key to the economic viability of the WP process is the harnessing of waste heat from on-site electricity generation and the use of efficient heat exchangers that recycle the heat and cool the treated water close to the ambient temperature before discharge. This research also quantified the decrease in efficiency of the WP process, as fouling of the heat exchangers occurred during the treatment of unfiltered secondary effluent with high fouling potential. This work also examined the efficacy of different clean in place (CIP) procedures in restoring heat exchanger efficiency.
2. Materials and Methods
2.1. Laboratory Scale Testing
The literature-derived inactivation temperatures for selected pathogens and surrogates [16] were verified by laboratory-scale testing. The temperatures and exposure times that were going to be used in the 2 ML/day pilot system were also used as a further consideration for selection of the inactivation temperatures and times evaluated in the laboratory-scale testing. Experiments were conducted using waters collected from Melbourne’s Western Treatment Plant (WTP) and Eastern Treatment Plant (ETP). The effect of temperature and time (55 °C, 65 °C and 75 °C, 5 s, 30 s, 60 s) was evaluated for wastewater sampled from different steps of the treatment process (i.e., from Pond Two (P2) and Pond 10 (P10) of a 10 pond maturation treatment process). Experiments were also conducted to determine if the origin of the test organism (laboratory reference strain or wastewater isolate) had any influence on temperature inactivation. Inactivation experiments placed 120 µL samples into 0.2 mL tubes, which were incubated in a thermal cycler (Palmcycler, Corbett Research, Sydney, Australia). Controls were included to account for any natural die-off at ambient temperature, and to account for any inactivation that occurred while the sample temperature was ramping up from ambient to the target temperature (from room temperature to target temperature with a nominal 1 s hold at the target temperature). Samples were diluted using sterile reagent-grade water as required for microbiological analysis. Chemical analyses were performed by a commercial analytical laboratory (ALS Water).
2.1.1. Male Specific Coliphage (MS2) Tests
The American Public Health Asscociation (APHA) Method 9224C was used for the detection of male-specific coliphage (both FRNA and FDNA), with the exception that 1 mL of sample was analysed. Plates were incubated at 36° ± 1.0 °C for 24 ± 2 h. A suitable reference strain of Escherichia coli (ATCC 700891) was used as the phage host, and laboratory cultured male specific coliphage (MS2) ATCC 15597-B1 was used as reference for FRNA coliphage. Indigenous male-specific coliphage in a 1 mL wastewater sample were isolated using the phage plating method. The top layer of agar containing phage plaques was scraped from the plate into tryptone soy broth (Oxoid), vortexed and centrifuged to pellet cells/debris/agar. The phage plating method was used to isolate any phage in the supernatant and the process was repeated. Male-specific coliphage include both FRNA and FDNA phage; the abundance of each was determined by plating samples in the presence or absence of RNase. The numbers of FDNA were low in the wastewater samples but increased following isolation of phage from the plates. Differential counts (using plates +/− RNase) were used to compare temperature inactivation of indigenous FRNA with MS2.
2.1.2. Escherichia coli Tests
A National Association of Testing Authorities (NATA) accredited method, based on Australian Standard AS 4276.7, was used for the isolation and enumeration of E. coli. In brief, this method filters a 100 mL sample through a membrane, which is then placed onto MI agar (a selective chromogenic medium) and incubated at 30 ± 0.5 °C for 4 h and then at 44.5 °C ± 0.5 °C for 16 h ± 2 h. Criteria for counting E. coli colonies were used as described in 4276.7.
2.1.3. Enterococci Tests
Intestinal enterococci were enumerated using a NATA accredited method based on Australian Standard AS 4276.9, with the addition of glucosidase agar for confirmation of Enterococcus. This method is also based on filtration of a 100 mL sample and culture on a chromogenic medium (m-Enterococcus agar). Plates were incubated at 36 ± 2.0 °C for 44 ± 4 h. Presumptive colonies were cultured using glucosidase agar (incubated at 35 ± 0.5 °C for up to 4 h) and other culture media (as described in more detail in AS 4276.9).
2.1.4. Coxsackievirus and Adenovirus Tests
Coxsackievirus and adenovirus were selected as representatives of human enteric viruses. Coxsackie B5 (CB5) (ATCC VR-185) was cultured in buffalo green monkey kidney (BGM) cells; adenovirus 2 (Ad2) was obtained from the National Institute of Allergy and Infectious Diseases (NIAID) and cultured in human lung adenocarcinoma epithelial (A549) cells. Stocks were prepared by infecting the appropriate cultured mammalian cell line. Cells were cultured to confluence in 175 cm3 flasks infected with the 3 mL of culture medium without foetal bovine serum (FBS) containing the respective virus at a multiplicity of infection of approximately 1. Flasks were incubated for 90 min at 37 °C in a CO2 incubator, with rocking every 10 min. The inoculum was replaced with 15 mL of complete medium and incubated at 37 °C in a CO2 incubator until >90% of the cell monolayer had been killed by virus infection. Host cells were subjected to between 1–3 rounds of freeze–thaw to release any cell-associated virus particles. Virus particles were purified by centrifugation (4 °C at 10,000 g for 10 min) and filtration (0.2 µm Acrodisc syringe, Pall Corporation, Port Washington, New York, NY, USA). Virus titres were determined using a plaque assay as described by Kahler et al. [17]. Virus stocks were dispensed into 1 mL aliquots and stored at −80 °C. The plaque method [17] was also used to enumerate viruses in temperature inactivation experiments. Briefly, cell monolayers were infected with 100 or 200 µL of serially diluted (10−1–10−6) sample. Following infection, cells were washed and overlaid with 2% SeaPlaque Agarose (Lonza Rockland, Inc., Rockland, Maine, USA) prepared in 2X Minimum Essential Media (MEM) plus 10% FBS. Inverted plates were incubated at 37 °C for 3 or 10 days for CB5 or Ad2 respectively. Cells were fixed with 1% formalin, the overlay was removed and cells were stained with 0.2% crystal violet. Plaques were counted and infectious viral units were reported as plaque forming units (PFUs) per mL.
2.1.5. Cryptosporidium Infectivity Test
Cryptosporidium oocyst infectivity was measured by cell culture using a simplification of the assay described by King et al. [18], which uses fluorescent antibodies to detect cells that have been infected by Cryptosporidium. Each cluster of infected cells (also known as an infectious focus) represents infection initiated by a single infectious oocyst. Temperature inactivation experiments used a predetermined (by fluorescence microscopy) number of infectious oocysts in each sample, which allowed known numbers of oocysts to be used in the infectivity assay, simplifying the calculation of the number of infectious oocycts. The percentage of infectious oocysts after heat treatment (aht) was determined using the number of infectious oocysts detected by cell culture and the total number of oocysts applied to cell culture, according to Equation (1):
In order to avoid any overlap of infectious foci, only 100 oocysts were applied to each cell culture well. The total number of oocysts applied to multiple cell culture wells was used to calculate the maximum log removal values (LRVs) for Cryptosporidium.
2.1.6. Helminths Tests
The method of Jeska et al. [19] was used to isolate Ascaris suum eggs. Pig intestines from slaughtered animals suspected to contain Acaris worms were obtained from the Department of Primary Industries, VIC, Australia. Intact female worms (selected based on size) were rinsed in egg laying solution (phosphate buffered physiological saline (pH 7.3), 0.0015 N sodium hydroxide and 11 mM glucose), placed in 75 cm2 cell culture flasks with egg laying medium supplemented with 125 mg/L gentamycin sulfate and incubated at 37 °C for multiple days. The medium was changed each day to allow collection of any released eggs, which were stored at 4 °C until required. Eggs were enumerated by light microscopy. Egg viability was determined by measuring the development of larvae. Sample aliquots of 25 µL containing approximately 200–300 eggs were mixed with 225 µL 0.1N sulphuric acid (Sigma-Aldrich, Sydney, Australia) in a 90 well microplate (Corning, Tewksbury, USA). The plate was incubated in the dark at 22 °C for 40 days, with the well volume maintained by topping up with distilled water as required. Following incubation, 60–100 eggs were visually assessed at 100–400 X magnification (CKX41 microscope, Olympus, Tokyo, Japan) for the presence of developmental stages and were assessed and categorized as unfertilized (dark and elongated with incomplete eggshells), pre-larval and developed larvae. The eggs with a larval stage present were deemed viable and percentage calculations excluded unfertilized eggs. Viability was calculated using the following equation:
2.1.7. Effect of Turbidity Test
The presence of solids (in the form of particulates) may affect heat transfer and microbial inactivation in the wastewater. To assess this, the turbidity of ETP secondary effluent (2.1 NTU) was artificially increased. The particulates in ETP secondary effluent were concentrated by centrifugation and the resulting pellet added to un-modified ETP secondary effluent, resulting in a turbidity of 14.6 NTU. The number of E. coli in the ETP effluent was not sufficient to for inactivation experiments, so indigenous E. coli were isolated by membrane filtration of 100 mL of effluent (as described above). A colony that appeared to originate from a single particle (assessed by dissection microscopy) was sub-cultured using MI agar. This isolate was further subcultured overnight at 37 °C in 10 mL of tryptone soy broth (TSB). The overnight culture was re-inoculated into fresh 10 mL TSB bottles and incubated with shaking for 3–4 h at 37 °C until the culture reached an optical density of 0.6–0.8 absorbance units. The culture (10 mL) was pelleted by centrifugation and resuspended in 10 mL of 2.1 NTU or 14.6 NTU ETP pond water.
2.2. Pilot Plant Testing
The 2ML/day pasteurisation pilot plant used in this study (Pasteurization Technology Group, PTG) was composed of heat exchangers, stack heater and pipeline contact chamber (see Figure 1). The pathogen inactivation taking place in the contact chamber and in entire pasteurisation plant was tested by challenge testing using MS2 coliphage.
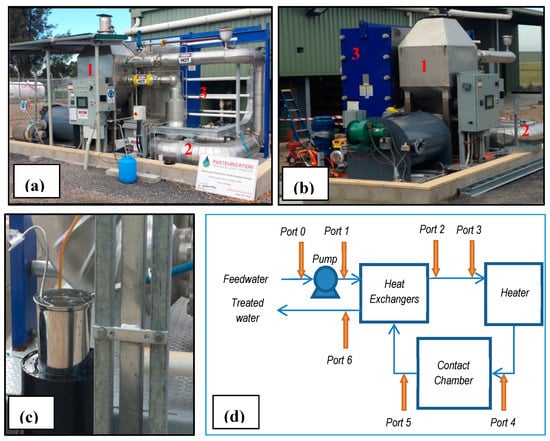
Figure 1.
Pasteurisation pilot plant. (a and b): frontal view and side view showing key pilot plant components: heater (1), contact chamber (2) and heat exchangers (3); (c): ice bath sample chilling device used for Port 5 samples; and (d): process schematic showing location of sample ports and key pilot plant components.
The feedwater for the pilot plant trial was unfiltered ETP secondary effluent. The feedwater was sampled on the challenge tests days and analyzed by a commercial analytical laboratory (ALS Water). for total organic carbon (TOC), suspended solids (SS), volatile suspended solids (VSS), electrical conductivity (EC), dissolved calcium, pH, alkalinity, turbidity and UV transmittance (UVT).
Rhodamine WT was used as a tracer in determination of the contact time at each tested flow rate. The tracer was injected at low water temperature (19 °C) and detected by fluorescence measurement. The contact time was calculated according to the method outlined in Appendix D of [20].
2.2.1. Contact Chamber Testing
The effectiveness of inactivation taking place in the contact chamber was tested by injecting MS2 phage at Port 4 for approximately 20 min and sampling at Port 5 (see Figure 1) after a minimum total flow equivalent to three times the contact chamber contact times, i.e., after at least 3 min at 550 L/min (60 s contact time), and after at least 1.5 min at 1,100 L/min (30 s contact time). The pre-treatment MS2 concentration was determined by injection of the MS2 at Port 0 and sampling at Port 6 at ambient temperature (<30 °C) where MS2 phage is known to be unaffected by these low temperatures. The high flow (~1100 L/min) tests of the contact chamber were performed on 4 separate days at 3 different temperatures on each day. Six before treatment and six after treatment samples were taken at each temperature, giving a total of 24 before-treatment and 24 after-treatment samples at each temperature for the determination of the bottom 5th percentile log reduction value (LRV) required for validation [21]. One batch of MS2 culture was used on each of the 4 days. The average MS2 concentration before treatment on the 4 separate days varied between 4.0 and 5.5 log. The heat in all samples from Port 5 was quenched immediately to between 40 °C and 50 °C by passing the sample through a spiral tube in an ice bath during sample collection. The samples were subsequently left in an ice bath for a further 5 min to ensure further cooling.
2.2.2. Whole Plant Testing
Testing of the performance of the entire process involved the injection of MS2 for approximately 30 min at a port prior to the feed pump (Port 0, see Figure 1), and sampling at Ports 1 and 6. Sampling was started after flow equivalent to three times the entire plant contact time had passed through the plant following commencement of MS2 dosing, i.e., after 12.7 min at 1100 L/min, (4.2 min contact time). Six before-treatment and six after-treatment samples were taken at each test temperature. The Port 1 results were used to determine the pre-treatment MS2 concentration. A separate batch of MS2 culture was used for each of the temperatures tested for pathogen inactivation between Ports 1 and 6. The average MS2 concentration before treatment for the 3 separate temperatures varied between 4.1 and 4.5 log.
2.2.3. Clean in Place
A clean in place (CIP) was performed on three different days. For each CIP event, the flow rate was set at 1100 L/min with the system in recirculation mode. The cleaning chemicals (46% NaOH or 50% citric acid) were injected into the plant (total Volume 4500 L) and kept at 60 °C for 60 min. The first CIP used 10 L of NaOH. The second CIP used 85 L of NaOH. The third CIP used 85 L of citric acid.
3. Results
3.1. Water Quality Data
Water for the laboratory scale testing was collected at two levels of maturation and biological treatment, from the second pond (P2) and the 10th pond (P10) in the Western Treatment Plant (WTP) 10 maturation pond treatment system. The results of microbial and chemical assay of this water are summarised in Table 1.

Table 1.
Water quality data for Western Treatment Plant Pond water.
The quality of the feed water during the pilot scale challenge tests is shown in Table 2. The feed water quality data was plotted against the achieved LRV to assess if any of the measured parameters influenced the LRV achieved during pasteurisation. The square of the Pearson product moment correlation coefficients (R2), from highest to lowest, were: SS (0.60) > Ca (0.42), > turbidity (0.38) > TOC (0.33) > pH (0.31) > VSS (0.27) > COD (0.20) > UVT (0.16) > alkalinity (0.09) > EC (8 × 10⁻⁵). Only two of the parameters showed a trendline with a negative slope that would be indicative of a decrease in LRV with increase in the parameter (alkalinity and COD). More data are required to establish whether or not there is a correlation between LRV and the tested water quality parameters, but this lack of clear correlation is consistent with these parameters having no influence over the range of values tested in these trials.
Table 2.
Water quality on high flow rate (1100 L/min) challenge tests days.
3.2. Laboratory-Scale Testing
The primary purpose of the laboratory testing was to provide data for the selection of surrogate agents (i.e., microbial organisms that can be readily enumerated in lieu of the target pathogen). A good conservative surrogate agent for the pasteurisation process is one that is more heat resistant than the target pathogens such that the achieved heat inactivation of the organism of concern is always more than that of the surrogate. A recent survey of heat inactivation of pathogens found that FRNA phage (MS2) is less heat sensitive than E. coli, most viruses and could thus make a conservative surrogates for these pathogens [16]. The relative heat sensitivity of MS2 was compared to that of E. coli and other pathogens of concern under conditions relevant to the Pilot Plant. The results of the laboratory scale testing are shown in Table 3 and Table 4. MS2 was found to be the most heat resistant, followed by enterococci and E. coli. Ascaris showed some survival at 55 °C but was totally inactivated at 65 °C. Adenovirus required between 30 and 60 s for total inactivation at 55 °C. Coxsackievirus B5 and Cryptosporidium were highly temperature sensitive, being rapidly inactivated even after brief time exposures to 55 °C.
Table 3.
Log reduction values achieved in laboratory trials at different temperatures and contact times in Western Treatment Plant (WTP) Pond 2 water.
Table 4.
Effect of WTP pond water on log reduction values for male specific coliphage (MS2), Escherichia coli and Cryptosporidium in laboratory trials at different temperatures and contact times.
A comparison of the inactivation of laboratory and wild strains (Table 3) shows that wastewater isolates of E. coli have a similar sensitivity to temperature to that of the laboratory strain. The native FRNA was found to be less heat sensitive than MS2, particularly at 75 °C for 30 s exposure (Native FRNA LRV = ~1.5, MS2 LRV = ~6).
As seen in Table 4, there was also no evidence of any difference in sensitivity due to different water quality, with similar results for MS2 phage, E. coli or Chryptosporidium spiked into P2 (8.5 NTU) or P10 water (1.8 NTU), suggesting that turbidity at these levels had no effect. The effect of turbidity was further tested on ETP water. The results are shown in Table 5. Statistical comparison of the LRV results using t-tests did not show any significant difference between waters of different turbidity (t-test p > 0.05).
Table 5.
Effect of turbidity on log removal values (LRV) at 60˚C for three replicate experiments, native E. coli.
3.3. Pilot Scale Testing
The primary aims for the pilot plant trials were to test the effectiveness of the WP process for the treatment of unfiltered secondary effluent, and to assess the changes in energy efficiency resulting from the fouling of the heat exchangers.
3.3.1. Contact Chamber Tests
The pilot plant was operated at Melbourne’s Eastern Treatment Plant (ETP) at temperatures between 69 °C and 75 °C with a contact chamber time of 30 s (flow at ~1100 L/min) or 60 s (~550 L/min). The results are shown in Figure 2.
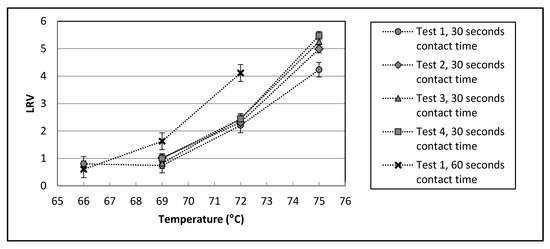
Figure 2.
MS2 inactivation between Ports 4 and 5 (see Figure 1d). The high flow challenge tests (~1100 L/min) were conducted on four separate days, each with contact time of 30 s. The low flow challenge test (~550 L/min) was conducted on one day at a contact time of 60 s. All data points represent the LRV calculated from the average of 6 before-treatment and 6 after-treatment samples. Error bars are one standard deviation.
The pilot plant was found to have good control of both temperature and flow during the challenge test, with relative standard deviations of ~0.2% and 2% respectively. The standard deviation from the average LRV values was generally found to be greater for the higher temperatures, reflecting the greater error in enumeration of low numbers of microorganisms, which are approaching the limit of detection. There was generally good agreement between the high flow (30 s contact time) LRVs obtained on four different days.
As expected, the LRV values at the lower flow rate (571 L/min, contact time of 60 s) were higher than those at high flow rates (~1100 L/min, 30 s). This difference, however, was lower at 66 °C than at 69 °C and 72 °C. These results are in good agreement with the laboratory trials results which showed LRV values less than 1 at both 30 and 60 s at 65 °C, and a similarly high LRV at 30 and 60 s at 75 °C (see Table 3 and Table 4).
The MS2 LRV achieved during the pilot plant contact chamber challenge tests at 75 °C and a contact time of 30 s (5.0 ± 0.5,) was found to be in good agreement with the MS2 LRV achieved in the laboratory trials for Pond 2 and Pond 10 water at this contact time and temperature combination (5.56, see Table 4).
3.3.2. Entire Plant Tests
As shown in Figure 1d, the wastewater goes through heat exchangers before and after spending time in the contact chamber, heating it on the way in and cooling it back down to close to ambient temperature on the way out. The additional time can potentially lead to greater pathogen inactivation. To test this, and to determine the level of native E. coli inactivation in the entire plant, the MS2 challenge tests were conducted at four lower temperatures, injecting the MS2 phage at Port 1, and sampling at Port 6 (see Figure 1d for port locations). The results are shown in Figure 3.
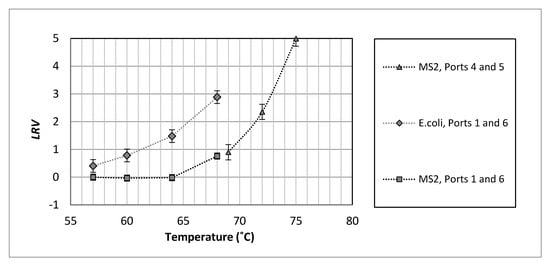
Figure 3.
Comparison of disinfection performance at high flow rate, ~1,100 L/min) for the entire plant (Ports 1 and 6, added MS2 and native E. coli, 254 s contact time) with the disinfection achieved in the contact chamber (between Ports 4 and 5, added MS2 phage, 30 s contact time), error bars represent one average standard deviation. See Figure 1d for port locations.
An E. coli LRV of 2.9 ± 0.3 was achieved at 68 °C at a contact time of 254 s (at ~1100 L/min). MS2 inactivation at this temperature was found to be 0.8 ± 0.2. The higher heat sensitivity of native E. coli than MS2 at the pilot plant scale confirmed the laboratory scale results (native E. coli LRV = 1.2, MS2 LRV = ~0.1, at 65 °C and 30 s contact time). The trend in E. coli LRVs at varying temperatures indicated that a minimum temperature of approximately 72 °C is required for complete inactivation of the native E. coli in this water (present at ~ 5 log value (LV), and thus achieve the high levels of treatment required for uses of recycled water that carry a high risk of direct human exposure to the wastewater. All the microbiological raw data from the laboratory and pilot tests is available from ANDS website (see the Supplementary Materials section).
3.3.3. Energy Efficiency Changes
The economic viability of the WP process depends largely on the efficiency of heat exchangers that recycle the heat and cool the treated water close to the ambient temperature before discharge. Poor heat exchanger efficiency results in heat loss in the effluent that must be replaced to keep the pasteurisation process running at the required temperature. Fouling of heat exchangers is a major cause of decreasing heat exchanger efficiency and the mechanism of fouling (chemical or biological) can vary depending on the temperature [22]. This trial was run on unfiltered wastewater from a holding basin at the end of a nitrifying/denitrifying activated sludge sewage treatment plant and can be considered to have high heat exchanger fouling potential. The feedwater was pre-filtered using a basket strainer to minimise heat exchanger fouling by large particulates. The high fouling potential was clearly evident from inspection of the basket strainer (see Figure 4), which shows almost complete occlusion of the inner surface of the basket strainer by solid matter and the protrusion of particulate and fibrous material through the ~3 mm strainer holes.
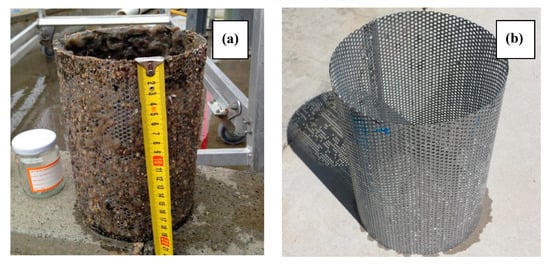
Figure 4.
Appearance of the basket strainer 4 months after commissioning (a), and after cleaning immediately before performance of clean in place (CIP) procedures (b).
The measured temperature differences between the feed and the pilot plant outlet (ΔT) during the challenge tests, (performed at contact chamber temperature between 66 °C and 75 °C) and during the first continuous operation period (Period 1, constant contact chamber temperature of 72 °C) are shown in Figure 5.
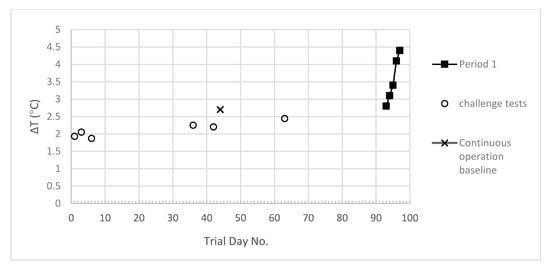
Figure 5.
Temperature difference between untreated wastewater and treated wastewater outlets.
It can be seen that ΔT at the first challenge test, at the start of the trial when the heat exchangers were clean, was about 2 °C and this increased to approximately 2.5 °C by the time the last challenge test had been performed. The ΔT value was found to rapidly increase during continuous operation, prompting clean in place (CIP) procedures to be implemented. The basket strainer was cleaned immediately prior to performance of the CIP procedures. The effect of different CIP procedures on the ΔT values can be seen in Figure 6. It can be seen that the first implemented CIP (Day 108, low dose caustic solution) was effective at decreasing the ΔT from 4.4 (Day 97, Figure 5) to 2.9 (Day 107, Figure 6). The ΔT increased during continuous operation to 3.2 before the second CIP (high dose caustic solution) which led to a decrease in the ΔT back to close to that observed at the end of the first CIP. Over the next three days, the ΔT increased to 3.3 and it can be seen that the third CIP (using citric acid) was more effective than the previous caustic solution CIPs, decreasing the ΔT to close to the baseline value (first continuous mode operation). The ΔT value can be seen to rise rapidly over the next two days, and then increase at a slower rate over the remaining days of the continuous operation period.
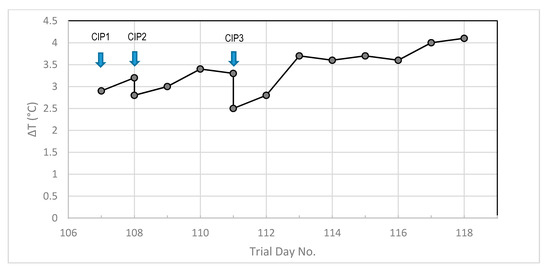
Figure 6.
Effect of different CIP procedures on ΔT during continuous pilot plant operation, CP1 (low strength caustic) on Day 107, CP2 (high strength caustic) on Day 108, CP3 (citric acid) on Day 111.
The observed increases in ΔT values represent an increase in heat loss from the pasteurisation system and this heat must be replaced to keep the pasteurisation process running at the required temperature. Figure 7 shows the energy requirement from purchased gas as a result of heat loss in treated wastewater, with and without waste heat from current level of co-generation. Three scenarios with varying levels of supplementation of the required energy with waste energy from on-site electricity generation are considered.
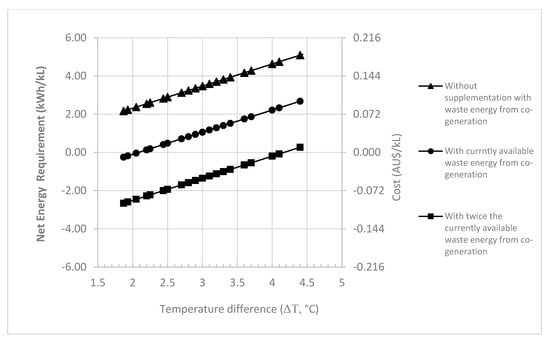
Figure 7.
Energy requirement from purchased gas as a result of heat loss in treated wastewater with and without waste heat from current level of WTP co-generation (107,250 MWh/a). Cost of purchased gas requirement calculated for a gas price of AU$10/GJ [23].
4. Discussion
These laboratory scale results are consistent with the relative heat sensitivity of the test organisms in literature [16]. Pasteurisation of raw sewage at 60 °C for 30 min has been found to result in MS2 LRV of 2.8, which is lower than that of faecal streptococci (3.4) and Coxsackievirus (4.8 to 5.1) [24]. The LRV achieved for an environmental strain of E. coli (strain O148, LRV: 4 to 7) at 55 °C for 30 min was slightly less than that of a laboratory strain of E. coli (strain NCTC 9001, LRV: 7 to 8) [25]. The milder conditions of 55 °C for 15 min were found to result in Ascaris LRV inactivation greater than 3 [26]. Cryptosporidium has been found to be very sensitive to heat inactivation. Heat treatment at 55 °C for 0.5 min has been found to achieve LRV inactivation of greater than 3.
The laboratory scale data presented in Table 3 and Table 4 indicates that FRNA phage may serve as a good surrogate for enteric viruses as it has a slightly higher resistance to heat than these viruses and would be a good indicator of process performance as it is the most heat resistant of the tested microbes. The data also indicates that Enterococci and E. coli could serve as a conservative surrogate for bacteria in general, with Enterococci being the more conservative surrogate. E. coli could also serve as a conservative surrogate for Cryptosporidium as it is more heat resistant.
The pilot scale LRV results achieved during the current work (0.9, 2.4 and 5.0 at 69 °C, 72 °C and 75°C respectively) are considerably different to those achieved for the contact chamber in past pasteurisation trials at Ventura, California [3] where LRVs of 5.5, 7.0 and 7.2 were reported at 72 °C, 73 °C and 79 °C respectively, using the same strain of MS2 (strain ATCC 15597-B1) and similar contact times. There was, however, considerable agreement between the current results and those in other US studies at Graton and Santa Rosa, California (LRVs of 4.5 to 5.3 at approximately 75 °C, at contact times between 15 and 40 s) [27]. The observed difference between the Ventura trial data and the other trial data may possibly be attributable to the use of high seed doses in the Ventura trial, which can cause artificially high LRVs [28]. Another possible cause of the differences observed is a difference in water quality. The results of the 2007 Ventura wastewater pasteurisation trial suggest that turbidity plays a role in pasteurisation disinfection kinetics, particularly with regard to coliform disinfection [3]. This study compared disinfection performance of filtered and unfiltered effluent and found that unfiltered effluent required the use of higher temperatures to achieve the desired E. coli inactivation level.
Municipal wastewater treatment plants are increasingly turning to on-site renewable energy generation from biogas production. Melbourne’s Western Treatment Plant, for example, has an expected annual electrical output of 71,500 MWh from the WTP biogas power plant which enables it to meet nearly all its annual electricity needs using renewable energy on site [29]. Assuming approximately 40% efficiency for electricity generation [30], and the use of approximately 90% of available waste heat energy, this on-site electricity generation leads to the generation of approximately 96,505 MWh of available waste energy that can be used for pasteurisation. Figure 7 highlights the importance of keeping ΔT as low as possible and the use of waste heat from co-generation. Without supplementation of the energy for pasteurisation from co-generation, the requirement of energy from purchased gas ranges from 2.2 to 5.1 kWh/kL, depending on the ΔT. This can be compared to the typical energy intensity of currently available advanced technologies [31] for wastewater treatment shown in Table 6. It can be seen that pasteurisation is very energy intensive when compared with a typical advanced disinfection treatment process train such as ultrafiltration (UF) + UV + ozone (~0.32 kWh/kL). Supplementation of the required energy with waste energy from co-generation is required to make pasteurisation competitive with this process train from an energy intensity perspective. Figure 7 shows that a pasteurisation wastewater plant that is run at a ΔT value of 2.3 °C would require all of Melbourne Water’s WTP current co-generation waste heat to be competitive with UF + UV + ozone treatment. If, however, the ΔT value were allowed to increase to the levels seen in the current trial (3.5 to 4 °C) slightly more than twice the current level of co-generation would be required to make pasteurization competitive with this process train from an energy intensity perspective.
Table 6.
Typical energy intensity of advanced water treatment technology (adapted from [31]).
Clearly, the economic viability of pasteurisation for this unfiltered secondary effluent application would depend largely on the available waste heat from co-generation and on the efforts required to keep a low ΔT. The costs associated with CIP and pre-treatment (e.g., coagulation, filtration) will be key determinants of this economic viability.
Future implementation of this technology will depend on like-for-like comparisons of this technology with current chlorination, ozonation and UV treatment in terms of economic viability and environmental footprint in a changing regulatory, economic and environmental landscape. This comparison must, however, be seen in the light of increasing environmental awareness and the probability that the harmful DBPs produced form chlorination and ozonation, and the greenhouse gas emissions associated with the high electricity requirements of UV treatment, will be more strictly regulated in the future. The pasteurisation process’s lack of production of harmful DBPs and ability to run on waste heat from on-site electricity generation from biogas may favour its future implementation.
5. Conclusions
FRNA phage were found to have a higher resistance to heat than viral pathogens, bacteria, protozoa and helminths and may serve as a good surrogate for enteric viruses, as conservative surrogates for bacteria, protozoa and helminths, and as good indicators of process performance. Enterococci and E. coli could serve as a conservative surrogate for bacteria in general, with Enterococci being a more conservative surrogate. E. coli could also serve as a conservative surrogate for protozoa and helminths.
Pilot scale (2ML/day) pasteurisation can be used to reduce the levels of pathogens in unfiltered secondary effluent wastewater to achieve high water quality standards. Challenge tests conducted over short periods of operation, using MS2 phage as process performance indicator and surrogate for pathogens of concern, showed that operation of the pilot plant with a contact time of 30 s (feed flowrate = 1100 L/min) and a temperature of 75 °C can achieve an average log reduction value of 5.0 for MS2 phage. The bottom 5th percentile LRV was found to be 4.0 under these conditions.
The impact of heat exchanger fouling on the efficiency of the WP process during the treatment of unfiltered secondary effluent was also studied. Small increases in the difference between the inlet wastewater temperature and the treated wastewater temperature (ΔT) resulting from heat exchanger fouling were found to markedly increase the energy requirement. These ΔT values were found to increase rapidly over the duration of the test period, indicating that the unfiltered secondary effluent used in this study had high fouling potential. The economic viability of pasteurisation for the current municipal application will depend largely on the available waste heat from co-generation and on the efforts and expense required to keep the ΔT low. The costs associated with pre-treatment (e.g., coagulation, filtration) to minimise the fouling potential of the feedwater and/or with the CIP requirements to maintain a low ΔT will be key determinants of the economic viability of the WP process.
Supplementary Materials
Australian National Data Service, Research Data Australia Registry, website: https://researchdata.ands.org.au/pasteurisation-production-class-recycled-water/671971.
Author Contributions
Conceptualization, J.B. and S.G.; formal analysis, P.S. and P.M.; funding acquisition, J.B. and S.G.; investigation, P.S., J.L., G.R. and A.S.; methodology, P.S., P.M., G.R., A.S., N.F. and S.G.; project administration, P.S. and S.G.; resources, J.B.; supervision, S.G.; writing—original draft, P.S. and P.M.; writing—review and editing, P.S., P.M., G.R., A.S., N.F., J.B. and S.G. All authors have read and agreed to the published version of the manuscript.
Funding
This research was funded by the Australian Water Recycling Centre of Excellence. Melbourne Water contributed to this research project as collaborating project partner. The Article Processing Charge was funded by Victoria University.
Acknowledgments
The authors would like to thank Melbourne Water for hosting the pilot plant trial.
Conflicts of Interest
The authors declare no conflicts of interest. The funders had no role in the design of the study; in the collection, analyses, or interpretation of data; in the writing of the manuscript, or in the decision to publish the results.
References
- Natural Resource Management Ministerial Council. Environment Protection and Heritage Council, Australian Health Minister’s Conference, Australian Government, Australian Guidelines for Water Recycling: Managing Health and Environmental Risks (Phase 1); Environment Protection and Heritage Council: Adelaide, South Australia, Australia, 2006.
- The Water Research Foundation, Leaders Innovation Forum for Technology. Available online: https://www.waterrf.org/news/pasteurization-technology-group (accessed on 1 June 2020).
- Salveson, A. Use of Pasteurization for Pathogen Inactivation for Ventura Water. In 2012 Guidelines for Water Reuse; EPA/600/R-12/618; US EPA Office of Research and Development: Washington, DC, USA, 2012; p. D-55. [Google Scholar]
- Da Costa, J.B.; Rodgher, S.; Daniel, L.A.; Espíndola, E.L. Toxicity on aquatic organisms exposed to secondary effluent disinfected with chlorine, peracetic acid, ozone and UV radiation. Ecotoxicology 2014, 23, 1803–1813. [Google Scholar] [CrossRef] [PubMed]
- Abou-Elela, S.I.; El-Sayed, M.M.H.; El-Gendy, A.S.; Abou-Taleb, E.M. Comparative Study of Disinfection of Secondary Treated Wastewater Using Chlorine, UV and Ozone. J. Appl. Sci. Res. 2012, 8, 5190–5197. [Google Scholar]
- Blatchley, E.R.; Hunt, B.A.; Duggirala, R.; Thompson, J.E.; Zhao, J.; Halaby, T.; Cowger, R.L.; Straub, C.M.; Alleman, J.E. Effects of disinfectants on wastewater effluent toxicity. Water Res. 1997, 31, 1581–1588. [Google Scholar] [CrossRef]
- Gray, N.F. Ozone Disinfection in Microbiology of Waterborne Disease, Microbial Aspects of Risks, 2nd ed.; Percival, S.L., Yates, P.V., Williams, D.W., Chalmers, R.M., Gray, N.F., Eds.; Academic Press: Cambridge, MA, USA, 2014; Chapter 33; pp. 599–615. [Google Scholar]
- Gray, N.F. Ultraviolet Disinfection in Microbiology of Waterborne Diseases, Microbial Aspects of Risks, 2nd ed.; Percival, S.L., Yates, P.V., Williams, D.W., Chalmers, R.M., Gray, N.F., Eds.; Academic Press: Cambridge, MA, USA, 2014; Chapter 34; pp. 617–630. [Google Scholar]
- Den Besten, H.M.W.; van der Mark, E.J.; Hensen, L.; Abee, T.; Zwietering, M.H. Quantification of the Effect of Culturing Temperature on Salt-Induced Heat Resistance of Bacillus Species. Appl. Environ. Microbiol. 2010, 76, 4286–4292. [Google Scholar] [CrossRef] [PubMed][Green Version]
- Juneja, V.K.; Altuntaş, E.G.; Ayhan, K.; Hwang, C.A.; Sheen, S. Mendel Friedman predictive model for the reduction of heat resistance of Listeria monocytogenes in ground beef by the combined effect of sodium chloride and apple polyphenols. Int. J. Food Microbiol. 2013, 164, 54–59. [Google Scholar] [CrossRef] [PubMed]
- Volkin, D.B.; Burke, C.J.; Marfia, K.E.; Oswald, C.B.; Wolanski., B.; Middaugh, C.R. Size and conformational stability of the hepatitis A virus used to prepare VAQTA, a highly purified inactivated vaccine. J. Pharm. Sci. 1997, 86, 666–673. [Google Scholar] [CrossRef] [PubMed]
- Institute of Food Technologists for the Food and Drug Administration of the U.S. Department of Health and Human Services, Kinetics of Microbial Inactivation for Alternative Food Processing Technologies. J. Food Sci. 2000, 65 (Suppl. S8), 16–31.
- Kaur, J.; Ledward, D.A.; Park, R.W.; Robson, R.L. Factors affecting the heat resistance of Escherichia coli O157:H7. Lett. Appl. Microbiol. 1998, 26, 325–330. [Google Scholar] [CrossRef] [PubMed]
- Shen, C.; Geornaras, I.; Belk, K.E.; Smith, G.C.; Sofos, J.N. Thermal Inactivation of Acid, Cold, Heat, Starvation, and Desiccation Stress–Adapted Escherichia coli O157:H7 in Moisture-Enhanced Nonintact Beef. J. Food Prot. 2011, 74, 531–538. [Google Scholar] [CrossRef] [PubMed]
- US EPA Office of Research and Development. 2012 Guidelines for Water Reuse; EPA/600/R-12/618; US EPA Office of Research and Development: Washington, DC, USA, 2012.
- Lau, M.; Monis, P.; Ryan, G.; Salveson, A.; Blackbeard, J.; Gray, S.; Sanciolo, P. Selection of surrogate pathogens and process indicator organisms for pasteurisation of municipal wastewater—A survey of literature data on heat inactivation of pathogens. Process. Saf. Environ. Prot. 2020, 133, 301–314. [Google Scholar] [CrossRef]
- Kahler, A.M.; Cromeans, T.L.; Roberts, J.M.; Hill, V.R. Source water quality effects on monochloramine inactivation of adenovirus, coxsackievirus, echovirus, and murine norovirus. Water Res. 2011, 45, 1745–1751. [Google Scholar] [CrossRef] [PubMed]
- King, B.J.; Keegan, A.R.; Robinson, B.S.; Monis, P.T. Cryptosporidium cell culture infectivity assay design. Parasitology 2011, 138, 671–681. [Google Scholar] [CrossRef] [PubMed]
- Jeska, E.L.; Caruso, J.P.; Donohue, M.J. Collection of fertile Ascaris suum eggs. J. Parasitol. 1986, 72, 964–965. [Google Scholar] [CrossRef] [PubMed]
- USEPA. Office of Water, Guidance Manual for Disinfection Profiling and Benchmarking; EPA 815-R-99-013; USEPA: Washington, DC, USA, 1999.
- Department of Health, Government of State of Victoria. Guidelines for Validating Treatment Processes for Pathogen Reduction-Supporting Class a Recycled Water Schemes in Victoria; Department of Health, Government of State of Victoria: Melbourne, Victoria, Australia, 2013.
- Cunault, C.; Burton, C.H.; Pourcher, A.M. The impact of fouling on the process performance of the thermal treatment of pig slurry using tubular heat exchangers. J. Environ. Manag. 2013, 117, 253–262. [Google Scholar] [CrossRef] [PubMed]
- Australian Energy Regulator. Report 14–20; Australian Energy Regulator: Melbourne, Australia, 2018.
- Moce-Llivina, L.; Muniesa, M.; Pimenta-Vale, H.; Lucena, F.; Jofre, J. Survival of Bacterial Indicator Species and Bacteriophages after Thermal Treatment of Sludge and Sewage. Appl. Environ. Microbiol. 2003, 69, 1452–1456. [Google Scholar] [CrossRef] [PubMed]
- Lang, N.L.; Smith, S.R. Time and temperature inactivation kinetics of enteric bacteria relevant to sewage sludge treatment processes for agricultural use. Water Res. 2008, 42, 2229–2241. [Google Scholar] [CrossRef] [PubMed]
- Sahlstrom, L.; Bagge, E.; Emmoth, E.; Holmqvist, A.; Danielsson-Tham, M.L.; Albihn, A. A laboratory study of survival of selected microorganisms after heat treatment of biowaste used in biogas plants. Bioresour. Technol. 2008, 99, 7859–7865. [Google Scholar] [CrossRef] [PubMed]
- Pasteurization Technology Group. Available online: https://www.ptgwe.com/wp-content/uploads/2017/08/Pasteurization_Melbourne-Water-and-WaterRF-Updates-WEFTEC-2015.pdf (accessed on 1 June 2020).
- USEPA. Office of Water, Membrane Filtration Guidance Manual; EPA 815-R-06-009; USEPA: Washington, DC, USA, 2005.
- Melbourne Water. 2018. Available online: https://medium.com/mark-and-focus/melbourne-water-harnessing-renewable-energy-b6aab6809b71 (accessed on 1 June 2020).
- GE—Jenbacker Gas Engines Technical Description. 2007. Available online: http://www.provincia.livorno.it/new/spawdocs/ambiente/Technical%20Description_AB%20Energy%20320.pdf (accessed on 1 June 2020).
- Hallet, C.K. Energy intensity of water: Literature suggests increasing interest despite limited and inconsistent data. In Proceedings of the ASME 2011 International Mechanical Engineering Congress & Exposition IMECE2011, Denver, CO, USA, 11–17 November 2011. [Google Scholar]
© 2020 by the authors. Licensee MDPI, Basel, Switzerland. This article is an open access article distributed under the terms and conditions of the Creative Commons Attribution (CC BY) license (http://creativecommons.org/licenses/by/4.0/).