Article

Flood Vulnerability Assessment for Prioritizing and Evaluating Rehabilitation of Ungauged Reservoirs Considering Climate Change

1
Department of Rural Systems Engineering, Seoul National University, Seoul 08826, Korea
2
Department of Rural Systems Engineering, Research Institute for Agriculture and Life Sciences, Institute of Green Bio Science and Technology, Seoul National University, Seoul 08826, Korea
3
Research Institute of Agriculture and Life Sciences, Seoul National University, Seoul 08826, Korea
4
Prediction Research Department, Climate Services and Research Division, APEC Climate Center, Busan 48058, Korea
5
Department of Agricultural and Biological Engineering & Tropical Research and Education Center, University of Florida, Homestead, FL 33031, USA
*
Author to whom correspondence should be addressed.
Water 2020, 12(7), 1901; https://doi.org/10.3390/w12071901
Submission received: 25 May 2020 / Revised: 25 June 2020 / Accepted: 29 June 2020 / Published: 3 July 2020
(This article belongs to the Special Issue Study for Ungauged Catchments—Data, Models and Uncertainties)

Abstract

:
The objective of this research was to apply the flood vulnerability assessment to ungauged reservoirs for prioritizing and evaluating the reservoir rehabilitation according to climate change. The flood vulnerability index (FVI) can quantitatively compare the flood vulnerabilities of the analysis targets and can be used for the relative comparison of hydraulic structures to determine the reinforcement priority. In this study, we proposed a simple FVI that contained exposure and adaptive capacity of the hydraulic structure. We selected ten dam heightening reservoirs in Korea and constructed data for flood vulnerability assessment. The FVI was calculated before and after the dam heightening to analyze the priority and effect of reservoir rehabilitation under climate change. Flood vulnerability indices were estimated for four periods (1995s: 1981–2010, 2025s: 2011–2040, 2055s: 2041–2070, 2085s: 2071–2100) and before/after the dam heightening project. As a result, flood vulnerability indices decreased after the dam heightening project for all reservoirs, and the indices have increasing tendencies in the future. The indices developed in this study can be useful to determine the priority and to evaluate the effect of rehabilitation for hydraulic structures.

1. Introduction

Flood damage has been increasing worldwide in the last ten years, and the flood and storms accounted for 68% of the total number of people affected by disaster in 2019 [1]. Under climate change, probability rainfall and design flood are expected to be increased in the future [2,3]. Most current dams have been constructed without considering future increases in rainfall due to climate change [4]. Rehabilitation of old hydraulic structures has been steadily required as extreme rainfall increases and land use changes due to climate change and anthropization [5,6,7]. There are many future climate change scenarios of global circulation models (GCMs) and representative concentration pathways (RCPs) [8]. For the reinforcement of hydraulic structures, the current and future flood vulnerabilities and the effects of reinforcement under climate change scenario must be analyzed in advance.
The flood vulnerability index (FVI) can quantitatively compare the flood vulnerabilities of the analysis targets and can be used for the relative comparison of hydraulic structures to determine the reinforcement priority. Assessing flood vulnerability is an essential step for effective risk reduction [9,10]. A flood vulnerability assessment needs to be carried out to support decision making in flood risk management to climate change [11,12]. The Intergovernmental Panel on Climate Change (IPCC) defined vulnerability as a concept that includes exposure, sensitivity, and adaptive capacity [13,14], and Balica et al. similarly defined vulnerability as a concept that includes exposure, susceptibility, and resilience [15]. We can reduce major exposure factors and enhance the necessary adaptability through vulnerability analysis [9,16].
The FVI can be used as a tool of decision making to determine and explore the correct actions to prevent flood disasters [11]. Various studies on flood vulnerability assessment have been carried out for the last few decades. FVI has been developed for various regions such as urban areas, rivers, oceans, and coastal cities [17,18,19,20,21]. Flood vulnerability assessment also has been carried out on a national and administrative level [10,21,22,23,24]. In each study, researchers selected indicators suitable for the target area, and the FVI was calculated by applying standardization and weighting methods of indicators.
For the calculation of FVI, indicators for exposure, sensitivity, and adaptive capacity should be selected, and the weight of each indicator should be calculated. Many studies have suggested methods for selecting, standardizing, and weighting indicators [15,25,26,27,28]. Studies have been carried out to reduce the complexity of calculating the FVI, either by reducing the number of indicators or by applying only exposure and sensitivity [11,29].
Several studies have been conducted for flood vulnerability analysis of reservoirs [29,30,31], but there is a lack of studies with FVI applied to compare flood vulnerabilities of hydraulic structures such as reservoirs and dams. The flood vulnerability index of hydraulic structures can be used to establish reinforcement plans for deteriorated structures. In particular, in the case of reservoirs with insufficient measurement data, a method is needed to determine the reinforcement priority by a relatively simple approach. Besides, it is necessary to evaluate the effectiveness of reservoir rehabilitation under climate change quantitatively.
This research aims to develop a simple FVI that contained exposure and adaptive capacity of the hydraulic structure and to apply the FVI to ungauged reservoirs to prioritize and evaluate reservoir rehabilitation under climate change. For these purposes, ten dam heightening reservoirs in Korea are selected, and the flood vulnerability indices are calculated before and after the dam heightening to analyze the priority and effect of reservoir rehabilitation under climate change. This article is organized as follows: Section 2 describes the materials and methods used for flood vulnerability assessment, Section 3 summarizes the application results of FVI to reservoirs in South Korea, and Section 4 introduces the conclusions of this study.

2. Materials and Methods

2.1. Flood Vulnerability Assessment for Ungauged Reservoirs

In order to determine the priority of reinforcement of the reservoir, it is necessary to analyze the water level data of the reservoir and analyze the frequency of exceeding the design flood level. However, many reservoirs have no water level data. A simple FVI using available data is required to determine the priority of reinforcement of ungauged reservoirs. Miranda et al. proposed a simple FVI that applied only exposure and sensitivity [29]. In this study, a simple FVI was developed that included only exposure and adaptive capacity to apply to ungauged reservoirs.
Figure 1 shows the procedure of flood vulnerability assessment in this study. Five indicators were selected to calculate flood vulnerability indices. Indicators are divided into climate exposure and adaptive capacity. Data collection and hydrologic modeling were performed to construct indicators. Three hourly rainfall data from 1981 to 2100 were collected from the Korea Meteorological Administration (KMA) and divided into four periods. Then, the rainfall probability and design flood were calculated, and reservoir simulation was also conducted. Indicators were standardized using the Z-score method, and the indicators’ weightings were estimated. After that, the sub-indices, climate exposure, and adaptive capacity were calculated, and then FVIs were calculated.

2.2. Selection of Indicators

We selected the indicators for climate exposure and adaptive capacity. Climate exposure represents the effects due to climate change, and adaptive capacity represents the extent to which the impact of climate change can be reduced [12]. Several indicators for climate change and adaptive capacity were defined and determined based on previous studies. Characteristics of rainfall and design flood were determined for climate change indicators, and flood control ratio was selected for the adaptive capacity indicator. The flood control ratio is the ratio of the difference between the peak inflow and the maximum discharge amount divided by the peak inflow. The flood control ratio indicates how much the reservoir reduces and discharges incoming floods [32].
Table 1 gives the selected indicators. CN80 is the average number of days with more than 80 mm of rainfall [12,33]. CX3h and CX24h are the maximum rainfalls for the 3-h and 24-h duration, respectively [12,16]. CF24h200y is the design flood of the reservoir watershed divided by watershed area (24-h duration and 200-year frequency). In most studies, only rainfall factors were selected as the climate exposure indicators, but we chose the design flood volume as one of the climate exposure indicators because the amount of flood discharge into the structure is important for hydraulic structures. FCR is the flood control ratio of the reservoir.

2.3. Construction of Indicators

Rainfall data for 1981–2100 were collected from the KMA to construct the selected indicators. KMA provided the future rainfall data generated based on HadGEM2-AO and HadGEM3-RA models as the GCM and regional climate model (RCM). IPCC released four RCP scenarios based on different greenhouse gas emissions in the fifth assessment report (AR5); RCP2.6, RCP4.5, RCP6.0, and RCP8.5. The RCP2.6 scenario is able to recover the Earth, the RCP4.5 scenario utilizes the policy of greenhouse gas reduction considerably, the RCP6.0 scenario materializes the same policy to some degree, and the RCP8.5 scenario emits greenhouse gases at the current trend [12,24]. We selected the RCP 4.5 scenario in assumption with a considerable reduction of greenhouse gas in the future. Rainfall data were divided into 1981–2010 (1995s), 2011–2040 (2025s), 2041–2070 (2055s), and 2071–2100 (2085s). The period 1995s was assumed as reference for present condition and 2025s, 2055s, and 2085s as indicative for future conditions for near, medium, and long-time horizons, respectively [34].
Bias correction is crucial in studies comparing the absolute values of climate data [34]. The KMA provided generated rainfall data on future period (2006–2100) and historical period (1950–2005) together. Generated historical rainfall data and observed data showed some bias, and Park et al. performed bias correction using the quantile mapping method based on the genericized extreme value (GEV) distribution for South Korea [12]. Park et al. [12] described specific methodologies and results of bias correction, and we used those bias-corrected rainfall data in this study.
Hydrologic modeling was conducted to construct indicators. Rainfall probability was calculated using the FARD2006 program. FARD 2006 is a frequency analysis of rainfall data in 2006, and it was developed in Korea. The method of probability-weighted moments and the Gumbel distribution was used, and Huff’s method was applied for the time distribution of rainfall. Design flood was calculated using HEC-HMS, which is the Hydrologic Engineering Center-Hydrologic Modeling System. It was developed by the US Army Corps of Engineers. Initial loss and direct runoff were calculated using the NRCS CN method and Clark unit hydrograph. Design floods were used as inflows of reservoir simulation. Reservoir simulation was performed by the HEC-5 model, which was also developed by the US Army Corps of Engineers. The hourly outflow and water stage were calculated from reservoir simulation, and the flood control ratio was also calculated using Equation (1).
Flood   control   ratio   ( % ) = ( Peak   inflow Peak   outflow ) Peak   inflow × 100 ( % )

2.4. Assessment of Flood Vulnerability

2.4.1. Standardization

Selected indicators for climate exposure and adaptive capacity have different ranges and units, respectively. Therefore, it is necessary to standardize each flood risk indicator for a consistent flood risk assessment. [12].
In this study, the standardization of flood hazard indicators was carried out through the Z-score method. The Z-score method is the most commonly used method of converting individual data into a standard regular distribution with an average of zero and a standard deviation of one. The random variable Z represents the value of the data with Equation (2):
Z = x     μ σ
where μ is the population mean, and σ is the population standard deviation.

2.4.2. Principal Component Analysis

In order to comprehensively determine standardized flood risk indicators, it is necessary to calculate comprehensive indicators that can represent each index. Principal component analysis (PCA) is a multivariate analysis method that systematically summarizes multiple data by reducing high-dimensional data to low-dimensional data through linear combination and orthogonal transformation of the data. PCA analyzes multivariate data that correlate with each other through correlation analysis, minimizes the loss of information held by each data, and simultaneously reduces the number to generate composite indicators [12,19,35]. In this study, we determined the composite index for the comprehensive estimation of climate exposure indicators.
Equation (3) briefly defines the PCA method:
u i = j = 1 N C ij X ij
where u i denotes ith PCs, N   is the number of indicators, C ij is a coefficient that meets the condition of j = 1 N C j 2 = 1 , and X ij is a variable. The coefficient, C ij , is determined to maximize the variance of the composed variable,   u .
Each principal component (PC) determined through a PCA can be analyzed by factor matrix to the extent to which the principal component expresses the individual data. This assessment is based on either expansion power or variation power. The explanatory power expresses how much of the variance of the composite component can be accounted for. In this study, we extracted the PC to account for more than 80% [19,36]. We conducted PCA to calculate the PC scores for indicators of climate exposure in 1995s. We employed Varimax rotation as the rotation method. The component matrix calculated through PCA was selected as the weight for each index and was applied in future periods (2025s, 2055s, and 2085s). SPSS (IBM SPSS Statistics, Version 21, Armonk, NY, USA) was used to execute PCA.

2.4.3. Flood Vulnerability Assessment

The FVI was calculated by multiplying each standardized flood risk index by the weight calculated through the analysis of principal components. Indices of climate exposure and adaptive capacity were calculated by multiplying each indicator by the component matrix calculated by PCA as given in Equations (4) and (5). The FVI was calculated by subtracting the adaptive capacity index from climate exposure index, resulting in Equation (6):
Climate   exposure   index = a 1 × indicator + a 2 × indicator + + a n × indicator
Adaptive   capacity   index = b 1 × indicator + b 2 × indicator + + b n × indicator
Flood   vulnerability = α × climate   exposure β × adaptive   capacity
where a i ,   b i is the weighting of each indicator and α ,   β is the weighting of climate exposure, adaptive capacity index. We calculated the weightings of indicators by PCA and applied one each as the weightings of indices in this study.

3. Application and Discussion

3.1. Project Reservoirs

In South Korea, 74% of agricultural reservoirs are more than 40 years old [32], and the capacities have decreased substantially. As part of reservoir reinforcement, the dam heightening project has been carried out for approximately 110 reservoirs. In this study, the FVI before and after the dam heightening was calculated for the dam heightened reservoirs, and the applicability of the FVI for prioritizing and evaluating rehabilitation of ungauged reservoirs was evaluated.
Ten reservoirs (Bangye, Tapjung, Baekgok, Jangchan, Samga, Jipyung, Jangsung, Naju, Damyang, and Baekyong) were selected to assess flood vulnerability changes due to dam heightening. Figure 2 shows the locations of the studied reservoirs in South Korea, and Table 2 gives their characteristics before and after the dam heightening and the nearest weather stations for rainfall data collection. We selected ten reservoirs in consideration of the size, location, and ease of data construction. The ten reservoirs are distributed over the four major rivers in Korea (Han, Geum, Nakdong, and Youngsan river), each located in a different watershed. The rehabilitation projects of study reservoirs were carried out between 2011 and 2015. The upstream basin area of the target reservoirs is from 513 ha to 21,880 ha, and the total reservoir volume is 2.83 million tons to 10.76 million tons after the dam heightening.

3.2. Construction of Indicators

3.2.1. Climate Exposure Indicators

Table 3 presents the detailed results of climate indicator construction. The maximum, minimum, average value and standard deviation of each indicator of ten reservoirs were calculated by period. Climate exposure indicators show increasing tendencies in the future. CN80, CX3h, and CX24 were shown to increase gradually in the future, with the mean, maximum, and minimum values all being the largest at 2085s. CF24h200y showed the largest mean value in 1995s and will gradually increase in future periods. The maximum and minimum values of CF24h200y are the largest at 2055s and 2085s, respectively.

3.2.2. Adaptive Capacity Indicators

Table 4 gives adaptive indicators for four periods and reservoirs. The average flood control ratios before and after dam heightening of the ten reservoirs were 27.3% and 48.9%, respectively. The maximum and minimum values of the average flood control ratio before the dam heightening were found in Damyang and Baekgok, respectively. The maximum and minimum values of the average flood control rate after weir elevation were found in Jangchan and Tapjung, respectively, and the effect of weir elevation was different for each reservoir.
Figure 3 compares the flood control ratios before and after the dam heightening of reservoirs by period. The flood control ratio increased after dam heightening at all periods. Jangchan has the largest increase in flood control ratio with a 100 percent flood control ratio after the dam rehabilitation. After the dam heightening, the 200-year frequency flood volume can be 100 percent storage in Jangchan. Tapjung and Baekgok’s flood control ratios increased slightly compared to other reservoirs.
Figure 4 shows box plots of flood control ratios before and after the dam heightening by period. The adaptive capacity indicator, which is the flood control ratio, has been increased after the dam heightening because peak outflows have been decreased after the dam heightening at all periods. The distribution range of flood control ratio increased after dam rehabilitation.

3.3. Assessment of Flood Vulnerability

3.3.1. Principal Component Analysis

PCA was performed to calculate the weight of the climate exposure indicators. Table 5 and Figure 5 show the results of PCA for the climate exposure index. The total variance of the first and second PCs explains most of the indicators; the total variances of the first and second PCs were 64.7% and 25.2%. Figure 6 shows that CN80, CX3h, and CX24h were the main indicators in the first PC, and CF24h20y was the second PC’s main indicator.

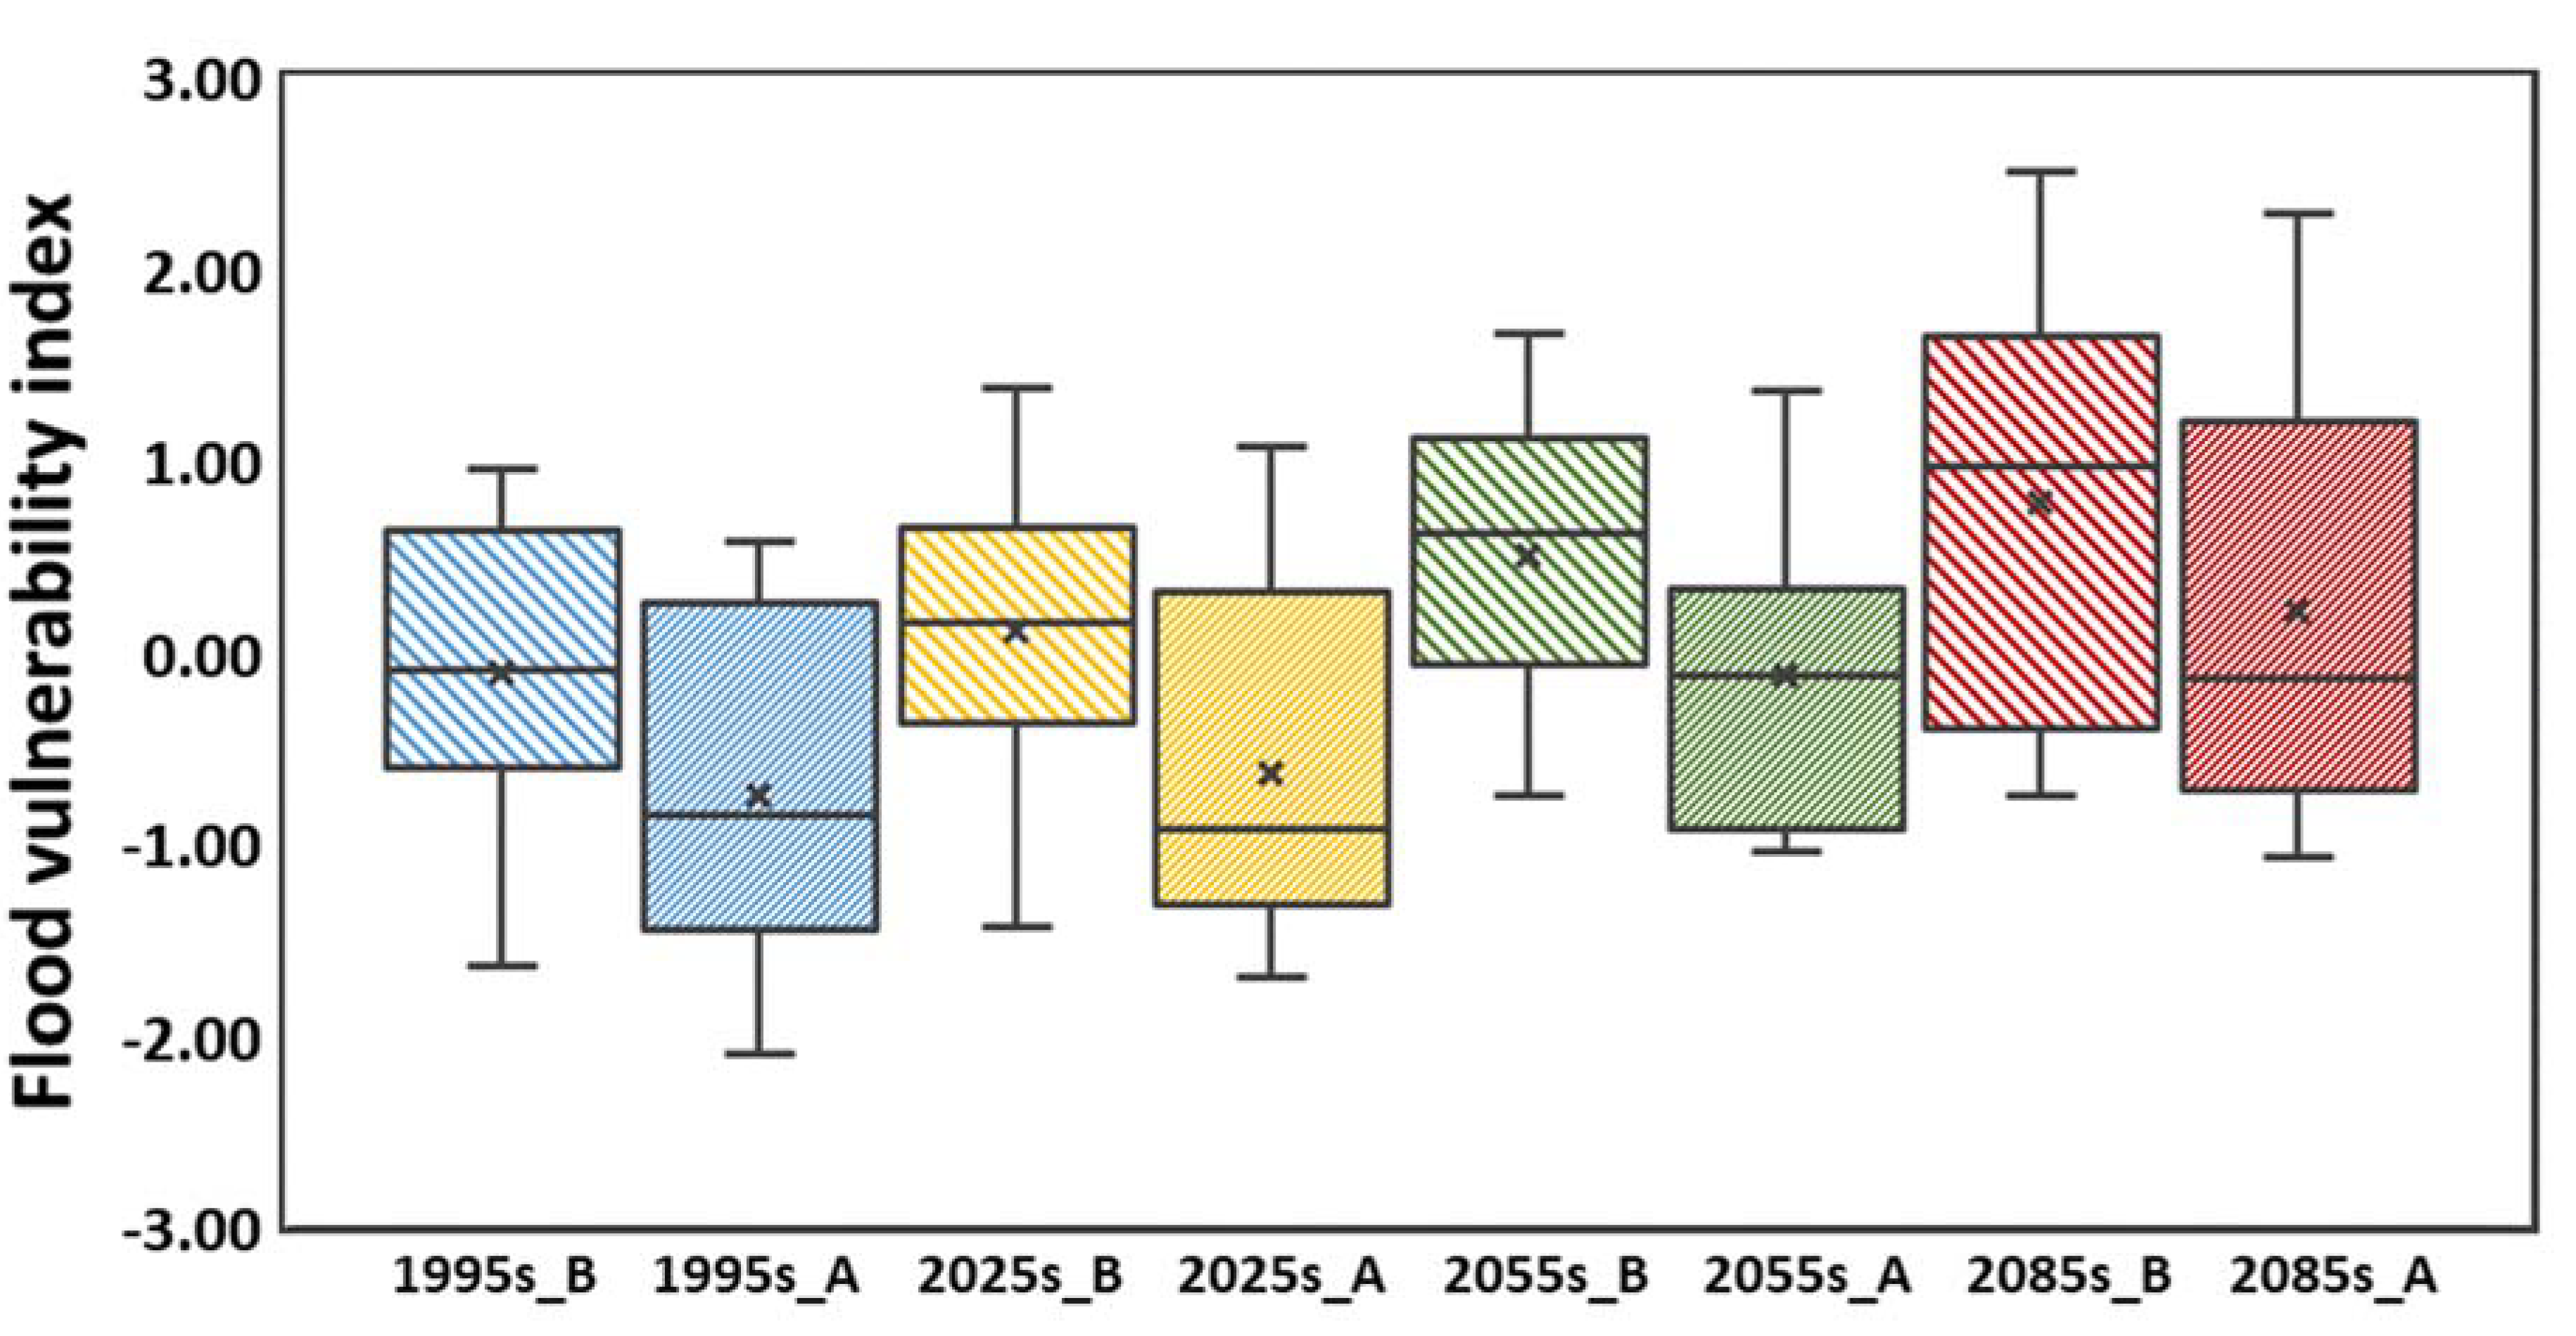
3.3.2. Flood Vulnerability Indices.

Table 6 shows the results of FVI calculations. The mean FVIs before dam heightening were −0.11, 0.11, 0.51, and 0.79 at 1995s, 2025, 2055s, and 2085s, respectively, and the mean FVIs after dam heightening were −0.75, −0.63, −0.12, and 0.21 at 1995s, 2025s, 2055s and 2085s, respectively. In the future, FVIs increased as precipitation and flood discharge increased, and after dam heightening, FVIs decreased as FCRs increased. Before and after the dam heightening, Baekgok had the highest FVI, and Damyang had the lowest FVI. Baekgok’s FCR belongs to the lowest, and Damyang’s FCR is the highest of the ten reservoirs. The average FVI decreased 1.11 from 0.79 to −0.32, before and after the dam heightening.
Figure 6 represents the FVI of each reservoir before dam heightening. All reservoirs except Jangchan, Jangsung, and Naju had the highest FVI value at 2085s. FVI showed a gradual increase in the future, and the average FVI increased by 0.90 compared to 1995s in the 2085s. Jangchan showed the largest increase in FVI with 1.91, while Baekyong showed the smallest increase in FVI with 0.36 in the future. The rehabilitation priority was determined to show that Baekgok had the highest priority in 1995s, 2025s, and 2085s based on the FVI calculated in this study. In 2055s, Jangchan had the highest priority. A priority of reservoir reinforcement by FVI was found to vary by period. Therefore, when deciding priorities for reinforcement of reservoirs, it seems that the vulnerability of the future should be considered as well as the vulnerability of the past.
Figure 7 shows the FVI of each reservoir after dam heightening. All reservoirs except Jangchan, Jangsung, Naju, and Damyang had the highest FVI value at 2085s. FVI showed a gradual increase in the future, as before dam heightening, and the average FVI increased 0.96 compared to 1995s in the 2085s. Samga showed the largest increase in FVI with 2.08, while Naju showed the smallest increase in FVI with 0.30 in the future. As climate exposure indicators increased in the future, FVI also appeared to increase before and after the rehabilitation.
Figure 8 shows changes in the FVI before and after the dam heightening of each reservoir. FVI decreased in all reservoirs after dam heightening, and the mean FVI before and after dam heightening was 0.33 and −0.32, respectively. Jangchan’s FVI decreased by 1.99 on average over all periods, showing the greatest flood reduction effect of the rehabilitation. Jangchan has the largest increase in FCR due to the dam heightening, and the FVI seems to reflect this FCR increase well. On the contrary, Jangsung’s FVI decreased by 0.08 on average for all periods, showing the smallest flood reduction effect. Figure 9 shows box plots of FVIs before and after dam heightening by period. The FVIs have been decreased after dam heightening for all reservoirs, and variances have been increased.

4. Conclusions

In this article, the reservoir flood vulnerability changes caused by dam heightening in reservoirs were evaluated for prioritizing and evaluating the reservoir rehabilitation according to climate change. Ten agricultural reservoirs in the Korean peninsula were selected for flood vulnerability assessment. Flood vulnerability indices were estimated considering four periods (1995s: 1981–2010, 2025s: 2011–2040, 2055s: 2041–2070, 2085s: 2071–2100) and before/after the dam heightening project.
A simple FVI was developed that included only exposure and adaptive capacity to apply to ungauged reservoirs. Five indicators were selected to calculate flood vulnerability indices. Indicators are divided into climate exposure and adaptive capacity. Data collection and hydrologic modeling were performed to construct indicators. Indicators were standardized using the Z-score method, and the indicators’ weightings were estimated. After that, the sub-indices, climate exposure, and adaptive capacity were calculated, and then flood vulnerability indices were calculated.
Flood vulnerability indices decreased after the dam heightening project for all reservoirs, while indices have increasing tendencies in the future. The priority of reservoir reinforcement by FVI was found to vary by period. Therefore, when deciding priorities for reinforcement of reservoirs, it seems that the vulnerability of the future should be considered as well as the vulnerability of the past. The flood reduction effect of the dam heightening was analyzed through the difference of FVI before and after the rehabilitation. It was confirmed that the effect of dam heightening was different by reservoir and period.
The FVI has not been widely used for hydraulic structures such as reservoirs and dams. In order to prioritize and analyze the effect of reservoir rehabilitation, various processes such as observation data analysis and complex modeling are required. In this study, a simple FVI that can be applied to reservoirs with insufficient observation data was developed, and its applicability was analyzed. The FVI developed in this study is expected to be used for basic analysis for prioritizing rehabilitation among a number of reservoirs. It can also be used to analyze the effect of reservoir reinforcement. In this study, only relative comparisons by period and reservoir were performed through FVI. Therefore, further research is needed to establish a quantitative standard for FVI in the future.

Author Contributions

S.-M.J. and J.P. calculated flood vulnerability indices and prepared the manuscript. M.-S.K. supervised the research and revised the manuscript along with J.-H.S. and S.H. All authors have read and agreed to the published version of the manuscript.

Funding

This research was funded by Korea Ministry of Environment (MOE) as “Public Technology Program based on Environmental Policy”, grant number 2016000200001.

Conflicts of Interest

The authors declare no conflicts of interest.

References

  1. CRED (Centre if Research on the Epidemiology of Disasters). CRED Crunch 58—Disaster Year in Review (2019); CRED: Brussels, Belgium, 2020. [Google Scholar]
  2. Kim, N.W.; Lee, J.-Y.; Park, D.-H.; Kim, T.-W. Evaluation of future flood risk according to RCP scenarios using a regional flood frequency analysis for ungauged watersheds. Water 2019, 11, 992. [Google Scholar] [CrossRef] [Green Version]
  3. Kundzewicz, Z.W.; Kanae, S.; Seneviratne, S.I.; Handmer, J.; Nicholls, N.; Peduzzi, P.; Mechler, R.; Bouwer, L.M.; Arnell, N.; Mach, K.; et al. Flood risk and climate change: Global and regional perspectives. Hydrol. Sci. J. 2014, 59, 1–28. [Google Scholar] [CrossRef] [Green Version]
  4. Chernet, H.H.; Alfredsen, K.; Midttomme, G.H. Safety of hydropower dams in a changing climate. J. Hydrol. Eng. 2014, 19, 569–582. [Google Scholar] [CrossRef]
  5. Choi, J.H.; Yoon, T.H.; Kim, J.S.; Moon, Y.I. Dam rehabilitation assessment using the Delphi-AHP method for adapting to climate change. J. Water Resour. Plan. Manag. 2018, 144, 1–8. [Google Scholar] [CrossRef]
  6. Lee, G.J.; Park, K.W.; Jung, Y.H.; Jung, I.K.; Jung, K.W.; Jeon, J.H.; Lee, J.M.; Lim, K.J. Analysis of flood control effects of heightening of agricultural Reservoir Dam. J. Korean Soc. Agric. Eng. 2013, 55, 83–93. [Google Scholar] [CrossRef] [Green Version]
  7. Bolognesi, T. The water vulnerability of metro and megacities: An investigation of structural determinants. Nat. Resour. Forum. 2015, 39, 123–133. [Google Scholar] [CrossRef]
  8. Kim, W.; Lee, J.; Kim, J.; Kim, S. Assessment of water supply stability for drought-vulnerable boryeong multipurpose dam in South Korea using future dry climate change scenarios. Water 2019, 11, 2403. [Google Scholar] [CrossRef] [Green Version]
  9. Füssel, H.-M.; Klein, R.J.T. Climate change vulnerability assessments: An evolution of conceptual thinking. Clim. Chang. 2006, 75, 301–329. [Google Scholar] [CrossRef]
  10. Kablan, M.K.A.; Dongo, K.; Coulibaly, M. Assessment of social vulnerability to flood in urban côte d’Ivoire using the MOVE framework. Water 2017, 9, 292. [Google Scholar] [CrossRef]
  11. Balica, S.F.; Wright, N.G. Reducing the complexity of the flood vulnerability index. Environ. Hazards 2010, 9, 321–339. [Google Scholar] [CrossRef]
  12. Park, J.; Kang, M.S.; Song, I. Assessment of flood vulnerability based on CMIP5 climate projections in South Korea. J. Am. Water Resour. Assoc. 2015, 51, 859–876. [Google Scholar] [CrossRef]
  13. IPCC (Intergovernmental Panel on Climate Change). Climate Change 2007: Impacts, Adaption and Vulnerability; Cambridge University Press: Cambridge, UK, 2007. [Google Scholar]
  14. Marzi, S.; Mysiak, J.; Santato, S. Comparing adaptive capacity index across scales: The case of Italy. J. Environ. Manag. 2018, 223, 1023–1036. [Google Scholar] [CrossRef] [PubMed]
  15. Balica, S.F.; Douben, N.; Wright, N.G. Flood vulnerability indices at varying spatial scales. Water Sci. Technol. 2009, 60, 2571–2580. [Google Scholar] [CrossRef]
  16. ME (Ministry of Environment). Vulnerability Map by Sector to Climate Change; Ministry of Environment: Sejong, Korea, 2012. [Google Scholar]
  17. Balica, S.F.; Wright, N.G.; Van der Meulen, F. A flood vulnerability index for coastal cities and its use in assessing climate change impacts. Nat. Hazards 2012, 64, 73–105. [Google Scholar] [CrossRef] [Green Version]
  18. Karmaoui, A.; Balica, S.A. new flood vulnerability index adapted for the pre-Saharan region. Int. J. River Basin Manag. 2019. [Google Scholar] [CrossRef]
  19. Ryu, J.H.; Kang, M.S.; Jun, S.M.; Park, J.; Lee, K.D. Future inundation characteristics analysis for the cheongmi stream watershed considering non-stationarity of precipitation. J. Korean Soc. Agric. Eng. 2017, 59, 81–96. [Google Scholar]
  20. NIMR (National Institute of Meteorological Research). Climate Change Scenario Report for IPCC AR5; 11-1360395-000233-01; National Institute of Meteorological Research, Climate Research Division: Seoul, Korea, 2011. [Google Scholar]
  21. Nasiri, H.; Yusof, M.J.M.; Ali, T.A.M.; Hussein, M.K.B. District flood vulnerability index: Urban decision-making tool. Int. J. Environ. Sci. Technol. 2019, 16, 2249–2258. [Google Scholar] [CrossRef] [Green Version]
  22. Brooks, N.; Neil, A.W.; Mick, K.P. The Determinants of vulnerability and adaptive capacity at the national level and the implications for adaptation. Glob. Environ. Chang. 2005, 15, 151–163. [Google Scholar] [CrossRef]
  23. Fraser, E.D.G.; Simelton, E.; Termansen, M.; Gosling, S.N.; South, A. “Vulnerability hotspots”: Integrating socio-economic and hydrological models to identify where cereal production may decline in the future due to climate change induced drought. Agric. For. Meteorol. 2013, 170, 195–205. [Google Scholar] [CrossRef]
  24. Moss, R.; Babiker, M.; Brinkman, S.; Calvo, E.; Carter, T.; Edmonds, J.; Elgizouli, I.; Emori, S.; Erda, L.; Hibbard, K.; et al. Towards New Scenarios for Analysis of Emissions, Climate Change, Impacts, and Response Strategies; Technical Summary; Intergovernmental Panel on Climate Change: Geneva, Switzerland, 2008. [Google Scholar]
  25. Balica, S.F.; Popescu, I.; Beevers, L.; Wright, N.G. Parametric and physically based modelling techniques for flood risk vulnerability assessment: A comparison. J. Environ. Model. Softw. 2013, 41, 84–92. [Google Scholar] [CrossRef]
  26. Koks, E.E.; Jongman, B.; Husby, T.G.; Botzen, W.J.W. Combining hazard, exposure and social vulnerability to provide lessons for flood risk management. Environ. Sci. Policy 2015, 47, 42–52. [Google Scholar] [CrossRef]
  27. Hurd, B.; Leary, N.; Jones, R.; Smith, J. Relative regional vulnerability water resources to climate change. J. Am. Water Resour. Assoc. 1999, 35, 1399–1409. [Google Scholar] [CrossRef]
  28. Feteke, A.; Damm, M.; Birkmann, J. Scales as a challenge for vulnerability assessment. Nat. Hazards 2010, 55, 729–747. [Google Scholar] [CrossRef]
  29. Miranda, F.N.; Ferreira, T.M. A simplified approach for food vulnerability assessment of historic sites. Nat. Hazards 2019, 96, 730–913. [Google Scholar] [CrossRef]
  30. Chen, J.; Zhong, P.; Wang, M.; Zhu, F.; Wan, X.; Zhang, Z. A risk-based model for real-time flood control operation of a cascade reservoir system under emergency conditions. Water 2018, 10, 167. [Google Scholar] [CrossRef] [Green Version]
  31. Chen, Y.; Lin, P. The total risk analysis of large dams under flood hazards. Water 2018, 10, 140. [Google Scholar] [CrossRef] [Green Version]
  32. Jun, S.M.; Kang, M.S.; Song, I.; Hwang, S.H.; Kim, K.; Park, J. Effects of agricultural reservoir rehabilitation on their flood control capacities. J. Korean Soc. Agric. Eng. 2013, 55, 57–68. [Google Scholar] [CrossRef]
  33. Koh, K.J. A Study on Vulnerability Assessment to Climate Change in Gyeonggi-Do; Gyeonggi Research Institute: Suwon, Korea, 2009. [Google Scholar]
  34. Reder, A.; Iturbide, M.; Herrera, S.; Rianna, G.; Mercogliano, P.; Gutiérrez, J.M. Assessing variations of extreme indices inducing weather-hazards on critical infrastructures over Europe—The INTACT framework. Clim. Chang. 2018, 148, 123–138. [Google Scholar] [CrossRef] [Green Version]
  35. Jung, Y.; Choi, M. Survey-based approach for hydrological vulnerability indicators due to climate change: Case study of small-scale rivers. J. Am. Water Resour. Assoc. 2012, 48, 256–265. [Google Scholar] [CrossRef]
  36. Yujun, Y.; Zhifeng, Y.; Shanghong, Z. Ecological risk assessment of heavy metals in sediment and human health risk assessment of heavy metals in fishes in the middle and lower reaches of the Yangtze River basin. Environ. Pollut. 2011, 159, 2575–2585. [Google Scholar] [CrossRef]
Figure 1. Procedure of flood vulnerability assessment in this study. Refer to Table 1 for CN80, CX3h, CX24h, and CF24h200y.
Water 12 01901 g001
Figure 2. Reservoirs selected for assessment of flood vulnerability in South Korea.
Water 12 01901 g002
Figure 3. Comparison of flood control ratio before and after dam heightening of for ten reservoirs under climate change. B stands for before dam heightening and A stands for after dam.
Water 12 01901 g003aWater 12 01901 g003b
Figure 4. Box plots of flood control ratio before and after dam heightening by period. B stands for before dam heightening and A stands for after dam.
Water 12 01901 g004
Figure 5. Factor loadings of climate exposure for the first and second principal component. PC stands for principal component.
Water 12 01901 g005
Figure 6. Calculation results of flood vulnerability indices for ten reservoirs before dam heightening under climate change. B stands for before dam heightening
Water 12 01901 g006
Figure 7. Calculation results of flood vulnerability indices for ten reservoirs after dam heightening under climate change. A stands for after dam heightening.
Water 12 01901 g007
Figure 8. Comparison of flood vulnerability indices before and after dam heightening of for ten reservoirs under climate change. B stands for before dam heightening and A stands for after dam.
Water 12 01901 g008
Figure 9. Box plots of flood vulnerability indices before and after dam heightening by period. B stands for before dam heightening and A stands for after dam.
Water 12 01901 g009
Table 1. Indicators for climate exposure and adaptive capacity.
IndicatorDescriptionIndexSource
CN80Average number of days >80 mm (day)Climate exposure [12,33]
CX3hMaximum rainfall for 3-h duration (mm) [12]
CX24hMaximum rainfall for 24-h duration (mm) [12,16]
CF24h200yDesign flood of reservoir watershed divided by watershed area (mm/day)
(24-h duration, 200-year frequency)
FCRFlood control ratio of reservoir (%)Adaptive capacity
Table 2. Characteristics of selected reservoirs.
RiverReservoirWeather StationWatershed Area (ha)Total Water Storage Volume (104 m3)
Before Dam HeighteningAfter Dam HeighteningRate of Increase (%)
HanBangyeWonju2500174.6283.462.3
GeumTapjungGeumsan21,8803192.73664.714.8
BaekgokChungju84792175.02661.822.4
JangchanChupungryung513425.6539.026.6
NakdongSamgaYoungju2425408.6529.329.5
JipyungMoonkyung2556275.8381.238.2
YoungsanJangsungGwangju12,2809006.59989.810.9
Naju 84609132.010,756.017.8
Damyang 65606667.67506.812.6
Baekyong 2730248.0380.453.4
Table 3. Climate exposure indicators by periods under the representative concentration pathways (RCP) 4.5 scenario.
IndicatorUnit1995s
Max.
Ave. ± SD
Min.
2025s
Max.
Ave. ± SD
Min.
2055s
Max.
Ave. ± SD
Min.
2085s
Max.
Ave. ± SD
Min.
CN80day2.4 2.7 3.3 3.9
1.4 ±0.51.8±0.62.1±0.82.5±0.9
0.8 0.9 1.1 1.2
CX3hmm57.1 68.8 98.4 102.6
44.9±6.057.4±8.568.9±16.276.3±16.1
37.0 45.6 46.1 54.3
CX24hmm142.5 184.6 218.2 271.7
124.7±14.2153.3±21.8179.8±27.6191.4±47.2
105.2 117.7 142.1 145.6
CF24h200ymm/day1234.2 881.1 1500.6 1466.8
981.1±236.1698.7±122.8835.5±256.5917.4±258.8
535.8 385.0 503.2 593.9
Refer to Table 1 for CN80, CX3h, CX24h, and CF24h200y.
Table 4. Adaptive capacity indicators for four periods and reservoirs.
Flood Control Ratio (FCR) (%)
Before Dam HeighteningAfter Dam Heightening
Period1995s2025s2055s2085sAvg.1995s2025s2055s2085sAvg.
Bangye13.113.212.812.913.028.259.642.330.040.0
Tapjung0.10.116.60.14.24.90.721.17.38.5
Baekgok0.74.40.28.23.413.214.70.215.310.9
Jangchan38.536.230.631.034.1100.0100.0100.0100.0100.0
Samga15.214.814.014.014.553.747.229.628.539.8
Jipyung23.019.420.921.821.352.435.242.146.844.1
Jangsung48.836.639.248.543.350.340.442.550.245.9
Naju39.620.925.039.531.364.456.158.064.460.7
Damyang80.181.581.280.180.785.986.086.085.986.0
Baekyong25.029.428.625.127.045.562.258.745.653.0
Ave.28.425.726.928.127.349.950.248.147.448.9
Table 5. Matrix of factor loadings of climate exposure.
IndicatorFirst Principal Component
64.7% *
Second Principal Component
25.2% *
CN800.8810.065
CX3h0.909−0.096
CX24h0.9930.018
CF24h200y0.0130.998
Refer to Table 1 for CN80, CX3h, CX24h, and CF24h200y. * Total variance explained.
Table 6. Flood vulnerability indices before and after dam heightening by periods.
Before Dam HeighteningAfter Dam Heightening
Period1995s2025s2055s2085sAvg.1995s2025s2055s2085sAvg.
Bangye0.640.430.720.940.680.18−0.97−0.170.42−0.14
Tapjung0.630.641.042.161.120.490.620.911.940.99
Baekgok0.961.381.372.511.560.581.071.372.301.33
Jangchan−0.240.221.661.480.78−2.09−1.70−0.43−0.60−1.21
Samga0.040.090.611.400.53−1.12−0.880.140.96−0.23
Jipyung−0.060.690.641.010.57−0.940.220.000.25−0.12
Jangsung−0.67−0.710.02−0.60−0.49−0.72−0.82−0.08−0.65−0.57
Naju−0.580.01−0.03−0.32−0.23−1.33−1.05−1.02−1.07−1.12
Damyang−1.64−1.44−0.75−0.74−1.14−1.82−1.57−0.90−0.92−1.30
Baekyong−0.13−0.25−0.140.11−0.10−0.75−1.24−1.05−0.51−0.89
Ave.−0.110.110.510.790.33−0.75−0.63−0.120.21−0.32

