Article

How Different Are Manometric, Gravimetric, and Automated Volumetric BMP Results?

1
DEEP Laboratory–Wastes Water Environment Pollution, INSA-Lyon, Université de Lyon, EA 7429, 9 Rue de la Physique, CEDEX, F-69621 Villeurbanne, France
2
Hafner Consulting LLC, Reston, VA 20191, USA
3
Arkolia Energies, 16 Rue des Vergers, F34130 Mudaison, France
*
Author to whom correspondence should be addressed.
Water 2020, 12(6), 1839; https://doi.org/10.3390/w12061839
Submission received: 15 May 2020 / Revised: 23 June 2020 / Accepted: 24 June 2020 / Published: 26 June 2020

Abstract

:
The objectives of this study were to: (1) quantify differences in biochemical methane potential (BMP) measured using three measurement methods, including two popular methods (a commercial automated system (AMPTS II) and manual manometric) and one newer method (gravimetric), and (2) assess the importance of the mixing position in the measurement sequence. Powdered microcrystalline cellulose was used as the substrate in simultaneous tests. All methods gave similar results (<8% difference in the mean BMP) and were reasonably accurate (recovery of 80–86% of the theoretical maximum BMP). Manometric BMP values were consistently lower than gravimetric by 4–5%. Precision was lower for the automated method (relative standard deviation (RSD) of about 7%) than for the manual methods (RSD about 1–3%). Mixing after biogas measurement resulted in 3% higher BMP for both manual methods than mixing before, due to the lower measured CH4 production from blanks. This effect may be linked to a fraction of CH4 that remains dissolved or even as attached bubbles, and suggests that mixing before measurement is preferable. The automated volumetric and gravimetric methods (mode 2) gave very similar mean BMP values (1% different). However, kinetic analysis showed that methane production was faster with the automated volumetric method. This could come from an error in the estimation of the CH4 production rate for the automated method, or an increase in the degradation rate due to better mixing. Both automatic volumetric and manual gravimetric measurements met current validation criteria for mean cellulose BMP, but the RSD from the automated system exceeded the limit.

1. Introduction

Anaerobic digestion is a common technology for organic waste treatment. It produces biogas and digestate (used as fertilizer) from agricultural, municipal, and industrial wastes. Biogas, which is mainly composed of CH4 and CO2, represents an important source for renewable energy recovered from waste. In Europe, an increasing trend in biogas production has been observed in the past decades: From 92 PJ biogas produced in 2000 to 654 PJ in 2015 [1].
The biochemical methane potential (BMP) is the maximum CH4 yield for a specific substrate, usually measured in batch laboratory tests. It is expressed in mL CH4 under standard temperature and pressure (STP) conditions (0 °C, 1 atm) per amount of organic material added (volatile solids (VS) or chemical oxygen demand (COD) basis). BMP is widely used for research but also for the design and management of anaerobic digestion plants (with all necessary precautions [2]). BMP tests have thus been considered a key issue for several years [3,4].
Even though some guidelines were published since 2006 [3,5,6] and different interlaboratory tests have been performed, there is no standard method for BMP measurement [7]. Variability in BMP measured by different methods in different laboratories is a significant problem, as shown by round robin tests [6,8,9]. Various explanations for the observed differences have been proposed, including measurement errors and differences among inocula, as recently reviewed [6,10,11,12]. A recent large interlaboratory study found evidence that differences among measurement methods are important [6]. Therefore, learning more about differences between measurement methods could lead to improvements in BMP standardization, and this was the focus of the current paper.
Indeed, several techniques can be used. The most common methods to date are the manometric and the volumetric methods [13,14,15]. More recently, a gravimetric method has also been successfully proposed [16,17]. The manometric method is based on measurement of the headspace pressure and composition as biogas accumulates within a constant headspace volume. Caution must be paid to venting regularly in order to prevent high pressure, which could affect the results [18]. On the other hand, in volumetric methods, the biogas volume is typically measured at constant (or nearly constant) pressure [13,14]. The gravimetric method is based on the measurement of the mass loss as a result of biogas removal. In this case, the biogas produced is vented at the end of each incubation interval and the bottle is weighed afterwards [16].
As indicated by Himanshu et al. [19], manometric methods can be influenced by differences in the headspace volume in the incubation bottle and/or by the frequency of pressure release associated with the overhead pressure measurement. Leakage could contribute to negative bias in any method where biogas accumulates under pressure, including manual manometric and most manual volumetric methods, but is generally assumed to be insignificant. However, leakage can be measured by mass loss during incubation, and has been found to be related to high headspace pressure, insufficient septa, or a large number of needle punctures [18]. There is evidence that manometric measurements may be negatively biased, even in the absence of leakage, and this error is exacerbated by low headspace volumes [18].
In addition, mixing conditions may also affect the amount of methane trapped in the liquid phase. Equilibrium calculations have shown that volatilization of dissolved methane during bottle venting may make a significant contribution to bias in manometric measurements [18]. As demonstrated by Pauss et al. [20], overconcentration of methane by a factor 10 (or higher) compared to equilibrium values is possible, which could contribute to even larger effects. Under BMP conditions, this could explain some of the variability and the importance of mixing conditions.
Mixing effects on BMP have been studied by Kaparaju et al. [21], who indicated that gentle (35 times per minute) or minimal mixing (10 min mixing before feeding) was advantageous compared to vigorous mixing (110 times per minute) for manure AD at 55 °C: A persistence of propionate was noted during vigorous mixing, possible because of the disruption of syntrophic association. Additionally, Wang et al. [22] showed that the degree of mixing strongly affected BMP of wastewater sludge measured with an automated volumetric system but did not clearly affect microcrystalline cellulose. Current BMP guidelines [5] suggest that static incubation without any mixing should be avoided. However, if continuous mixing is applied, it should be gentle. Manual mixing once a day to avoid a floating layer is thought to be sufficient [5].
To date, there are still many questions about the influence of the measurement technique on the BMP value because in most cases, several other sources of variability can interfere [6]. The objectives of this study were to: (1) quantify differences in BMP measured using three measurement methods, including two popular methods (the Automatic Methane Potential Test System (AMPTS II) produced by Bioprocess Control (Lund, Sweden) and a manual manometric method) and one newer method (gravimetric), and (2) assess the importance of the mixing position in the measurement sequence. Experiments were designed to eliminate much of the other sources of variability that may affect BMP.

2. Materials and Methods

Microcrystalline cellulose was used as the substrate for the BMP tests by two manual measurement methods: manometric and gravimetric, and one automated system: AMPTS II. For the manual methods, two mixing modes (mixing before or after venting bottles) were compared.

2.1. General Setup of BMP Experiments

Powdered microcrystalline cellulose was Sigmacell® S3504-500G (Merck KGaA, Darmstadt, Germany). The anaerobic inoculum was digested sludge provided by a nearby wastewater treatment plant (La Feyssine WWTP, Lyon, France). It was stored for 1 week in a temperature-controlled chamber (35 ± 1 °C) in a loosely capped bottle. The substrate-to-inoculum ratio (S:I) was 0.5 on a VS basis. Substrate and inoculum total solids (TS) and VS values are given in Table 1. Tap water was added to bring the volume of reacting material up to around 30% of the bottle volume. The total VS concentration in each bottle was 20 g/L. After adding contents, a mix of 80% N2 and 20% CO2 was used for flushing the headspace (1 L/min-2 min per bottle). The tests were stopped when the daily net CH4 production (or net CH4 production rate in mL/d) was lower than 1% of cumulative CH4 production during 3 consecutive days [6], with the exception of a single AMPTS II bottle, which had the requisite rate for only 2 days. The daily CH4 production rate was calculated from the difference between the net CH4 production among two points divided by the number of days separating the two measuring points.
All BMP tests were carried out simultaneously by the same operator, with the same inoculum, the same tap water, and in the same temperature-controlled incubation chamber. Therefore, the results were not affected by differences in some of the other factors that presumably contribute to variability in interlaboratory studies [2].

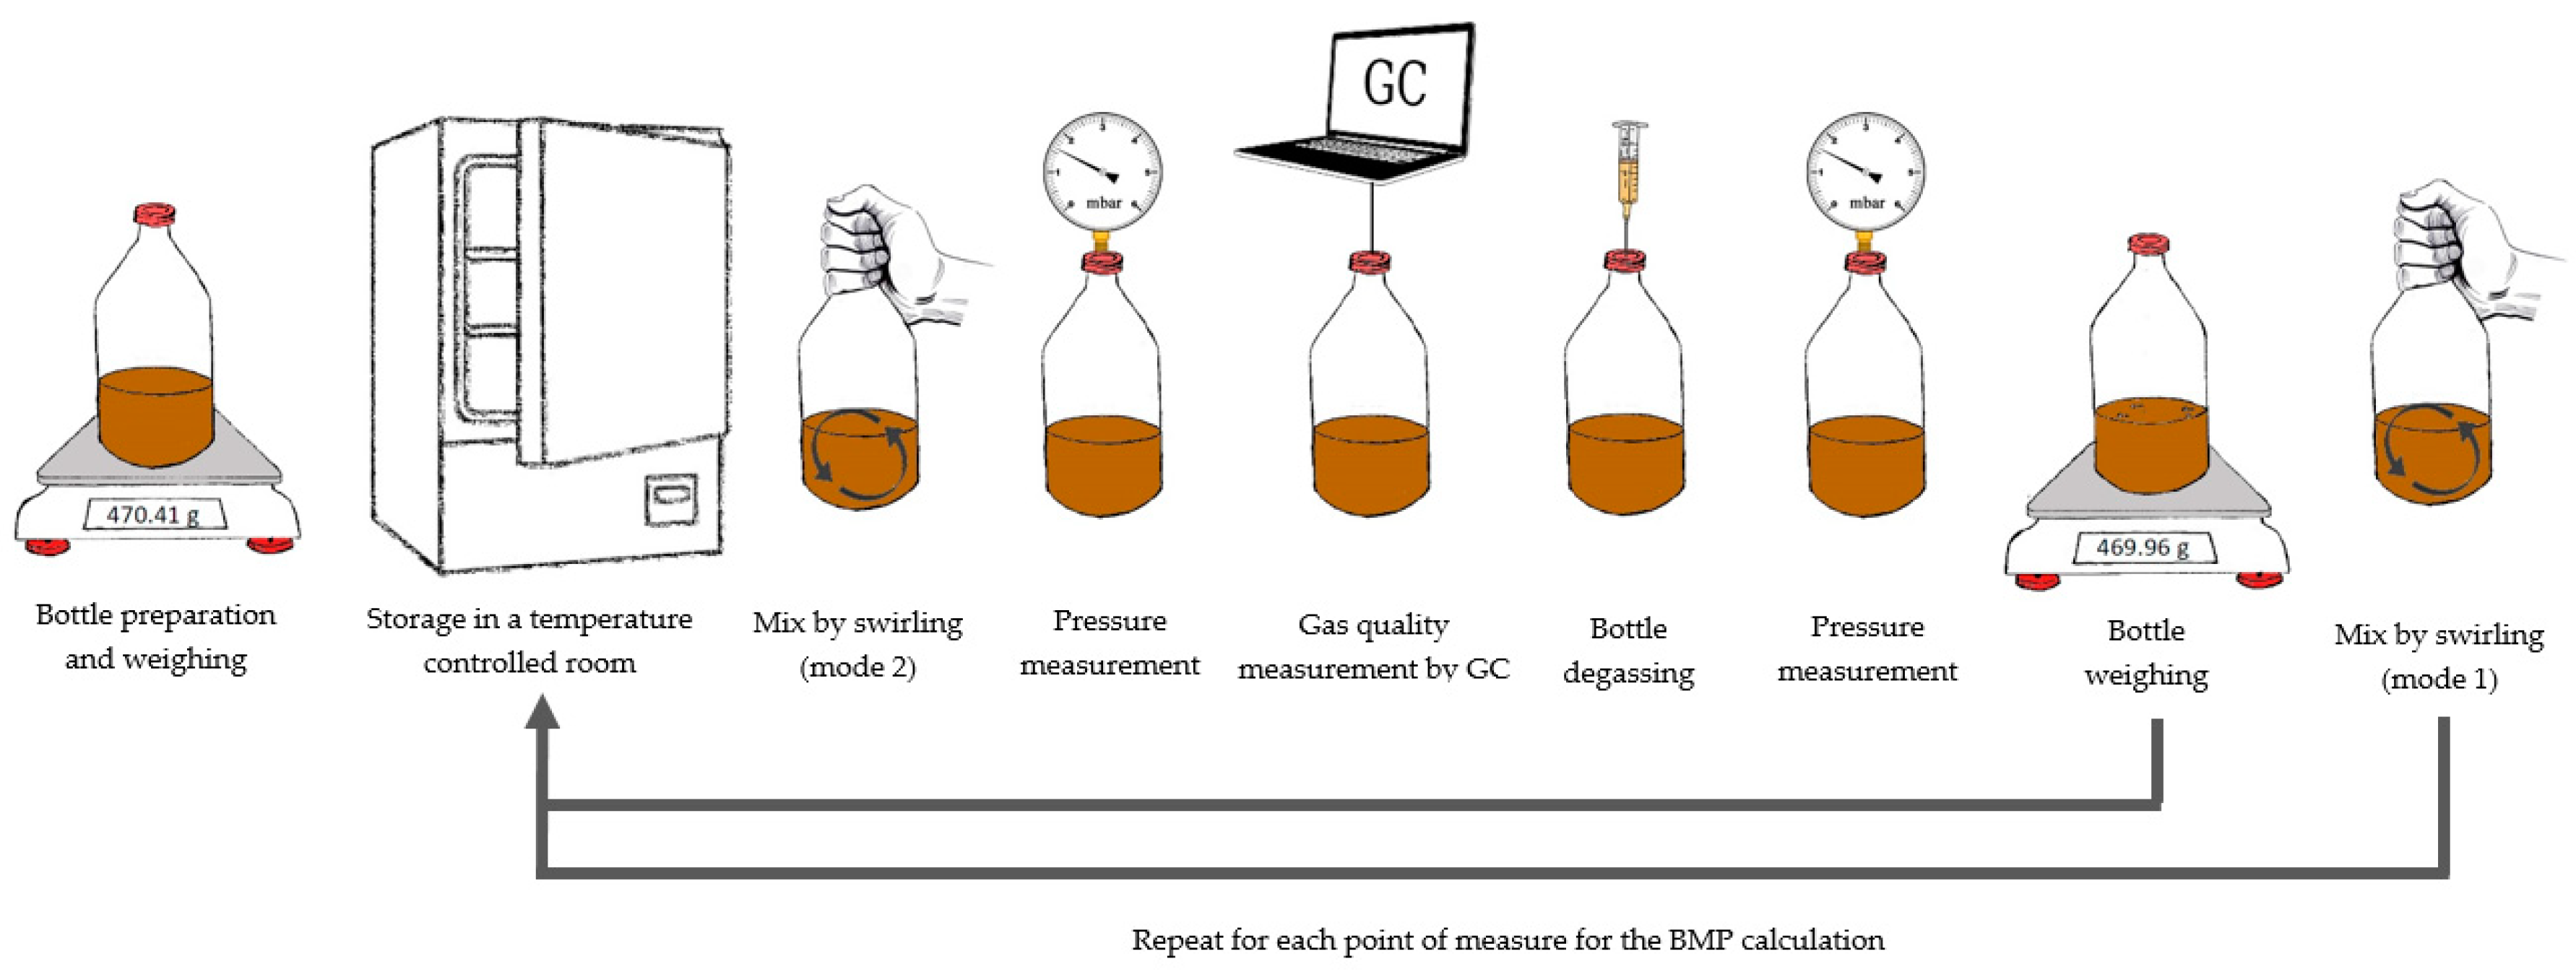
2.2. Manual BMP Measurement

Manometric and gravimetric methods were applied using the same sets of bottles (i.e., for each bottle, both types of measurements were carried out). Here, 1-L glass bottles and 5 replicates for the inoculum (inoculum + tap water) and substrate bottles (inoculum + tap water + substrate) were used for each test. For mixing mode 1, the respective averages and range were 221.48 ± 6.94 g of inoculum, 2.34 ± 0.07 g of cellulose, and 123.28 ± 1.35 g of tap water; for mixing mode 2, 216.49 ± 4.66 g for inoculum, 2.32 ± 0.04 g for cellulose, and 122.24 ± 1.52 g of tap water. Butyl rubber septa (Gravis Plasma, 40 mm diameter) and screw tops were used to seal bottles, and 30 gauge needles (Microlance™ 3, 0.3 × 13 mm) were used for pressure measurement and the removal of biogas samples. Biogas production was measured over about 10 intervals during the tests, which lasted 26 days.
The two mixing modes, differing only in the relative position of the mixing step, were applied in two separate BMP tests run in parallel (Figure 1). In both cases, mixing was done by swirling bottles (and not shaking) to avoid contamination of the bottle septa and subsequent loss of the reacting material [16]. Measurements were carried out inside the same chambers that were used for incubation. The procedure for mixing mode 1 was:
  • Measure the headspace pressure and note the chamber temperature;
  • Collect biogas sample for gas composition;
  • Vent the headspace and measure the new headspace pressure;
  • Weigh the bottle; and
  • Mix the bottle contents by manual swirling for 5 s;
For mixing mode 2, the mixing stage was placed at the beginning of each sampling event. The steps were:
  • Mix the bottle contents by manually swirling for 5 s;
  • Measure the headspace pressure and note the chamber temperature;
  • Collect biogas sample for gas composition;
  • Release pressure and measure the new headspace pressure; and
  • Weigh the bottle.
The principle of the manometric method is to measure the increase in pressure resulting from biogas production in discrete time intervals. After each measurement, excess biogas was vented, and the pressure was measured again. Venting was done frequently enough to maintain the headspace pressure below 1800 mbar to prevent biogas leaks [18].
Biogas and CH4 production was calculated from the pre- and post-venting pressure and the measured chamber temperature (about 35 °C) following the steps described for method 2 in Hafner et al. [23]. In this method, the biogas CH4 concentration is not normalized by the sum of CH4 and CO2, but instead CH4 in the vented biogas and residual headspace are both calculated and summed for total CH4 production. See [23] for more details. The headspace volume was estimated from the total volume and the mass of added material, assuming a density of 1.0 g/mL. Headspace biogas was assumed to be saturated with water vapor both before and after venting.
For the gravimetric method, bottles were weighed after setting up and headspace flushing and then after each venting event [16]. Biogas and CH4 production for each interval were calculated from the mass loss and biogas composition following the steps for method 2 in Hafner et al. [24]. In this approach, CH4 includes both vented and residual headspace components. For the calculation of density, biogas was assumed to be a mixture of CH4, CO2, N2, and H2O.
In addition to the BMP values, kinetic information was extracted from each test. For each replicate, a first-order model was fitted to the net cumulative specific methane production (SMP) (with inoculum contribution subtracted) obtained from cellulose using the ExcelTM solver with the least-squares method. The resulting model equation was:
V C H 4 ( t ) = B 0 × ( 1 e ( k · ( t λ ) ) ) ,
where VCH4(t) is the SMP at time t, (mLCH4/gVS, STP), B0 the ultimate methane production (mLCH4/gVS, STP), k the reaction rate constant (d−1), and λ the lag phase (d).

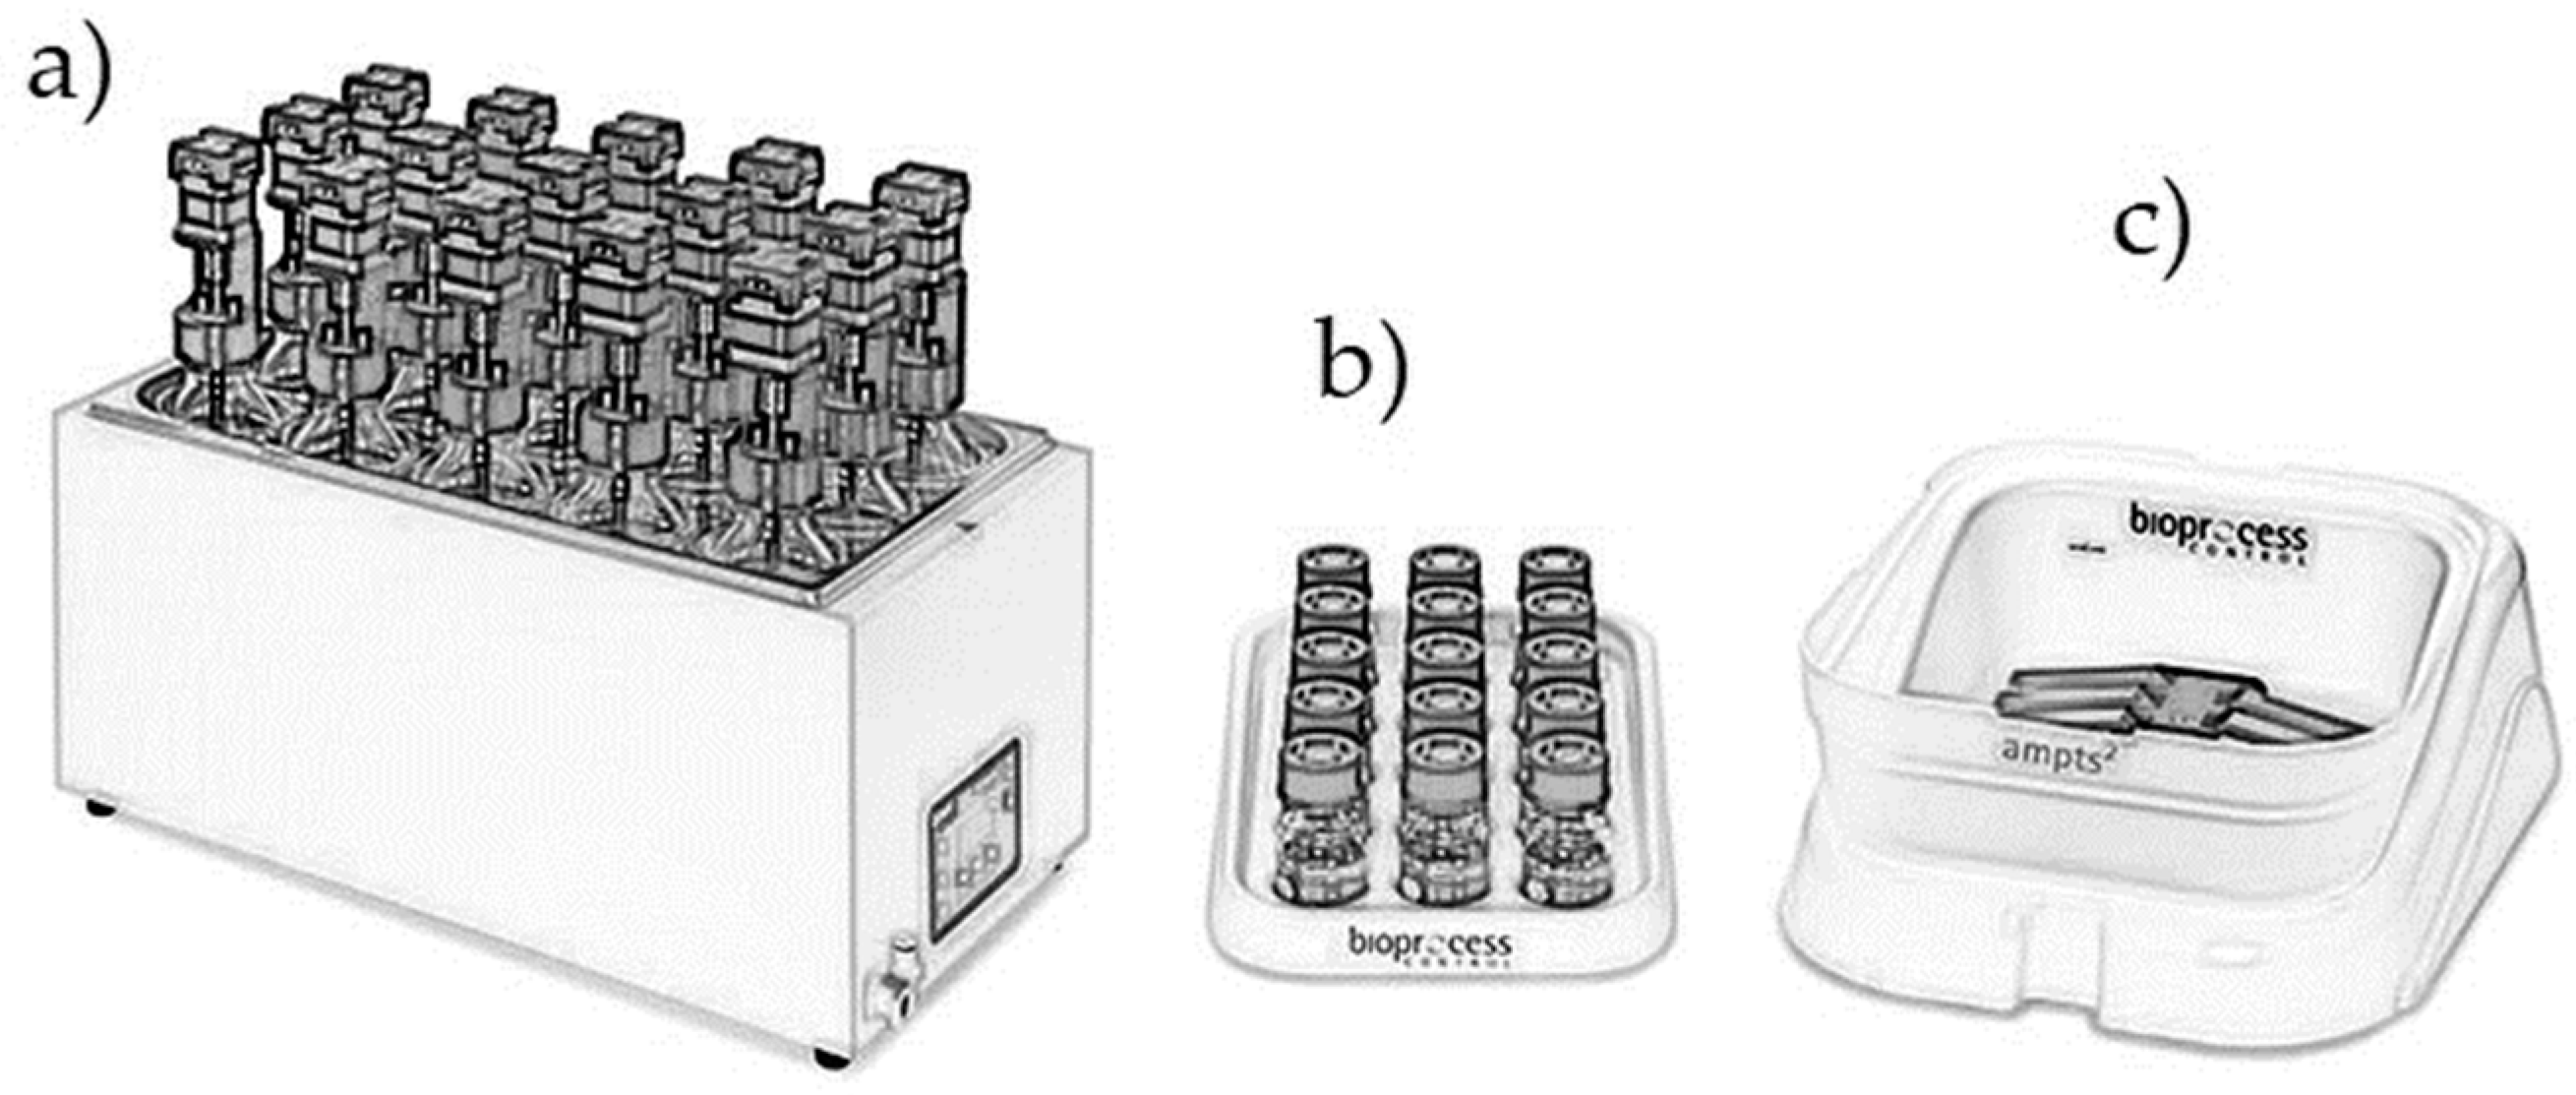
2.3. AMPTS II Measurements

The AMPTS II system [25] provides automated measurement of ultra-low biogas flow using tipping buckets. The device supports 15 bottles of 500 mL (Figure 2a), but in this study, only six bottles were used: Three for blanks (inoculum + tap water) and three for substrate (inoculum + tap water + substrate). Each bottle was connected by Tygon tubing to a carbon dioxide trap (Figure 2b), which is a bottle filled with a sodium hydroxide solution (absorption efficiency estimated > 98% in earlier tests). For the CH4 volume measurement, a flow cell array (Figure 2c), thanks to liquid displacement and buoyancy, gives back the CH4 produced during the experiment. The measured volume is automatically converted to STP conditions using pressure and temperature measurements made by the system. The bottles were filled with the same substrate, the same inoculum, and the same tap water under similar conditions to the other tests with a total volume of ca. 450 mL (the respective averages and range were 151.30 ± 0.85 g of inoculum, 1.66 ± 0.02 g of cellulose, and 302.81 ± 2.06 g of tap water). The AMPTS II test was performed simultaneously with all other tests.

2.4. Analytical Methods

The inoculum and substrate (cellulose) were analyzed for total and volatile solids content. Samples were placed in an oven at 105 °C for 48 h to measure total solids (TSs), followed by 4 h of calcination at 550 °C to measure volatile solids (VS) [26]. Headspace pressure was measured with a precision electronic manometer (Digitron 2025P7: 0–2 bar absolute operating range, accuracy: ±5.8 mbar operating temperature: −10 °C to 50 °C). Bottle mass loss was measured with an OHAUS Pioneer precision balance (readability: 0.01 g, linearity (accuracy): ±0.02 g, repeatability: 0.01 g, stabilization time: 1 s, capacity: 4200 g, pan size: Ø = 180 mm). Prior to each measurement event, a balance check was carried out using a bottle filled with water, which was never opened or vented. Results were always within the stated accuracy of 0.02 g. The biogas composition was measured using an Agilent 3000 micro gas chromatography with a thermal conductivity detector (GC-TCD). Two columns (Molsieve 5A, 14 m length, pore size: 5 Å; and PoraPlotA, 10 m length, 0.320 mm ID) were used as stationary phases for GC-TCD, with argon and helium as the carrier gases, respectively. The following compounds were measured: H2, CO2, CH4, O2, N2, and H2S. Calibration was performed for each gas with a standard gas mixture.

2.5. Data Analysis

Both BMP and SMP were calculated as described previously [27]. Calculation of the relative standard deviation (RSD) associated with each BMP mean included variability from both blanks and bottles with substrate, as described in [27]. Statistical analysis was carried out using R (version 3.6.3) [28]. Differences between measurement methods (manometric and gravimetric) were assessed using paired t-tests (t.test () function) separately for cellulose BMP and inoculum productivity and for each mode. Mixing modes were compared for both cellulose and inoculum in a two-factor (mixing mode and measurement method) analysis of variance (ANOVA) with interactions (using aov (), and drop1 () functions). The paired nature of the experiments was ignored in the ANOVA, which was only used to compare mixing modes. For these analyses, the observational unit was a single bottle, and BMP or productivity was evaluated at the latest available time. Additionally, measurement methods were compared using linear regression (lm (), summary.lm (), and confint () functions), with the volume of CH4 measured in a single interval as the response variable. For all hypothesis tests, α = 0.05.

3. Results and Discussion

In general, differences between mixing modes and measurement methods were small (Table 2). However, there was evidence of significant differences in both cases: Mixing mode 1 and the gravimetric method resulted in slightly higher BMP values (Table 2).

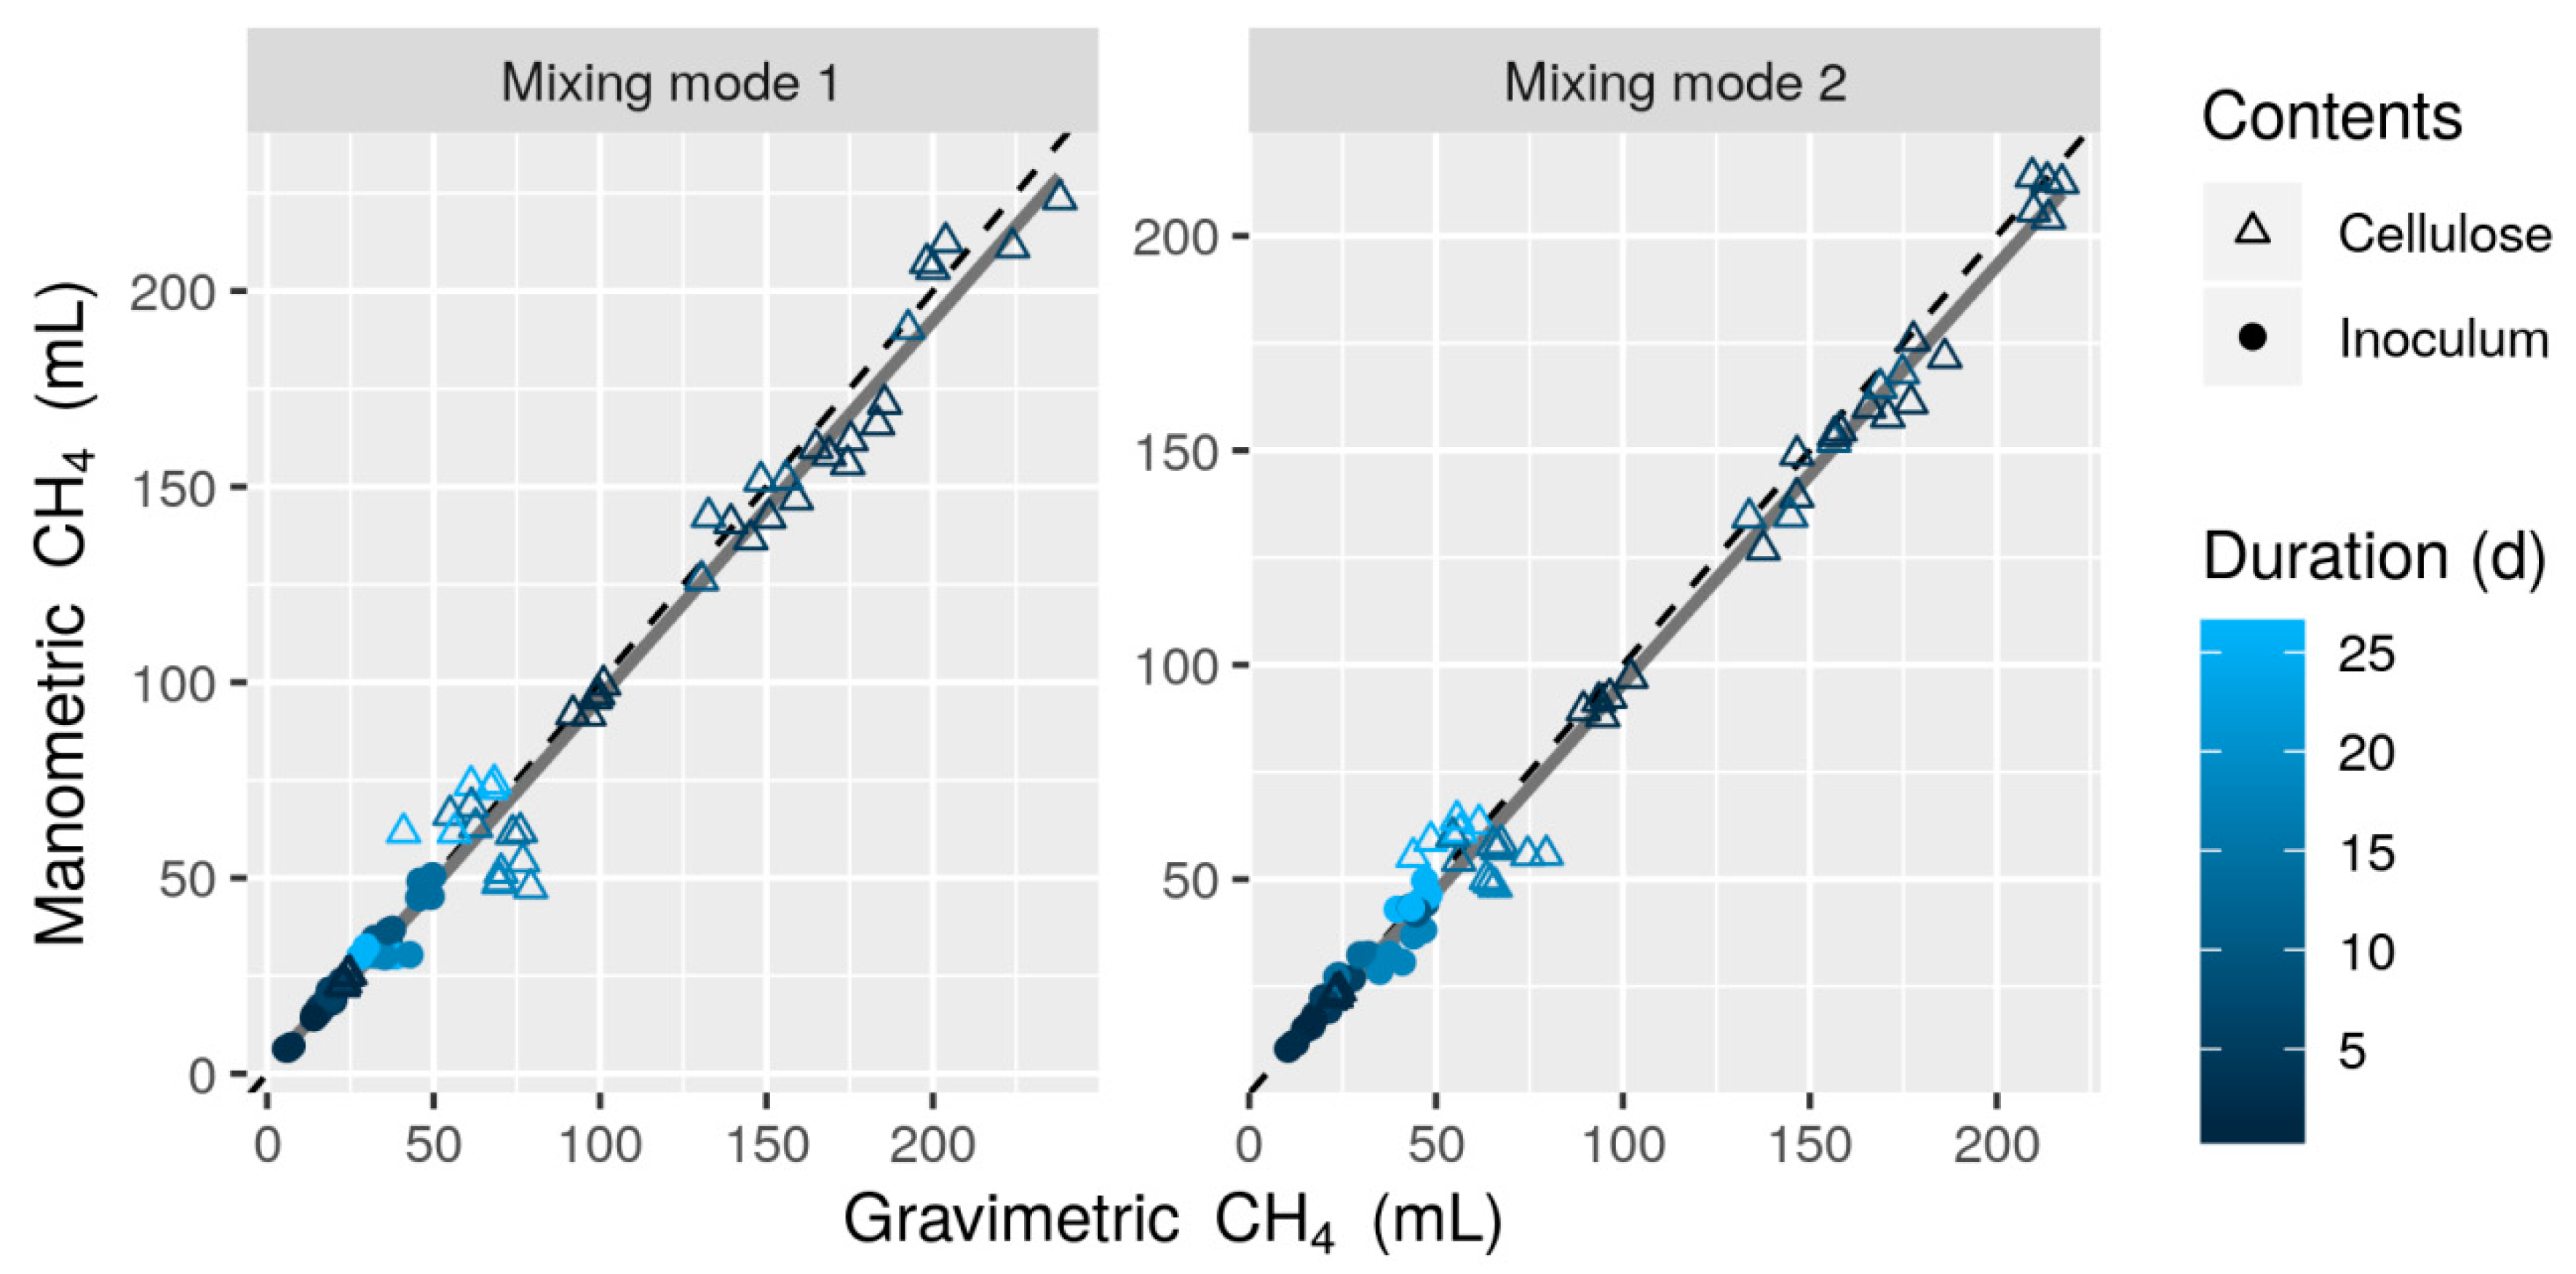
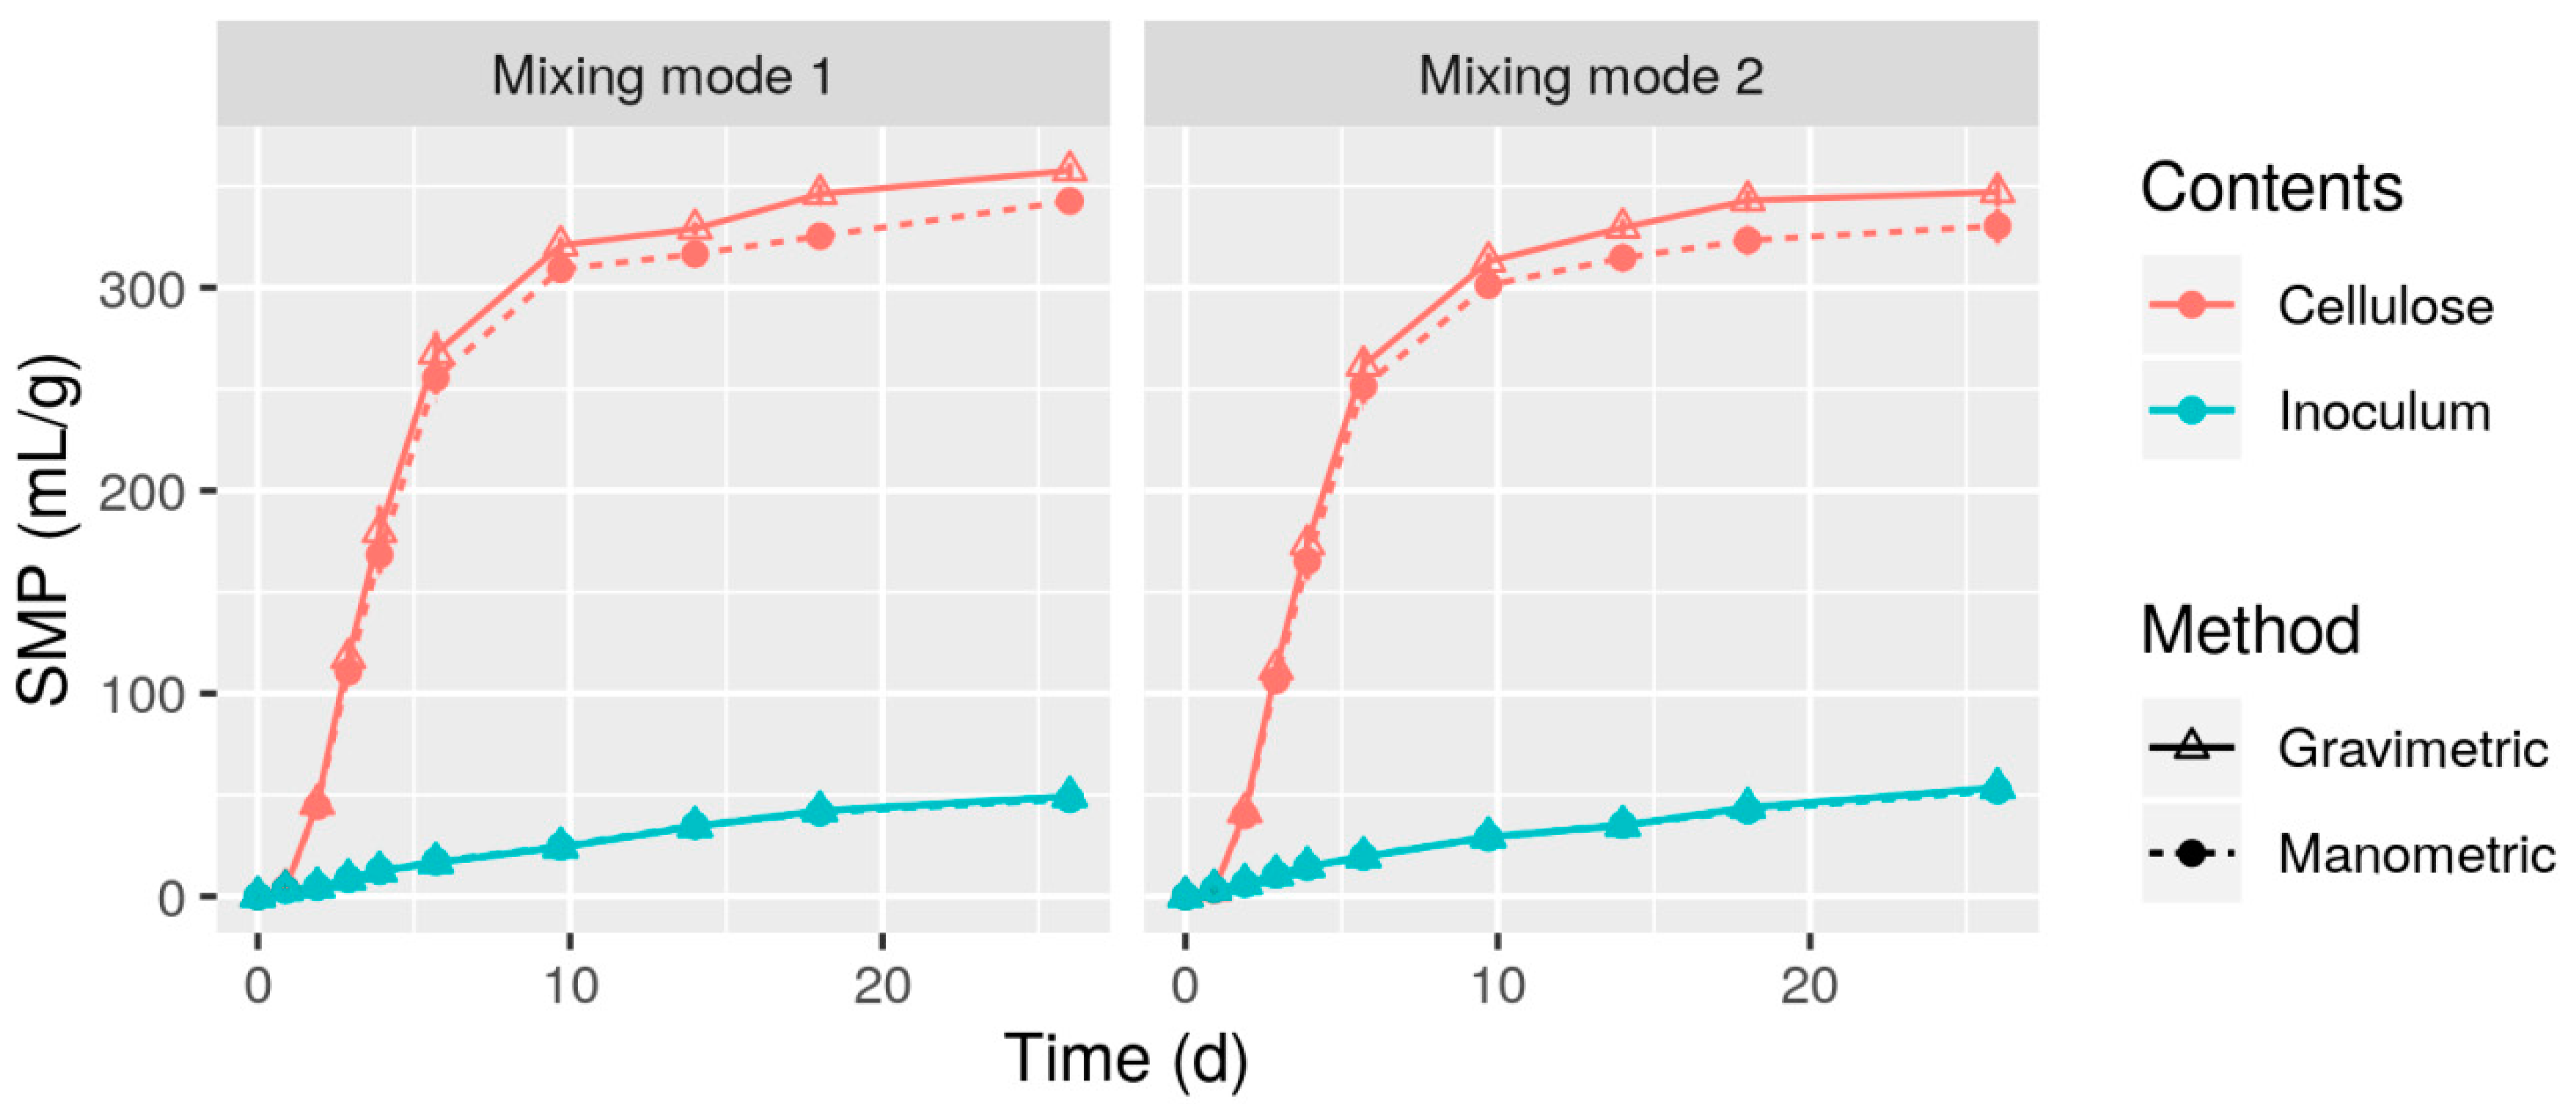
3.1. Comparison of Measurement Methods

This study gave the opportunity to better understand the differences between gravimetric and manometric measurements. Since for each test the calculation was carried out on the same bottle simultaneously, the comparison shows only the differences between the measurement and calculation procedures.
For both mixing modes, the BMP calculated by the manometric method was slightly lower than the gravimetric result (Table 2). Manometric cellulose BMP was 4.2% lower than gravimetric for mixing mode 1, and 4.8% lower for mixing mode 2 (p < 0.0003 from paired t-test). Inoculum CH4 productivity was also slightly lower when measured with the manometric method, but the differences were smaller: 2.5% for mixing mode 1 and 2.2% for mixing mode 2 (p < 0.03 from paired t-test). A comparison of SMP curves (Figure 3) and the interval change in SMP (Figure 4) suggests that the differences between the two methods accumulated during the duration of the tests, and was not due to exceptional large differences in, e.g., one or two measurement intervals.
A comparison of methods by bottle and measurement interval show slightly more scatter at low volumes of CH4 but only for bottles with inoculum + cellulose (Figure 5). Low resolution in mass loss measurements may have contributed to the scatter. However, it is unclear why the variability in absolute CH4 production would be higher in this region. Leakage (and resulting error in manometric results) is an unlikely explanation because the headspace pressure was low toward the end of the tests and leakage would cause bias, which is not apparent. A complete explanation is unavailable. Results for the inoculum-only bottles showed that the precision in the gravimetric results was not limiting; the comparison between methods was close even for CH4 volumes below 25 mL. However, this precision should only be expected with low levels of CH4 production near the start of tests, where the majority of CH4 produced remains in the bottle headspace, displacing the flushing gas. This precision is a clear advantage of method 2 over method 1 when using the gravimetric method.
In general, for both mixing modes (no difference found by F-test, p = 0.80), there was evidence of a slight increase in the difference between measurement methods as the CH4 volume increased. The slope of the overall regression line was 0.960 (manometric: gravimetric, different from 1.0, p < 0.001 by Wald-type test) while the intercept did not differ from zero (overall value of = −0.06 mL, p = 0.96). These results are consistent with a constant relative difference between methods, independent of the quantity of CH4 produced in an interval. Based on the results presented by Hafner and Astals [18], the difference between the methods is likely caused by a negative bias in manometric measurements. In fact, the ca. 4% difference measured here is similar to the difference found in the earlier work for bottles with a similar relative headspace volume [18]. The cause of underestimation by manometric measurement is not completely understood, but it is probably at least partially due to effects of dissolved CH4 volatilization during venting, and possibly error in the headspace volume estimation [18].
BMP measured with the AMPTS II was similar to the other results, with a maximum difference of 4.2% in cellulose BMP when compared to gravimetric results measured using mixing mode 1 (AMPTS II results were lower). There was virtually no difference (1.2% difference in means) when comparing AMPTS II results to the gravimetric results from mixing mode 2 (p = 0.79 from the unequal variance t-test). However, variability in the AMPTS II results, as reflected in tRSD, was clearly higher than in the results from the manual methods. Gravimetric and manometric methods provided low RSD values between 1% and 3%, which were all below the validation limits of 5% proposed by Holliger et al. [5] and 6% from Hafner et al. [6] and Holliger et al. [29]. The higher RSD for the AMPTS II results (>7%) may be due to the limited resolution of the system, which is around 14 mL. However, these RSD values were higher than those typically obtained with the AMPTS II system; in a large inter-laboratory dataset, the median AMPTS II RSD was around 3%, nearly identical to the median value for all manual methods [6].

3.2. Comparison of Mixing Modes

As indicated in Section 2, mixing modes were compared in order to understand if the position of manual mixing in the sequence of measurement steps could have an impact on the BMP value. Cellulose BMP was found to be vary slightly between the mixing modes, with BMP measured with mode 2 3.0% lower than mode 1 (p < 0.0001 for mode x bottle contents interaction, p = 0.0003 for mode effect considering only cellulose BMP, based on F-tests) (Table 2). In contrast, the measured productivity of inoculum was always higher with mixing mode 2 than mode 1, by 8.6% on average (p < 0.0001, based on F-test) (Table 2). There was no evidence of interactions between the mixing mode and measurement method (p > 0.67 for interaction terms by F-test). These results suggest that the apparent difference in cellulose BMP was caused by an effect of the mixing mode on blanks. Specific methane production calculated without subtracting the background inoculum methane production (i.e., based on gross or total CH4) confirms this conclusion (Table 3). It was possible to compare these values because the masses of inoculum, cellulose, and tap water were almost the same for each replicate (as shown in Section 2.1). For cellulose, the SMP without correction for inoculum were nearly identical, with an overall difference below 1% (p = 0.23 from F-test). This confirms that the difference between the average BMP values came only from the effects of the mixing mode on inoculum (blank) methane production.
If the manual mixing is done after the measurement (mode 1), then the methane production of the blank is lower, which is consistent with the fact that more methane may remain trapped in the liquid phase in a dissolved form or even as attached bubbles. However, this phenomenon was not observed with the cellulose bottles, perhaps because the gas production was higher [20]. These results suggest that the relative position of a mixing step can have a small effect on BMP. Any CH4 remaining in the solution in a bottle represents a source of error, and therefore the mixing step should be placed before the measurement of biogas production (i.e., before measuring the headspace pressure in the manometric method, or before venting in the gravimetric method). Headspace gas analyses showed that the CH4 content in biogas was slightly higher for mode 2 than mode 1 for blanks (inoculum) (mole frac. difference of 0.011, or 13% of mode 1 higher, on average, p < 0.0001) but not for bottles with cellulose (Figure 6). Conversely, there was no difference in the headspace pressure, total biogas production, or CO2 content between the modes (data not shown). One possible explanation for these results is inefficient liquid-phase mass transfer of CH4 due to low solubility, in contrast with CO2. In bottles with cellulose, mass transfer could be enhanced by a greater fraction of CH4 transport in bubbles, or simply liquid mixing caused by bubbles. Mixing by swirling prior to gas sample collection (mode 2) would bring the system closer to equilibrium.

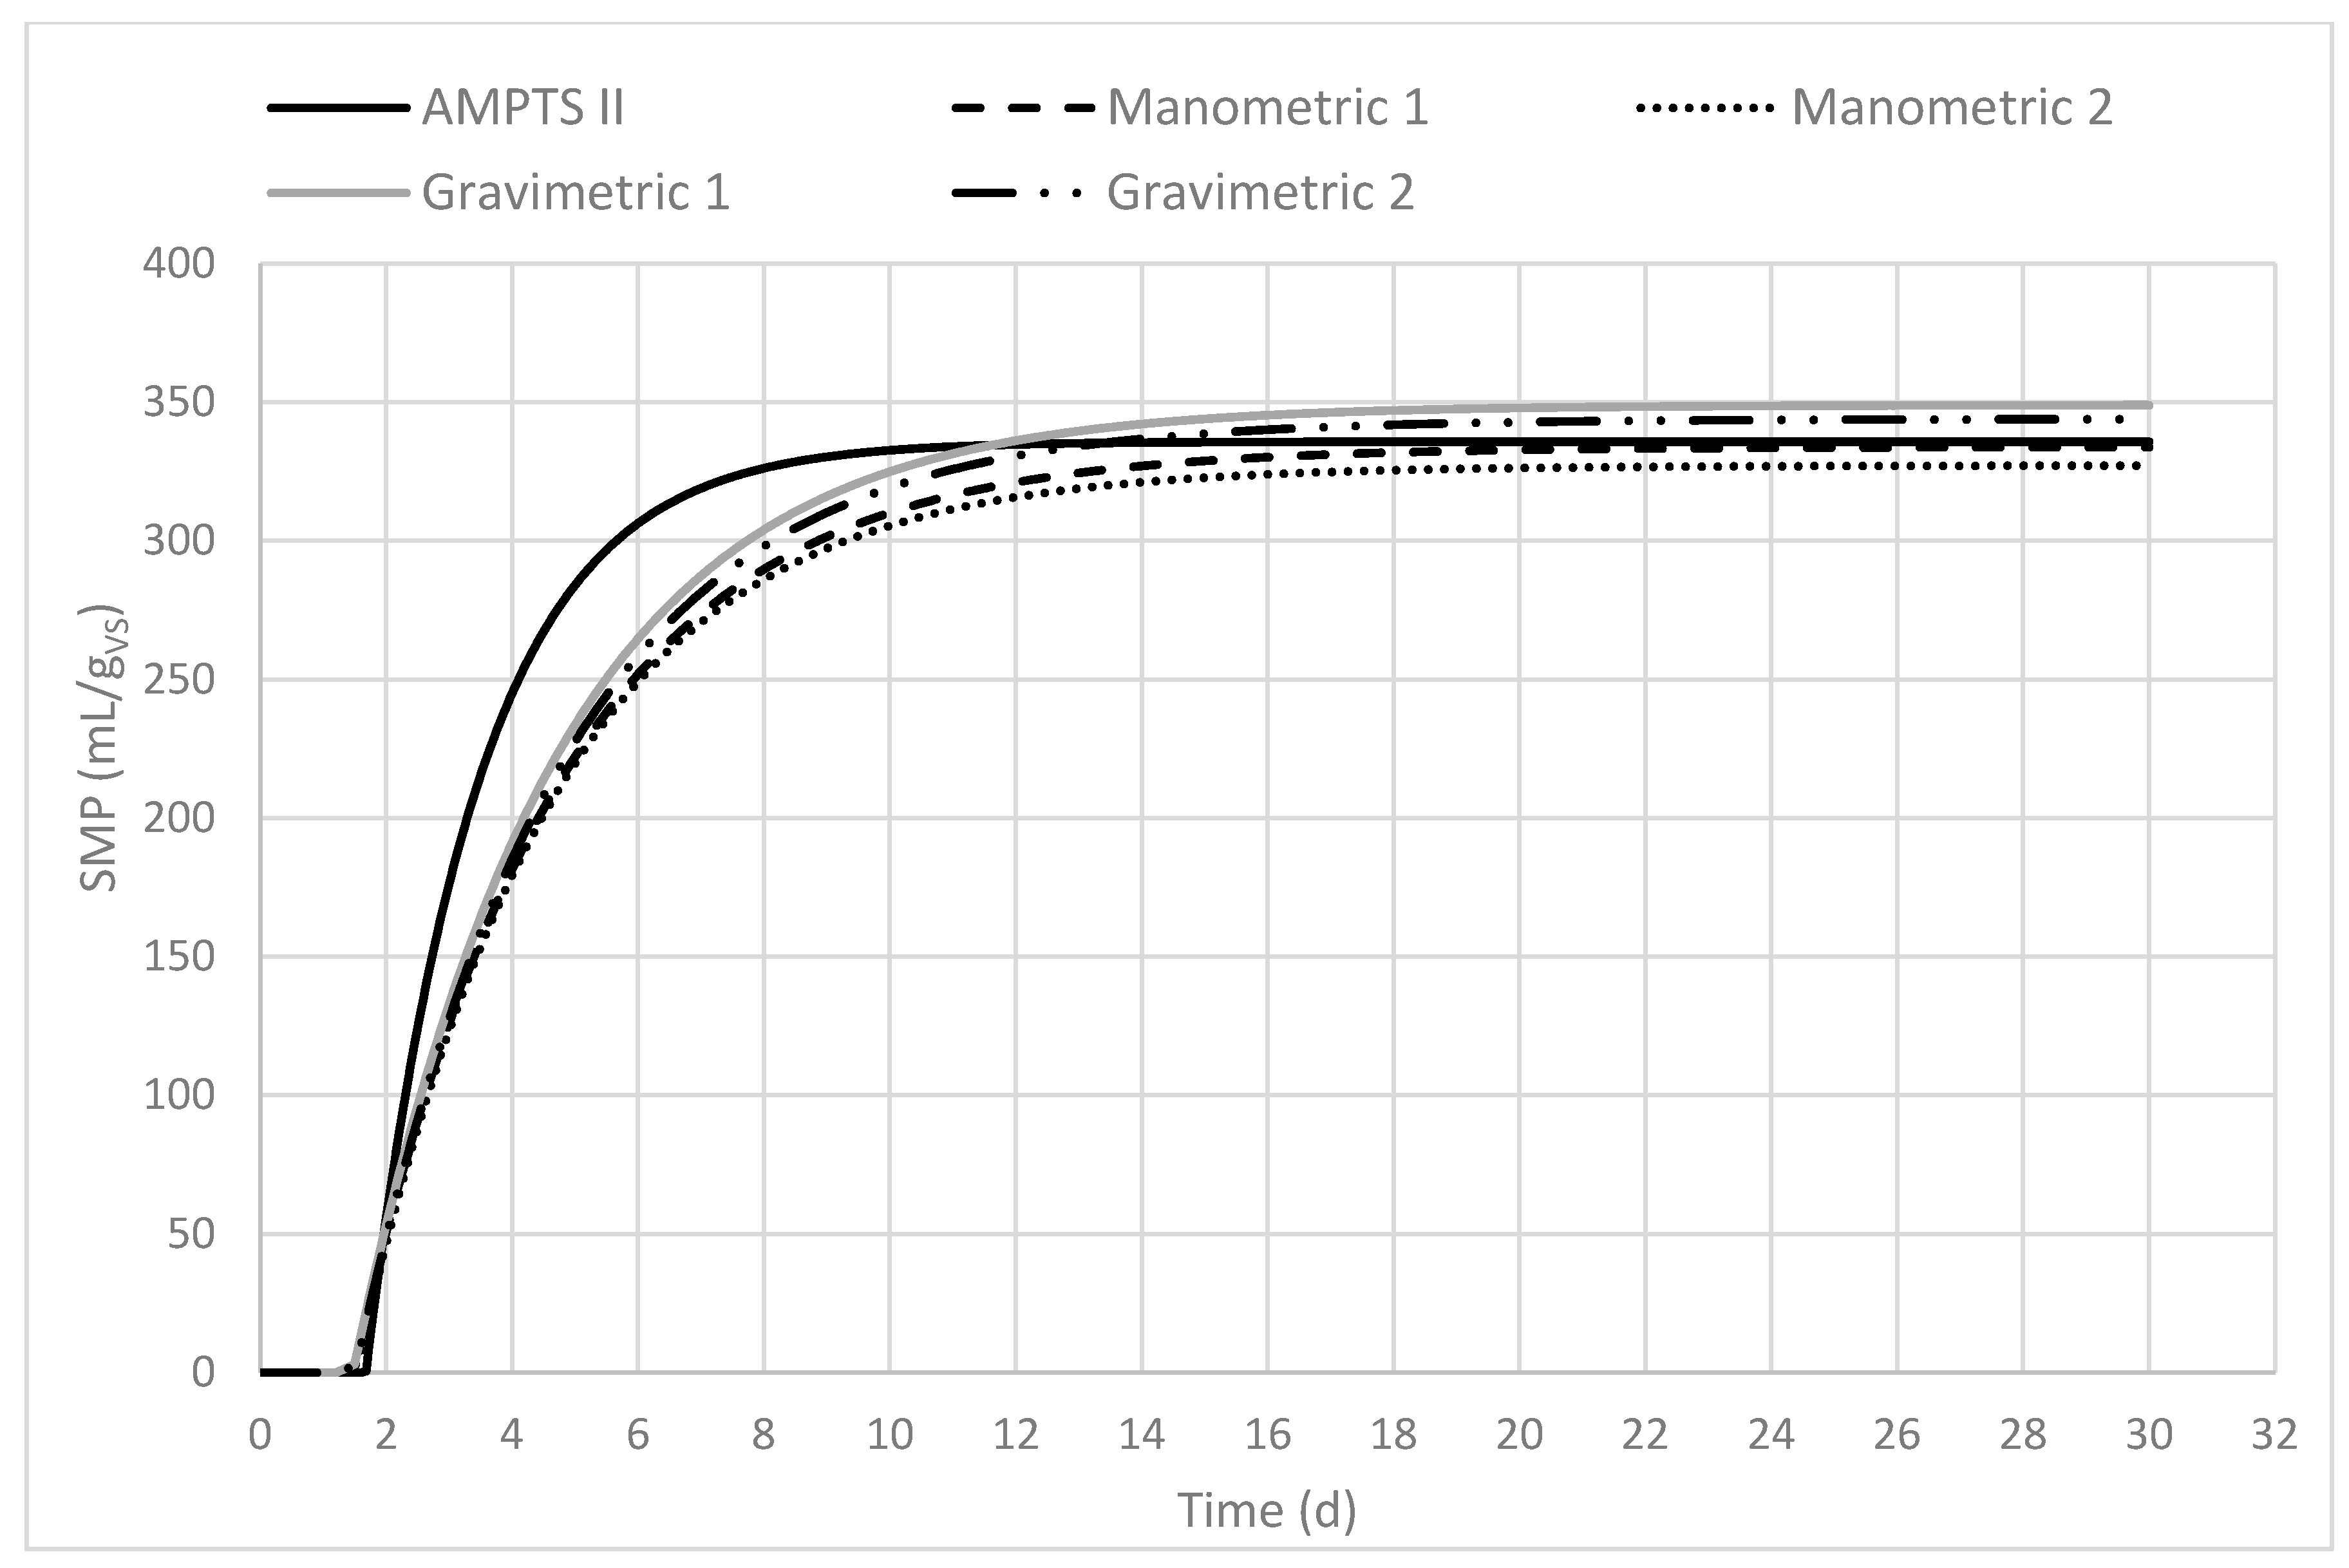
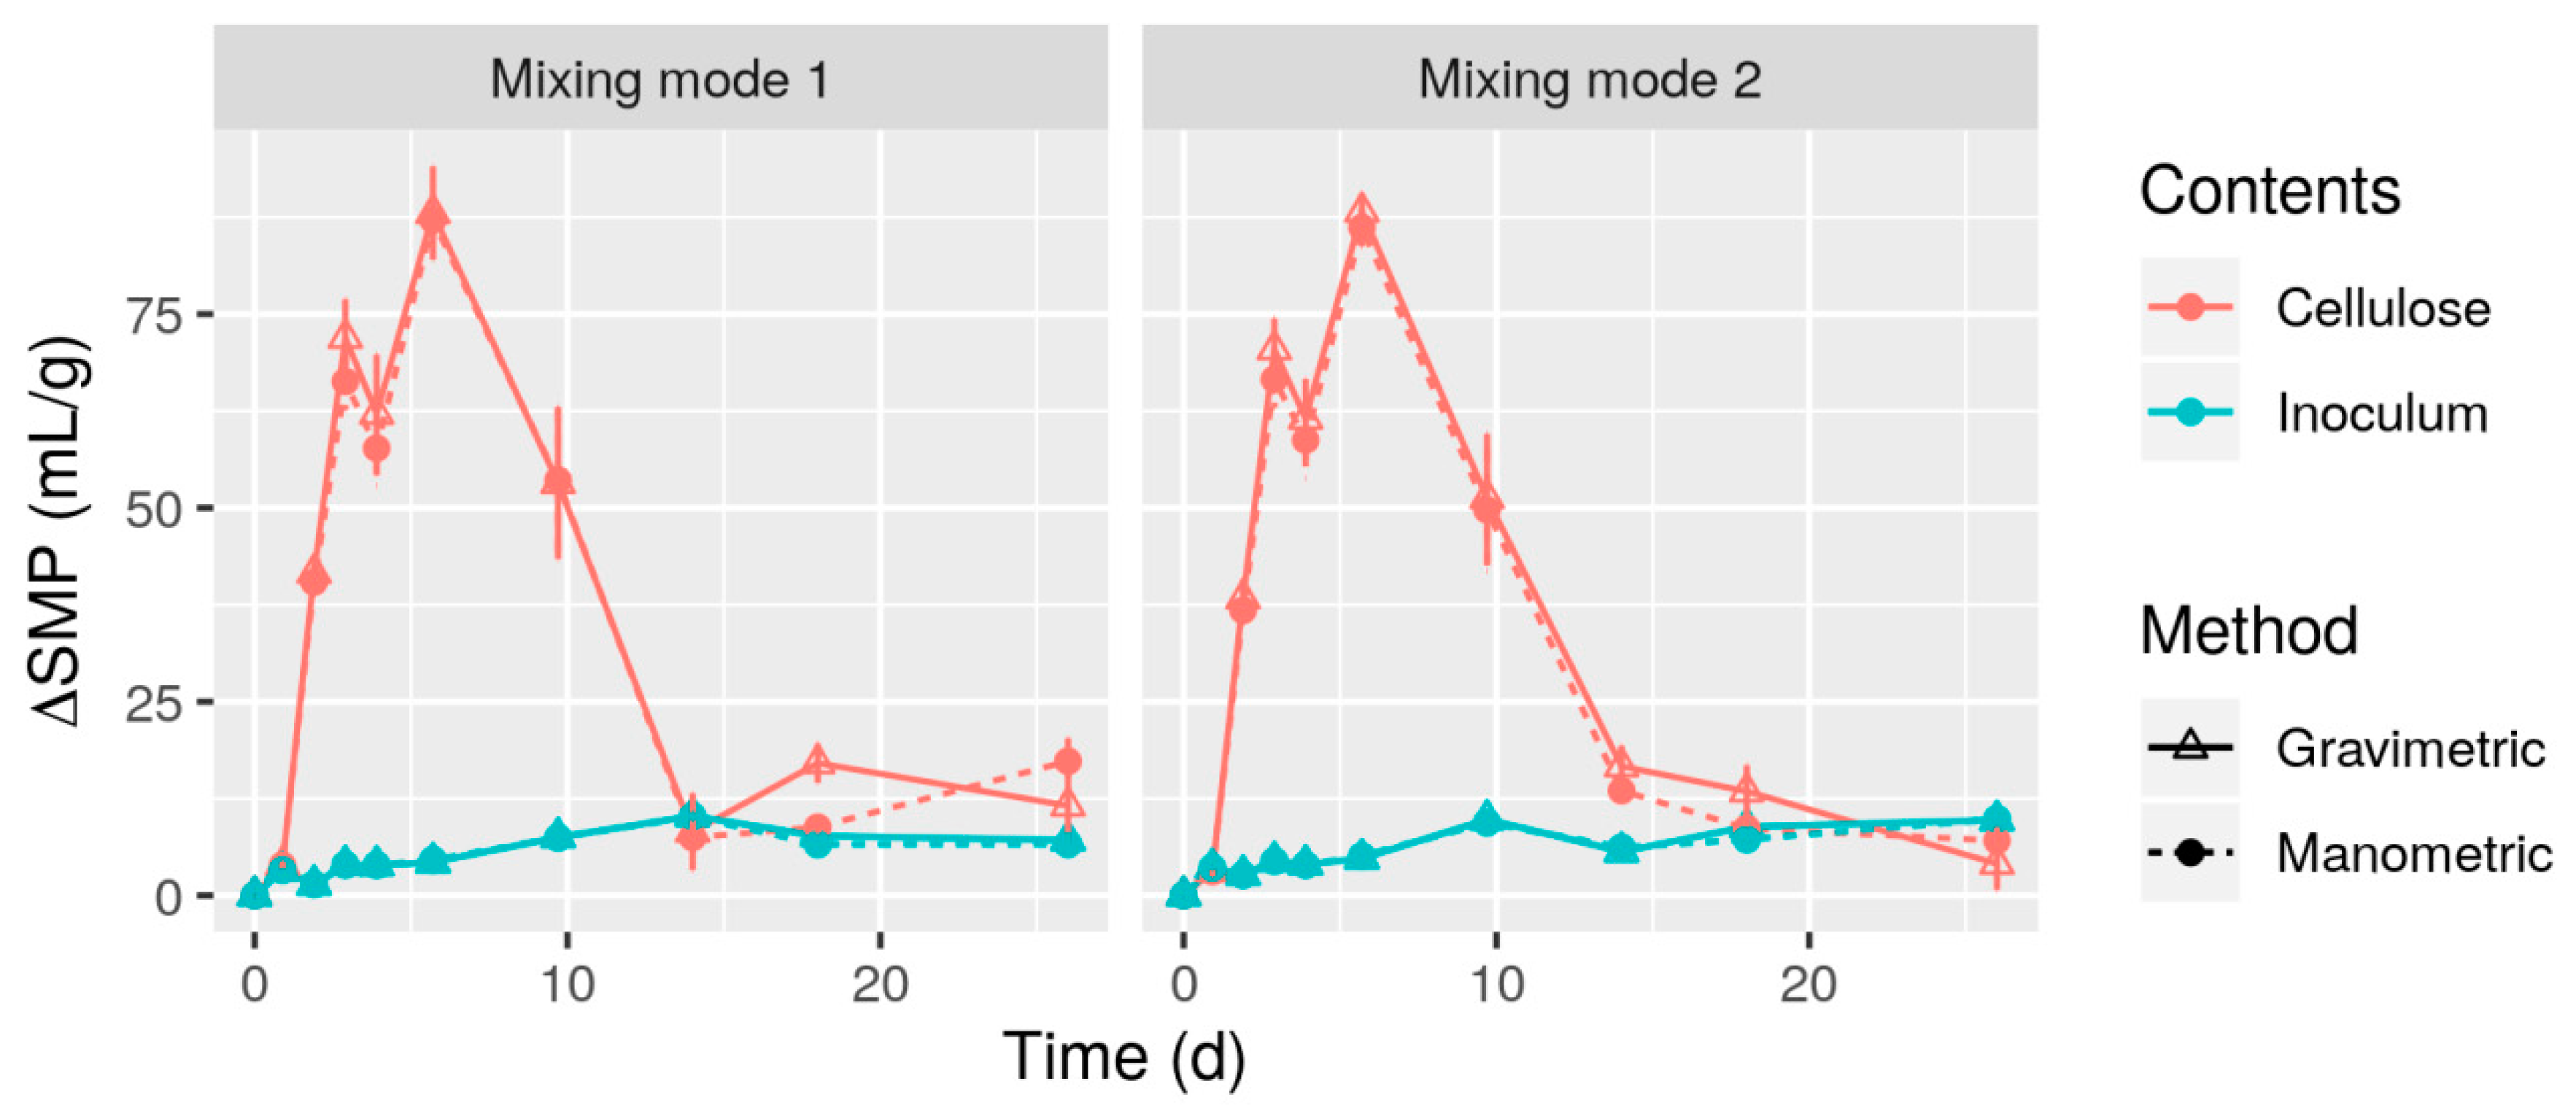
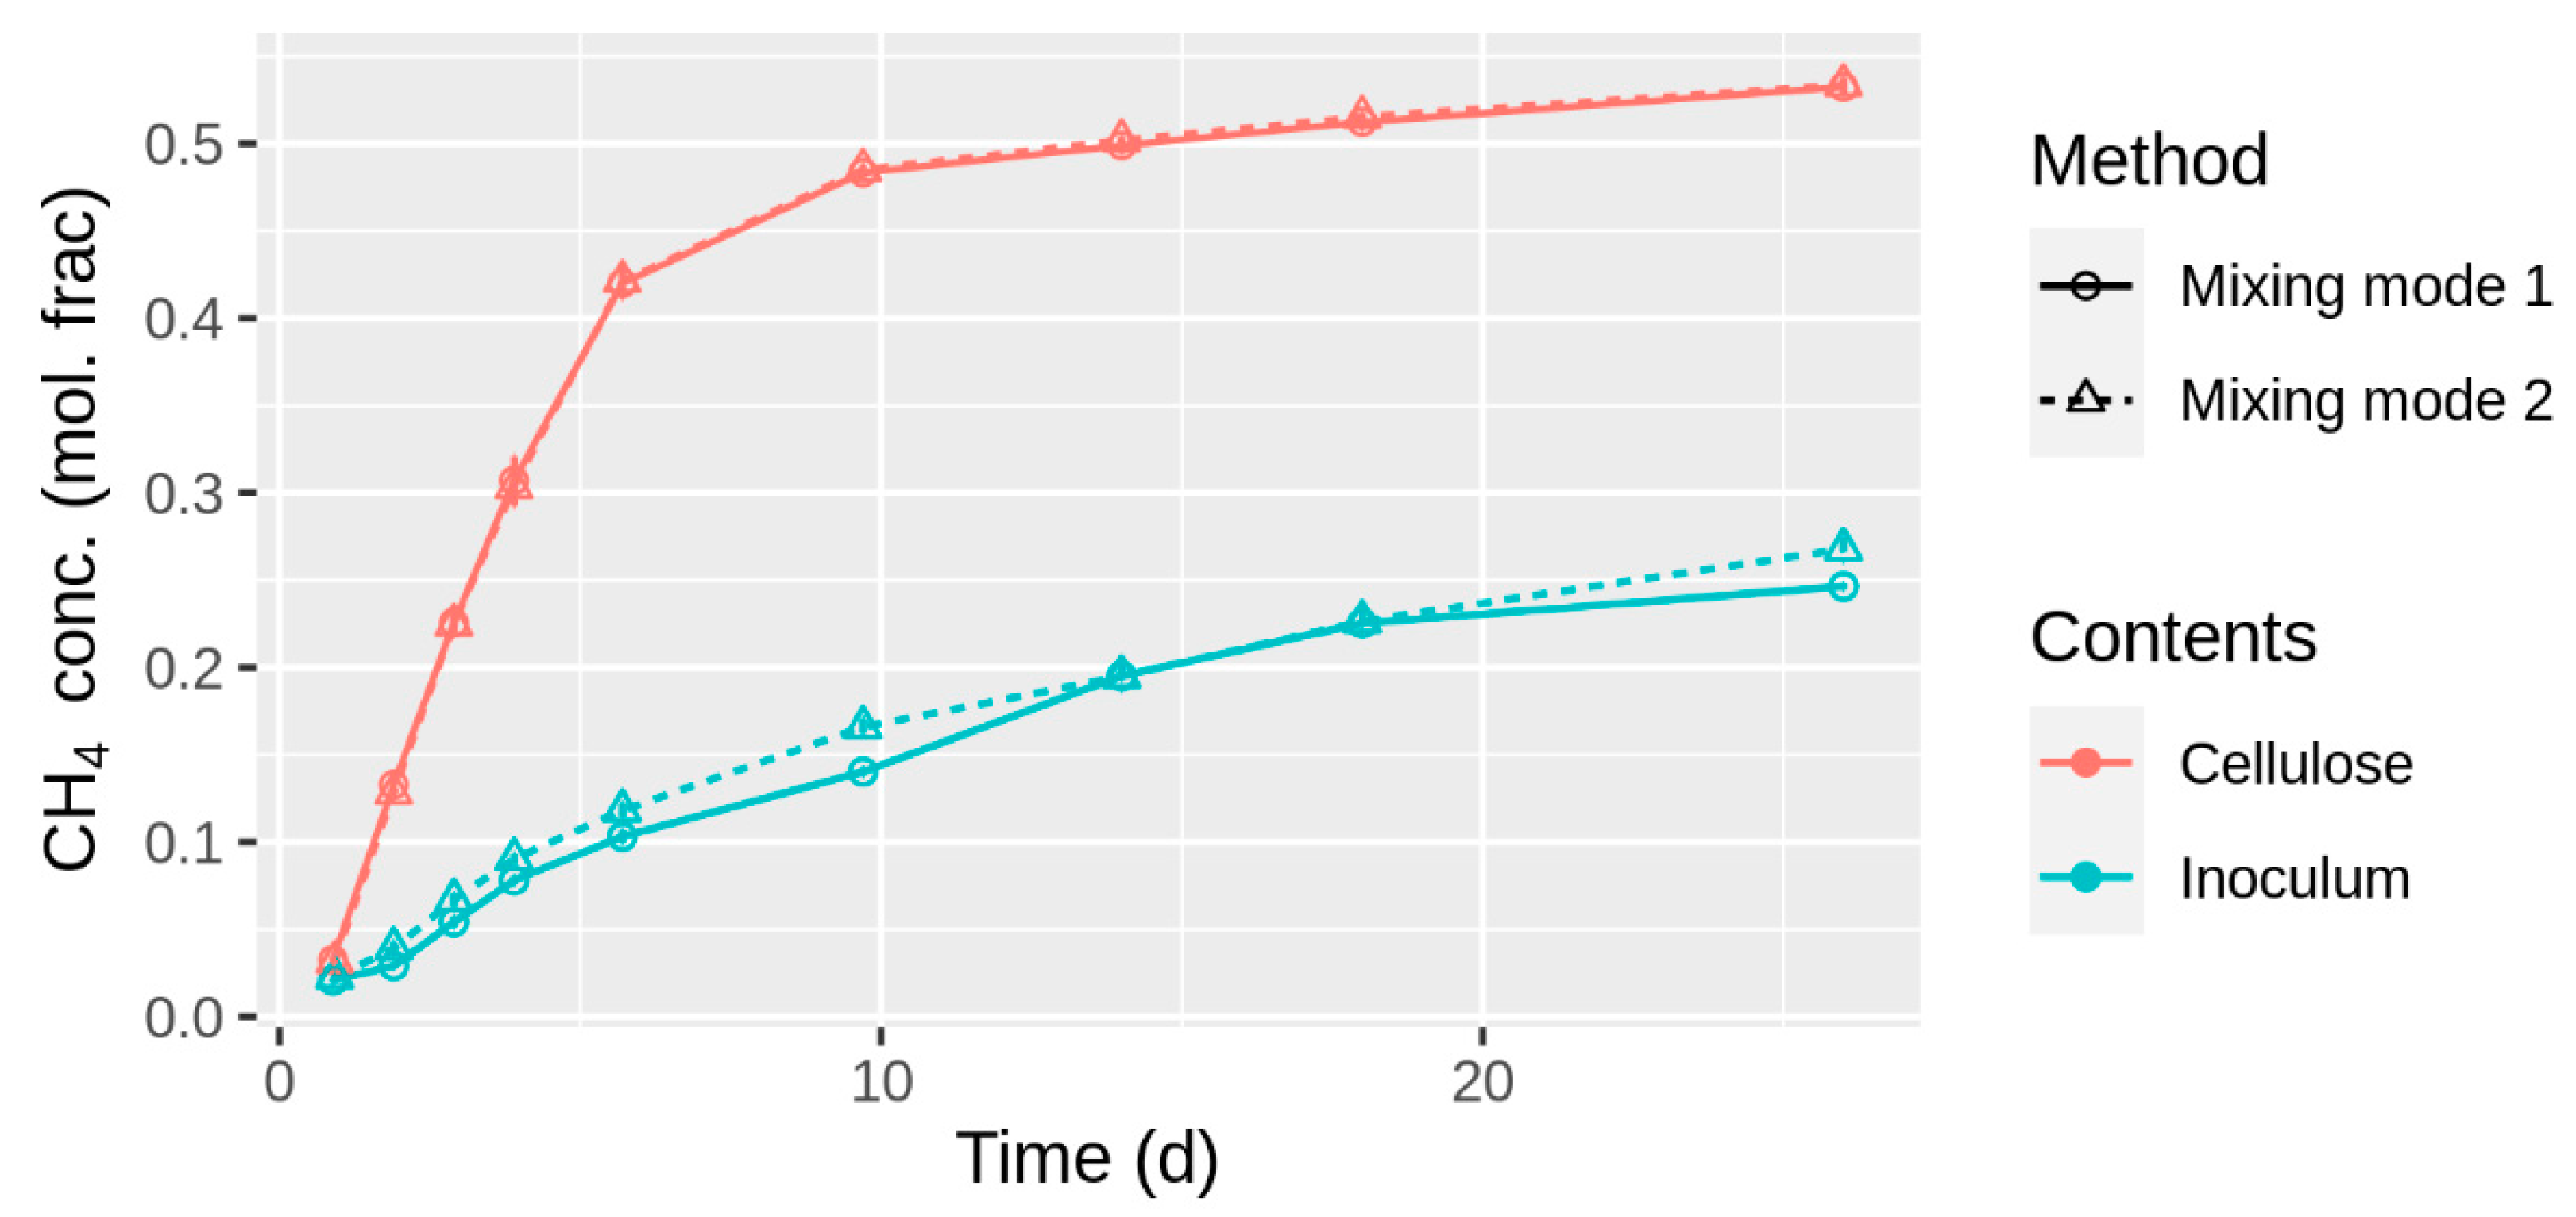
3.3. Methane Production Rate

Table 4 shows the calibrated model parameters of the net cumulative SMP (without inoculum and fitted to a first-order model). Values are means and standard deviation, calculated from individual estimates made for each bottle (n = 5 except for AMPTS II, where n = 3). It should be mentioned that the fitted model using experimental B0 presented similar parameter values (except for λ of AMPTS II, which was 1.56 ± 0.26 d).
The average values of each parameter of the model were used to plot the model-based SMP for each measurement mode (Figure 7). Measurement data and a detailed comparison to the fitted model curves are given in Supplementary Material.
The kinetic results from modes 1 and 2 for the manometric and gravimetric method were similar. The statistical analyses (ANOVA test) conducted on the k values confirmed that there is not a significant difference between the manometric and the gravimetric methods (p = 0.05, based on F-test), while the rate constant from the automated volumetric measurements is much higher. More efficient mixing may have reduced mass transfer limitations and so improved the rate of cellulose degradation. However, Wang et al. [22] did not find any response in the CH4 production rate over a seven-level gradient in the mixing intensity, with all measurements made using an AMPTS II unit. Another possible explanation is that the AMPTS II device overestimated CH4 production during the beginning of the BMP test. At the beginning of each test, the headspace mostly contains nitrogen (80% of the flush gas). When biogas production starts, the evolved biogas contains methane, CO2, and nitrogen in large amounts. However, only CO2 is retained in the CO2 trap. Consequently, the system counts methane and nitrogen as “methane only”. This “overestimation” bias is partially counterbalanced by the fact that methane remains in the bottle headspace at the end of the test. For a small headspace volume, this difference does not substantially affect the BMP value (and a correction algorithm is available in the Bioprocess Control software but was not used here). It is, however, possible that methane would appear to be produced faster at the beginning due to this bias.
Concerning B0 values, no significant differences (p = 0.05, based on F-test) were found between the two mixing modes for both the methods. These results suggest that the two methods would indeed end up with the same values, which is what is expected as CH4 production drops and dissolved CH4 or bubbles become less important as the headspace pressure drops.
The lag phase values are perfectly in line with the λ values known for cellulose BMP [30]. However, the λ for AMPTS II (presented in Table 4) is slightly higher compared to the other methods. The reason for this difference remains unclear. Yet, fitting the model with experimental B0 shows no difference among the methods, which may suggest that the initial difference is due to a calculation bias.

3.4. Implications

The observed differences between the three measurements methods (<5%, based on the best mixing option, mode 2, for the manual methods) were small compared to the variability observed in previous round robin studies [6,8,9]. While showing that measurement method differences likely do play some role in the observed interlaboratory variability, the present work shows that each method, if performed properly, can provide very similar BMP values from a practical perspective. This conclusion is generally consistent with method comparisons carried out in three laboratories as part of a recent interlaboratory study, where differences among BMP values measured using two or three methods within individual laboratories did not exceed 6% [6]. Other studies have shown that diverse methods can provide similar BMP results [17,18]. This conclusion is encouraging; it suggests that the much larger differences observed among different laboratories [6], or, in some cases, within a single laboratory using slight variations on the same measurement method [19], could, in fact, be addressed. However, these types of comparisons do not completely address differences among laboratories, because, by design, sources of differences other than the measurement method are eliminated.
The lowest BMP value of 331 mL/g (manometric) measured in this work represents 80% of the theoretical maximum BMP of cellulose (414 mL/g, assuming complete degradation and neglecting biomass production), which is close to the other values measured here. Together, these results suggest that all of these methods, as implemented here, are reasonably accurate. From a practical perspective, these small differences may not be important. Therefore, the criteria to choose the method for measuring BMP could take into account other factors. For example, if the substrate is not homogenous, in order to have a representative sample, it is recommended to use a greater amount of substrate and in this case bigger bottles are recommended: In the manometric or gravimetric method, it is possible to choose the bottle size. Automated volumetric methods are suggested for homogenous samples and are recommended when an operator is not constantly available (normally an operator is required only for the set-up, the start, and the end of the experiment). Gravimetric and manometric methods are more adequate for numerous simultaneous runs (the limiting factor is the size of the temperature-controlled chamber). On the other side, automated volumetric methods, limited in bottle number (15 for the AMPTS II), do not need a temperature-controlled chamber or incubator, which is not always present in laboratories. The investment costs for manometric and volumetric methods are lower (precision manometer, precision balance, and micro gas chromatography) than for automated volumetric methods, but the management and operating costs of automated volumetric methods are much lower. In this study, the gas density method [17] was not tested (it requires as flushing gas 100% N2, and in this study, a mix 80% N2 and 20% CO2 was used) but it represents another option, with low cost but also lower precision, in the BMP methods panorama.
Although the differences between manometric and the other results were small, these small differences may still be important for the most accurate BMP measurements. Validation criteria that have recently been proposed in order to improve the reproducibility of BMP measurements include a relatively narrow window for cellulose BMP of 340–395 mL/g [6]. Manometric results (mode 2) do not meet this criterion, while gravimetric and AMPTS II results do. Therefore, even small measurement biases (ca. 5%) may be important, and selection of the best method becomes essential. However, AMPTS II results had an RSD value above the 6% limit [6], so they would also be excluded under the current criteria.

4. Conclusions

This study showed that three different BMP measurement methods gave only slightly different BMP values, similar from a “practical” perspective. Results showed that:
  • Differences among manometric and gravimetric methods exist, but for these experimental conditions (especially headspace volume), they are small (<5% difference between means).
  • Low variability among methods and reasonable apparent degradability (≥80%) confirm that all three methods can be reasonably accurate.
  • Measurement method differences clearly do contribute to variability among laboratories [6]. However, the (generally) larger differences observed in round robin tests suggests that other sources of error are more important.
  • Given the narrow window for validation based on cellulose BMP and associated RSD, even small differences can be important. In this study, only gravimetric results could be validated based on current criteria.
  • Higher BMP does not always mean more accurate BMP. The mixing comparison suggests that mixing after biogas measurements might underestimate CH4 production from blanks and so overestimate BMP.
  • Kinetic information is, to some degree, dependent on the measurement method.

Supplementary Materials

The following are available online at https://www.mdpi.com/2073-4441/12/6/1839/s1, Figure S1: Model calibration example for specific methane production of manometric method (mixing mode 1) along test duration. Lines illustrate the BMP first order model calibrated on real measures. Figure S2: Model calibration example for specific methane production of manometric method (mixing mode 2) along test duration. Lines illustrate the BMP first order model calibrated on real measures. Figure S3: Model calibration example for specific methane production of gravimetric method (mixing mode 1) along test duration. Lines illustrate the BMP first order model calibrated on real measures. Figure S4: Model calibration example for specific methane production of gravimetric method (mixing mode 2) along test duration. Lines illustrate the BMP first order model calibrated on real measures. Figure S5: Model calibration for specific methane production of AMPTS II. Lines illustrate the BMP first order model calibrated on real measures. Figure S6: Model comparison. (a) BMP values and B0 for manometric and gravimetric method, mixing mode 1 and mixing mode 2; (b) k values for manometric and gravimetric method, mixing mode 1 and mixing mode 2; (c) λ values for manometric and gravimetric method, mixing mode 1 and mixing mode 2.

Author Contributions

Conceptualization, P.B., R.B., R.T.F. and H.B.; methodology, C.A., P.M. and R.T.F.; formal analysis, C.A., R.B., P.B., S.D.H., R.T.F.; investigation, C.A., P.M.; resources, R.B., H.B.; data curation, C.A., P.B., H.B.; writing—original draft preparation, C.A.; writing—review and editing, P.B., S.D.H., R.T.F.; visualization, H.B., C.A., P.B., S.D.H.; supervision, P.B., R.B., H.B.; project administration, P.B.; funding acquisition, P.B. All authors have read and agreed to the published version of the manuscript.

Funding

This research received no external funding.

Acknowledgments

This work was realized within the Graduate School H2O’Lyon (ANR-17-EURE-0018) and Université de Lyon (UdL), as part of the program “Investissements d’Avenir” run by Agence Nationale de la Recherche (ANR). We want to thank the technical team involved in the project: Richard Poncet and Hervé Perier-Camby.

Conflicts of Interest

The authors declare no conflict of interest.

References

  1. Scarlat, N.; Dallemand, J.F.; Fahl, F. Biogas: Developments and perspectives in Europe. Renew. Energy 2018, 129, 457–472. [Google Scholar] [CrossRef]
  2. Koch, K.; Hafner, S.D.; Weinrich, S.; Astals, S.; Holliger, C. Power and Limitations of Biochemical Methane Potential (BMP) Tests. Front. Energy Res. 2020, 8, 1–4. [Google Scholar] [CrossRef]
  3. Angelidaki, I.; Alves, M.; Bolzonella, D.; Borzacconi, L.; Campos, J.L.; Guwy, A.J.; Kalyuzhnyi, S.; Jenicek, P.; Van Lier, J.B. Defining the biomethane potential (BMP) of solid organic wastes and energy crops: A proposed protocol for batch assays. Water Sci. Technol. 2009, 59, 927–934. [Google Scholar] [CrossRef] [PubMed] [Green Version]
  4. Owens, J.M.; Chynoweth, D.P. Biochemical Methane Potential of Municipal Solid Waste (MSW) components. Water Sci. Technol. 1993, 27, 1–14. [Google Scholar]
  5. Holliger, C.; Alves, M.; Andrade, D.; Angelidaki, I.; Astals, S.; Baier, U.; Bougrier, C.; Buffière, P.; Carballa, M.; De Wilde, V.; et al. Towards a standardization of biomethane potential tests. Water Sci. Technol. 2016, 74, 2515–2522. [Google Scholar] [CrossRef]
  6. Hafner, S.D.; Fruteau de Laclos, H.; Koch, K.; Holliger, C. Improving Inter-Laboratory Reproducibility in Measurement of Biochemical Methane Potential (BMP). Water 2020, 12, 1752. [Google Scholar] [CrossRef]
  7. Jingura, R.M.; Kamusoko, R. Methods for determination of biomethane potential of feedstocks: A review. Biofuel Res. J. 2017, 4, 573–586. [Google Scholar] [CrossRef]
  8. Raposo, F.; Fernández-Cegrí, V.; de la Rubia, M.A.; Borja, R.; Béline, F.; Cavinato, C.; Demirer, G.; Fernández, B.; Fernández-Polanco, M.; Frigon, J.C.; et al. Biochemical methane potential (BMP) of solid organic substrates: Evaluation of anaerobic biodegradability using data from an international interlaboratory study. J. Chem. Technol. Biotechnol. 2011, 86, 1088–1098. [Google Scholar] [CrossRef]
  9. Cresson, R.; Pommier, S.; Beline, F.; Bouchez, T.; Bougrier, C.; Buffière, P.; Pauss, A.; Pouech, P.; Preys, S.; Ribeiro, T. Results from a French Inter-Laboratory Campaign on the Biological Methane Potential of Solid Substrates. 2015. Available online: https://hal.archives-ouvertes.fr/hal-01947463/ (accessed on 22 April 2020).
  10. Filer, J.; Ding, H.H.; Chang, S. Biochemical Methane Potential (BMP) Assay Method for Anaerobic Digestion Research. Water 2019, 11, 921. [Google Scholar] [CrossRef] [Green Version]
  11. Pearse, L.F.; Hettiaratchi, J.P.; Kumar, S.; Moreno-Andrade, I.; Buitrón, G. Towards developing a representative biochemical methane potential (BMP) assay for landfilled municipal solid waste–A review. Water Sci. Technol. 2018, 49, 312–324. [Google Scholar] [CrossRef]
  12. Raposo, F.; De La Rubia, M.A.; Fernández-Cegrí, V.; Borja, R. Anaerobic digestion of solid organic substrates in batch mode: An overview relating to methane yields and experimental procedures. Renew. Sustain. Energy Rev. 2012, 16, 861–877. [Google Scholar] [CrossRef]
  13. Rozzi, A.; Remigi, E. Methods of assessing microbial activity and inhibition under anaerobic conditions: A literature review. Rev. Environ. Sci. Biotechnol. 2004, 3, 93–115. [Google Scholar] [CrossRef]
  14. VDI 4630. Fermentation of Organic Materials: Characterisation of the Substrate, Sampling, Collection of Material Data, Fermentation Tests; Verein Deutscher Ingenieure e.V.: Düsseldorf, Germany, 2016. [Google Scholar]
  15. Pereira, C.P.P.; Castañares, G.; Lier, J.B. Van An OxiTop® protocol for screening plant material for its biochemical methane potential (BMP). Water Sci. Technol. 2012, 66, 1416–1423. [Google Scholar] [CrossRef] [PubMed]
  16. Hafner, S.D.; Rennuit, C.; Triolo, J.M.; Richards, B.K. Validation of a simple gravimetric method for measuring biogas production in laboratory experiments. Biomass Bioenergy 2015, 83, 297–301. [Google Scholar] [CrossRef]
  17. Justesen, C.G.; Astals, S.; Mortensen, J.R.; Thorsen, R.; Koch, K.; Weinrich, S.; Triolo, J.M.; Hafner, S.D. Development and Validation of a Low-Cost Gas Density Method for Measuring Biochemical Methane Potential (BMP). Water 2019, 11, 2431. [Google Scholar] [CrossRef] [Green Version]
  18. Hafner, S.D.; Astals, S. Systematic error in manometric measurement of biochemical methane potential: Sources and solutions. Waste Manag. 2019, 91, 147–155. [Google Scholar] [CrossRef]
  19. Himanshu, H.; Voelklein, M.A.; Murphy, J.D.; Grant, J.; O’Kiely, P. Factors controlling headspace pressure in a manual manometric BMP method can be used to produce a methane output comparable to AMPTS. Bioresour. Technol. 2017, 238, 633–642. [Google Scholar] [CrossRef]
  20. Pauss, A.; Andre, G.; Perrier, M.; Guiot, S.R. Liquid-to-Gas mass transfer in anaerobic processes: Inevitable transfer limitations of methane and hydrogen in the biomethanation process. Appl. Environ. Microbiol. 1990, 56, 1636–1644. [Google Scholar] [CrossRef] [Green Version]
  21. Kaparaju, P.; Buendia, I.; Ellegaard, L.; Angelidakia, I. Effects of mixing on methane production during thermophilic anaerobic digestion of manure: Lab-scale and pilot-scale studies. Bioresour. Technol. 2008, 99, 4919–4928. [Google Scholar] [CrossRef]
  22. Wang, B.; Björn, A.; Strömberg, S.; Nges, I.A.; Nistor, M.; Liu, J. Evaluating the influences of mixing strategies on the Biochemical Methane Potential test. J. Environ. Manage. 2017, 185, 54–59. [Google Scholar] [CrossRef]
  23. Hafner, S.D.; Astals, S.; Buffiere, P.; Løjborg, N.; Holliger, C.; Koch, K.; Weinrich, S. Calculation of Methane Production from Manometric Measurements. Standard BMP Methods Document 202, Version 2.5. Available online: https://www.dbfz.de/en/BMP (accessed on 23 April 2020).
  24. Hafner, S.D.; Richards, B.K.; Astals, S.; Holliger, C.; Koch, K.; Weinrich, S. Calculation of Methane Production from Gravimetric Measurements. Standard BMP Methods Document 203, Version 1.0. Available online: https://www.dbfz.de/en/BMP (accessed on 19 April 2020).
  25. Bioprocess Control AB AMPTS II. Available online: http://www.bioprocesscontrol.com/products/ampts-ii/ (accessed on 19 April 2020).
  26. Gilcreas, F.W. Standard methods for the examination of water and waste water. Am. J. Public Health Nations Health 1966, 56, 387–388. [Google Scholar] [CrossRef] [PubMed]
  27. Hafner, S.D.; Astals, S.; Holliger, C.; Koch, K.; Weinrich, S. Calculation of Biochemical Methane Potential (BMP). Standard BMP Methods Document 200, Version 1.6. Available online: https://www.dbfz.de/en/BMP (accessed on 19 April 2020).
  28. R Core Team. A Language and Environment for Statistical Computing; R Foundation for Statistical Computing: Vienna, Austria, 2020. [Google Scholar]
  29. Holliger, C.; de Laclos, H.; Hafner, S.D.; Koch, K.; Weinrich, S.; Astals, S.; Alves, M.; Andrade, D.; Angelidaki, I.; Appels, L.; et al. Requirements for Measurement of Biochemical Methane Potential (BMP). Standard BMP Methods Document 100, Version 1.3. Available online: https://www.dbfz.de/en/BMP (accessed on 19 April 2020).
  30. Wang, B.; Strömberg, S.; Li, C.; Nges, I.A.; Nistor, M.; Deng, L.; Liu, J. Effects of substrate concentration on methane potential and degradation kinetics in batch anaerobic digestion. Bioresour. Technol. 2015, 194, 240–246. [Google Scholar] [CrossRef] [PubMed]
Figure 1. Sequence of steps used in the manometric and gravimetric tests for mixing modes 1 and 2.
Water 12 01839 g001
Figure 2. The AMPTS II® analytical device: (a) Sample incubation unit with bottles and mixers. (b) Carbon dioxide absorption unit. (c) Flow cell array (based on “Bioprocess Control” website [25]).
Water 12 01839 g002
Figure 3. Gravimetric and manometric specific methane production (SMP) expressed in mL of CH4 per g VS for BMP tests with mixing mode 1 (left) and 2 (right). Each point shows an average value (n = 5) and vertical lines show standard deviation (usually smaller than plotting symbol).
Water 12 01839 g003
Figure 4. Change in SMP between two consecutive measurement points for BMP tests with mixing mode 1 (left) and 2 (right). Each point shows an average value (n = 5) and vertical lines show standard deviation.
Water 12 01839 g004
Figure 5. Comparison of the interval methane volume produced by each bottle as measured by manometric vs. gravimetric methods. Color shows the duration of the incubation at the time of measurement. The solid gray lines show regression lines for the two separate mixing modes, while the black dashed lines show a 1:1 response.
Water 12 01839 g005
Figure 6. Methane content in the gas phase of blank and cellulose bottles for mixing mode 1 and mixing mode 2 (mean values, n = 5). The standard deviation is shown as vertical bars, which are generally smaller than the plotting symbols. Note that the CH4 concentration is not normalized and low values are due to the dilution of biogas with flushing gas (N2 + CO2).
Water 12 01839 g006
Figure 7. Specific methane production for each method along the test duration. Each line illustrates the first-order model of BMP calibrated for each method (values of Table 4).
Water 12 01839 g007
Table 1. TS and VS values of cellulose and inoculum expressed in percentage of total mass (mean and standard deviation, n = 3).
TS (%)VS (%)
Cellulose93.4 ± 0.1993.3 ± 0.20
Inoculum3.13 ± 0.032.11 ± 0.04
Table 2. Cellulose BMP and methane productivity of the inoculum (blanks) measured by different methods. Inoculum methane productivity and cellulose BMP are in mLCH4/gVS.
BottleManometric Mixing Mode 1Manometric Mixing Mode 2Gravimetric Mixing Mode 1Gravimetric Mixing Mode 2AMPTS II
ValueAverage RSD *ValueAverage RSDValueAverage RSDValueAverage RSDValueAverage RSD
Inoculum147.548.1
1.7%
52.552.4
2.6%
48.549.3
2.0%
53.053.5
1.9%
51.355.9
7.7%
249.454.350.255.159.9
348.152.949.954.056.6
447.851.248.052.8-
547.551.049.752.8-
Cellulose1344.5343.1
1.0%
333.3330.6
2.5%
357.9357.7
1.0%
352.8347.0
2.0%
324.9342.9
7.3%
2344.3327.9358.4346.1334.5
3344.2326.6361.1344.1369.3
4338.0343.1353.2354.1-
5344.6322.0357.8338.0-
* Relative standard deviation (% of mean).
Table 3. Specific methane production from cellulose tests without correction for inoculum (mLCH4/gVS of cellulose) measured by different methods.
BottleManometric Mixing Mode 1Manometric Mixing Mode 2Gravimetric Mixing Mode 1Gravimetric Mixing Mode 2AMPTS II
ValueAverage RSDValueAverage RSDValueAverage RSDValueAverage RSDValueAverage RSD
1447.2445.9
1.3%
442.4441.1
2.0%
463.2463.0
1.4%
464.6459.9
1.5%
442.5458.1
4.9%
2443.8440.1460.5460.7447.8
3452.4432.5471.7452.4483.8
4437.0455.5454.5468.6
5449.0434.7464.8453.3
Table 4. Fitted model parameters for each method: B0 is the maximum methane production (mLCH4/gVS), k is the first-order decay constant k (d−1), and λ is the lag phase (d). Values are means ± standard deviation (n = 3 for AMPTS II, otherwise n = 5).
Model ParametersManometric Mode 1Manometric Mode 2Gravimetric Mode 1Gravimetric Mode 2AMPTS II
k (d−1)0.31 ± 0.020.32 ± 0.020.31 ± 0.020.31 ± 0.020.56 ± 0.05
B0 (mLCH4/gVS)333.8 ± 1.3 327.1 ± 5.8348.9 ± 1.4343.9 ± 4.5335.7 ± 9.2
λ (d)1.47 ± 0.021.52 ± 0.031.47 ± 0.021.51 ± 0.031.68 ± 0.05

