Article

An Improved Fuzzy Analytic Hierarchy Process for the Allocation of Water Rights to Industries in Northeast China

State Key Laboratory of Simulation and Regulation of Water Cycle in River Basin, China Institute of Water Resources and Hydropower Research, Beijing 100038, China
*
Author to whom correspondence should be addressed.
Water 2020, 12(6), 1719; https://doi.org/10.3390/w12061719
Submission received: 5 May 2020 / Revised: 6 June 2020 / Accepted: 11 June 2020 / Published: 16 June 2020
(This article belongs to the Special Issue Water Management for Agricultural, Environmental and Urban Uses)

Abstract

:
To facilitate water management and efficient utilization of water resources, the allocation of water rights to individual industries must be underpinned by a rational and defensible process. This study aimed to develop an improved fuzzy analytic hierarchy process method of allocating water rights to different industries and focused on Qing’an County, northeast China as a case study. An evaluation index system for allocation of initial water rights was established, and incorporated physiographic, societal, economic, and ecological criteria. The system classifies four categories of second-level indices, 14 third-level indices, and 30 fourth-level indices. The order of priority of the evaluation index was determined and the total weight of initial water rights for different industries was calculated using the fuzzy analytic hierarchy process method. Results showed that the indices for the allocation of initial water rights ranked in descending order of their total weights coefficient were: (1) agricultural water rights: 0.9508; (2) residential water rights: 0.0240; (3) water rights for non-agricultural production: 0.0173; (4) environmental water rights: 0.0078. Agricultural water consumption accounted for the largest proportion of total water because the study area is a major grain production area. The study provides a theoretical basis for the allocation of water rights and water rights trading in northeast China.

1. Introduction

The rational allocation of water resources among industries plays an important role in promoting the coordinated development of the social economy. Although average yearly agricultural water consumption in China accounts for 70% of total water consumption, agriculture remains less state-of-the-art irrigations and full covered water conservancy infrastructure. The rapid acceleration of urbanization and industrialization has resulted in residential and industrial water needs being prioritized over those of agriculture and the environment. With the continuous year-by-year reduction in available water along with increases in water demand, a rational and defensible method of assigning water rights to individual industries is a priority. Therefore, there is value in conducting research related to developing relevant systems and mechanisms for the allocation of water rights to alleviate water shortages among different industries. The allocation of initial water rights to different industries is an important component of water rights trading and water management to achieve efficient use of water resources and to promote high agricultural yield through appropriate water diversion and distribution [1,2].
There have been many previous studies focusing on the allocation of initial water rights over the last 30 years. Early studies included research into water laws that were suitable for areas with different characteristics [3,4,5] and studies that defined water rights [6]. John [7] (2005) and Zhong [8] (2009) introduced the concept of the allocation of initial water rights based on equity and sustainability. Other studies proposed the allocation of water rights based on land area, funding, and priority of water resources utilization [9,10]. Walmsley [11] (1995) proposed two mechanisms for the allocation of water rights, with one based on a centralized mechanism and the other on a market-based mechanism. Jerson [12] (2002) proposed a water rights allocation model based on the opportunity cost of water for different users. Kreutzwiser [13] (2004) proposed a water permit system based on the priority of water use and a reasonable charge for water use to compensate for the shortcomings of the original agricultural management and water intake permit system. Marleen et al. [14] (2014) and Zachary [15] (2018) proposed a water rights allocation mechanism based on equitable apportionment that is better able to achieve a fairer apportionment of drought impacts among individual water users while meaningfully elevating the rights of future generations to water and increasing adaptive capacity. The Drought Water Rights Allocation Tool (DWRAT) and improved Python Water Rights Allocation Tool (PyWRAT) were developed for the allocation of water rights in drought conditions by linearizing nonlinear problems [16,17]. Zhong [8] (2009) proposed a multi-objective optimization model based on a genetic algorithm (GA) that can assist in the initial definition and allocation of water rights for different counties. Xiao [18] (2011) and Ge [19] (2017) proposed a method for allocating initial water rights at the provincial level which considers total water use and combines a dynamic projection pursuit technique with a self-adaptive chaotic optimization algorithm. Zhang et al. [20] (2020) developed an Interval-parameter Two-stage Stochastic Programming (ITSP) model for the allocation of water rights based on the conditional value-at-risk theory and Gini coefficient constraints and the assumption that optimized allocation of water rights can reduce the risk of inequitable localized water deficits. Wang et al. [21] (2018) and Zhang [22] (2013) proposed a hierarchical structural model for the allocation of water rights using the hierarchical analysis method, and investigated trades in water rights. However, despite these aforementioned studies, many shortcomings in the allocation of initial water rights remain. Current methods of allocating water rights across different industries do not sufficiently take into consideration population, irrigated agricultural area, and Gross Domestic Product (GDP). Many uncertainties continue to exist, such as the degree of annual population change, changes to the irrigated area due to soil erosion and yearly changes to GDP. In addition, the current system of allocating water rights to different industries does not take into account the market model and the concept of sustainable development as it does not consider policy fluctuations and interaction among multiple constraints. Finally, although methods proposed by previous studies such as an analytic hierarchy process, multi-objective genetic algorithms, and dynamic projection pursuit technique can solve the multi-objective and multi-level characteristics of the water rights allocation problem, each approach has both advantages and disadvantages. The advantages are the methods are more advanced, faster computing speed, and many complex factors are considered, whereas there’s an important disadvantage is no individual method can completely address the uncertainty in the allocation process.
The analytic hierarchy process (AHP) was proposed by Saaty [23] in 1977 and is widely used in the calculation of weightings for an evaluation index system. AHP is a flexible and simple statistical method of multidimensional objective policy making and can transform qualitative indicators to quantitative indicators to address complex problems in a hierarchical and systematic way [24,25,26,27]. Some of the great advantages of the AHP include its ability to handle complex real-life problems and its ease of use [28]. Previous studies have demonstrated the potential and effectiveness of AHP when applied to a geographical information system (GIS) interface [29,30,31], ecological vulnerability assessment, evaluation of irrigation water quality, and the evaluation of agricultural water management in irrigation districts [32,33,34]. Other studies have suggested that AHP can solve complex problems of water allocation with multiple levels and objectives [21,22]. Nevertheless, previous studies that applied AHP highlighted deficiencies and limitations, including uncertainty and poor reliability of results of the original analytic hierarchy process in calculating the weights of evaluation indices; therefore, the potential remains for improvement of the AHP model for better allocation of initial water rights [35,36]. Accordingly, the present study improves the original analytic hierarchy process by combining the AHP model with fuzzy decision theory. The improved fuzzy analytic hierarchy process considers the hierarchy structure and the number of indicators, making the results more reasonable. Furthermore, the exponential scaling was adopted to convert the 1–9 scales and the membership function is fuzzified to obtain more accurate results [37]. This approach aims to develop a method that is easy to operate and that can solve the complex problem of allocating water rights considering multiple levels, multiple objectives, and multiple decisions.
The present study was conducted in Qing’an County of Northeast China and aimed to present an approach for allocating water rights in different industries in the county. The current study followed the approach of: (1) evaluation indices were screened and appropriate indices were identified by theoretical analysis and the Delphi method [38], following which the evaluation index system for allocation of water rights for different industries was established, and the hierarchical structure map was constructed; (2) by combining with fuzzy decision theory, the fuzzy assessment matrix was constructed and the consistency of the fuzzy assessment matrices were evaluated; (3) the total weight of each index in the index evaluation system for allocation of water rights to different industries was calculated through the improved fuzzy AHP method; (4) the priority order of the industries was evaluated and the comprehensive weight of each industry was obtained according to its position in the evaluation index; (5) the total available water rights in the county were allocated to agricultural, residential, non-agricultural production and environmental, and the results of water rights allocation to the different industries were obtained. The present study provides a theoretical basis for the allocation of water rights to industries and the establishment of a sustainable water resources management system in northeast China.

2. Materials and Methods
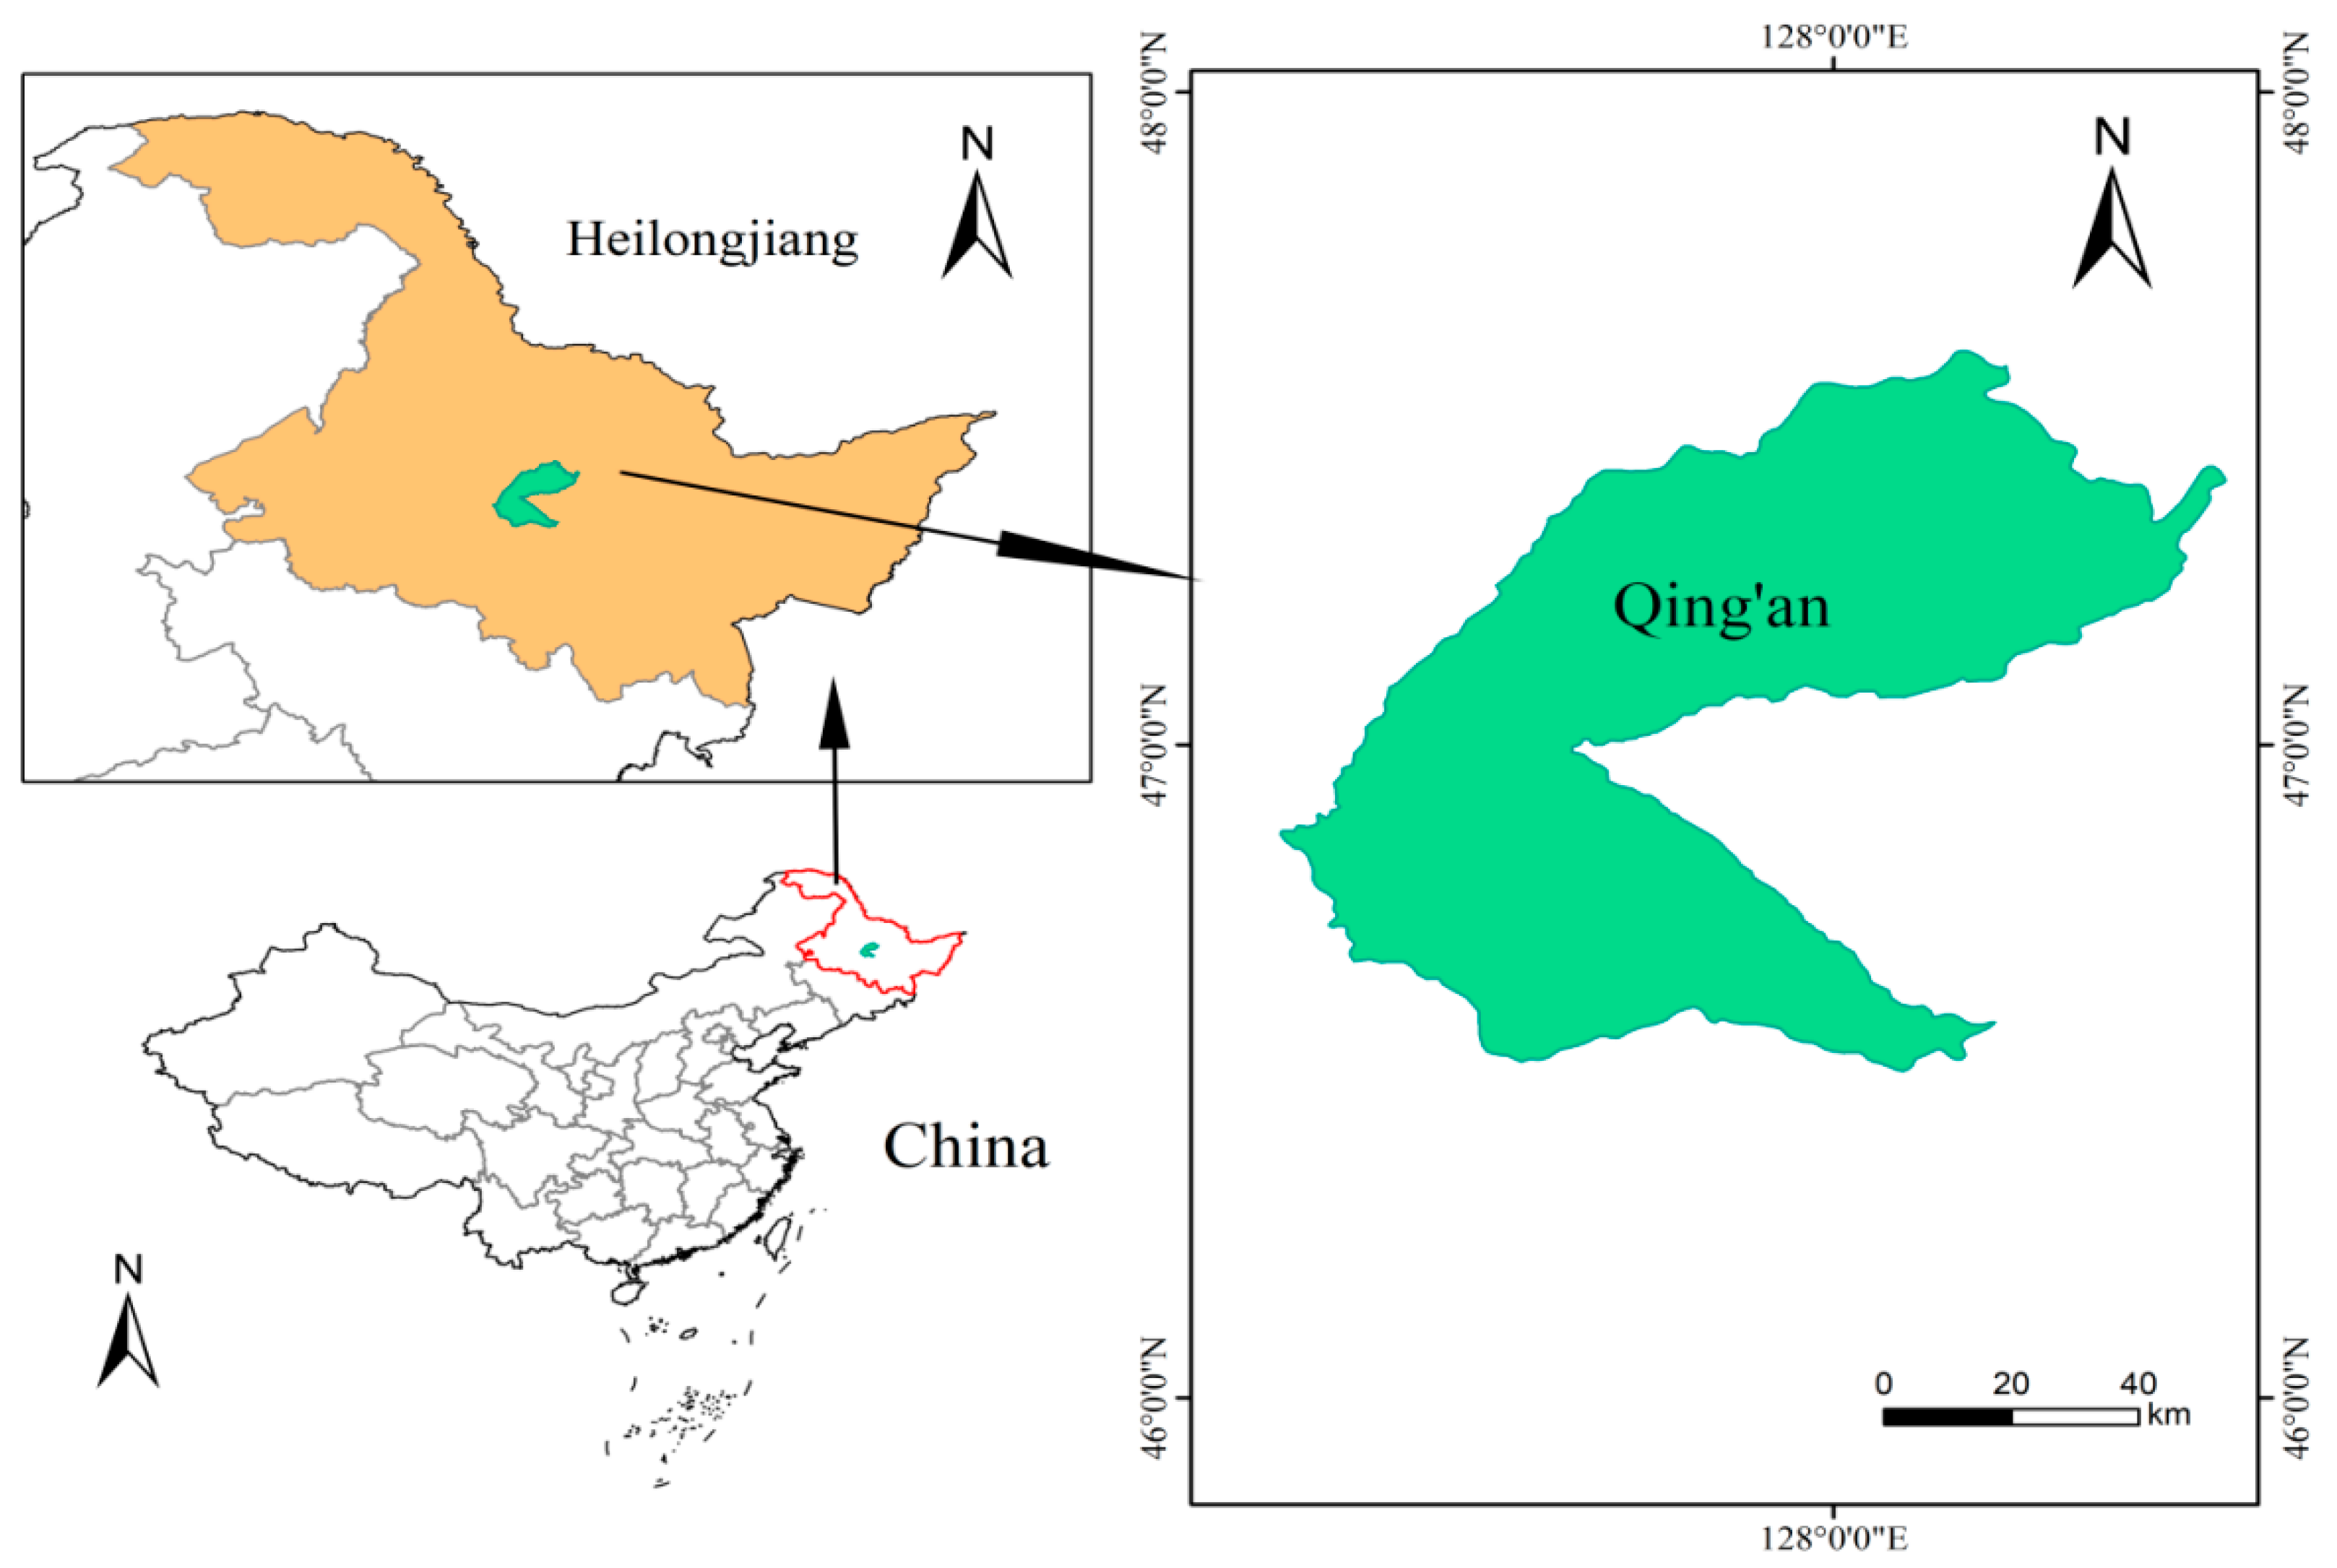
2.1. Study Area

Qing’an County is located in the middle of Heilongjiang Province, between latitude 46°30′–47°36′ N, longitude 127°14′–28°32′ E (Figure 1). The total area of the county is 5469 km2, accounting for 15.53% and 1.16% of the total areas of the city and province, respectively. The region can be described as typically semi-arid and semi-humid, with obvious seasonal climate characteristics, long and cold winters, and short, warm and rainy summers. The average annual potential evaporation (measured with 20 cm evaporating dish) and average rainfall are 664.5 mm and 545.3 mm, respectively. The maximum depth of permafrost in this region is 1.8–2.1 m, and the region experiences freezing for approximately 6 months.
The county incorporates 14 townships and 93 administrative villages under its jurisdiction, with a population of 370,000, of which the population participating in agriculture is 306,000, accounting for 82.7% of the total population. The cultivated land area in the region accounts for 67.65% of the entire city, while the total water resources only account for 41.82%. Per capita water availability is only 1464 m3, far below internationally recognized water needs and verging on what can be officially be defined as a water shortage. There are nine river flow networks in Qing’an County, seven of which have their headwaters within the territory. The total area of the basin is 5905 km2, the average annual runoff is 2.33 billion km3 and total groundwater resources are 2.532 billion km3, including 542 million km3 of distributable water resources. The utilization coefficient of irrigation water in Qing’an County is 0.47, far behind more advanced levels achieved globally of 0.7–0.8. Growing water shortages across the various industries have been experienced, exacerbated by the low water utilization efficiency and the high costs of water supply. The unsustainable use of groundwater is a serious problem with an evident decline in the groundwater level with concurrent groundwater pollution. The decline in the health of aquatic ecosystems has seen a reduction in ecosystem services, resulting in the water quality of water resources not satisfying basic water-use standards, which aggravates water shortages across different industries. On the other hand, the rapid increase in population and the development of the social economy has resulted in continual year-on-year increases in the utilization of water resources and increasing disparity between available water supply and demand for water in some areas of the region.
In view of the aforementioned challenges in water resources management, the traditional method of allocating water resources can no longer be regarded as adequate to meet the needs for the long-term development of the region. Therefore, there is a need to revisit methods for the initial allocation of initial water rights to different industries as the basis of all water rights and trading of water rights. Qing’an County (Figure 1) was selected based on the importance of this region as a base of grain production in Heilongjiang Province, and because achieving productive agricultural development requires a stable supply of water resources. The attainment of the weighting of indices is a prerequisite for the allocation of initial water rights since these weightings have a decisive influence on the coordinated development of the regional population, society, economy, and environment. The allocation of initial water rights and confirmation of the priorities of allocation of water to different industries in this region remains in a preliminary stage. Thus, the county is one of the first counties in China to allocate and confirm water rights. Therefore, the experience of allocating water rights in Qing’an County is of great practical significance for other areas and can provide a theoretical basis for the establishment of a water resources management system.

2.2. Methods

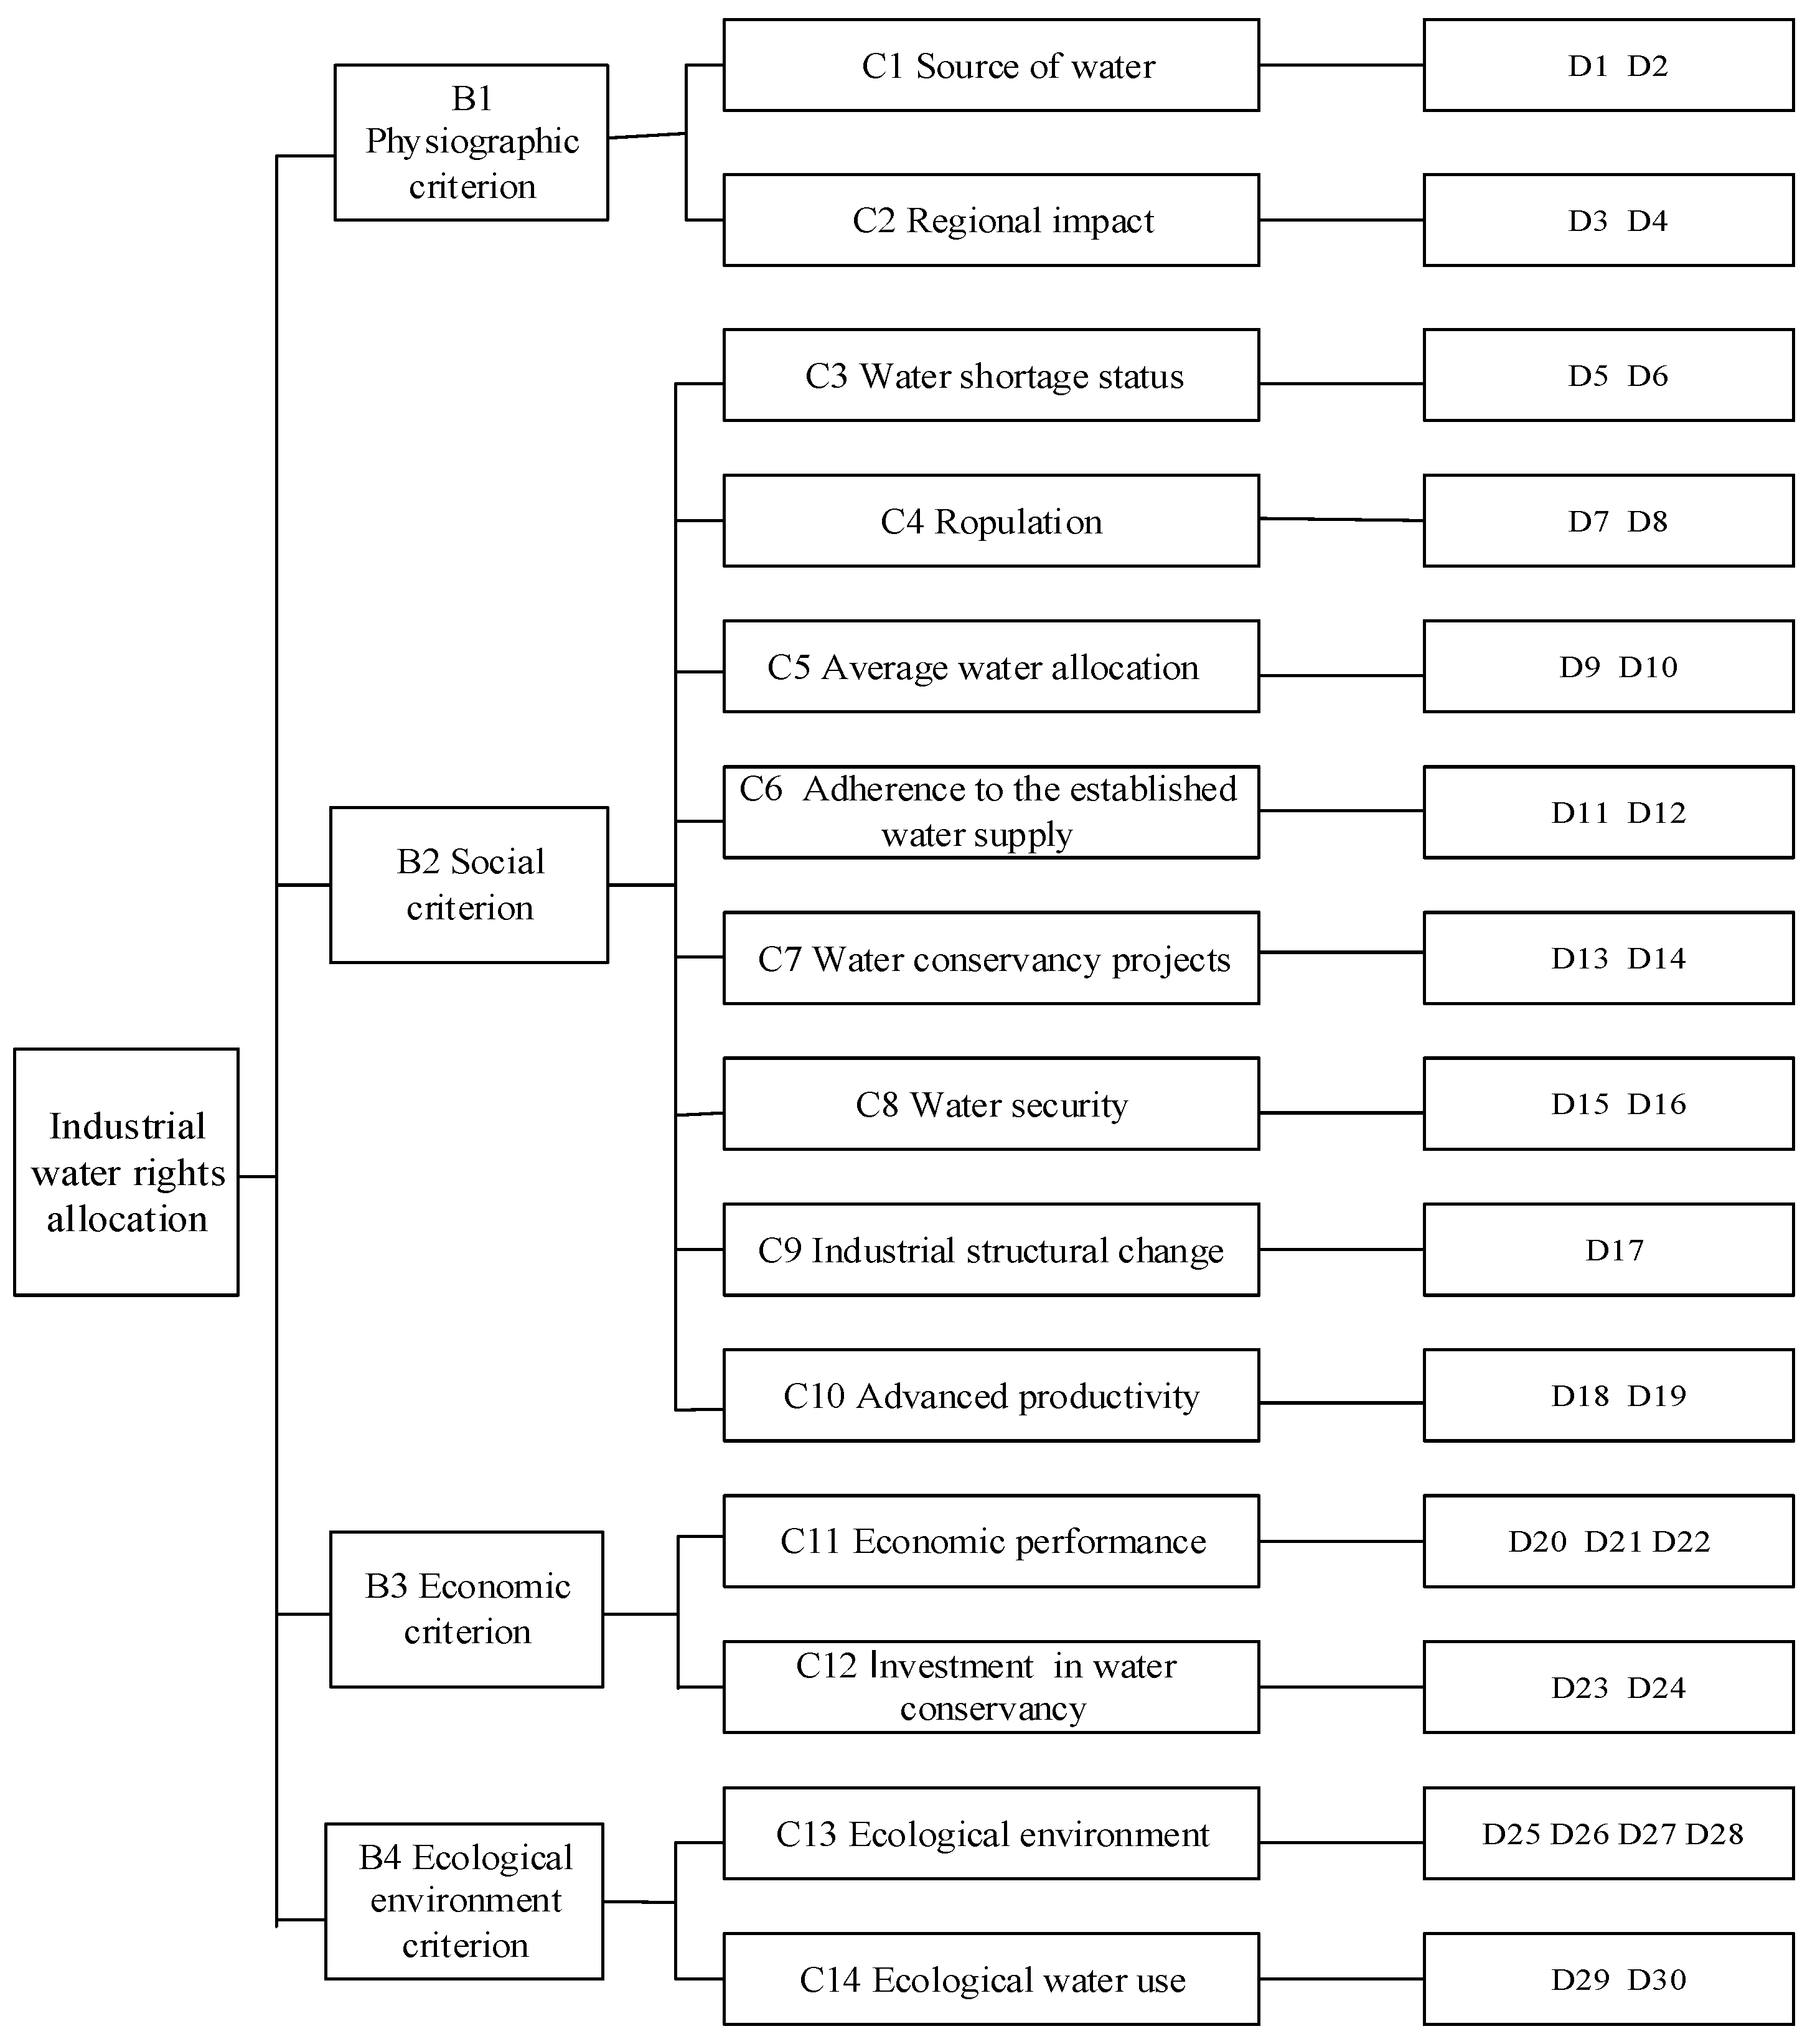
2.2.1. The Establishment of the Index System

The Delphi technique was developed during the 1950s and has become a widely-used tool for measuring and aiding forecasting of the potential benefits of decision making in a variety of disciplines [38]. The present study adopted the Delphi method to construct an index system for the allocation of initial water rights to different industries, and the representativeness, relevance, independence, ease of quantification, simplicity, and practicability of the evaluation index should be taken into account. First, the levels of the index were constructed by comprehensively considering all relevant factors, which indices are relevant and avoiding repetition. Second, the index system was classified based on economic, social, and environmental characteristics of the study area, and the levels of various indicators were identified. Finally, the index level was expanded to achieve a complete and practical index system with a strong structure and high representativeness. The initial water rights allocation hierarchy consisting of objectives, criteria, evaluation, and index levels based on the Delphi survey results and theoretical analysis was constructed as shown in Figure 2. The hierarchy was classified according to four categories of second-grade indices, 14 third-grade indices, and 30 fourth-grade indices.
D1: Ratio of available water resources; D2: Water quality; D3: Distance index; D4: Superiority of geographical location; D5: Water quantity shortage; D6: Poor water quality; D7: Population growth rate; D8: Population density; D9: Per capita water allocation; D10: Irrigation quota; D11: Current water supply; D12: Agricultural facilities; D13: Water utilization efficiency; D14: Channel lining rate; D15: Agricultural water safety; D16: Degree of medical and health facilities; D17: Rate of industrial structure change; D18: Scientific and technological progress; D19: Water saving irrigation technology; D20: Ratio of income generated by water conservancy to total GDP; D21: Ratio of income generated by grain to total GDP; D22: Income of per-water production unit; D23: Investment dynamics; D24: Water price on cost; D25: Land salinization control; D26: River cut-off; D27: Artificial groundwater recharge; D28: Influence of permafrost; D29: Ratio of ecological water use to total water use; D30: Guaranteed rate of ecological water use.

2.2.2. Improved Fuzzy AHP Method

  • The original AHP
Once the hierarchy of the index system was established (Figure 2), the relative importance of the indices was determined within each level with respect to the related criteria in the adjacent higher level according to expert knowledge, which facilitated the paired comparison for each level of the index. The assessment matrix E = (eij)n × n was then constructed using the results of every evaluator’s pair-wise comparison. eij is the relative importance of two indices to the above level, divided into 1–9 categories (Table 1).
E = { e 11 e 12 e 1 n e 21 e 22 e 2 n e n 1 e n 2 e n n }
The square root method was used to calculate the maximum eigenvalue of the assessment matrix, with the formula as follows:
λ max = n i = 1 ( E W ) i n W i
In Equation (2), Wi is the weight vector and λmax is the maximum characteristic root value.
The eigenvector of the evaluation index was standardized and the final weight (wi) vector was obtained [39]:
Psi = Gi(1/k)
w i = { p s 1 i = 1 m P s i , p s 2 i = 1 m P s i , p s m i = 1 m P s i }
In Equations (3) and (4), Psi is the root value, Gi = ei1 × ei2...× ein, i = 1, 2, 3, ..., n, K is the order of the assessment matrix and wi is the final weight vector.
As the evaluation system is a complex and the choices made by experts are inevitably often one-sided and subjective, there might be an inconsistency between assessment matrices by different experts. Thus, the original method assesses the consistency of the assessment matrix by calculating the consistency ratio before the weight vector is calculated:
C R = C I R I
In Equation (5), CI is the consistency index and RI is the average random consistency index.
When CR < 0.1, the assessment matrix can be considered to satisfy the consistency condition; otherwise, the matrix should be reconstructed and re-assessed to meet the consistency.
2.
The improved fuzzy AHP.
During the process of constructing the assessment matrix using the original analytic hierarchy process, the assignment on the scale of “1–9” is relatively rough and a reversed order contrary to the actual situation may appear. Moreover, there is a conflict between the matrix consistency and logical consistency, resulting in an inability to accurately quantify the membership relationship between each index. It is considered that more accurate results can be obtained by using exponential scaling in conjunction with a great deal of practical experience. The exponential scaling is based on Weber’s law in psychology and has many excellent properties which allowed the problems of “1–9” scaling to be overcome [24]. Therefore, the conversion between the two scales needs to be conducted before evaluating the priority (Table 2).
In the present study, the above method along with a fuzzy consistency matrix were used to assess the consistency of the fuzzy assessment matrix. Each row of the assessment matrix E = (eij)n×n, marked as m i = k = 1 n e i k (i = 1, 2, 3…n), m i j = m i m j 2 ( n 1 ) + 0 . 5 was summed, allowing the fuzzy consistency matrix M = (mij)n × n corresponding to the assessment matrix E to be obtained. For matrix E and matrix M, there are two test indicators:
α = m a x { | e i j m i j |   }
β = i = 1 n ( e i j m i j ) j = 1 n ( e i j m i j ) n
a. When α < 0.2 and β < 0.1, it can be considered that the fuzzy complementary matrix accords with reality. By normalizing the fuzzy consistency matrix, the weight vector W can be obtained.
b. When α ≥ 0.2 or β ≥ 0.1, it is considered that the fuzzy complementary matrix does not accord with reality; therefore, it is necessary for experts to re-judge and recalculate according to the steps until the conditions are met.

2.2.3. Fuzzy Comprehensive Evaluation Method

The fuzzy comprehensive evaluation theory was adopted to address the uncertainty problems resulting from the quantification of the non-quantitative indices during the process of allocating initial water rights. The complex system is optimized and the membership function is fuzzified to eliminate the skipping phenomenon when the evaluation grade changes in a small range at the endpoint of an interval. The membership degree matrix R is calculated so that ri(t) (t = 1, 2, 3, 4, 5) is the membership degree of the tth grade. x m a x ( t ) is the upper limit of the tth evaluation grade and x m i n ( t ) is the lower limit of the tth evaluation grades. x ( t ) ¯ = x m a x ( t ) + x m i n ( t ) 2 is the average of the tth evaluation grade.
  • For indices in which bigger values indicate better outcomes:
When r i < x m a x ( 1 ) :
r i ( 1 ) = 1 , r i ( 2 ) = r i ( 3 ) = r i ( 4 ) = r i ( 5 ) = r i ( 6 ) = 0
When x m i n ( t ) < r i x ( t ) ¯ :
{ r i ( t 1 ) = 0 . 5 ( 1 r i x m i n ( t ) x ( t ) ¯ x m i n ( t ) ) r i ( t ) = 0 . 5 ( 1 + r i x m i n ( t ) x ( t ) ¯ x m i n ( t ) )
The membership degree of other grades is 0;
When r i = x ( t ) ¯ (i = 2, 3, 4, 5),
r i ( t ) = 1
The membership degree of other grades is 0;
When x ( t ) ¯ < r i x m a x ( t ) ,
{ r i ( t ) = 0 . 5 ( 1 + x m a x ( t ) r i x m a x ( t ) x ( t ) ¯ ) r i ( t + 1 ) = 0 . 5 ( 1 x m a x ( t ) r i x m a x ( t ) x ( t ) ¯ )
The membership degree of other grades is 0;
When r i > x m i n ( 6 ) :
r i ( 1 ) = r i ( 2 ) = r i ( 3 ) = r i ( 4 ) = r i ( 5 ) = 0 , r i ( 6 ) = 1
2.
For indices in which smaller values are better outcomes:
When r i > x m i n ( 1 ) :
r i ( 1 ) = 1 , r i ( 2 ) = r i ( 3 ) = r i ( 4 ) = r i ( 5 ) = r i ( 6 ) = 0
When x m i n ( t ) < r i x ( t ) ¯ ,
{ r i ( t ) = 0 . 5 ( 1 + r i x m i n ( t ) x ( t ) ¯ x m i n ( t ) ) r i ( t + 1 ) = 0 . 5 ( 1 r i x m i n ( t ) x ( t ) ¯ x m i n ( t ) )
The membership degree of other grades is 0;
When r i = x ( t ) ¯ (i = 2, 3, 4, 5),
r i ( t ) = 1
The membership degree of other grades is 0;
When x ( t ) ¯ < r i x m a x ( t ) ,
{ r i ( t - 1 ) = 0 . 5 ( 1 x m a x ( t ) r i x m a x ( t ) x ( t ) ¯ ) r i ( t ) = 0 . 5 ( 1 + x m a x ( t ) r i x m a x ( t ) x ( t ) ¯ )
The membership degree of other grades is 0;
When r i < x m a x ( 6 ) :
r i ( 1 ) = r i ( 2 ) = r i ( 3 ) = r i ( 4 ) = r i ( 5 ) = 0 , r i ( 6 ) = 1
The membership matrix (R) is built according to the membership function of each index. Equations (8)–(17).
R = { r 11 ( x 1 , 1 ) r 12 ( x 1 , 2 ) r 1 n ( x 1 , n ) r 21 ( x 2 , 1 ) r 22 ( x 2 , 2 ) r 2 n ( x 2 , n ) r n 1 ( x n , 1 ) r n 2 ( x n , 2 ) r n n ( x n , n ) }
Then the fuzzy synthesis matrix B would be calculated based on the weight w of each index by improved fuzzy AHP method.
B = w × R

2.2.4. The Total Weight Coefficient of Initial Water Rights for Different Industries

  • The relative weight and priority of each index were determined in the objective, criteria, evaluation, and index levels before the total weight coefficient of each index was be calculated.
F m = B i × C j × D k
In Equation (20), Fm is the total weight coefficient of the mth index, Bi (i = 1, 2, 3, 4) is the weight coefficient of the type i criterion, Cj (j = 1, 2, 3, ..., 14) is the weight coefficient of type j evaluation and Dk (k = 1, 2, 3, ..., 30) is the weight coefficient of the kth index.
2.
The data of each grade was quantified by assigning a value between 0–1, following which the water rights weight coefficient of each industry was obtained according to the membership grade of each water industry, combined with the total weight coefficient of each index.
G l = m = 1 30 F m × g l l = 1 4 m = 1 30 F m × g l
In Equation (21), Gl (l = 1, 2, 3, 4) is the total weight coefficient of the lth industrial water rights and gl is the membership grade of the lth industrial water rights.

2.3. Data Collection

Data representing the society, economy, water resources utilization and water conservancy projects in the study area were sourced from the Heilongjiang Institute of Water Resources and Hydropower Research, the Qing’an County Water Conservancy Bureau, the Qing’an County Bureau of Statistics, irrigation district management units and other departments. The total available water rights would be affected by natural and artificial factors. For example, precipitation can result in fluctuations in available water resources, which may influence available water rights. In addition, the total of available water rights is limited by available water resources in the county, and artificial water resources management such as “three red lines” regulation may result in the reduction of total available water rights during planning periods (Appendix A Table A1).
In the present study, a total of 58 water conservancy experts participated in the evaluation of the allocation of initial water rights using a questionnaire survey. The 58 experts originated from Heilongjiang University, Heilongjiang Provincial Water Resources Department, the Heilongjiang Institute of Water Resources and Hydropower Research, the China Institute of Water Resources and Hydropower Research, irrigation district management units, rural water use associations, and other departments.

3. Results and Discussion

3.1. The Weightings of Initial Water Rights for Different Industries

3.1.1. The Establishment of the Fuzzy Assessment Matrix

Appendix B Table A2, Table A3 and Table A4 show the results of the evaluation of the consistency of the assessment matrix as well as the calculation results for different levels. The assessment matrix for different evaluation levels met the criteria of CR < 0.1, α < 0.2, and β < 0.1; therefore, this approach was appropriate for calculating the weight of each index for allocating initial water rights to different industries using the improved fuzzy AHP method.

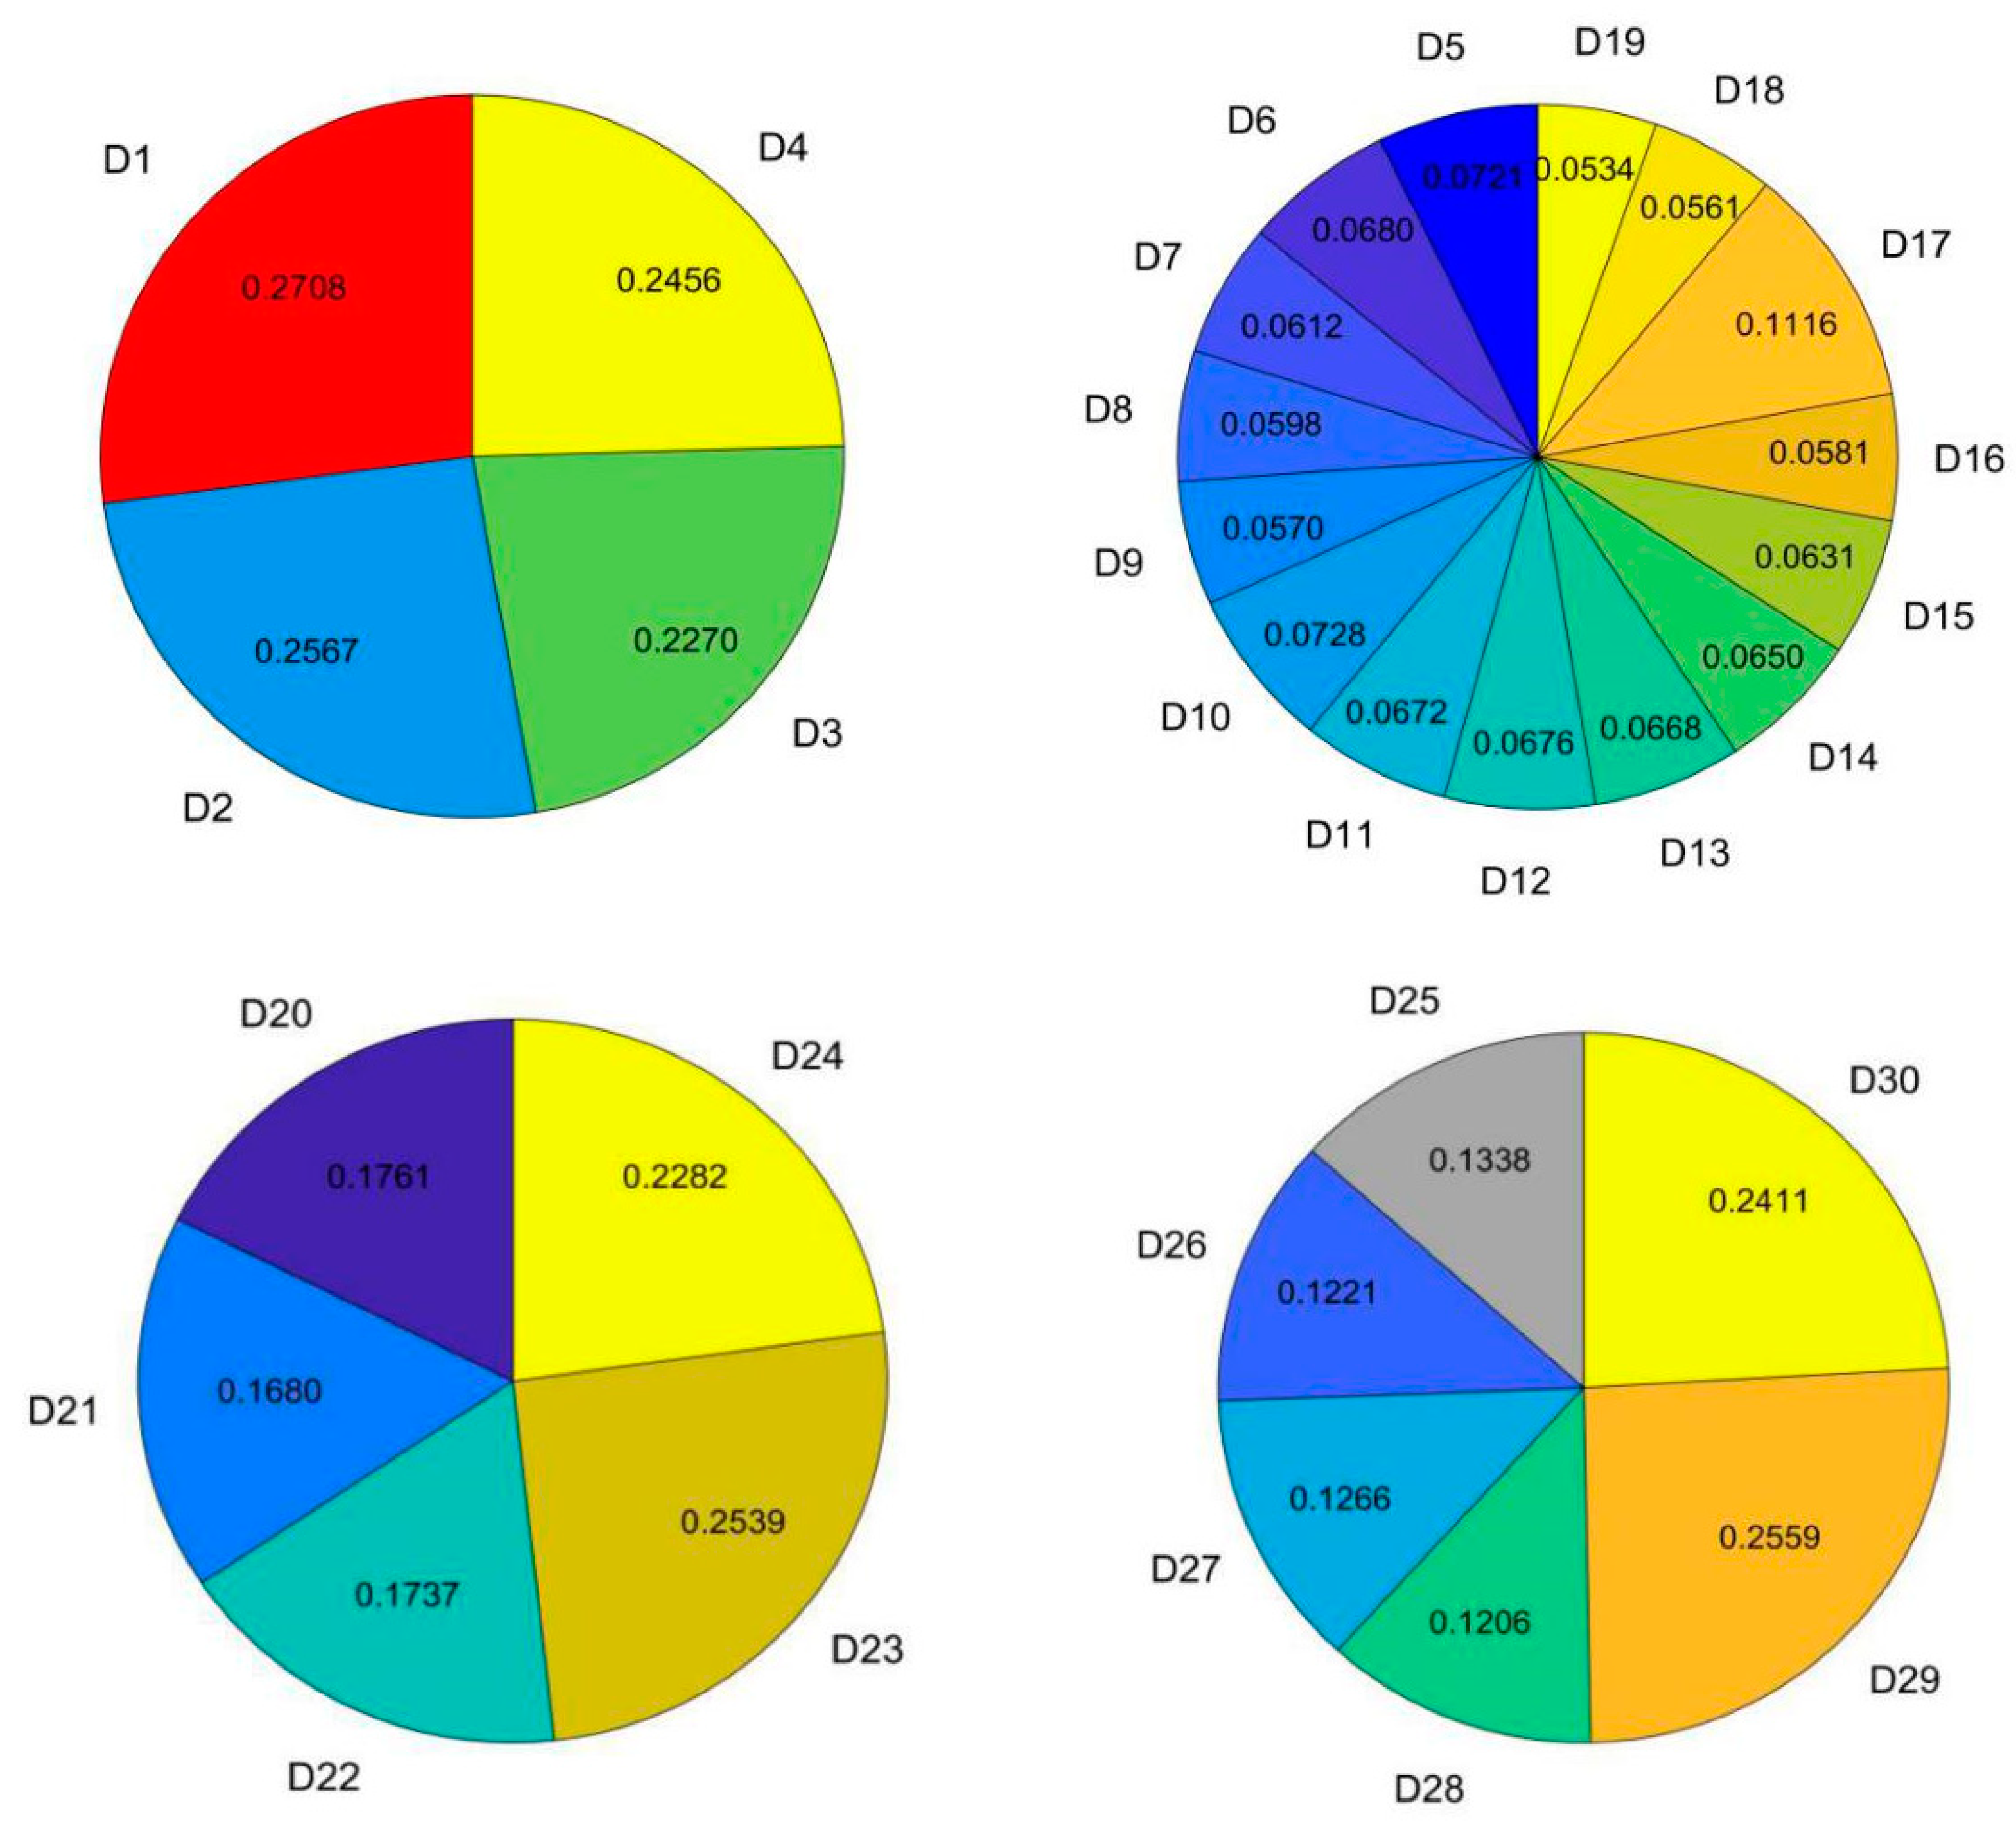
3.1.2. The Weighting of the Evaluation Indices for Allocating Water Rights to Different Industries

Appendix C Table A5 and Figure 3 shows the weights of the evaluation indices at a criterion level. At the evaluation criteria level, the results indicated that the weight of the social criterion of 0.2925 was the highest in the system of allocation of water rights to different industries. This is because social criteria were the most important criteria within the allocation of initial water rights. Thus, the continuous development of society is crucial for enhancing water use efficiency in irrigation districts. Water-saving technology within society criterion is important for water-saving efficiency and agricultural water management, contributing to the high weighting of this index. The economic criterion was assigned the second-highest weighting of 0.2650 because investment in water conservancy projects is essential for the allocation of initial water rights to different industries. The environment and physiographic indices had the lowest weightings of 0.2407 and 0.2018, respectively. However, they should nevertheless be considered within the allocation of water rights. The degradation of global water resources has received increasing attention in recent years. Therefore, the weight of the environmental index is greater than that of the physiographic index.
Appendix C Table A5 and Figure 3 shows the weights of the evaluation indices in affecting the priority level. For the physiographic criterion, the source of water had a total weight of 0.1064, which was higher than that of the regional impact of 0.0954. This is because a shortage of water resources is one of the most important challenges facing water supply. Thus, sufficient water supply should be ensured through water source protection and practical water-saving technology. There were eight evaluation indices within the social index, ranked in descending order of their total weights as: (1) the water shortage status: 0.0410; (2) adherence to the established water supply: 0.0394; (3) water conservancy projects: 0.0386; (4) average water allocation: 0.0380; (5) water security; 0.0355; (6) the population; 0.0354; (7) industrial structural change: 0.0326; (8) advanced productivity: 0.0320. This order was established because water use efficiency is one of the most important challenges facing the allocation of initial water rights, and water shortage can be reduced by various approaches including strengthening high-tech water-saving facilities, improving the construction standard of irrigation engineering and reducing water waste. Within the economic criterion, the total weight of the economic performance index was highest at 0.1372, whereas that of investment in water conservancy was lower at 0.1278. Within the environment criterion, the ecological environment index had the highest total weight of 0.1211 as there should be integrated management of different water resources to prevent the decline in the groundwater level. Compared with the ecological environment index, ecological water use had a relatively lower total weight of 0.1196.
Appendix C Table A5 and Figure 3 shows the total weights of the 30 evaluation indices used for determining the initial allocation of water rights. Within the source of water criterion, the total weight of the ratio of available water resources index was higher than the total weight of water quality index at 0.0546 and 0.0518, respectively, as the former was a significant index within the allocation of the total number of water rights. Similarly, within a water shortage status, the weighting of the water quantity shortage index was higher than that of the poor water quality index, with weights of 0.0211 and 0.0199, respectively. This is because a reduction in water quantity has a greater effect on the availability of water resources. However, under the population criterion, the population growth rate and population density had similar weights, with values of 0.0179 and 0.0175, respectively. Within the average water allocation criterion, the irrigation quota index had the highest weight of 0.0213, whereas per capita water allocation had a lower weight of 0.0167. This is because since the study area is a major agricultural production area, water demand for agricultural is much higher than residential water demand; thus, the average per unit area water use can be decreased by the application of up-to-date irrigation water-saving technology. However, within the adherence to the established water supply, the weights of the agricultural facilities and current water supply indices were similar, with values of 0.0198 and 0.0196, respectively. Within the water conservancy project criterion, the total weight of water utilization efficiency was marginally higher than that of the channel lining rate, with values of 0.0195 and 0.0190, respectively. This is because water utilization efficiency and channel lining rate are both important for improving the efficiency of water use. Within the advanced productivity criterion, the weight of the scientific and technological progress index was 0.0164, slightly higher than that of the water-saving irrigation technology index with a value of 0.0156. This is because scientific and technological progress is the primary productive force; therefore, advanced technology is needed to save water and improve water efficiency. Within the economic performance criterion, the ratio of income generated by water conservancy to total GDP index had the highest total weight of 0.0467. The indices of income of per-water production unit and the ratio of income generated by grain to total GDP had the lowest total weights of 0.0460 and 0.0445, respectively. Therefore, guaranteeing the grain yield per unit is important for increasing farmer income. Within the ecological environment criterion, the evaluation indices ranked in descending order according to their weightings were: (1) land salinization control: 0.0322; (2) artificial groundwater recharge: 0.0305; (3) river cut-off index: 0.0294; (4) influence of permafrost: 0.0290. This ranking was established because the increasing land salinization rate in the irrigation districts directly leads to a reduction in grain production and economic benefits. In the ecological water use criterion, the weighting of the ratio of ecological water use to total water use index of 0.0616 was higher than that of the guaranteed rate of ecological water use index of 0.0580.

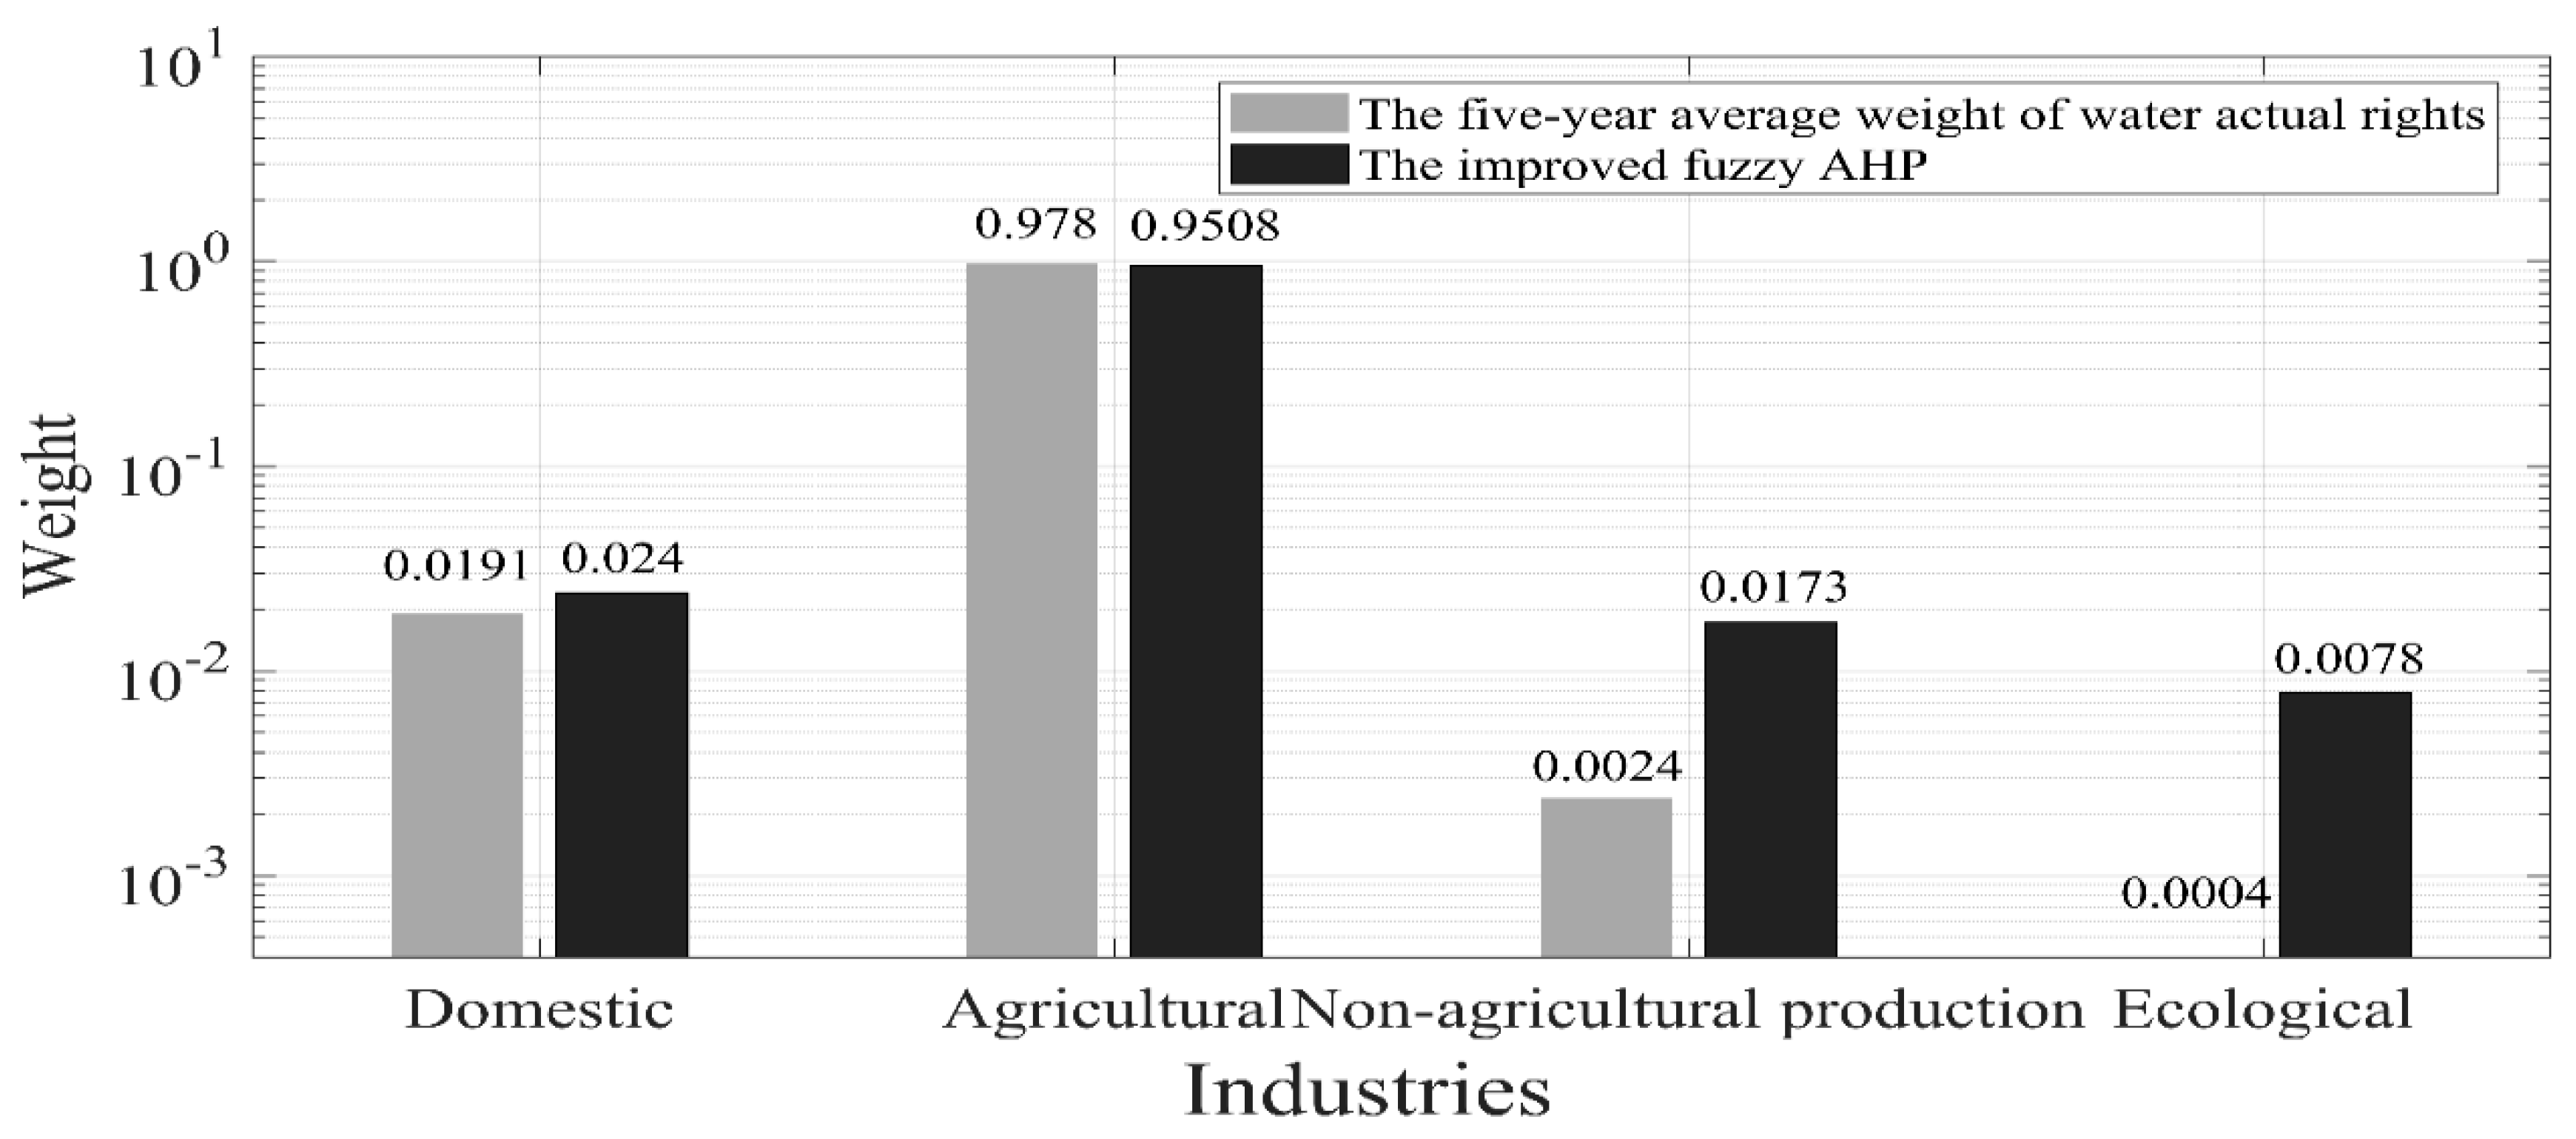
3.2. The Allocation of Initial Water Rights to Different Industries

Table 3 shows the total weights of the four major industries. The total weight of agriculture was the highest at 0.9508 since the study area is an important grain production county in Heilongjiang Province. Thus, the continuous development of water-saving techniques is crucial for enhancing water use efficiency in irrigation districts. Residential water had a higher total weight compared to non-agricultural production at 0.0240 and 0.0173, respectively, as residential water is essential for sustaining human life. The total weight of the environment of 0.0078 was lower than that of non-agricultural production.

3.3. Discussion

Within the present study, data for water consumption of various industries in the study area over the past five years were collected. This allowed the calculation of the five-year average weight of water rights for each industry. These weights were compared with the weights calculated by the model (Table 4 and Figure 4). The weight of actual agricultural use was higher than that calculated by the improved fuzzy AHP, with values of 0.9780 and 0.9508, respectively. Therefore, the actual agricultural water consumption is larger than the calculated value. This discrepancy can mainly be attributed to the low efficiency of past agricultural water use. Thus, water use efficiency of agricultural irrigation should be improved by introducing more advanced irrigation water-saving technology and improving the rate of canal lining. The total weight of the residential water right calculated by the improved fuzzy AHP was higher than that of the actual residential water right, with values of 0.0240 and 0.0191, respectively. As residential water is essential for human survival, this right should be guaranteed. The total weight of the non-agricultural production water right calculated by the improved fuzzy AHP was larger than the weight of actual residential water right, with values of 0.0173 and 0.0024, respectively. This result illustrates that more water resources should be set aside for non-agricultural production in the future to promote the development of industry and tertiary industry, which is conducive to industrial transformation. The water right for the environment is important for sustainable development, resulting in the total weight of the environment water right calculated by the improved fuzzy AHP being 0.0078. The actual weight of the environment water right was the second highest at 0.0004. Therefore, more water resources should be distributed to meet environmental water needs in the future. The allocation of initial water rights to different industries is an important component of water rights trading and sustainable water management to improve water efficiency and to achieve sustainable use of water resources through appropriate water diversion and distribution.

4. Conclusions

The current study proposed an improved fuzzy analytic hierarchy process combined with fuzzy decision theory to calculate the weights of the evaluation indices in view of the multiple level, multiple index, and multiple objective characteristics of the allocation of initial water rights to different industries in Qing’an County. At the criteria level, the evaluation indices ranked in descending order according to their weights were: (1) the social criterion: 0.2925; (2) the economic criterion: 0.2650; (3) the environment criterion: 0.2407; (4) the physiographic criterion: 0.2018. According to the weighting order of the evaluation indices, it was concluded that the order of total weights of water rights allocation for different industries in descending order is as follows: (1) agricultural water: 0.9508, which accounts for the largest percentage. Thus, the focus of future research is to improve water-use efficiency of agricultural irrigation; (2) residential water: 0.0240. Since residential water is essential for human survival, this right should be guaranteed; (3) non-agricultural production water: 0.0173, this result illustrates that more water resources should be set aside for non-agricultural production in the future to promote the development of industry and tertiary industry, which is conducive to industrial transformation; (4) environment water: 0.0078. More water resources should be distributed to meet environmental water needs in the future.
The results of the method of allocated water rights for various industries presented in the current study provide a theoretical basis for the sustainable management of water resources and water rights trading in the study area. Whereas, the study only attached importance to one area of Northeast China to the allocation of water rights to different industries, rather than researching on multiple areas of the country, which is not comprehensive enough. Therefore, the conclusions of this study are only applicable to the study area or the area with similar basic conditions of initial water rights allocation. Because of this, it needs more specific theoretical and practical demonstration when the method is used in other areas. Furthermore, although the current study presents a novel allocation of the water rights calculation method, the weight calculation method was still classic in the allocation of water rights. Future work would find a more suitable method.

Author Contributions

Data curation, J.X.; formal analysis, Q.A.; funding acquisition, H.H.; investigation, Y.C.; Methodology, J.G.; validation, X.X.; writing—original draft, J.G.; writing—review and editing, H.H. All authors have read and agreed to the published version of the manuscript.

Funding

The study was financially supported by the Youth Program of National Natural Science Foundation of China (No. 51709274), the National Keypoint Research and Invention Program of the thirteenth (No. 2017YFC0404405) as well as the Special funds for scientific research of public welfare in Ministry of water resources (No. 201501013).

Acknowledgments

We acknowledge reviewers who helped us in the review process.

Conflicts of Interest

The authors declare no conflict of interest.

Appendix A

Data representing the society, economy, water resources utilization, and water conservancy projects in the study area were listed. The classification standard of membership degree of evaluation index.
Table A1. The classification standard of membership degree of evaluation index.
Evaluation CriteriaAffecting Priority FactorsEvaluation IndicesExcellentGoodAverageFairPoorParticularly Poor
B1 Physiographic criterionSource of waterRatio of available water resources>0.90.9~0.80.8~0.70.7~0.60.6~0.5<0.5
Water quality>0.80.8~0.70.7~0.60.6~0.50.5~0.3<0.3
Regional impactDistance index<600600~10001000~15001500~20002000~2500>2500
Superiority of geographical location>0.750.75~0.60.6~0.50.5~0.350.35~0.2<0.2
B2 Social criterionWater shortage statusWater quantity shortage<0.050.05~0.10.1~0.150.15~0.20.2~0.25>0.25
Poor water quality<0.10.1~0.20.2~0.30.3~0.450.45~0.65>0.25
PopulationPopulation growth rate<0.010.01~0.080.08~0.120.12~0.160.16~0.20>0.2
Population density<1.01~1.11.1~1.31.3~1.81.8~3.0>3.0
Average water allocationPer capita water allocation>150150~120120~100100~8585~60<60
Irrigation quota>858858~725725~608608~480480~325<325
Adherence to the established water supplyCurrent water supply>0.90.9~0.720.72~0.650.65~0.520.52~0.38<0.38
Agricultural facilities>0.850.85~0.70.7~0.50.5~0.350.35~0.21<0.21
Water conservancy projectsWater utilization efficiency>0.620.62~0.580.58~0.520.52~0.450.45~0.37<0.37
Channel lining rate>0.820.82~0.70.7~0.620.62~0.550.55~0.44<0.44
Water securityAgricultural water safety>22~1.71.7~1.21.2~0.80.8~0.5<0.5
Degree of medical and health facilities>0.880.88~0.750.75~0.630.63~0.550.55~0.34<0.34
Industrial structural changeRate of industrial structure change<0.120.12~0.250.25~0.320.32~0.40.4~0.56>0.56
Advanced productivityScientific and technological progress>2515~2510~155~102~5<2
Water saving irrigation technology>0.550.55~0.420.42~0.350.35~0.20.2~0.1<0.1
B3 Economic criterionEconomic performanceRatio of income generated by water conservancy to total GDP>0.780.78~0.620.62~0.0.50.5~0.380.38~0.25<0.25
Ratio of income generated by grain to total GDP>0.420.42~0.350.35~0.280.28~0.220.22~0.16<0.16
Income of per-water production unit>2515~2510~155~102~5<2
Investment in water conservancyInvestment dynamics>0.90.8~0.90.7~0.80.6~0.70.5~0.6<0.5
Water price on cost<0.120.12~0.180.18~0.240.24~0.320.32~0.38>0.38
B4 Ecological environment criterionEcological environmentLand salinization control>0.70.6~0.70.5~0.60.4~0.50.3~0.4<0.3
River cut-off<1.01~1.21.2~1.51.5~2.02.0~3.5>3.5
Artificial groundwater recharge<0.10.1~0.20.2~0.30.3~0.40.4~0.5>0.5
Influence of permafrost<0.10.1~0.160.16~0.250.25~0.380.38~0.5>0.5
Ecological water useRatio of ecological water use to total water use>0.150.15~0.120.12~0.080.08~0.050.05~0.02<0.02
Guaranteed rate of ecological water use>0.750.75~0.630.63~0.510.51~0.420.42~0.3<0.3

Appendix B

Show the results of the evaluation of the consistency of the assessment matrix as well as the calculation results for different levels. λmax is the maximal eigenvalue of A, CI is the consistency index, CR is the consistency ratio.
Table A2. The fuzzy judgment matrix of criterion layers.
The Criterion LayersB1B2B3B4W
B11.0000.5770.7601.0040.670
B21.7321.0001.0091.1120.200
B31.3160.9911.0001.0040.080
B40.9960.8990.9961.0000.040
Consistency checkλmax = 4.022C.R. < 0.1, α < 0.2, and β < 0.1
A < 0.2, and β < 0.1
Table A3. The fuzzy judgment Matrix of factors affecting priority.
The Fuzzy Judgment Matrix of Factors C1–C2 Affecting Priority.
Priority FactorsC1C2
C111.116
C20.8961
Consistency checkλmax = 2.000C.R. < 0.1, α < 0.2, and β < 0.1
The Fuzzy Judgment Matrix of Factors C3–C10 Affecting Priority.
Priority factorsC3C4C5C6C7C8C9C10
C31.0001.0861.0950.9961.0041.2471.2721.361
C40.9211.0000.9980.7600.8980.9941.0731.185
C50.9131.0021.0000.9070.9931.1991.2181.153
C61.0041.3161.1021.0000.9981.0071.1381.131
C70.9961.1131.0071.0021.0001.1341.1201.110
C80.8021.0060.8340.9930.8821.0001.1431.193
C90.7860.9320.8210.8790.8930.8751.0001.005
C100.7350.8440.8670.8840.9010.8380.9951.000
Consistency checkλmax = 8.015C.R. < 0.1, α < 0.2, and β < 0.1
The Fuzzy Judgment Matrix of Factors C11–C12 Affecting Priority.
Priority FactorsC11C12
C1111.074
C120.9311
Consistency checkλmax = 2.000C.R. < 0.1, α < 0.2, and β < 0.1
The Fuzzy Judgment Matrix of Factors C13–C14 Affecting Priority.
Priority FactorsC13C14
C1311.012
C140.9881
Consistency checkλmax = 2.000C.R. < 0.1, α < 0.2, and β < 0.1
Table A4. The fuzzy judgment matrix of evaluation index.
The Fuzzy Judgment Matrix of Evaluation Index D1–D2.
Evaluation IndicesD1D2
D11.0001.055
D20.9481.000
Consistency checkλmax = 2.000C.R. < 0.1, α < 0.2, and β < 0.1
The Fuzzy Judgment Matrix of Evaluation Index D3–D4.
Evaluation IndicesD3D4
D31.0000.924
D41.0821.000
Consistency checkλmax = 2.000C.R. < 0.1, α < 0.2, and β < 0.1
The Fuzzy Judgment Matrix of Evaluation Index D5–D6.
Evaluation IndicesD5D6
D51.0001.060
D60.9431.000
Consistency checkλmax = 2.000C.R. < 0.1, α < 0.2, and β < 0.1
The Fuzzy Judgment Matrix of Evaluation Index D7–D8.
Evaluation IndicesD7D8
D71.0001.024
D80.9771.000
Consistency checkλmax = 2.000C.R. < 0.1, α < 0.2, and β < 0.1
The Fuzzy Judgment Matrix of Evaluation Index D9–D10.
Evaluation IndicesD9D10
D91.0000.783
D101.2771.000
Consistency checkλmax = 2.000C.R. < 0.1, α < 0.2, and β < 0.1
The Fuzzy Judgment Matrix of Evaluation Index D11–D12.
Evaluation IndicesD11D12
D111.0000.993
D121.0071.000
Consistency checkλmax = 2.000C.R. < 0.1, α < 0.2, and β < 0.1
The Fuzzy Judgment Matrix of Evaluation Index D13–D14.
Evaluation IndicesD13D14
D131.0001.028
D140.9731.000
Consistency checkλmax = 2.000C.R. < 0.1, α < 0.2, and β < 0.1
The Fuzzy Judgment Matrix of Evaluation Index D15–D16.
Evaluation IndicesD15D16
D151.0001.087
D160.9201.000
Consistency checkλmax = 2.000C.R. < 0.1, α < 0.2, and β < 0.1
The Fuzzy Judgment Matrix of Evaluation Index D18–D19.
Evaluation IndicesD18D19
D181.0001.052
D190.9511.000
Consistency checkλmax = 2.000C.R. < 0.1, α < 0.2, and β < 0.1
The Fuzzy Judgment Matrix of Evaluation Index D20–D22.
Evaluation IndicesD20D21
D201.0001.079
D210.9271.000
D221.0151.005
The Fuzzy Judgment Matrix of Evaluation Index D23–D24.
Evaluation IndicesD23D24
D231.0001.112
D240.8991.000
Consistency checkλmax = 2.000C.R. < 0.1, α < 0.2, and β < 0.1
The Fuzzy Judgment Matrix of Evaluation Index D25–D28.
Evaluation IndicesD25D26
D251.0001.119
D260.8941.000
D270.9921.017
D280.8780.987
Consistency checkλmax = 4.001C.R. < 0.1, α < 0.2, and β < 0.1
The Fuzzy Judgment Matrix of Evaluation Index D29–D30.
Evaluation IndicesD29D30
D291.0001.062
D300.9421.000
Consistency check,λmax = 2.000C.R. < 0.1, α < 0.2, and β < 0.1

Appendix C

Show the weights of all the evaluation indices.
Table A5. The total weight of evaluation indices.
Evaluation CriteriaWeightAffecting Priority FactorsLocal WeightTotal WeightEvaluation IndicesLocal WeightTotal Weight
B1 Physiographic criterion0.2018C1Source of water0.52740.1064D1Ratio of available water resources0.51330.0546
D2Water quality0.48670.0518
C2Regional impact0.47260.0954D3Distance index0.48030.0458
D4Superiority of geographical location0.51970.0496
B2 Social criterion0.2925C3Water shortage status0.14020.0410D5Water quantity shortage0.51470.0211
D6Poor water quality0.48530.0199
C4Population0.12100.0354D7Population growth rate0.50580.0179
D8Population density0.49420.0175
C5Average water allocation0.12980.0380D9Per capita water allocation0.43920.0167
D10Irrigation quota0.56080.0213
C6Adherence to the established water supply0.13480.0394D11Current water supply0.49830.0196
D12Agricultural facilities0.50170.0198
C7Water conservancyprojects0.13190.0386D13Water utilization efficiency0.50680.0195
D14Channel lining rate0.49320.0190
C8Water security0.12120.0355D15Agricultural water safety0.52080.0185
D16Degree of medical and health facilities0.47920.0170
C9Industrial structural change0.11160.0326D17Rate of industrial structure change0.03260.0326
C10Advanced productivity0.10950.0320D18Scientific and technological progress0.51260.0164
D19Water saving irrigation technology0.48740.0156
B3 Economic criterion0.2650C11Economic performance0.51790.1372D20Ratio of income generated by water conservancy to total GDP0.34010.0467
D21Ratio of income generated by grain to total GDP0.32440.0445
D22Income of per-water production unit0.33550.0460
C12Investment in waterconservancy0.48210.1278D23Investment dynamics0.52660.0673
D24Water price on cost0.47340.0605
B4 Ecological environment criterion0.2407C13Ecological environment0.50300.1211D25Land salinization control0.26590.0322
D26River cut-off0.24270.0294
D27Artificial groundwater recharge0.25170.0305
D28Influence of permafrost0.23970.0290
C14Ecological water use0.49700.1196D29Ratio of ecological water use to total water use0.51490.0616
D30Guaranteed rate of ecological water use0.48510.0580

References

  1. Chen, J.Q.; Jun, X. Facing the challenge: Barriers to sustainable water resources development in China. Hydrol. Sci. J. 1999, 44, 507–516. [Google Scholar]
  2. Liu, B.; Speed, R. Water resources management in the people’s republic of China. Int. J. Water Resour. Dev. 2009, 25, 193–208. [Google Scholar] [CrossRef]
  3. Goldberg, B.A.; Hutchins, W.A. The California Law of Water Rights. Stanf. Law Rev. 1957, 9, 420–423. [Google Scholar] [CrossRef]
  4. Hutchins, W.A.; Ellis, H.H.; DeBraal, J.P. Water Rights Laws in the Nineteen Western States; Lawbook Exchange: Washington, DC, USA, 2004. [Google Scholar]
  5. Diego, R.; Alex, G.F.; Mario, L. Legal disputes as a proxy for regional conflicts over water rights in Chile. J. Hydrol. 2016, 535, 36–45. [Google Scholar] [CrossRef]
  6. Singh, C. Water Rights and Pricinples of Water Resourses Managemengt; India Law Institute: New Delhi, India, 1991. [Google Scholar]
  7. John, F.; John, Q. Water Rights for Variable supplies: Working Paper of Murray Darling Program; The University of Queensland: Brisbane, Australia, 2005. [Google Scholar]
  8. Zhong, J.W.; Hang, Z.; Wang, X.F. A Harmonious Water Rights Allocation Model for shiyang river basin, Gansu Province, China. Water Resour. Dev. 2002, 25, 355–371. [Google Scholar] [CrossRef]
  9. Cobourn, K.M.; Ji, X.; Mooney, S.; Crescenti, N. Water right seniority, economic efficiency and land allocation decisions. In Proceedings of the Agricultural and Applied Economics Association, Chicago, IL, USA, 30 July–1 August 2017. [Google Scholar]
  10. Veldwisch, G.J.; Beekman, W.; Bolding, A. Smallholder Irrigators, Water Rights and Investments in Agriculture: Three Cases from Rural Mozambique. Water Altern. 2013, 6, 125–141. [Google Scholar]
  11. Warmsley, J.J. Market forces and the management of water for the environment. Water SA 1995, 21, 43–50. [Google Scholar]
  12. Kelman, J.; Kelman, R. Water Allocation for Economic Production in a Semi-arid Region. Int. J. Water Resour. Dev. 2002, 18, 391–407. [Google Scholar] [CrossRef]
  13. Kreutzwiser, R.D.; de Lo, R.C.; Durley, J.; Priddle, C. Water Allocation and the Permit to Take Water Program in Ontario: Challenges and Opportunities. Can. Water Resour. J. 2004, 29, 135–146. [Google Scholar] [CrossRef] [Green Version]
  14. Van Rijswick, M. Mechanisms for Water Allocation and Water Rights in Europe and The Netherlands-Lessons From a General Public Law Perspective. J. Water Law 2015, 24, 141–149. [Google Scholar]
  15. Zachary, P.S. An Equity Autopsy: Exploring the Role of Water Rights in Water Allocations and Impacts for the Central Valley Project during the 2012–2016 California Drought. Resource 2018, 7, 12. [Google Scholar] [CrossRef] [Green Version]
  16. Wesley, W. Drought Water Right Allocation Tool Applied to the San Joaquin River Basin. Master’s Thesis, University of California, CA, USA, 2011. [Google Scholar]
  17. Jefferson, L. Drought Water Rights Allocation Tool: Eel River Model Update and pyWRAT Application. Master’s Thesis, University of California Davis, Davis, CA, USA, 2018. [Google Scholar]
  18. Xiao, C.; Shao, D.; Yang, F.; Gu, W.; Wang, K. A new coupled chaos optimization-projection pursuit model for initial water rights allocation in the watershed. In Proceedings of the International Symposium on Water Resource & Environmental Protection, Xi’an, China, 20–22 May 2011; IEEE: Piscataway, NJ, USA, 2011. [Google Scholar]
  19. Ge, M.; Wu, F.P.; You, M. Initial provincial water rights dynamic projection pursuit allocation based on the most stringent water resources management: A case study of Taihu Basin, China. Water 2017, 9, 35–48. [Google Scholar] [CrossRef] [Green Version]
  20. Zhang, L.N.; Zhang, X.L.; Wu, F.P. Basin Initial Water Rights Allocation under Multiple Uncertainties: A Trade-off Analysis. Water Resour. Manag. 2020, 34, 955–988. [Google Scholar] [CrossRef]
  21. Wang, H.L.; Wen, J.H.; Wang, Y.T.; Wang, S.; Li, Q.; Zhang, Z.; Zhu, M. Analysis of trades water rights allocation at Si’an reservoir in Changxing County. Earth Environ. Sci. 2019, 227. [Google Scholar] [CrossRef]
  22. Wang, H.; Wen, J.; Wang, Y.; Wang, S.; Li, Q.; Zhang, Z.; Zhu, M. Grey Evaluation Model Based on Reformative Triangular Whitenization Weight Function and Its Application in Water Rights Allocation System. Open Cybern. Syst. J. 2013, 7, 1–10. [Google Scholar]
  23. Saaty, T.L. A scaling method for priorities in hierarchical structures. Math. Psychol. 1977, 15, 234–281. [Google Scholar] [CrossRef]
  24. Saaty, T.L. The Analytic Hierarchy Process; McGraw_Hill Company: New York, NY, USA, 1980. [Google Scholar]
  25. Saaty, T.L. Decision making-The analytic hierarchy and network processes (AHP/ANP). J. Syst. Sci. Syst. Eng. 2004, 13, 1–35. [Google Scholar] [CrossRef]
  26. Wu, D.T.; Li, D.F. Shortcomings of analytical hierarchy process and the path to improve the method. J. Beijing Norm. Univ. 2004, 40, 264–268. [Google Scholar]
  27. Cai, Y.H.; Lin, C.D. The status of and reflection on performance appraisal research. J. Beijing Norm. Univ. 2001, 4, 119–126. [Google Scholar]
  28. Alphonce, C.B. Application of the analytic hierarchy process in agriculture in developing countries. Agric. Syst. 1997, 53, 97–112. [Google Scholar] [CrossRef]
  29. Chowdary, V.M.; Chakraborthy, D.; Jeyaram, A.; Murthy, Y.K.; Sharma, J.R.; Dadhwal, V.K. Multi-Criteria Decision Making Approach for Watershed Prioritization Using Analytic Hierarchy Process Technique and GIS. Water Resour. Manag. 2013, 27, 3555–3571. [Google Scholar] [CrossRef]
  30. Chaudhary, P.; Chhetri, S.K.; Joshi, K.M.; Shrestha, B.M.; Kayastha, P. Application of an Analytic Hierarchy Process (AHP) in the GIS interface for suitable fire site selection: A case study from Kathmandu Metropolitan City, Nepal. Socio-Econ. Plan. Sci. 2016, 53, 60–71. [Google Scholar] [CrossRef]
  31. Erhan, Ş.; Şehnaz, Ş.; Ayşen, D. Groundwater potential mapping by combining fuzzy-analytic hierarchy process and GIS in Beyşehir Lake Basin, Turkey. Arab. J. Geosci. 2018, 11, 187–208. [Google Scholar]
  32. Wu, C.; Liu, G.; Huang, C.; Liu, Q.; Guan, X. Ecological vulnerability assessment based on Fuzzy Analytical Method and Analytic Hierarchy Process in Yellow river delta. Int. J. Environ. Res. Public Health 2018, 15, 855. [Google Scholar] [CrossRef] [PubMed] [Green Version]
  33. Murat, K.; Can, B.K. Evaluation of irrigation water quality by data envelopment analysis and Analytic Hierarchy Process-Based water quality indices: The case of aksaray city, Turkey. Water Air Soil Pollut. 2020, 231, 55. [Google Scholar]
  34. Sun, H.; Wang, S.; Hao, X. An Improved Analytic Hierarchy Process Method for the evaluation of agricultural water management in irrigation districts of north China. Agric. Water Manag. 2017, 179, 324–337. [Google Scholar] [CrossRef]
  35. Karamouz, M.; Kerachian, R.; Zahraie, B.; Araghi-Nejhad, S. Monitoring and evaluation scheme using the multiple-criteria decision-making technique:application to irrigation projects. Irrig. Drain. Eng. ASCE 2002, 128, 341–350. [Google Scholar] [CrossRef]
  36. Okada, H.; Styles, S.W.; Grismer, M.E. Application of the Analytic HierarchyProcess to irrigation project improvement. Agric. Water Manag. 2008, 95, 199–204. [Google Scholar] [CrossRef]
  37. William, H.; Ma, X. The state-of-the-art integrations and applications of the analytic hierarchy process. Eur. J. Oper. Res. 2017, 267, 399–414. [Google Scholar]
  38. Adams, A.; Pelletier, D.; Duffield, C.; Nagy, S.; Crisp, J.; Mitten-Lewis, S.; Murphy, J. The Delphi method. Nurs. Res. 1997, 46, 116–118. [Google Scholar]
  39. Wang, J.; Zhang, J.S. Comparing several methods of assuring weight vector in synthetical evaluation. Hebei Univ. Technol. 2001, 30, 52–57. (In Chinese) [Google Scholar]
  40. Lu, Y.J.; Zhang, W. Kernel function of index scale in AHP scale system. J. Syst. Eng. 2003, 18, 452–456. (In Chinese) [Google Scholar]
Figure 1. Study area.
Water 12 01719 g001
Figure 2. The hierarchy of initial water rights for different industries.
Water 12 01719 g002
Figure 3. The total weight of evaluation indices.
Water 12 01719 g003
Figure 4. The weight of initial water rights of improved fuzzy AHP in comparison with that of the actual five-year average.
Water 12 01719 g004
Table 1. The scale and definition of the assessment matrix.
Distinguish Scale135792, 4, 6, 8
DefinitionEqual importanceWeak importanceObvious importanceIntensely importanceExtreme importanceIntermediate value
Table 2. Evaluation index scale conversion.
PriorityPriority Level (Membership Degree)
Absolute PriorityModerate PriorityAppropriate PriorityProperly Set BackSet BackAlmost No Rights
1~9 scale975421
exponential scaleq9q7q5q3q1q0
0.1~1.0 scale1.00.8280.7410.50.2590.1
Note: q is 1.316 [40].
Table 3. The total priority coefficient of water use in different industries.
Evaluation IndicesTotal WeightRelative Membership DegreeTotal Priority Coefficient
ResidentialAgriculturalNon-Agricultural ProductionEcologicalResidentialAgriculturalNon-Agricultural ProductionEcological
Ratio of available water resources0.05460.000.990.000.000.00000.05410.00000.0000
Water quality0.05180.240.650.000.000.01250.03370.00000.0000
Distance index0.04580.001.000.000.000.00000.04570.00000.0000
Superiority of geographical location0.04960.001.000.000.000.00000.04960.00000.0000
Water quantity shortage0.02110.001.000.000.000.00000.02110.00000.0000
Poor water quality0.01990.020.880.000.000.00050.01760.00000.0000
Population growth rate0.01790.110.790.000.000.00200.01410.00000.0000
Population density0.01750.090.880.000.000.00160.01530.00000.0000
Per capita water allocation0.01670.100.670.000.000.00170.01120.00000.0000
Irrigation quota0.02130.001.000.000.000.00000.02120.00000.0000
Current water supply0.01960.000.980.030.020.00000.01930.00060.0004
Agricultural facilities0.01980.001.000.000.000.00000.01980.00000.0000
Water utilization efficiency0.01950.000.990.000.000.00000.01940.00000.0000
Channel lining rate0.01900.001.000.000.000.00000.01900.00000.0000
Agricultural water safety0.01850.001.000.000.000.00000.01850.00000.0000
Degree of medical and health facilities0.01700.000.980.000.000.00000.01660.00000.0000
Rate of industrial structure change0.03260.010.950.030.000.00030.03090.00100.0000
Scientific and technological progress0.01640.000.890.020.000.00000.01460.00030.0000
Water saving irrigation technology0.01560.001.000.000.000.00000.01560.00000.0000
Ratio of income generated by water conservancy to total GDP0.04670.000.920.040.000.00000.04290.00190.0000
Ratio of income generated by grain to total GDP0.04450.001.000.000.000.00000.04450.00000.0000
Income of per-water production unit0.04600.000.900.070.000.00000.04140.00320.0000
Investment dynamics0.06730.001.000.000.000.00000.06730.00000.0000
Water price on cost0.06050.040.980.130.000.00230.05930.00800.0000
Land salinization control0.03220.001.000.000.020.00000.03220.00000.0006
River cut-off0.02940.000.840.000.000.00000.02470.00000.0000
Artificial groundwater recharge0.03050.000.780.000.000.00000.02380.00000.0000
Influence of permafrost0.02900.000.960.000.030.00000.02790.00000.0009
Ratio of ecological water use to total water use0.06160.000.000.000.050.00000.00000.00000.0031
Guaranteed rate of ecological water use0.05800.000.000.000.030.00000.00000.00000.0017
Industry comprehensive weight 0.02400.95080.01730.0078
Table 4. The weight of initial water rights in different industries.
Computing MethodResidentialAgriculturalNon-Agricultural ProductionEcological Environment
The five-year average weight of water actual rights0.01910.97800.00240.0004
The improved fuzzy AHP0.02400.95080.01730.0078

