Spatial and Temporal Variations of Drought in Inner Mongolia, China

 , , ,
, , ,
Abstract
1. Introduction
2. Study Area
3. Materials and Methods
3.1. Data Source
3.2. SPEI and Its Calculating Methods
3.3. ADI and Its Calculating Methods
3.4. Mann-Kendall Test
4. Results and Discussion
4.1. The Changes in SPEI Characteristics over the Years
4.2. The Spatial Distribution Characteristics of ADI
4.3. The Variation Characteristics of Drought Area over the Years
4.4. Intra-Annual Variation Characteristics of Drought
4.5. M-K Test
4.6. Effects of Climate Warming on Drought Frequency, Duration, and Spatial Distribution
4.7. The Spatial Variation Characteristics of Drought Intensity and Frequency
5. Conclusions
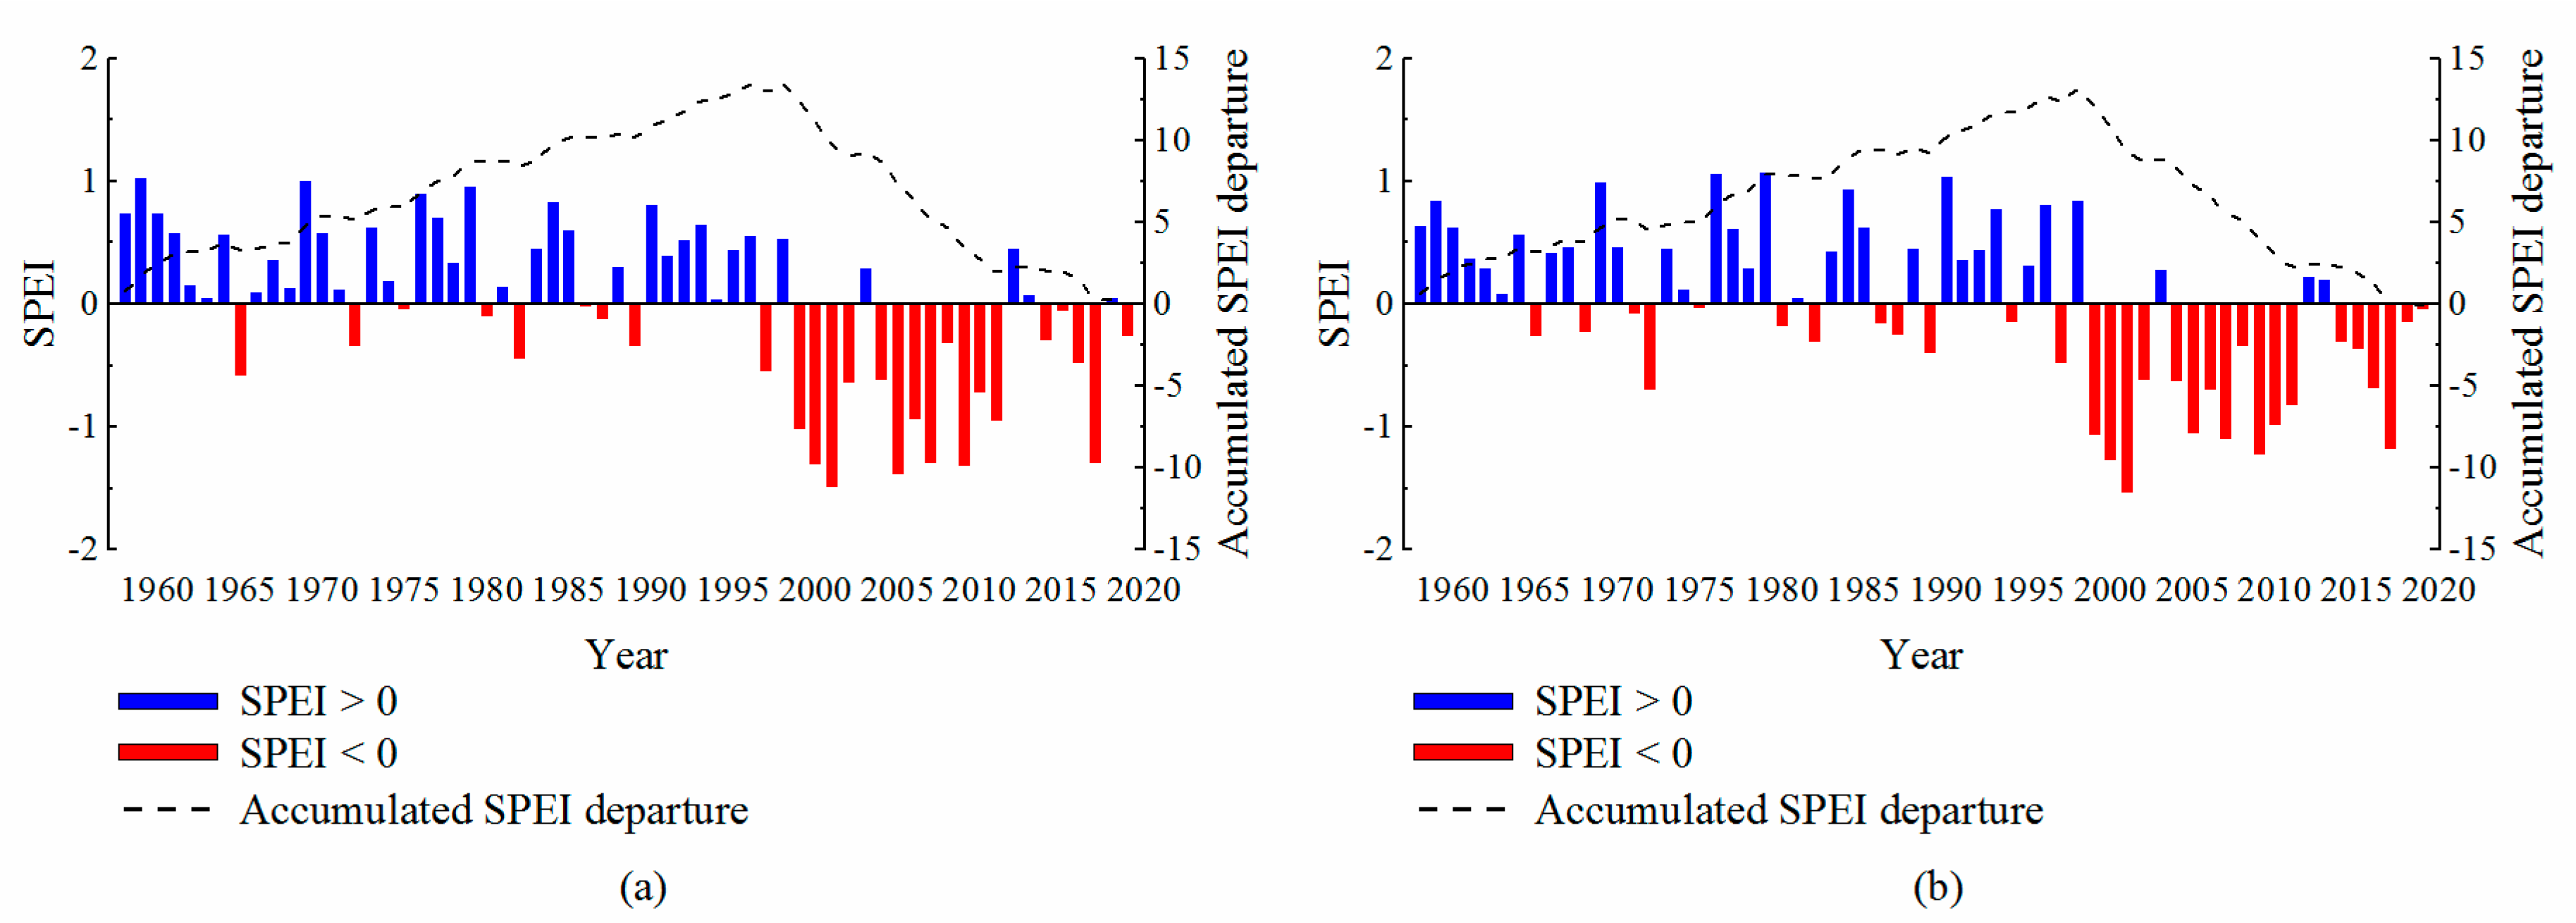
- (a)
- The drought in 1958–2019 shows an overall intensifying trend, with occurrence of a mutation around 1993. Since 1993, the drought situation has rapidly become severe. The changes of droughts in annual, plant growth period, spring, summer, and autumn are all humid at first, followed by a dry situation. However, the trend of drought in winter is opposite to that in other seasons, which is first dry and then humid.
- (b)
- In general, the drought intensity in the west, north central, and western part of the east regions is relatively strong, while, mostly weak in other regions. The strong drought intensity is located in the western region during spring, in the western and the west-central region in summer, at the eastern border and the small area in the south of the central region during autumn, and in the north-east corner in winter.
- (c)
- The drought coverage area has increased from 1958 to 2019, showing also an increased degree of drought. From 1958 to 1996, the drought is mainly composed of the mild drought, while, from 1997 to 2019, the drought type is no longer dominated by the mild drought, as the frequency of other types of drought has increased. The changes in the drought area in spring, summer, autumn, and plant growth period are consistent with that of the annual drought, showing an increasing trend, while a slight decreasing trend is observed in winter.
- (d)
- The intra-annual distribution of droughts in Inner Mongolia has significantly changed since 2000. Before that, the frequency of droughts was low, mostly dominated by the mild drought. After 2000, drought has begun to occur more frequently, with more concentration in March–October. Moreover, the drought type is dominated by the mild and moderate droughts. April is the month with the highest drought frequency of 27.4%, while, January is the month with the lowest drought frequency of 9.7%.
- (e)
- The climate conditions of Inner Mongolia show an abrupt change in the 1990s, with a clear upward trend of temperature, which can be considered as the reason for the increase of drought in the study area. After the abrupt change of the climate conditions, the frequency and the coverage area of drought, and the duration of continuous drought have significantly increased.
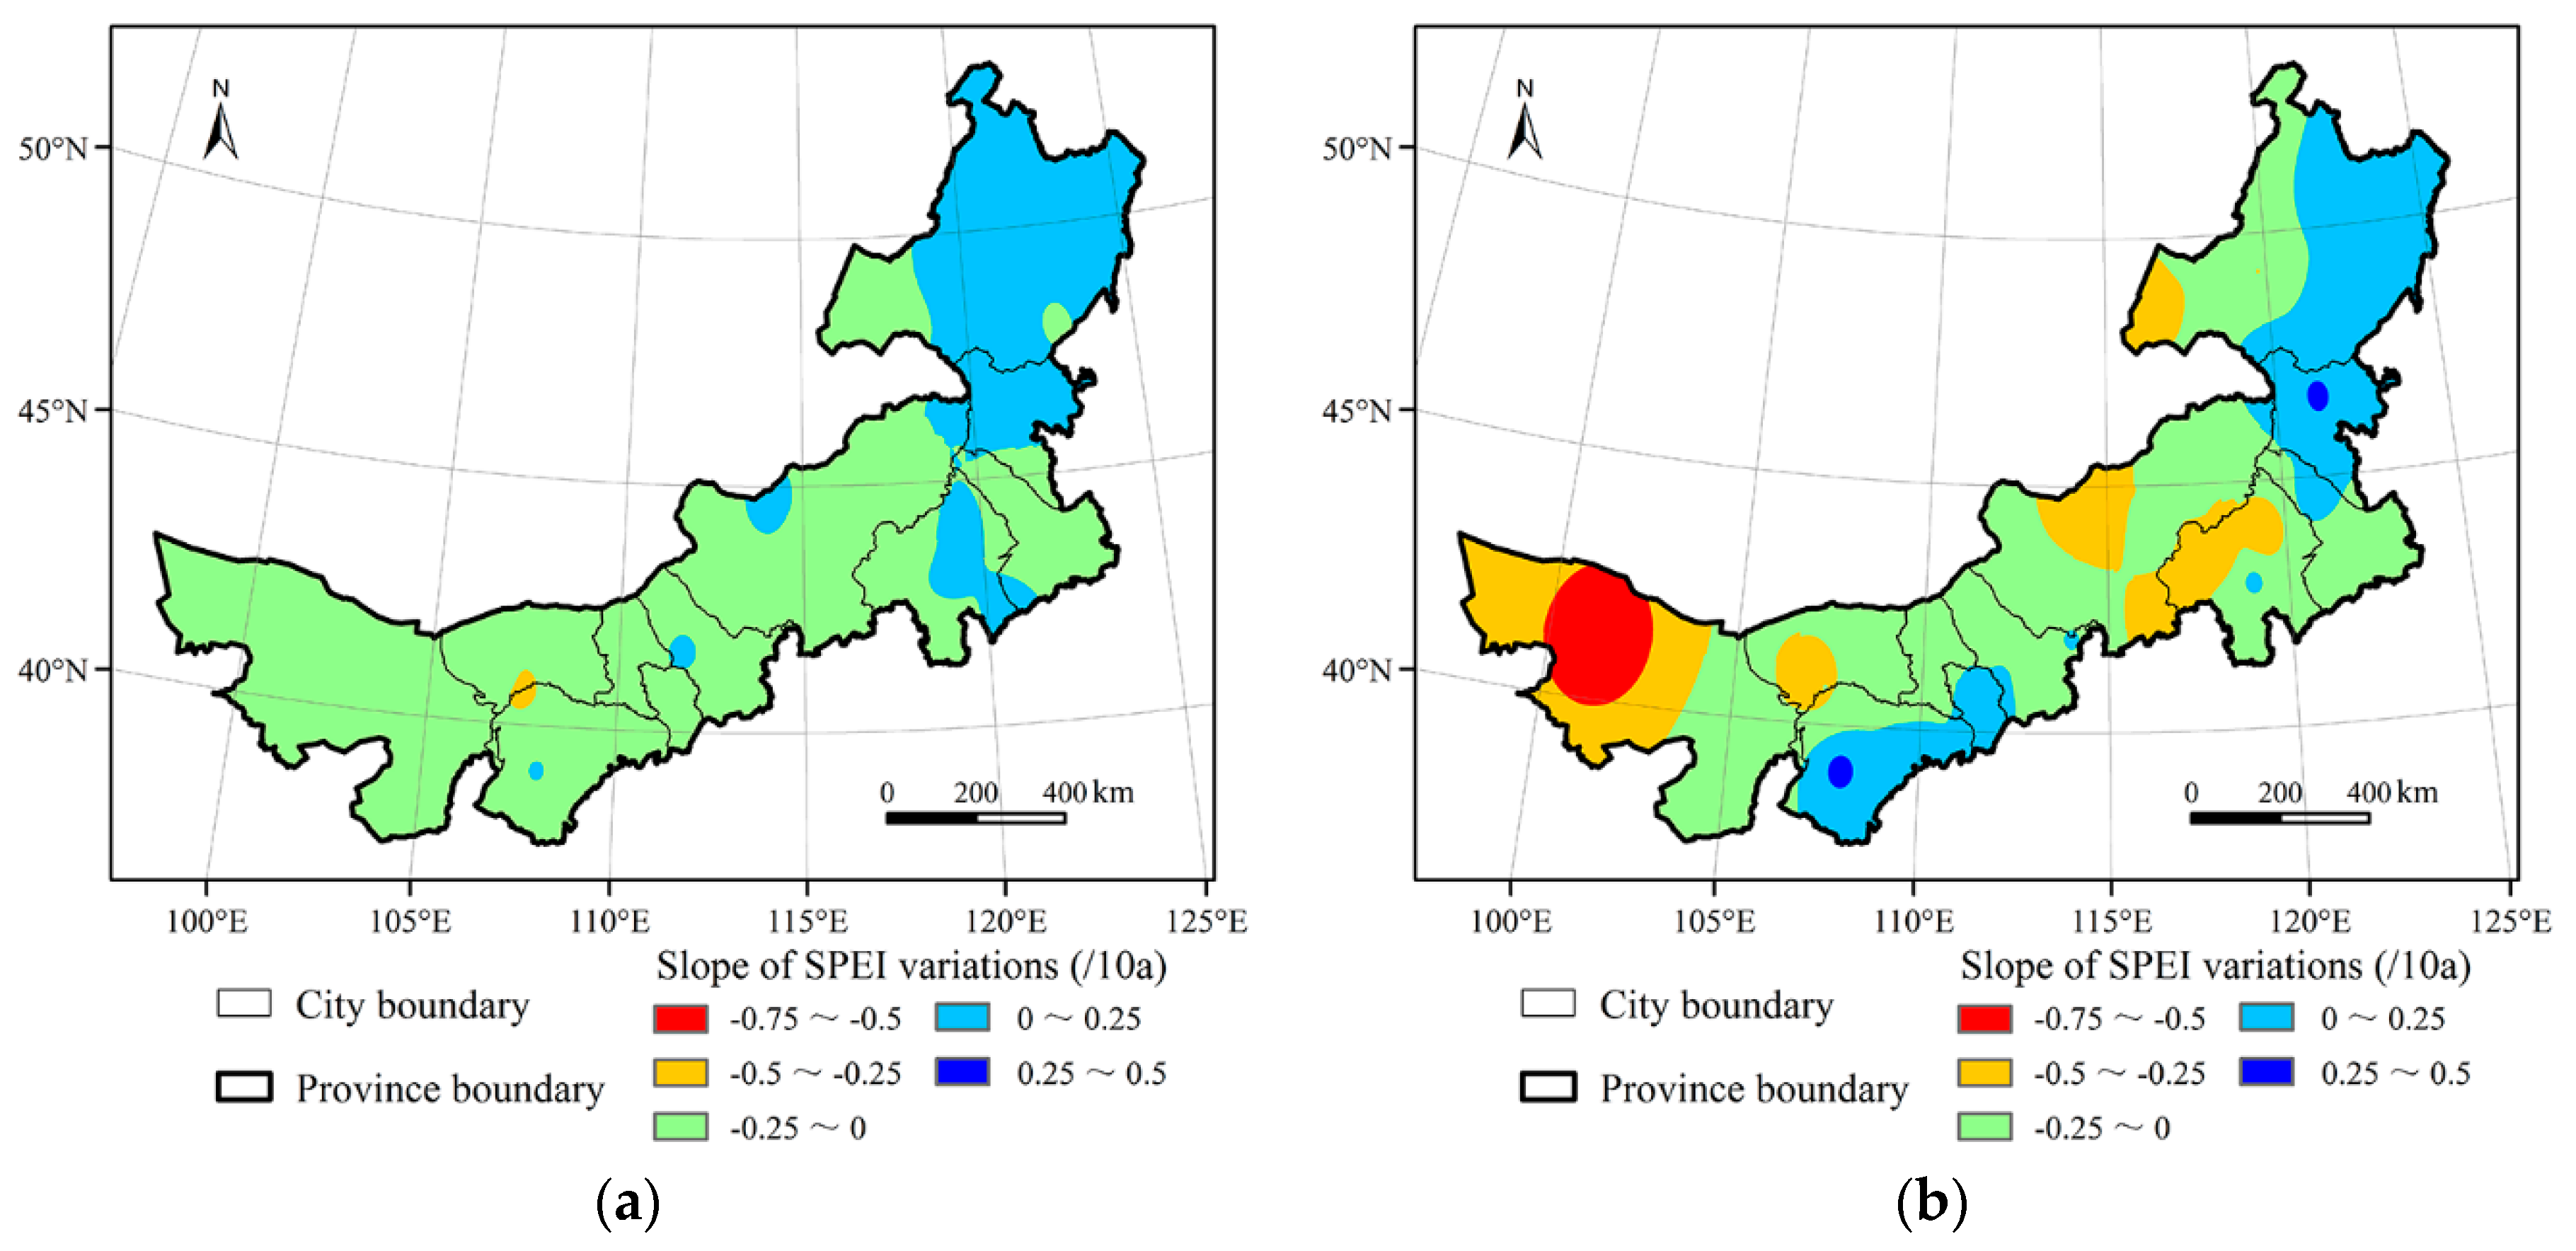
- (f)
- According to the spatial distribution of drought intensity and drought frequency before and after the abrupt climate change, the drought key areas have shifted from the south-east to the north-west, after the abrupt climate change. Among them, this change trend is more obvious in areas with the moderate and severe droughts. Considering the changing trend of the spatial distribution of drought, relevant departments should formulate appropriate response policies, such as developing water-saving agriculture and allocating water resources scientifically, to ensure the normal progress of social and economic development, especially the agricultural and animal husbandry production.
Author Contributions
Funding
Acknowledgments
Conflicts of Interest
References
- Cook, B.I.; Mankin, J.S.; Anchukaitis, K.J. Climate Change and Drought: From Past to Future. Curr. Clim. Chang. Rep. 2018, 4, 164–179. [Google Scholar] [CrossRef]
- Alamgir, M.; Khan, N.; Shahid, S.; Yaseen, Z.M.; Dewan, A.; Hassan, Q.; Rasheed, B. Evaluating severity–area–frequency (SAF) of seasonal droughts in Bangladesh under climate change scenarios. Stoch. Environ. Res. Risk Assess. 2020, 34, 447–464. [Google Scholar] [CrossRef]
- Aadhar, S.; Mishra, V. High-resolution near real-time drought monitoring in South Asia. Sci. Data 2017, 4, 170145. [Google Scholar] [CrossRef] [PubMed]
- Beguería, S.; Vicente-Serrano, S.M.; Angulo-Martínez, M. A Multiscalar Global Drought Dataset: The SPEIbase: A New Gridded Product for the Analysis of Drought Variability and Impacts. Bull. Am. Meteorol. Soc. 2010, 91, 1351–1356. [Google Scholar] [CrossRef]
- Dai, A. Drought under global warming: A review. WIREs Clim. Chang. 2011, 2, 45–65. [Google Scholar] [CrossRef]
- Ummenhofer, C.C.; D’Arrigo, R.D.; Anchukaitis, K.J.; Buckley, B.M.; Cook, E.R. Links between Indo-Pacific climate variability and drought in the Monsoon Asia Drought Atlas. Clim. Dyn. 2013, 40, 1319–1334. [Google Scholar] [CrossRef]
- Fu, C.; Ma, Z. Global change and regional aridification. Chin. J. Atmos. Sci. 2008, 32, 752–760. [Google Scholar]
- Cook, B.I.; Smerdon, J.E.; Seager, R.; Coats, S. Global warming and 21st century drying. Clim. Dyn. 2014, 43, 2607–2627. [Google Scholar] [CrossRef]
- Seager, R.; Ting, M.; Li, C.; Naik, N.; Cook, B.; Nakamura, J.; Liu, H. Projections of declining surface-water availability for the southwestern United States. Nat. Clim. Chang. 2013, 3, 482–486. [Google Scholar] [CrossRef]
- Li, Z.; Chen, Y.; Fang, G.; Li, Y. Multivariate assessment and attribution of droughts in Central Asia. Sci. Rep. 2017, 7, 1–12. [Google Scholar] [CrossRef]
- Zhang, L.; Zhou, T. Drought over East Asia: A Review. J. Clim. 2015, 28, 3375–3399. [Google Scholar] [CrossRef]
- Ma, Z.; Fu, C. Some evidence of drying trend over northern China from 1951 to 2004. Chin. Sci. Bull. 2006, 51, 2913–2925. [Google Scholar] [CrossRef]
- Wang, L.; Chen, W.; Zhou, W. Assessment of Future Drought in Southwest China Based on CMIP5 Multimodel Projections. Adv. Atmos. Sci. 2014, 31, 1035–1050. [Google Scholar] [CrossRef]
- Hu, S.; Mo, X.; Lin, Z. Projections of spatial-temporal variation of drought in north China. Arid Land Geogr. 2015, 38, 239–248. [Google Scholar]
- Zargar, A.; Sadiq, R.; Naser, B.; Khan, F.I. A review of drought indices. Environ. Rev. 2011, 19, 333–349. [Google Scholar] [CrossRef]
- Palmer, W.C. Meteorological Drought; US Department of Commerce, Weather Bureau: Washington, DC, USA, 1965; Volume 30.
- Guttman, N.B. Comparing the Palmer drought index and the standardized precipitation index. J. Am. Water Resour. Assoc. 1998, 34, 113–121. [Google Scholar] [CrossRef]
- McKee, T.B.; Doesken, N.J.; Kleist, J. The relationship of drought frequency and duration to time scales. In Proceedings of the 8th Conference on Applied Climatology, Boston, MA, USA, 1 January 1993; pp. 179–183. [Google Scholar]
- Moreira, E.E.; Paulo, A.A.; Pereira, L.S.; Mexia, J.T. Analysis of SPI drought class transitions using loglinear models. J. Hydrol. 2006, 331, 359. [Google Scholar] [CrossRef]
- Vicente-Serrano, S.; Beguería, S.; López-Moreno, J.I. A Multiscalar Drought Index Sensitive to Global Warming: The Standardized Precipitation Evapotranspiration Index. J. Clim. 2010, 23, 1696–1718. [Google Scholar] [CrossRef]
- Vicente-Serrano, S.M.; Beguería, S.; López-Moreno, J.I.; Angulo, M.; El Kenawy, A. A New Global 0.5° Gridded Dataset (1901–2006) of a Multiscalar Drought Index: Comparison with Current Drought Index Datasets Based on the Palmer Drought Severity Index. J. Hydrometeorol. 2010, 11, 1033–1043. [Google Scholar] [CrossRef]
- Beguería, S.; Vicente-Serrano, S.M.; Reig, F.; Latorre, B. Standardized precipitation evapotranspiration index (SPEI) revisited: Parameter fitting, evapotranspiration models, tools, datasets and drought monitoring. Int. J. Climatol. 2013, 34, 3001–3023. [Google Scholar] [CrossRef]
- Hayes, M.; Svoboda, M.; Wilhite, D.; Vanyarkho, O. Monitoring the 1996 Drought Using the Standardized Precipitation Index. Bull. Am. Meteorol. Soc. 1999, 80, 429–438. [Google Scholar] [CrossRef]
- Yu, M.; Li, Q.; Hayes, M.J.; Svoboda, M.D.; Heim, R.R. Are droughts becoming more frequent or severe in China based on the Standardized Precipitation Evapotranspiration Index: 1951–2010? Int. J. Climatol. 2014, 34, 545–558. [Google Scholar] [CrossRef]
- Hernandez, E.A.; Uddameri, V. Standardized precipitation evaporation index (SPEI)-based drought assessment in semi-arid south Texas. Environ. Earth Sci. 2014, 71, 2491–2501. [Google Scholar] [CrossRef]
- Allen, K.J.; Ogden, J.; Buckley, B.M.; Cook, E.R.; Baker, P.J. The potential to reconstruct broadscale climate indices associated with southeast Australian droughts from Athrotaxis species, Tasmania. Clim. Dyn. 2011, 37, 1799–1821. [Google Scholar] [CrossRef]
- Potop, V. Evolution of drought severity and its impact on corn in the Republic of Moldova. Theor. Appl. Climatol. 2011, 105, 469–483. [Google Scholar] [CrossRef]
- Fuchs, B.; Svoboda, M.; Nothwehr, J.; Poulsen, C.; Sorensen, W.; Guttman, N. A New National Drought Risk Atlas for the US from the National Drought Mitigation Center; National Drought Mitigation Center, University of Nebraska: Lincoln, NE, USA, 2012. [Google Scholar]
- Paulo, A.; Rosa, R.; Pereira, L. Climate trends and behaviour of drought indices based on precipitation and evapotranspiration in Portugal. Nat. Hazards Earth Syst. Sci. 2012, 12, 1481–1491. [Google Scholar] [CrossRef]
- Abiodun, B.J.; Salami, A.T.; Matthew, O.J.; Odedokun, S. Potential impacts of afforestation on climate change and extreme events in Nigeria. Clim. Dyn. 2013, 41, 277–293. [Google Scholar] [CrossRef]
- Sohn, S.; Ahn, J.; Tam, C. Six month–lead downscaling prediction of winter to spring drought in South Korea based on a multimodel ensemble. Geophys. Res. Lett. 2013, 40, 579–583. [Google Scholar] [CrossRef]
- Zhang, R.; Shang, H.; Yu, S.; He, Q.; Yuan, Y.; Bolatov, K.; Mambetov, B.T. Tree-ring-based precipitation reconstruction in southern Kazakhstan, reveals drought variability since A.D. 1770. Int. J. Climatol. 2017, 37, 741–750. [Google Scholar] [CrossRef]
- Liang, C.; Shi, T.; Wei, X.; Xu, J.; Hagan, D.; Chen, T.; Dolman, H. Drying and Wetting Trends and Vegetation Covariations in the Drylands of China. Water 2020, 12, 933. [Google Scholar] [CrossRef]
- Hu, Q.; Pan, F.; Pan, X.; Zhang, D.; Li, Q.; Pan, Z.; Wei, Y. Spatial analysis of climate change in Inner Mongolia during 1961–2012, China. Appl. Geogr. 2015, 60, 254–260. [Google Scholar] [CrossRef]
- Li, Y. The Palmer drought severity index applicability analysis in typical grassland underlying surface area of Inner Mongolia. J. Meteorol. Sci. 2019, 39, 626–634. [Google Scholar]
- Qu, X.; Yang, Q.; Wang, H.; Cao, Q.; Lin, C. Characteristics of Meteorological Drought Intensity in Inner Mongolia Based on MCI. Meteorol. Environ. Sci. 2019, 42, 47–54. [Google Scholar]
- Wu, Y.; Li, W.; Wang, W.; Quan, Q.; Chen, X.; Yi, H.; Zhou, Q.; Xu, K. Drought Characteristics in Inner Mongolia Based on Precipitation Anomaly Percentage. Arid Zone Res. 2019, 36, 943–952. [Google Scholar]
- Zhou, Y.; Li, N.; Ji, Z.; Gu, X.; Fan, B. Temporal and Spatial Patterns of Droughts Based on Standard Precipitation Index (SPI) in Inner Mongolia during 1981–2010. J. Nat. Resour. 2013, 028, 1694–1706. [Google Scholar]
- Zhang, X.; Pan, X.; Xu, L.; Wei, P.; Yin, Z.; Shao, C. Analysis of spatio-temporal distribution of drought characteristics based on SPEI in Inner Mongolia during 1960-2015. Trans. Chin. Soc. Agric. Eng. 2017, 33, 190–199. [Google Scholar]
- Yao, J.; Zhao, Y.; Chen, Y.; Yu, X.; Zhang, R. Multi-scale assessments of droughts: A case study in Xinjiang, China. Sci. Total Environ. 2018, 630, 444–452. [Google Scholar] [CrossRef] [PubMed]
- Wang, X.; Pan, X.; Gu, S.; Hu, Q.; Wei, P.; Pan, Y. Trend in reference crop evapotranspiration and meteorological factors affecting trends in Inner Mongolia. Trans. Chin. Soc. Agric. Eng. 2015, 31, 142–152. [Google Scholar] [CrossRef]
- Ya, R.; Li, N.; Yin, S.; Bao, Y. Characteristics of Temporal and Spatial Variation of Extreme Climate Events in Inner Mongolia During the Period 1960–2015. Res. Soil Water Conserv. 2020, 27, 106–112. [Google Scholar]
- Wang, J.; Li, Y.; Yang, G.; Zhang, N.; Cao, Y. Cubic Spline Interpolation-Based Method for Line-Like Phase Errors of Phase Unwrapping. Opt. Optoelectron. Technol. 2019, 17, 23–29. [Google Scholar]
- Li, J.; Yue, Y.; Pan, H.; Ye, X. Variation rules of meteorological drought in China during 1961–2010 based on SPEI and intensity analysis. J. Catastrophol. 2014, 29, 176–182. [Google Scholar] [CrossRef]
- Ming, B.; Guo, Y.-q.; Tao, H.-b.; Liu, G.-z.; Li, S.-k.; Wang, P. SPEIPM-based research on drought impact on maize yield in North China Plain. J. Integr. Agric. 2015, 14, 660–669. [Google Scholar] [CrossRef]
- Yan, Z.; Mu, G. Surface Precipitation Calculation of River Basin Based on Thiessen Polygons Method. Water Conserv. Sci. Technol. Econ. 2017, 23, 19–22. [Google Scholar]
- An, Q.; He, H.; Gao, J.; Nie, Q.; Cui, Y.; Wei, C.; Xie, X. Analysis of Temporal-Spatial Variation Characteristics of Drought: A Case Study from Xinjiang, China. Water 2020, 12, 741. [Google Scholar] [CrossRef]
- Gocic, M.; Trajkovic, S. Analysis of changes in meteorological variables using Mann-Kendall and Sen’s slope estimator statistical tests in Serbia. Glob. Planet. Chang. 2013, 100, 172–182. [Google Scholar] [CrossRef]


| No Drought | Mild Drought | Moderate Drought | Severe Drought | Extreme Drought |
|---|---|---|---|---|
| −0.5 < SPEI | −1 < SPEI ≤ −0.5 | −1.5 < SPEI ≤ −1 | −2 < SPEI ≤ −1.5 | SPEI ≤ −2 |
| Item | Degrees | 1958–1992 | 1993–2019 |
|---|---|---|---|
| Probability (%) | Drought | 2.86 | 48.15 |
| Mild | 2.86 | 22.22 | |
| Moderate | 0 | 25.93 | |
| Severe | 0 | 0 | |
| Extreme | 0 | 0 | |
| Longest duration (number of months) | Drought | 7 | 48 |
| Mild | 7 | 13 | |
| Moderate | 0 | 13 | |
| Severe | 0 | 1 | |
| Extreme | 0 | 0 |
© 2020 by the authors. Licensee MDPI, Basel, Switzerland. This article is an open access article distributed under the terms and conditions of the Creative Commons Attribution (CC BY) license (http://creativecommons.org/licenses/by/4.0/).
Share and Cite
An, Q.; He, H.; Nie, Q.; Cui, Y.; Gao, J.; Wei, C.; Xie, X.; You, J. Spatial and Temporal Variations of Drought in Inner Mongolia, China. Water 2020, 12, 1715. https://doi.org/10.3390/w12061715
An Q, He H, Nie Q, Cui Y, Gao J, Wei C, Xie X, You J. Spatial and Temporal Variations of Drought in Inner Mongolia, China. Water. 2020; 12(6):1715. https://doi.org/10.3390/w12061715
Chicago/Turabian StyleAn, Qiang, Huaxiang He, Qianwen Nie, Yingjie Cui, Juanjuan Gao, Chuanjiang Wei, Xinmin Xie, and Jinjun You. 2020. "Spatial and Temporal Variations of Drought in Inner Mongolia, China" Water 12, no. 6: 1715. https://doi.org/10.3390/w12061715
APA StyleAn, Q., He, H., Nie, Q., Cui, Y., Gao, J., Wei, C., Xie, X., & You, J. (2020). Spatial and Temporal Variations of Drought in Inner Mongolia, China. Water, 12(6), 1715. https://doi.org/10.3390/w12061715