Article

Distinguishing Capillary Fringe Reflection in a GPR Profile for Precise Water Table Depth Estimation in a Boreal Podzolic Soil Field

by
Chameera Illawathure
1,
Mumtaz Cheema
1,
Vanessa Kavanagh
2 and
Lakshman Galagedara
1,*
1
School of Science and the Environment, Memorial University of Newfoundland, Corner Brook, NL A2H 5G4, Canada
2
Department of Fisheries and Land Resources, Government of Newfoundland and Labrador, Pasadena, NL A0L 1K0, Canada
*
Author to whom correspondence should be addressed.
Water 2020, 12(6), 1670; https://doi.org/10.3390/w12061670
Submission received: 22 April 2020 / Revised: 18 May 2020 / Accepted: 5 June 2020 / Published: 11 June 2020
(This article belongs to the Section Hydrology)

Abstract

:
Relative permittivity and soil moisture are highly correlated; therefore, the top boundary of saturated soil gives strong reflections in ground-penetrating radar (GPR) profiles. Conventionally in shallow groundwater systems, the first dominant reflection comes from the capillary fringe, followed by the actual water table. The objective of this study was to calibrate and validate a site-specific relationship between GPR-estimated depth to the capillary fringe (DCF) and measured water table depth (WTDm). Common midpoint (CMP) GPR surveys were carried out in order to estimate the average radar velocity, and common offset (CO) surveys were carried out to map the water table variability in the 2017 and 2018 growing seasons. Also, GPR sampling volume geometry with radar velocities in different soil layers was considered to support the CMP estimations. The regression model (R2 = 0.9778) between DCF and WTDm, developed for the site in 2017, was validated using data from 2018. A regression analysis between DCF and WTDm for the two growing seasons suggested an average capillary height of 0.741 m (R2 = 0.911, n = 16), which is compatible with the existing literature under similar soil conditions. The described method should be further developed over several growing seasons to encompass wider water table variability.

1. Introduction

Knowledge of the water table depth (WTD) is essential for understanding many environmental scenarios, including water management in agriculture. WTD, where hydraulic pressure equals atmospheric pressure, demarcates the saturated–unsaturated soil boundary. Naturally, a capillary fringe, which is quasi–saturated but still has negative water pressure, occurs above the water table [1]. The capillary fringe, sometimes called the transition zone, in the vadose zone mediates space, water, and nutrients for plants and soil organisms [2,3]. Both WTD and the depth to the top of the capillary fringe (DCF) are subject to seasonal fluctuations, and thus, can affect agricultural water management practices throughout the growing season. WTD can be measured through a borehole, but this is generally unfeasible at larger scales, since it provides point scale measurements and is destructive.
High-resolution subsurface images of ground penetrating radar (GPR) can be used to measure shallow WTD, especially in coarse-grain soils [4,5,6]. Various GPR field techniques for water table studies have been developed over the decades. Annan et al. [7] stated that it was essential to have a sharp boundary between saturated and unsaturated zones in a GPR profile for precise WTD estimation. Larger wavelengths (i.e., lower frequencies) are recommended, even though the resolution of the radar profile decreases with increasing wavelength [7]. Loeffler and Bano [8] also found that GPR frequencies higher than 900 MHz do not identify the top of the saturated zone (water table) due to the effect from the capillary fringe and the transition zone. Therefore, most WTD studies have been carried out using GPR frequencies lower than 250 MHz [9]. Nakashima et al. [10] and Takeshita et al. [11] used common midpoint (CMP) data acquisition of GPR to explain the multiple reflections from the water table. CMP data can be used to estimate the variation of relative permittivity (εr), and therefore, to calculate the radar wave velocity (v) along the soil profile [10,12]. However, the common offset (CO) survey method using 100 MHz is the most commonly used method in water table studies [5].
The GPR technique was employed during pumping tests to measure the temporal fluctuation of WTD [13,14,15], and has been used for various groundwater studies [16,17,18,19,20,21,22,23,24,25,26,27,28,29]. However, it is challenging to interpret a shallow water table depth associated with closely spaced soil horizons with only the GPR outputs [30]. Advances in sophisticated sensor technology such as real-time WTD and soil moisture data would help to improve the GPR outputs [4]. Still, site-specific GPR data validation is needed to distinguish the accurate water table reflection from the capillary fringe or the transition zone. The objective of this study was to calibrate and validate a site-specific relationship between GPR-estimated DCF and measured WTD data in an agriculturally managed podzolic soil under boreal climate conditions. We carried out GPR surveys along a 42 m transect over two growing seasons through the use of a borehole with a real-time WTD sensor and soil moisture probes installed in shallow soil.

2. Materials and Methods

2.1. GPR Theory

In GPR, a transmitter antenna (Tx) transmits high frequency (10 to 1200 MHz), short pulses of electromagnetic (EM) energy into the subsurface, and a receiver antenna (Rx) captures the transmitted energy [31,32]. Transmitted EM energy (henceforthreferred to as GPR wave) can be reflected, refracted, or attenuated [33,34,35]. GPR wave propagation through the subsurface is highly sensitive to soil moisture [32,33,36,37,38,39,40,41]. The water table reflects more than 40% of GPR wave energy in coarse-grained soils [42]. Accordingly, the water table can give continuous and mostly flat reflections with high amplitude in GPR radargrams [30,43,44,45,46,47,48]. Based on this advantage, GPR is instrumental and an essential method in shallow groundwater studies [15,49]. Early researchers, for example Johnson [50], Livari and Doolittle [51], and van Overmeeren [30,52], reported the ability of the GPR method to detect water tables.
There are three characteristics to be considered when interpreting WTD from a GPR profile (Figure 1). Firstly, saturation decreases from the bottom to the top of the capillary fringe (within the transition zone), consequently increasing the radar wave velocity [53]. The thickness of this zone depends on the amount, size (diameter), and interconnectivity of soil pores [4,54]. Secondly, oscillations of the reflected radar pulse due to the transition zone result in a series of bands representing the water table in the radar profile [4]. The top of the capillary fringe gives an earlier and more robust reflection than the actual water table [55,56]. The wetting front also has the same phase reflection as the water table [57]. Thirdly, the two-way travel time (TWTT) correspondence with the maximum absolute amplitude of the airwave (tair) is the opposite of that of a reflection event (treflect) [55] (Figure 1). In addition to the above characteristics, the maximum absolute amplitude occurs at the second half of the respective GPR wavelet [58].
Equation (1) gives the radar signal velocity (v) of a nonmagnetic and low-loss geological material:
v = c ε r
where εr is the relative permittivity and c is the electromagnetic wave propagation velocity in free space (=0.3 m/ns) [25,31,59]. In addition, the depth to a known reflector method [34] can be used to calculate the GPR reflection wave velocity (vrw) of a monostatic antenna using Equation (2):
v r w = 2 D t
where t is the TWTT of the reflected GPR wave from a reflection boundary and D is the depth to the boundary (ASTM D6432-11). εr of the soil just below the ground surface can be calculated using the GPR direct groundwave method, using Equation (3) [32]:
ε r = c t G W t A W + x x 2
where tGW and tAW are the direct groundwave and airwave arrival times, respectively, from the Tx to the Rx antenna, and x is the antenna separation. εr can be derived from the measured volumetric soil moisture content, θv, using an empirical model. Topp et al. [60] suggested the first model as given in Equation (4) [61].
ε r = 3.03 + 9.3 θ v + 146.0 θ v 2 76.7 θ v 3

2.2. Study Area

The experimental site included a silage-cornfield and a grass field at the Pynn’s Brook Research Station (PBRS), managed by the Department of Fisheries and Land Resources of the Government of Newfoundland and Labrador, located in Pasadena (49.073 N, 57.561 W), Newfoundland and Labrador (NL), Canada. The area is characterized by a 2–5% slope, and the depth to the bedrock is >1 m from the surface [62]. Details of the observed shallow soil profile are given in Table 1. The topsoil (εr1, d1) is an organic soil layer with gravel. Immediately below the top layer is the Ap horizon (εr2, d2), classified as loamy sand (sand = 82.0 ± 3.4%; silt = 11.6 ± 2.4%; clay = 6.4 ± 1.2%) [63]. The average bulk density and porosity of the loamy sand layer (n = 28) are 1.31 g cm−3 (±0.07) and 51% (±0.03), respectively [63]. A well-sorted sandy soil layer (εr3, d3) was observed between the depths of 0.35 and 3.47 m, which is likely to continue further down and act as a shallow aquifer. The average annual precipitation at the site is 1113 mm per year, with 410 mm falling as snow, and the annual mean temperature is 4 °C. Both parameters are as recorded at the nearest weather station, Deer Lake, NL, for last 30 years [64].

2.3. Data Collection and Basic Proccessing

The following materials and instruments were used for data acquisition, processing, and interpretation in this study:
  • PulseEKKO® Pro GPR system (Sensors and Software Inc., Mississauga, ON, Canada) with 100 and 250 MHz center frequency antennas
  • Em50 data logger, and water level, electrical conductivity-, temperature- and SM-probes (METER group Inc. (former Decagon Devices), Pullman, DC, USA)
  • EKKO Project V3 R1 and IcePicker V3 R7 GPR data processing Software (Sensors and Software Inc., Mississauga, ON, Canada)
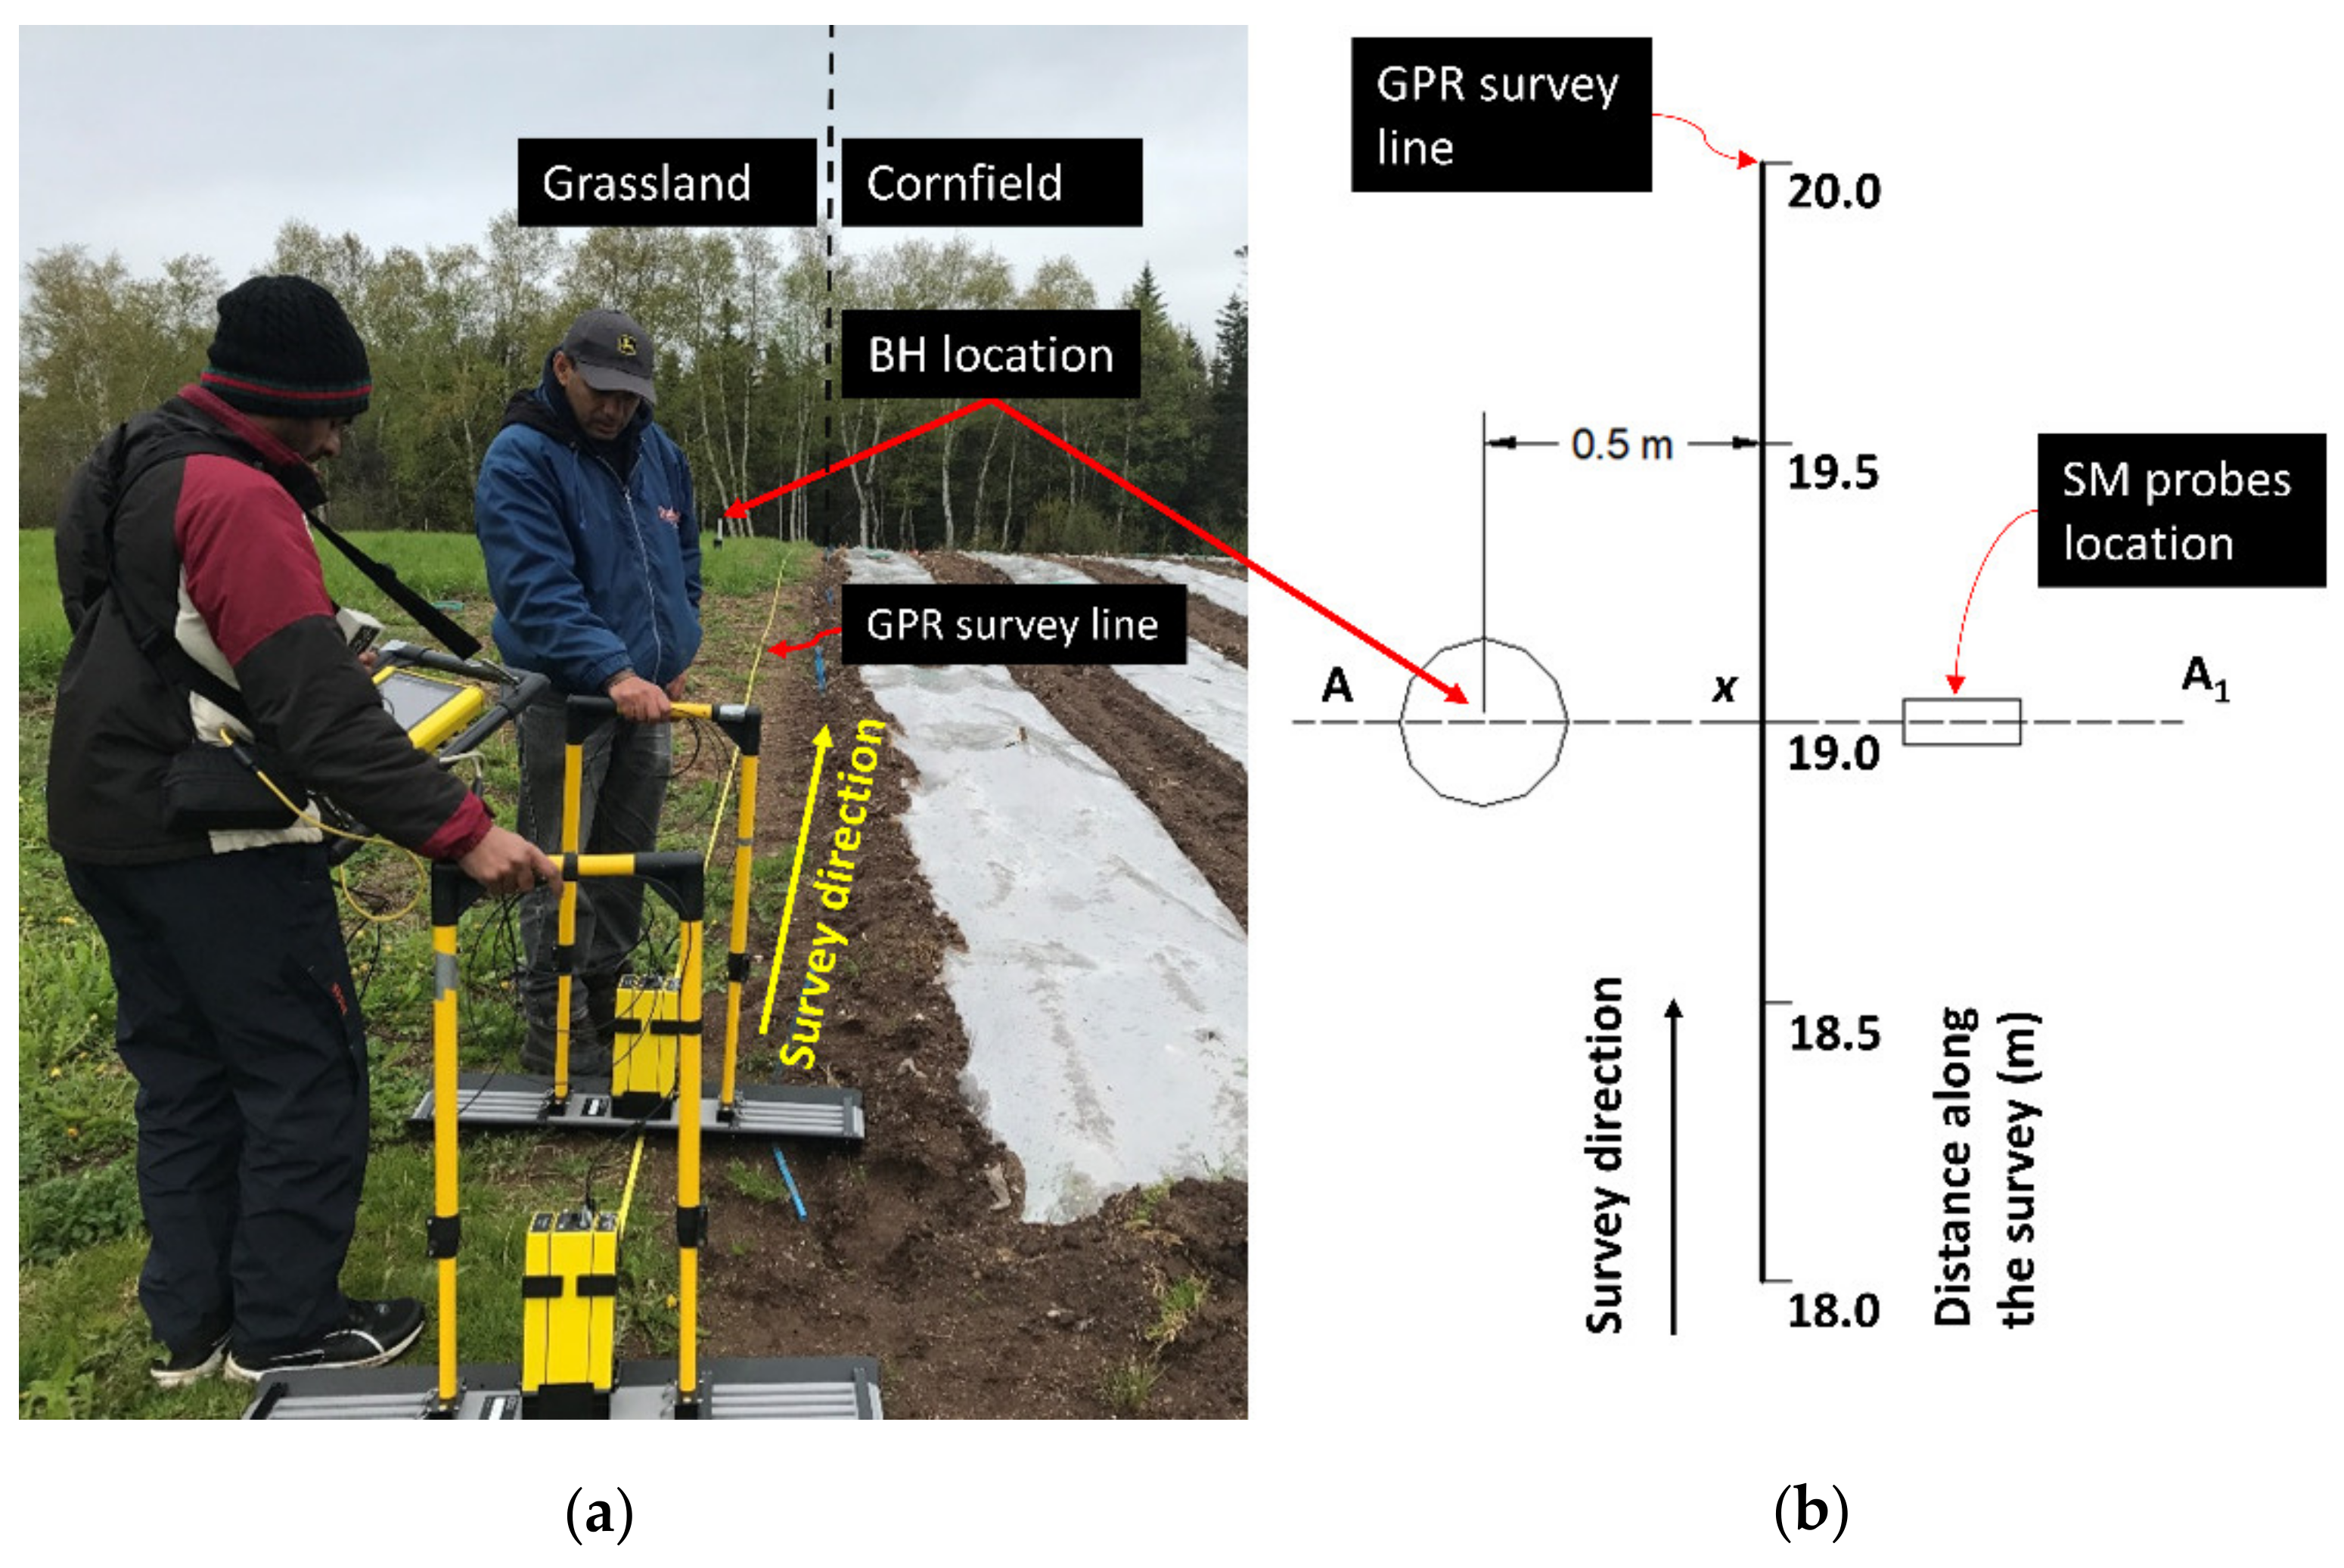
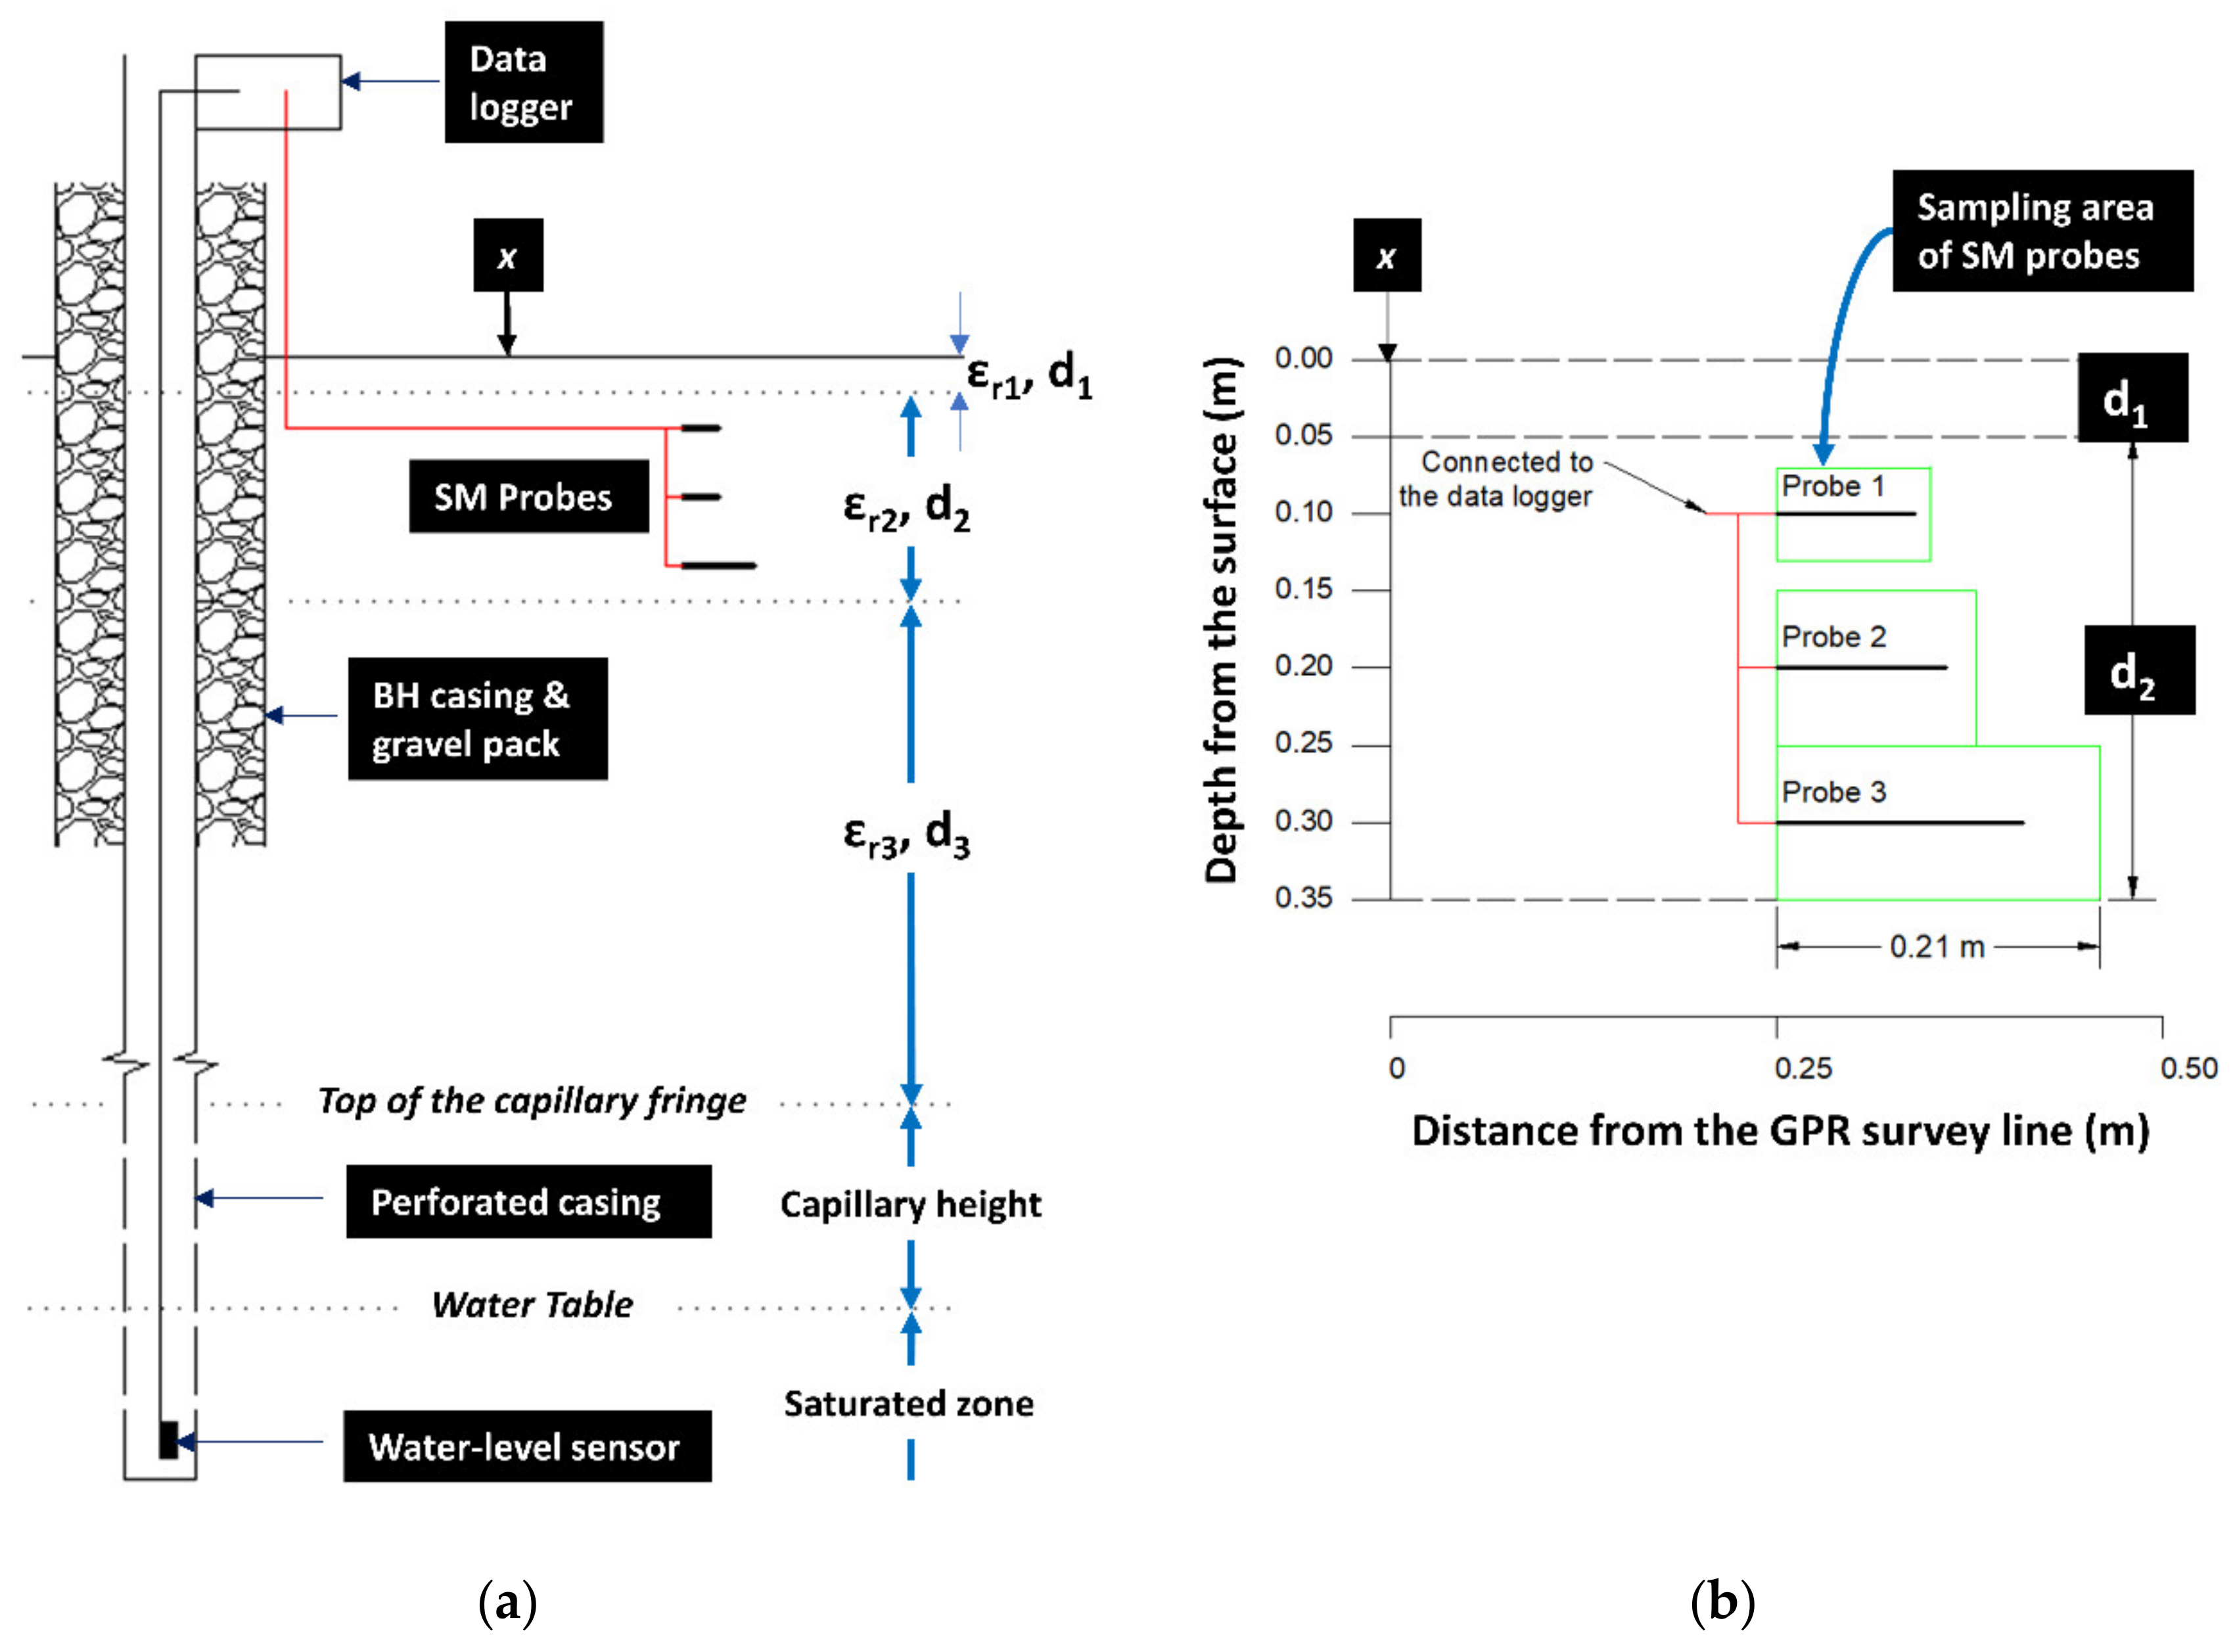
The experimental site was ~50 m wide and 200 m long. The main GPR survey line of 42 m (along the width of the field) was marked between the silage-cornfield and the grass field using wooden pegs (Figure 2a). A shallow groundwater-monitoring borehole (3.47 m deep) was drilled at 19 m along the main GPR survey line. The perpendicular distance between the borehole and the survey line was 0.5 m (Figure 2b). A water level, electrical conductivity, and temperature sensor, connected to a data logger (Em50—Meter Group Inc. (former Decagon Devices), Pullman, DC, USA), was installed at the bottom of the borehole. The water level sensor measured the height of the water column in the borehole. Three soil moisture probes of 5 cm in length (ECH2O EC-5 of Meter Group Inc. (former Decagon Devices), Pullman, DC, USA) were installed horizontally at depths of 0.1 m, 0.2 m, and 0.3 m from the soil surface and connected to the same data logger (Figure 3a). An additional temperature sensor was installed with the soil moisture probe at a depth of 0.2 m. GPR surveys were carried out between the soil moisture probes and the borehole (Figure 3b). The soil moisture probes were oriented perpendicular to the GPR survey direction.
Background GPR surveys were carried out: (i) before construction of the borehole, (ii) after the construction of the borehole, but before installation of the water level sensor, and (iii) after installation of the water level sensor. Sixteen 250 MHz GPR CO surveys (42 m in length, antenna separation = 0.38 m, sampling interval = 0.05 m, temporal sampling interval = 200 ps) and 16 CMP surveys (near the borehole) were performed in 2017 and 2018. Three 100 MHz GPR CO surveys (~30 m in length, antenna separation = 1.0 m, sampling interval = 0.25 m, temporal sampling interval = 800 ps) were also conducted under wet, median, and dry conditions in 2018 along the same GPR line.
Three basic GPR data processing steps were applied using the EKKO Project V3 R1 Software (Sensors and Software Inc., Mississauga, ON, Canada), as listed below.
  • Edit the first break (time-zero correction)
  • Apply dewow and SEC2 (Spreading and Exponential Compensation) gain
  • Background subtraction—applied to the full length of the trace
The dataset did not require extra processing such as bandpass filters, and the processing was intentionally simplified to be applicable for every GPR profile in the dataset due to the low noise level observed. After completing this basic processing, GPR files were exported to the IcePicker V3 R7 software (Sensors and Software Inc., Mississauga, ON, Canada) for automatic time picking.

2.4. Data Analysis

CMP surveys were carried out using the borehole as the common midpoint at every field campaign to calculate the average vrw from the surface down to the top of the capillary fringe. GPR CO survey traces nearest to the borehole were only considered for the DCF estimation. Accordingly, the mean TWTT to the capillary fringe reflection (mean tCF) was obtained from twelve GPR traces. The subjective error was high when picking the leading edge of the wavelet [39]. Therefore, TWTT related to the absolute maximum amplitude of the airwave (tair) and the reflection event (treflect) were picked. This procedure was similar to the direct groundwave analysis by Grote et al. [65]. The actual tCF of every single trace was determined using Equation (5).
t C F = t r e f l e c t t a i r
DCF was then calculated from the mean tCF and the average vrw using Equation (2). DCF of eight GPR surveys in 2017 were plotted in a linear regression model against the measured WTD (WTDm) using the water level sensor at the same time as the GPR surveys. The regression equation obtained from 2017 data was used to predict WTD (WTDp) for eight survey days in 2018. The WTDp and WTDm for 2018 were compared using a 1:1 plot and root mean square error (RMSE). In a second step, WTDm and DCF for all 16-survey days were plotted in a linear regression plot to estimate the average capillary height. The slope and the intercept of the regression line were compared statistically with those of the 1:1 line. In the same manner, the prediction line was statistically compared with the 1:1 line.
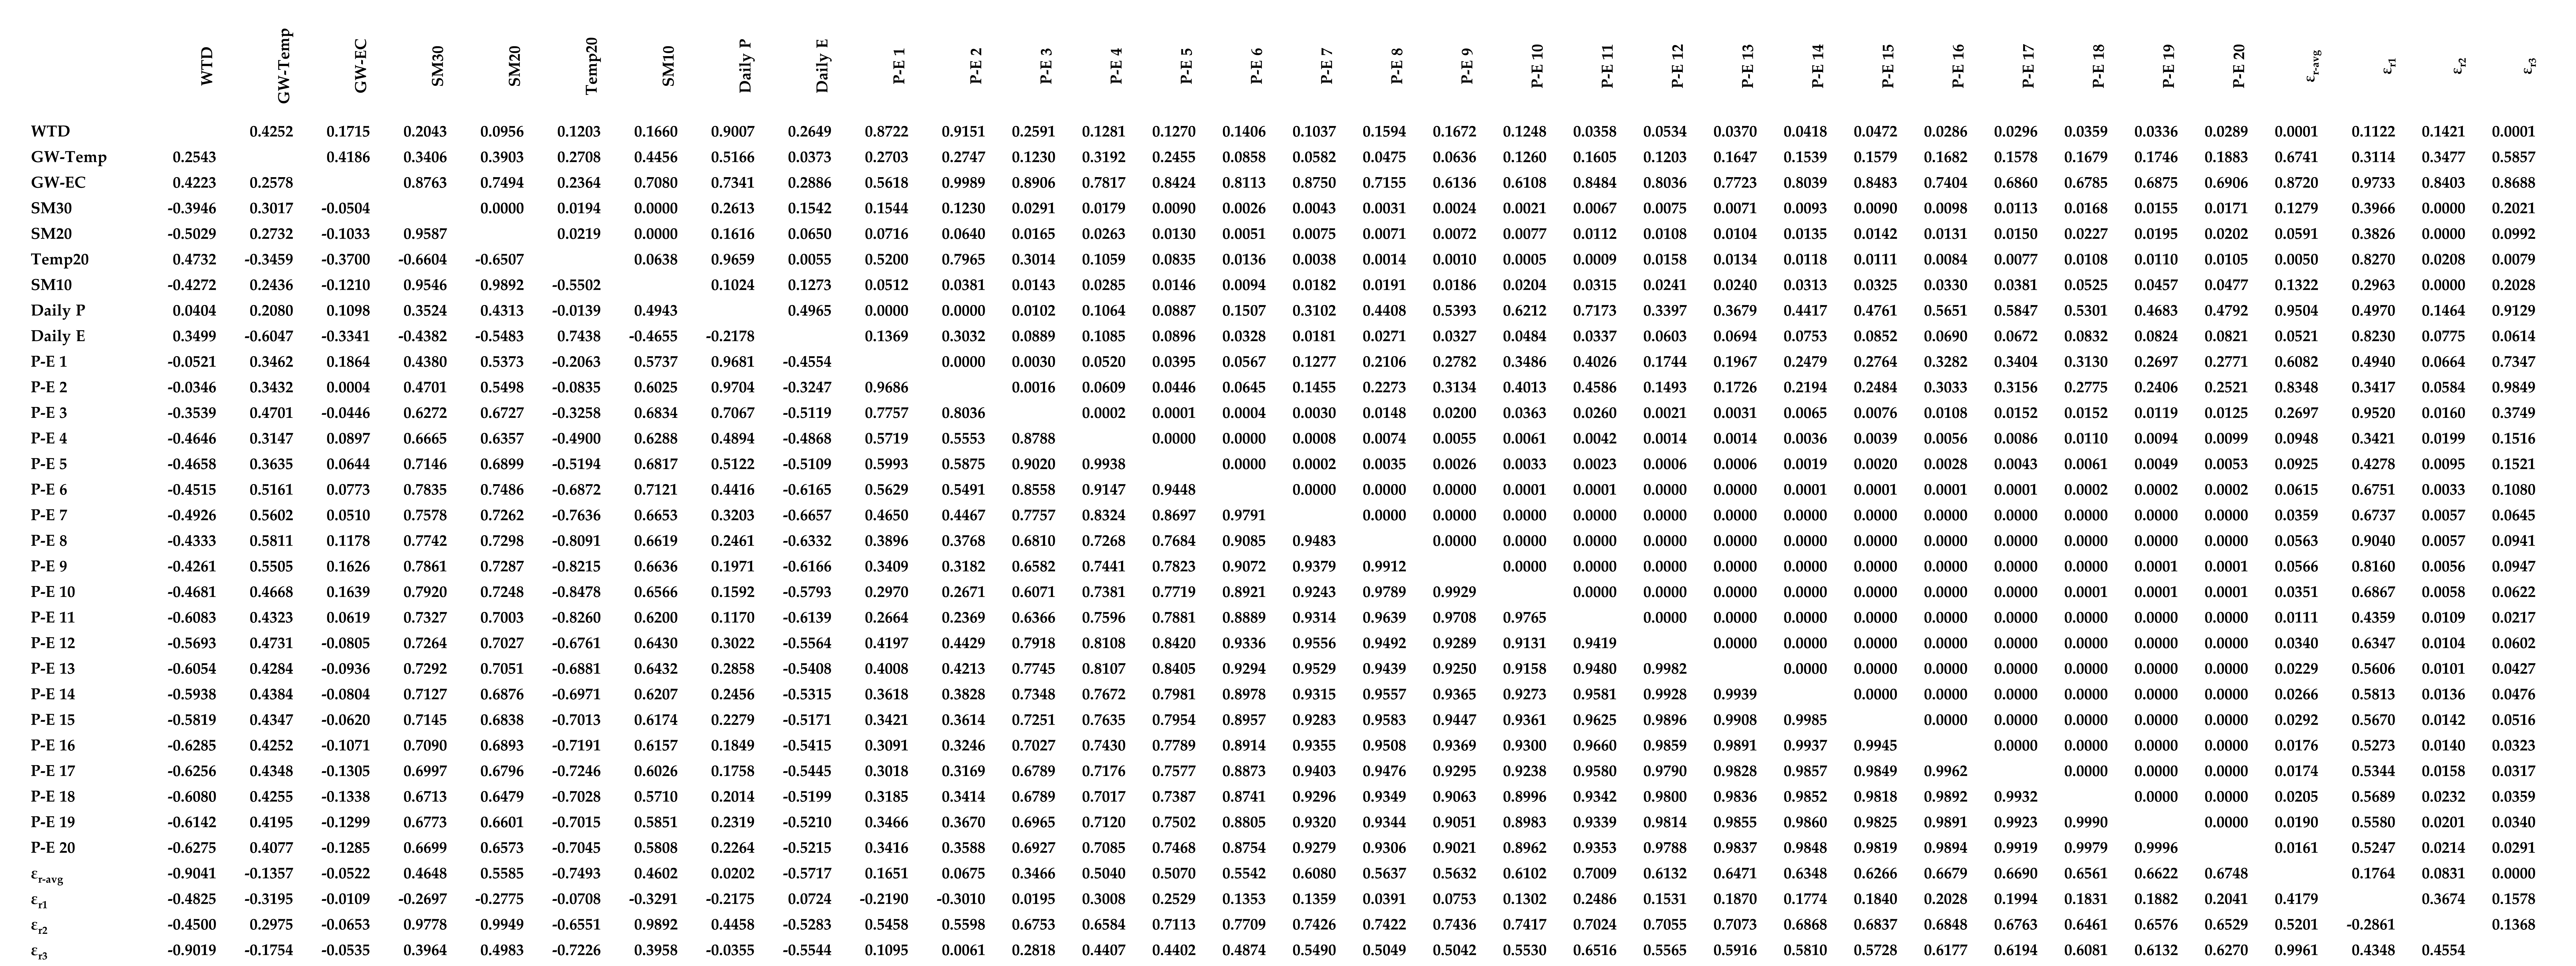
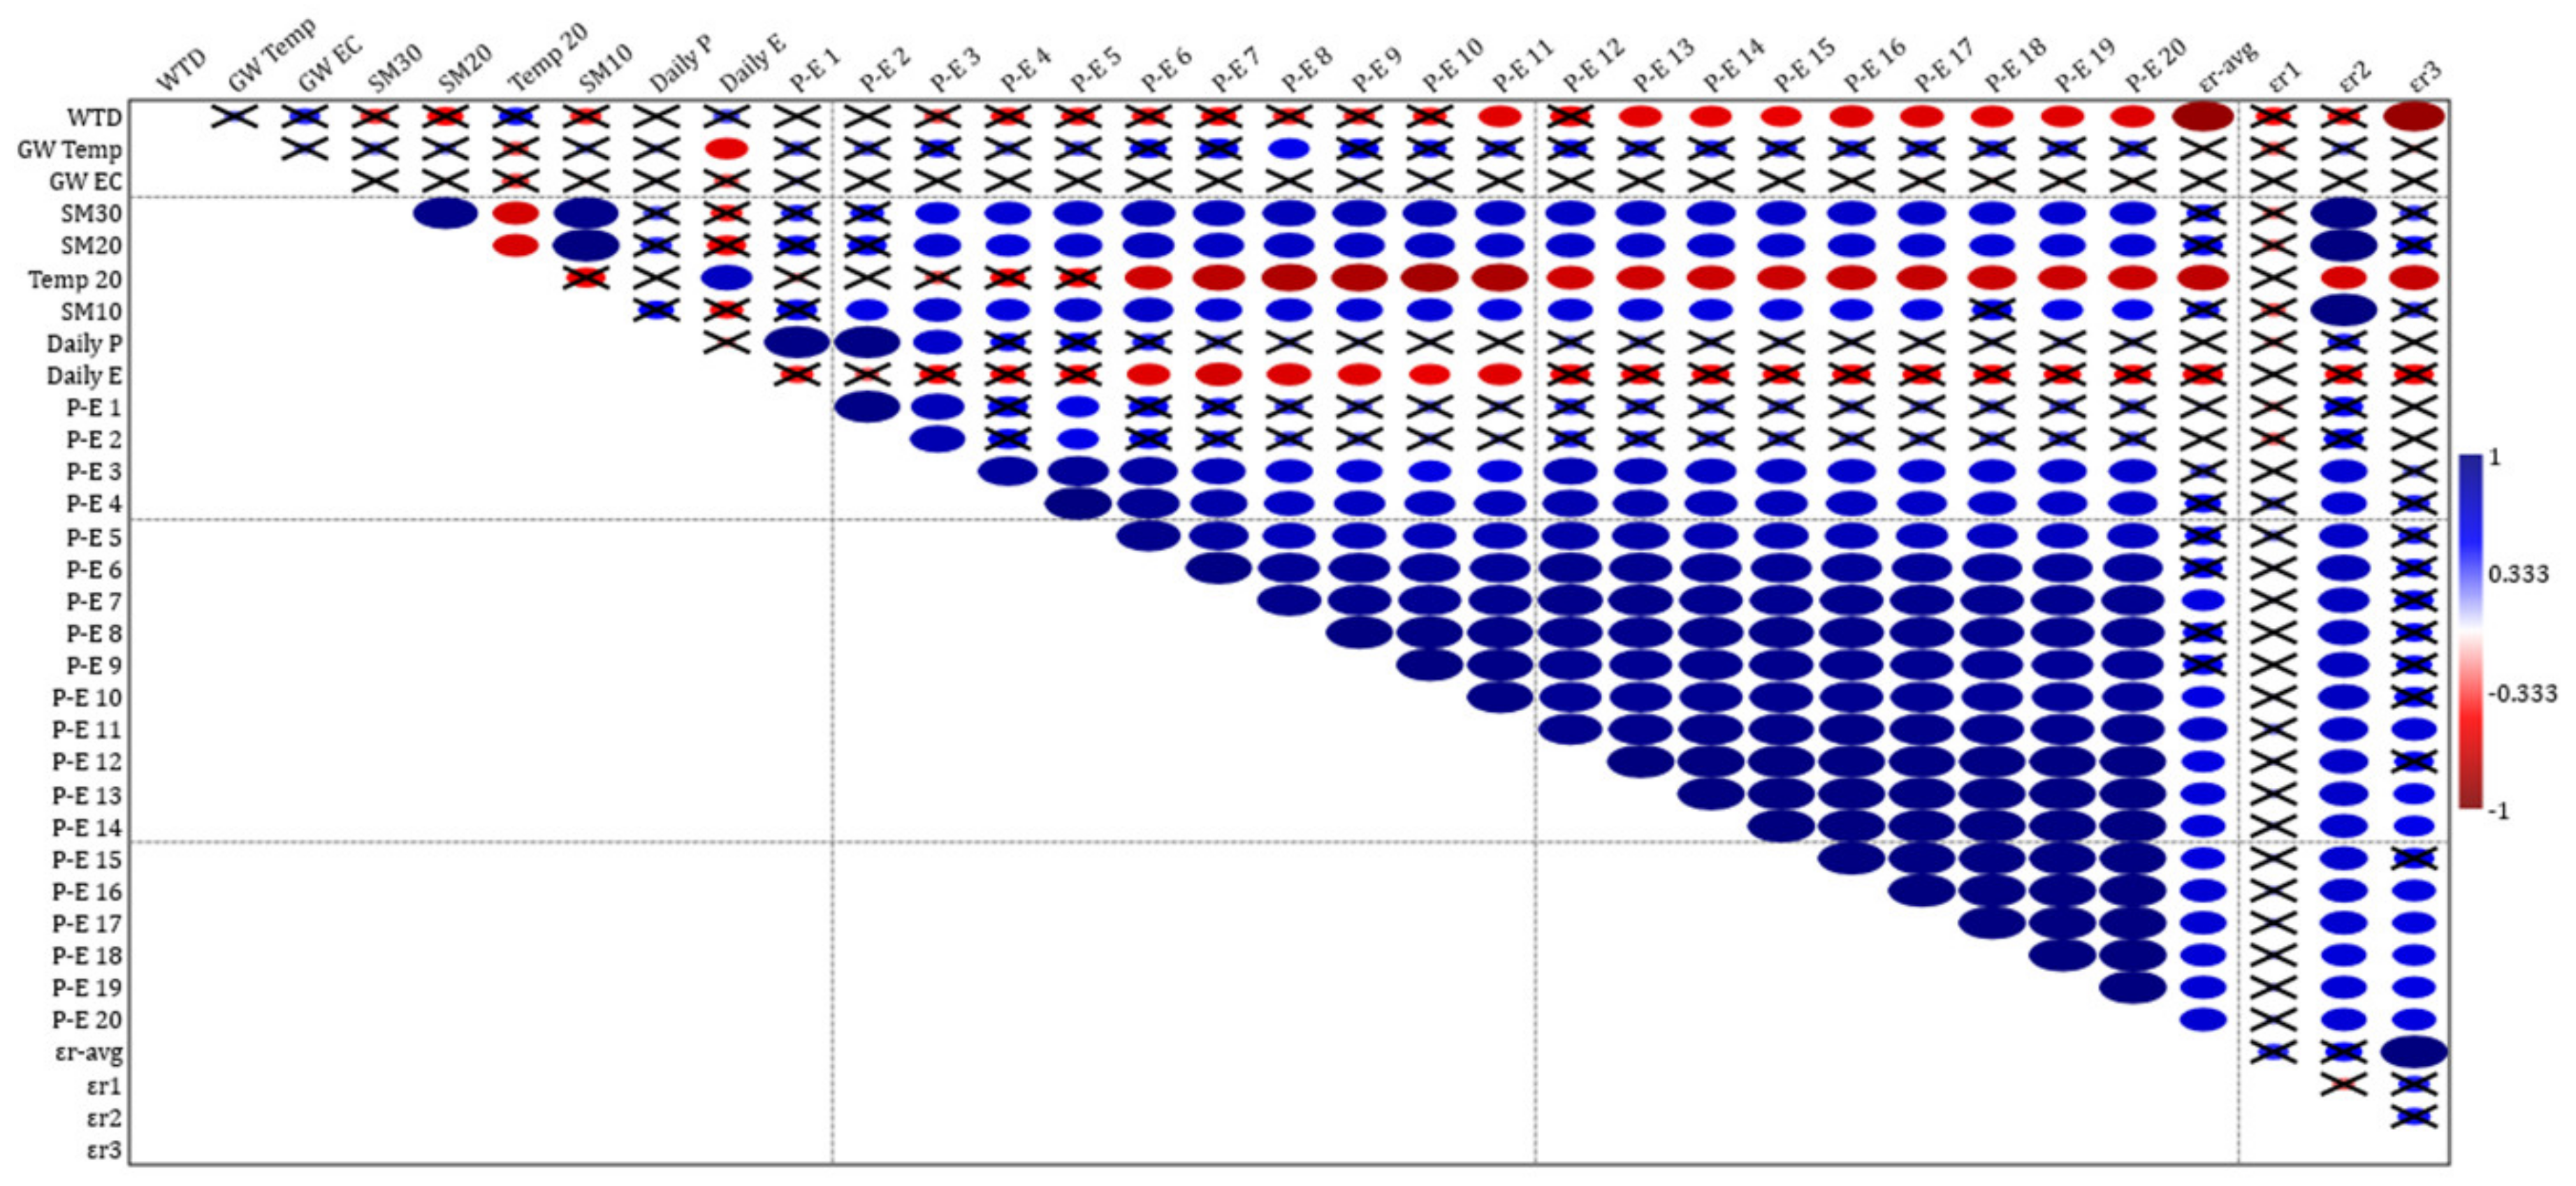
A Pearson’s correlation test was performed at α = 0.05 (95% confidence level) for 33 variables using 12 out of 16 survey days (n = 12) to evaluate the results. The variables used for the correlation analysis were WTD, groundwater temperature (GW–Temp), electrical conductivity of groundwater (GW–EC), soil moisture at 30 cm depth (SM30), 20 cm depth (SM20), and 10 cm depth (SM10), soil temperature at 20 cm depth (Temp20), daily precipitation (Daily P), daily evapotranspiration (Daily E), daily P minus daily E (P–E 1), and cumulative daily P minus daily E (P–E 2 to P–E 20 from 2 days to 20 days cumulative, respectively), εr−avg, εr1, εr2, and εr3 [66].

3. Results and Discussion

3.1. GPR Survey Outputs

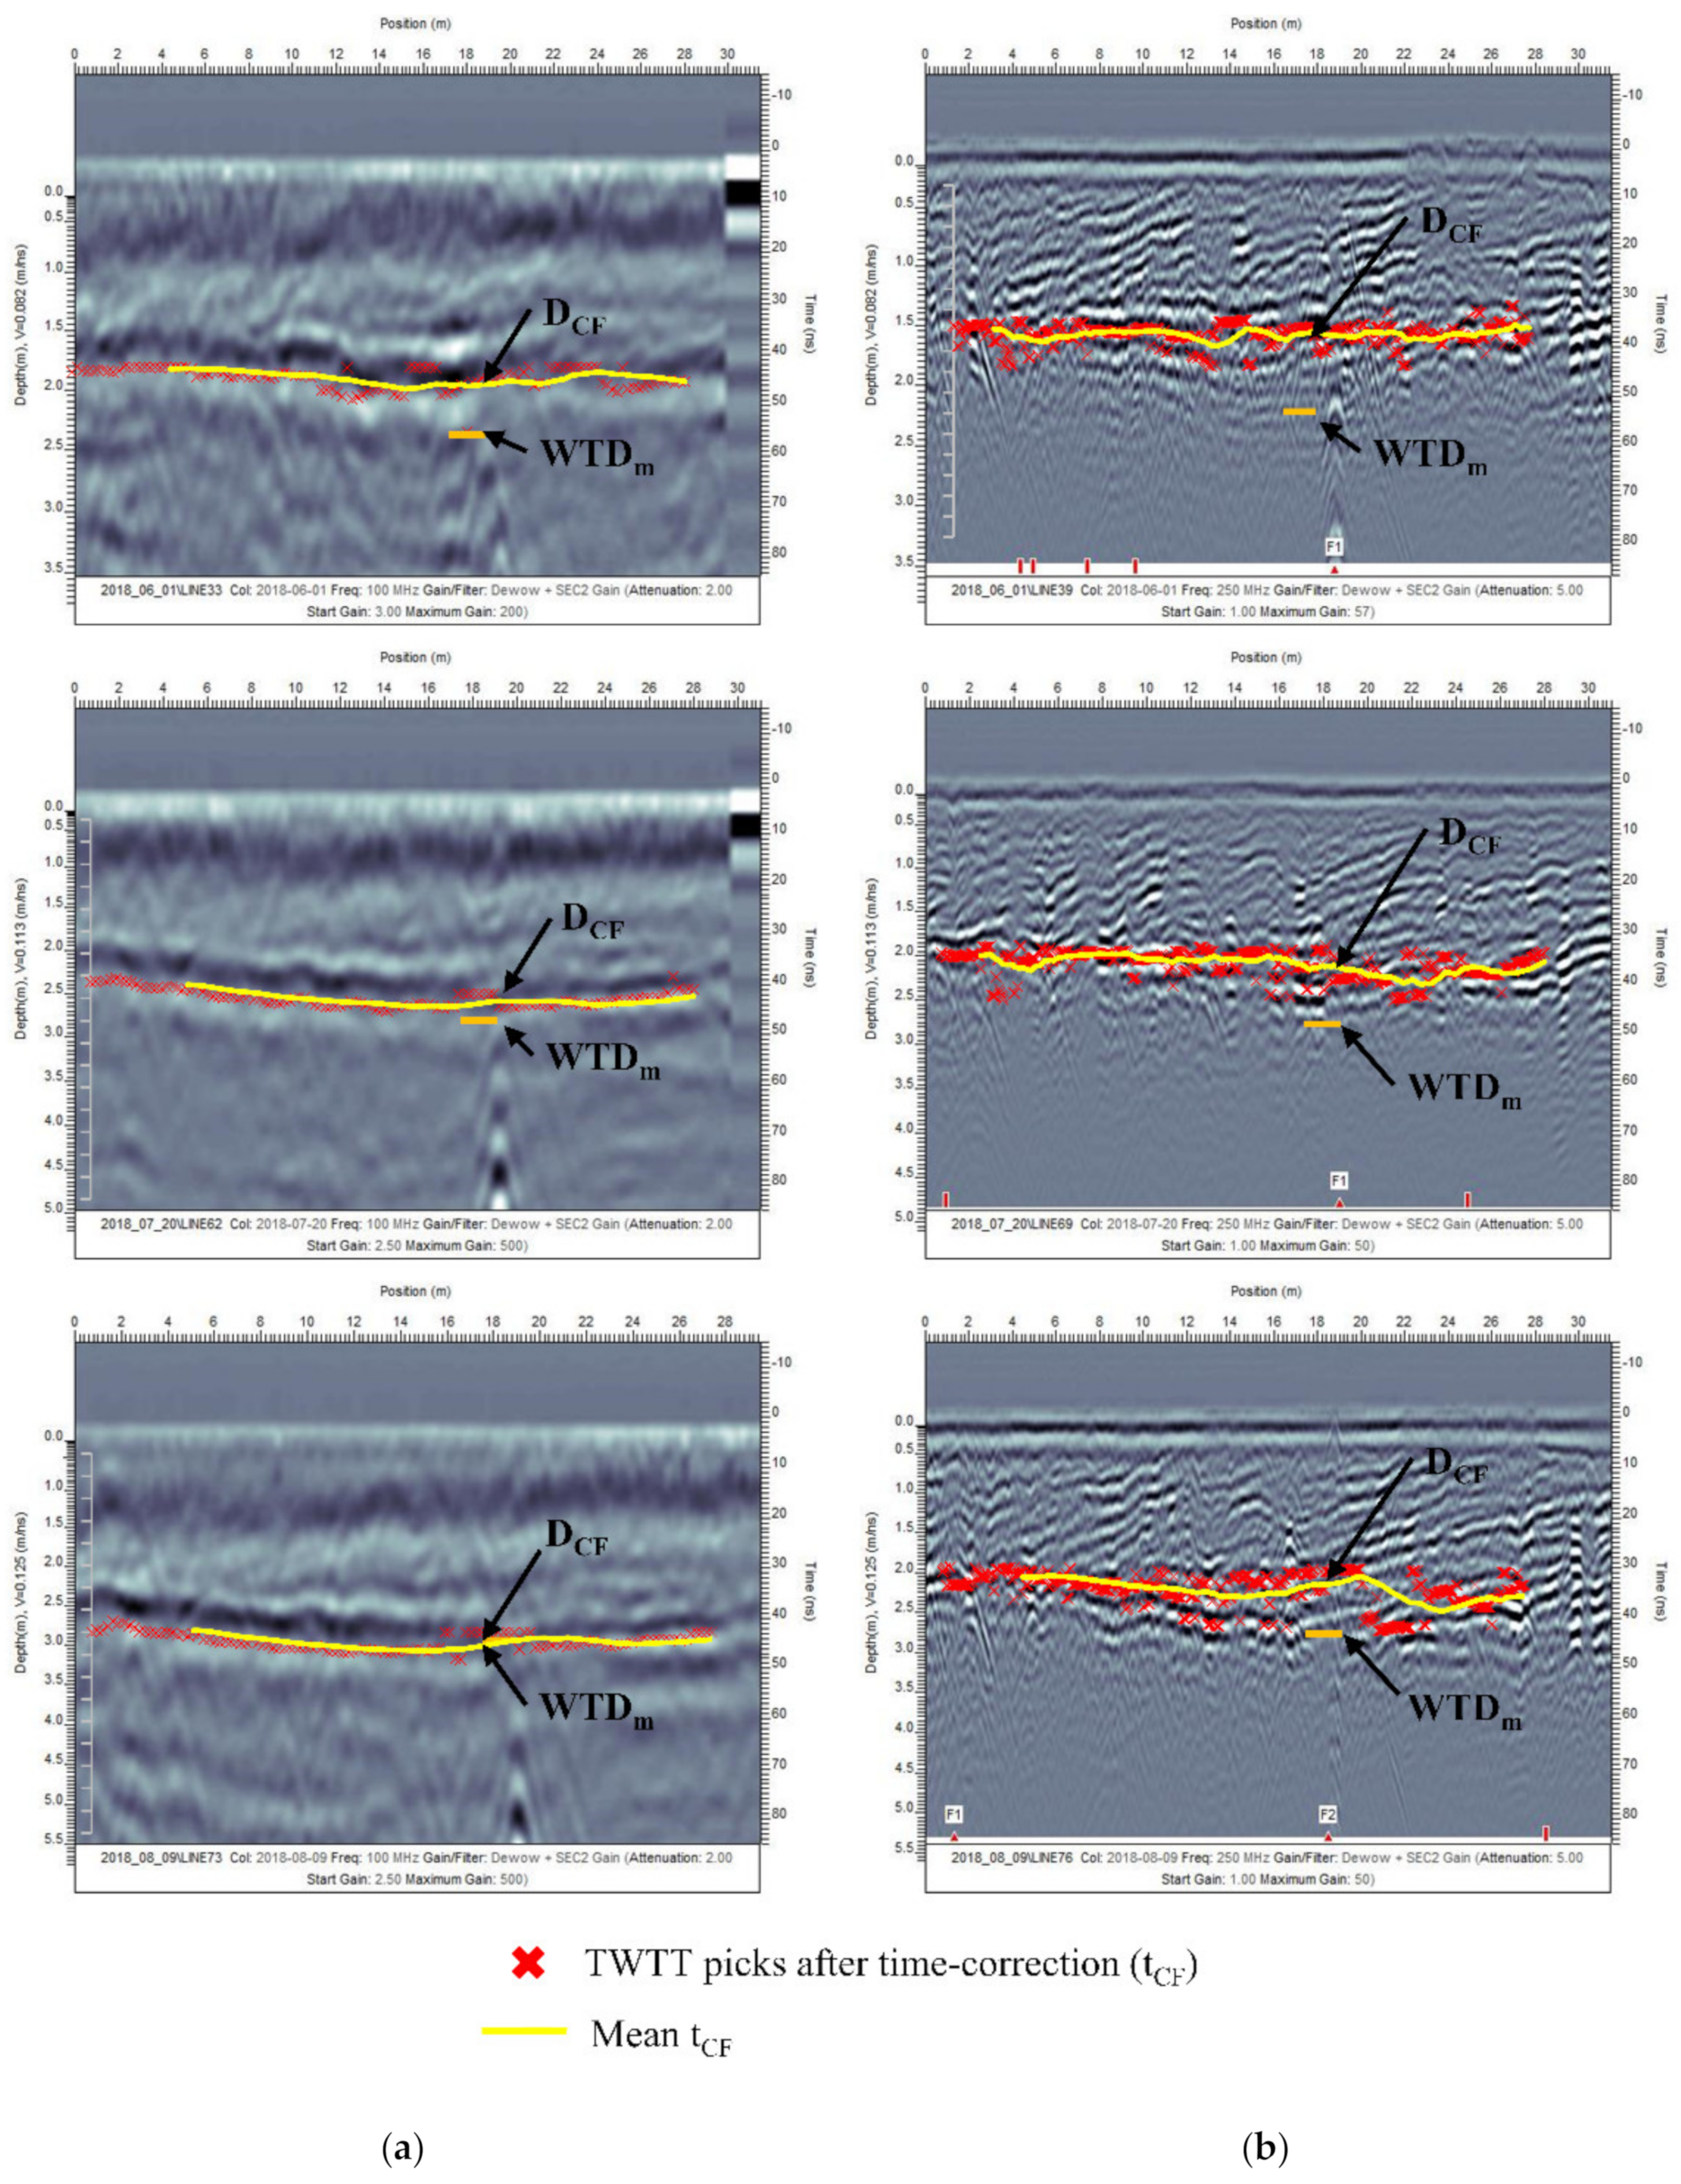
GPR profiles from 250 MHz provided high-resolution radar images; therefore, multiple reflections near the water table can be clearly observed (Figure 4). The elevations have not been corrected; therefore, the reflections in Figure 4 can be observed as undulating boundaries. The GPR velocity is independent of the frequency (for frequencies above 100 MHz to 1500 MHz) and dependent only on the relative permittivity and the magnetic permeability [67]. Thus, the same velocity derived from 250 MHz could be used to analyze 100 MHz data on the same day; 100 MHz gives low-resolution radar images with a relatively flat and clear boundary for the water table zone, and with fewer multiple reflections (Figure 5a). The results from this study indicate that 250 MHz is suitable to examine shallow DCF, whereas 100 MHz is more suitable to examine deeper WTD.

3.2. Estimation of DCF

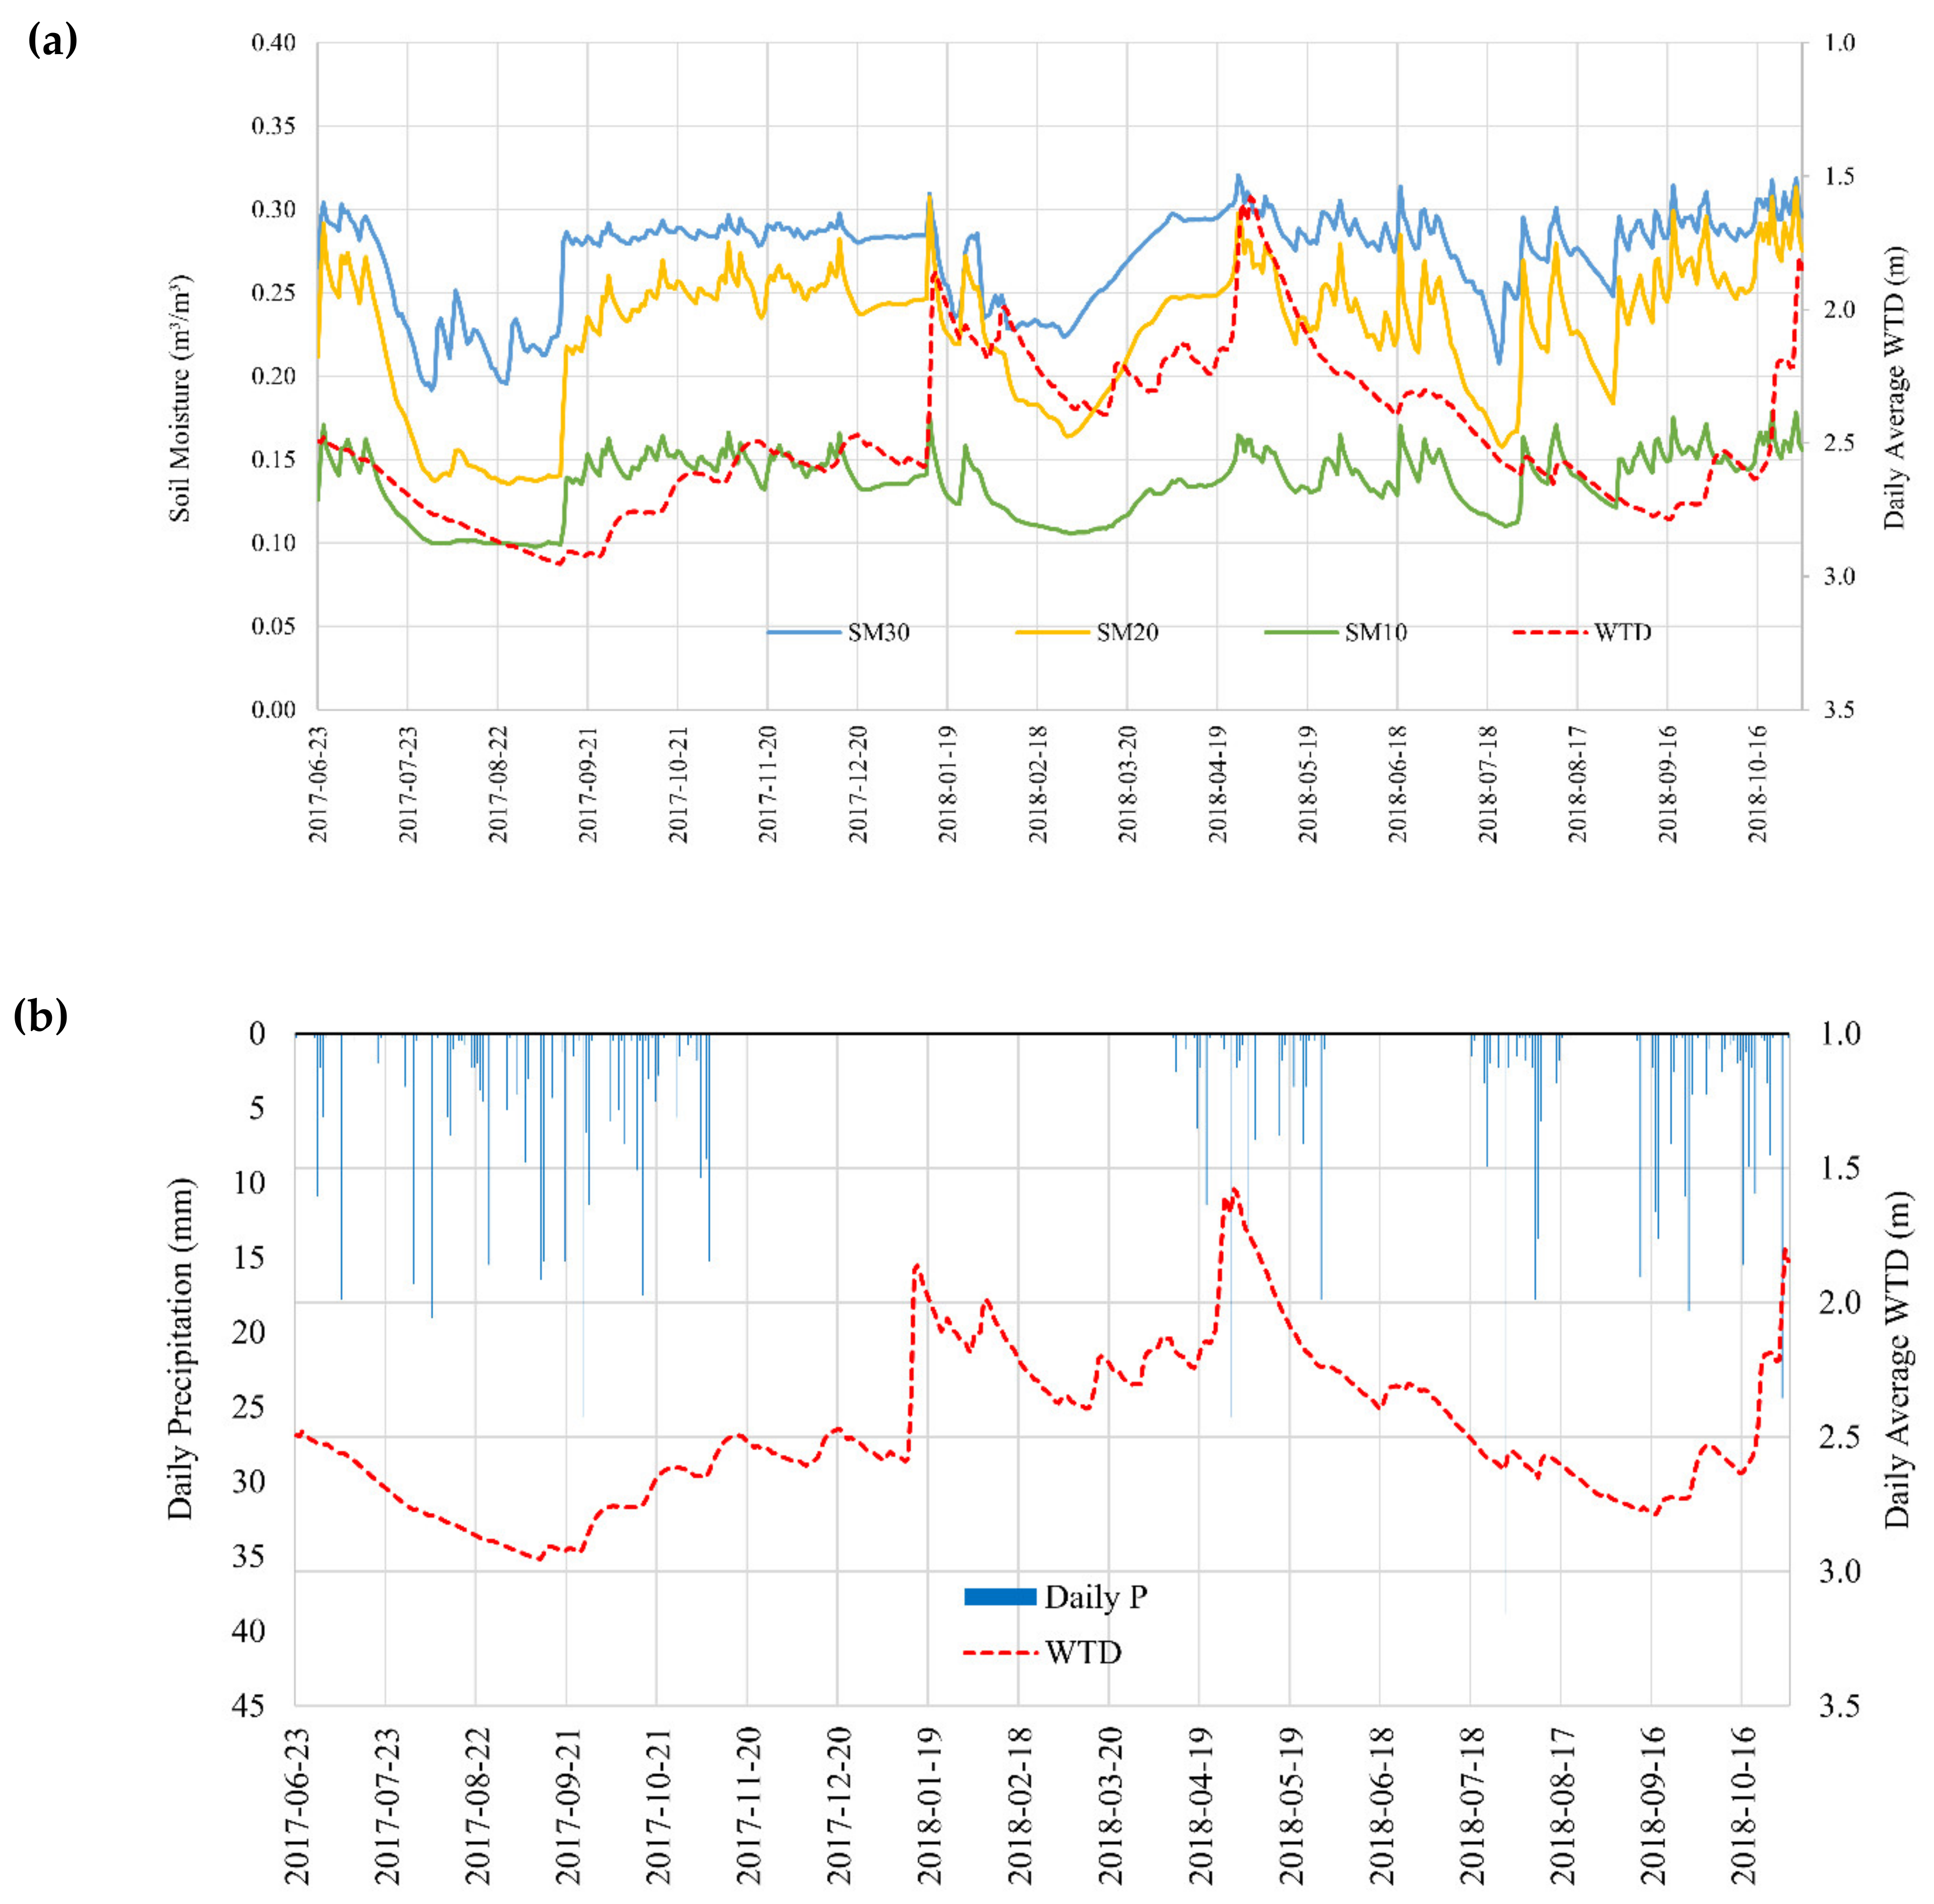
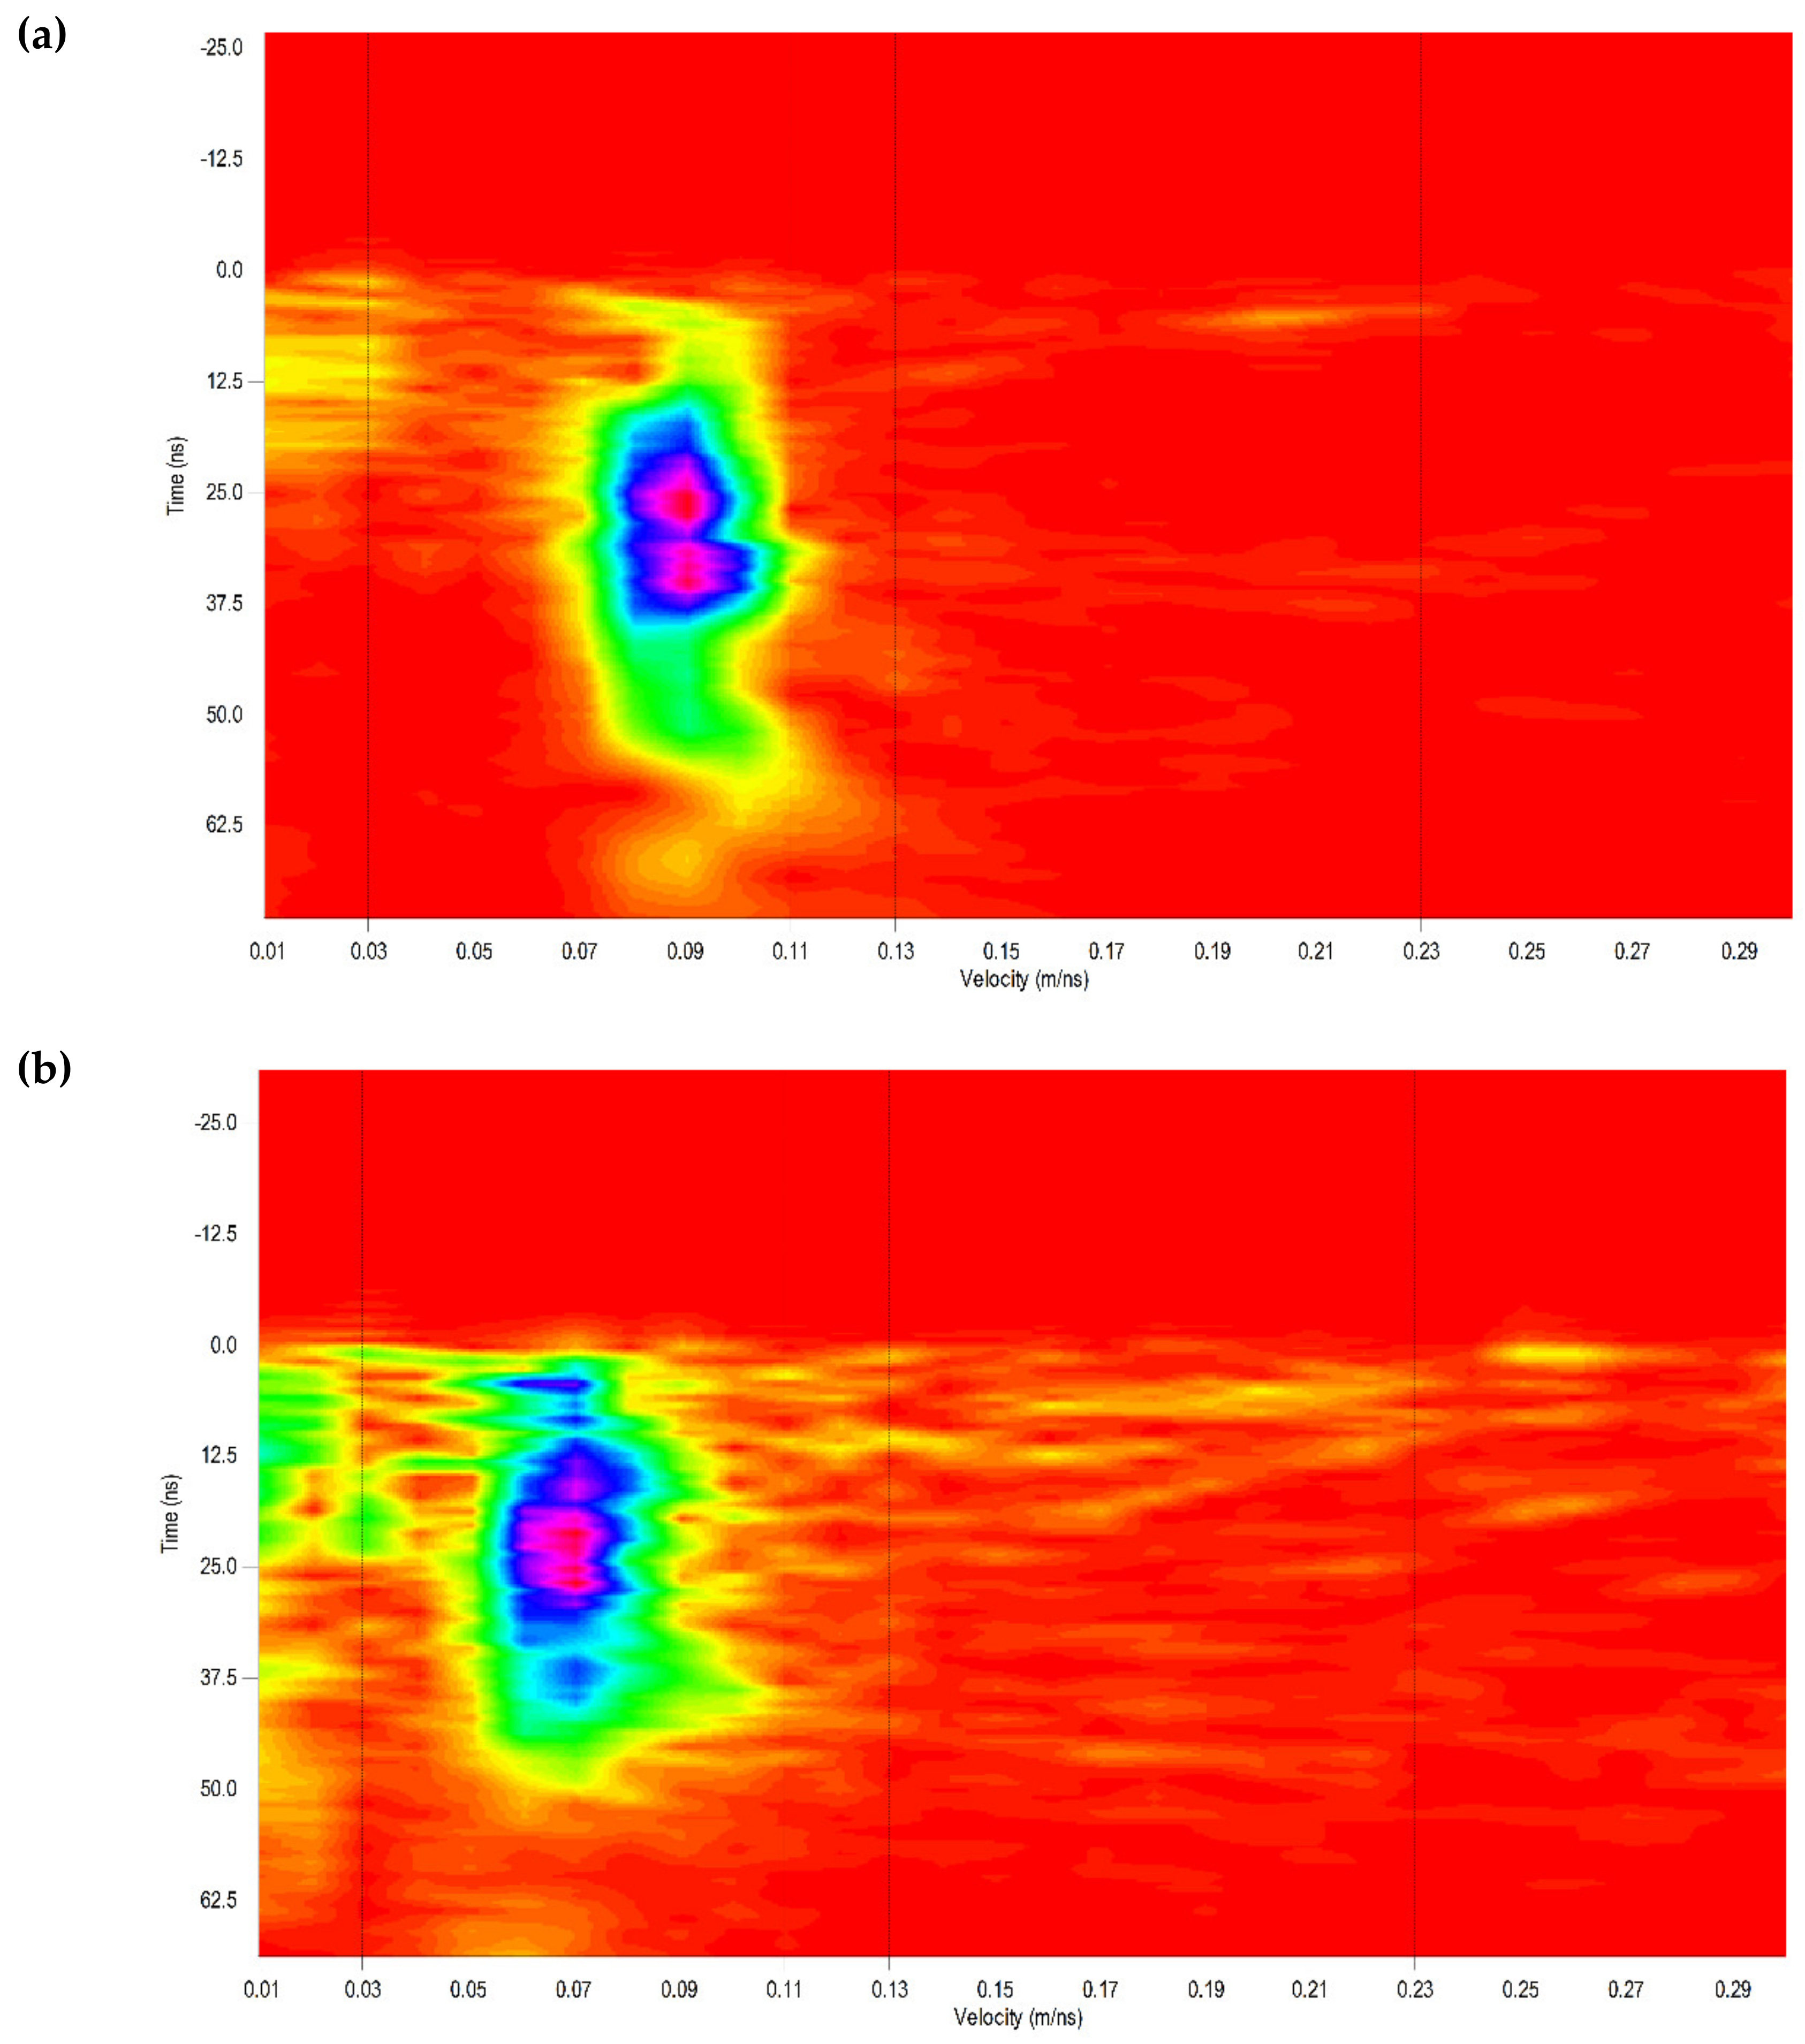
The DCF derived using Equation (2), and CMP derived radar velocities for all 16 GPR survey days, are given in Table 2. Two examples of semblance analyses for CMP velocity estimation are illustrated in Figure 6. The fluctuation of WTDm related to GPR survey days (n = 16) varied from 1.85 m to 2.91 m. For the entire study period covering growing seasons in 2017 and 2018 (496 days), the WTDm varied between 1.58–2.95 m. The shallowest WTDm of 1.58 m was observed in the spring of 2018 (30 April 2018), while the deepest WTDm of 2.95 m was found in the early fall of 2017 (10–12 September 2017). Throughout the studied period, the average WTDm was 2.48 m, with an annual average of 2.69 m in 2017 and 2.34 m in 2018 during the growing season (from May to the end of October). These data imply that the 2017 growing season was relatively dry, which was also confirmed by weather data collected onsite (Appendix A).

3.3. Site-Specific Relationship for WTDm vs. DCF

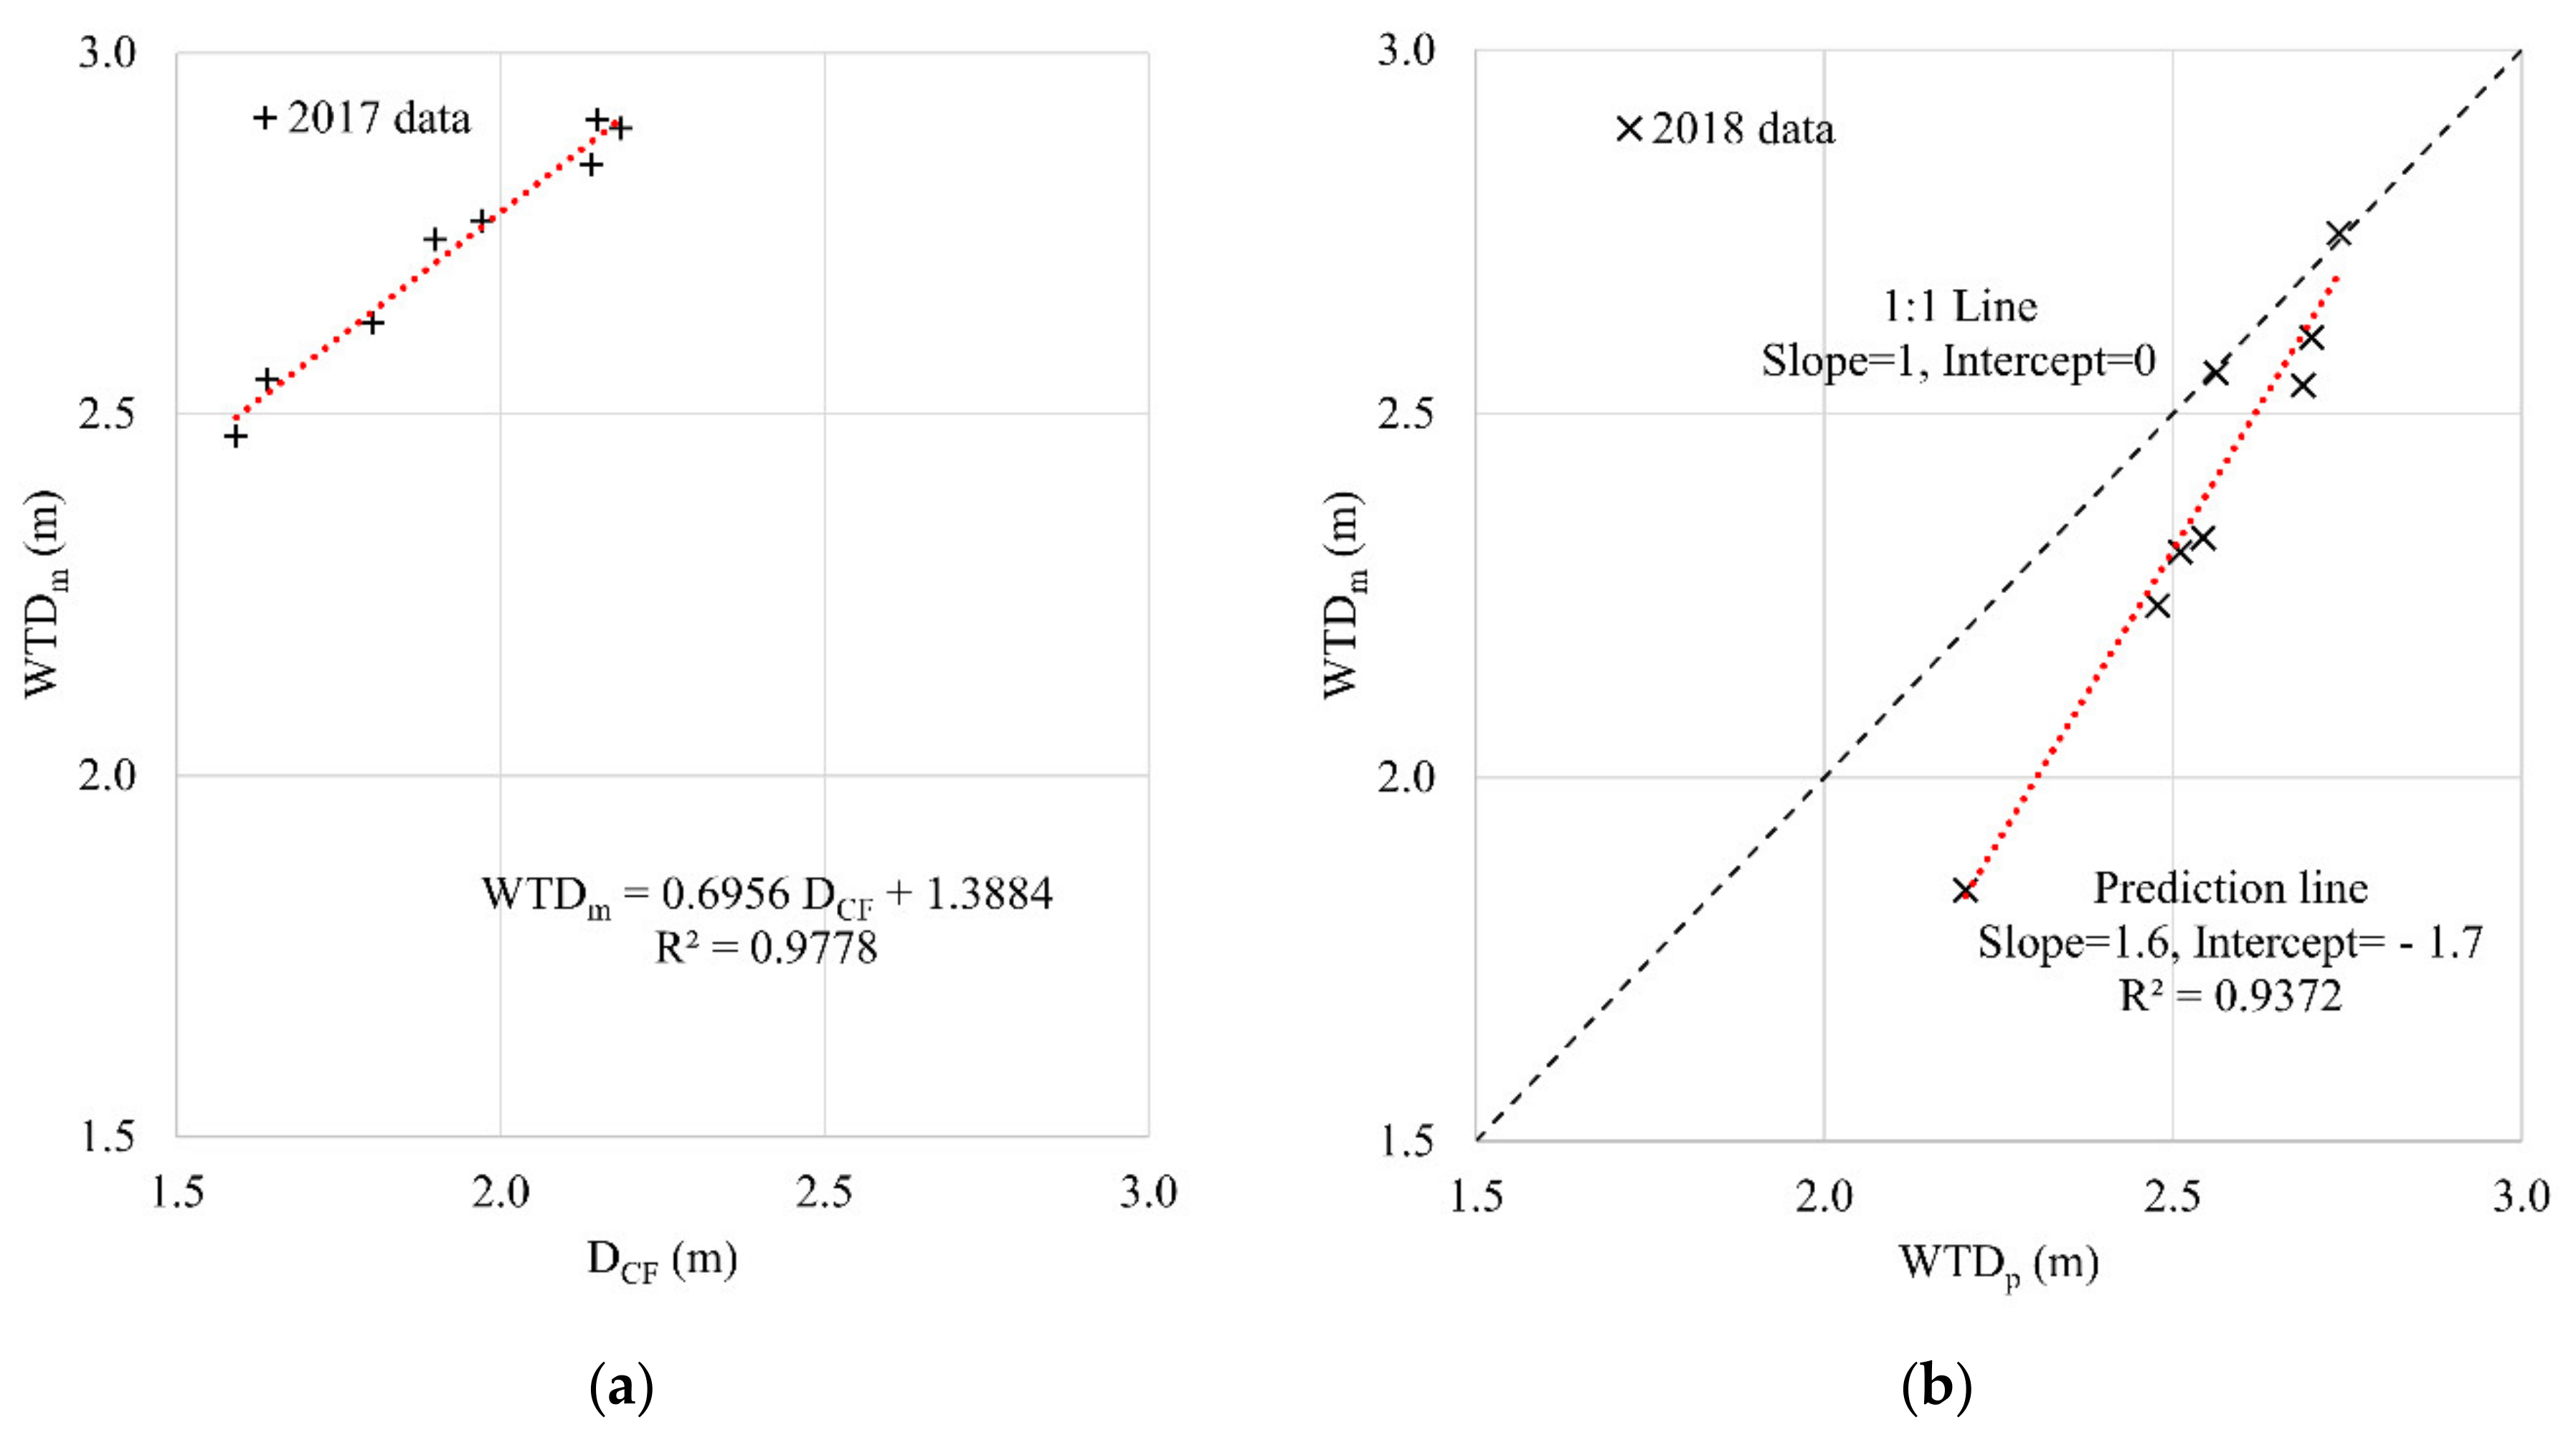
The WTDm at the same time as the GPR survey and corresponding DCF obtained using GPR data are plotted in Figure 7a. A strong linear regression with an R2 of 0.98 was found (Equation (6)) between WTDm and DCF for GPR surveys in 2017:
W T D m = 0.6956 D C F + 1.3884
The WTDp for 2018 based on the GPR measured DCF and the regression model (Equation (6)) was plotted against the WTDm in a 1:1 plot (Figure 7b). The slope of the prediction line (1.6) and that of the 1:1 line (1.0) are significantly different at α = 0.05 (p-value = 0.004, df = 12, tcritical = 2.179 < tcalculated = 3.536) (Appendix B, Table A1). The error of WTD prediction was high during the wet survey days and overestimated from the 1:1 line (Figure 7b). This behaviour could be due to the fact that the capillary fringe would not fluctuate uniformly with the WTD fluctuation. As Bentley and Trenholm [55] stated, the capillary height is greater when the WTD is increasing (during discharging) and lower when it is decreasing (during recharging). However, the present study determines the capillary height based on the WTDm through a regression equation (Equation (6)). The regression equation is a generalized form of all measured data throughout a growing season. Therefore, the regression model might not be suitable when there is a sudden decrease in WTD, like during heavy or long duration rain events. The rain event at the end of the growing season of 2018 was unexpectedly heavy (Appendix A); consequently, it produced a maximum error in the WTD prediction on 31 October 2018 (Figure 8). However, it is worth noting that the RMSE of 0.194 m between WTDm and WTDp can be considered acceptable for the scale of application in most agricultural practices.
In general, the spatial variation of DCF cannot be measured directly under heterogeneous field conditions [68]. The proposed method provides a noninvasive approach to estimate DCF, which is more beneficial in agricultural fields during the growing season since the capillary zone provides the best soil moisture conditions for plants. The advantage of the proposed method is that both WTD and DCF can be estimated in real time. The results would have been improved if a broader range of measured data were available under different soil moisture and variable water table conditions.
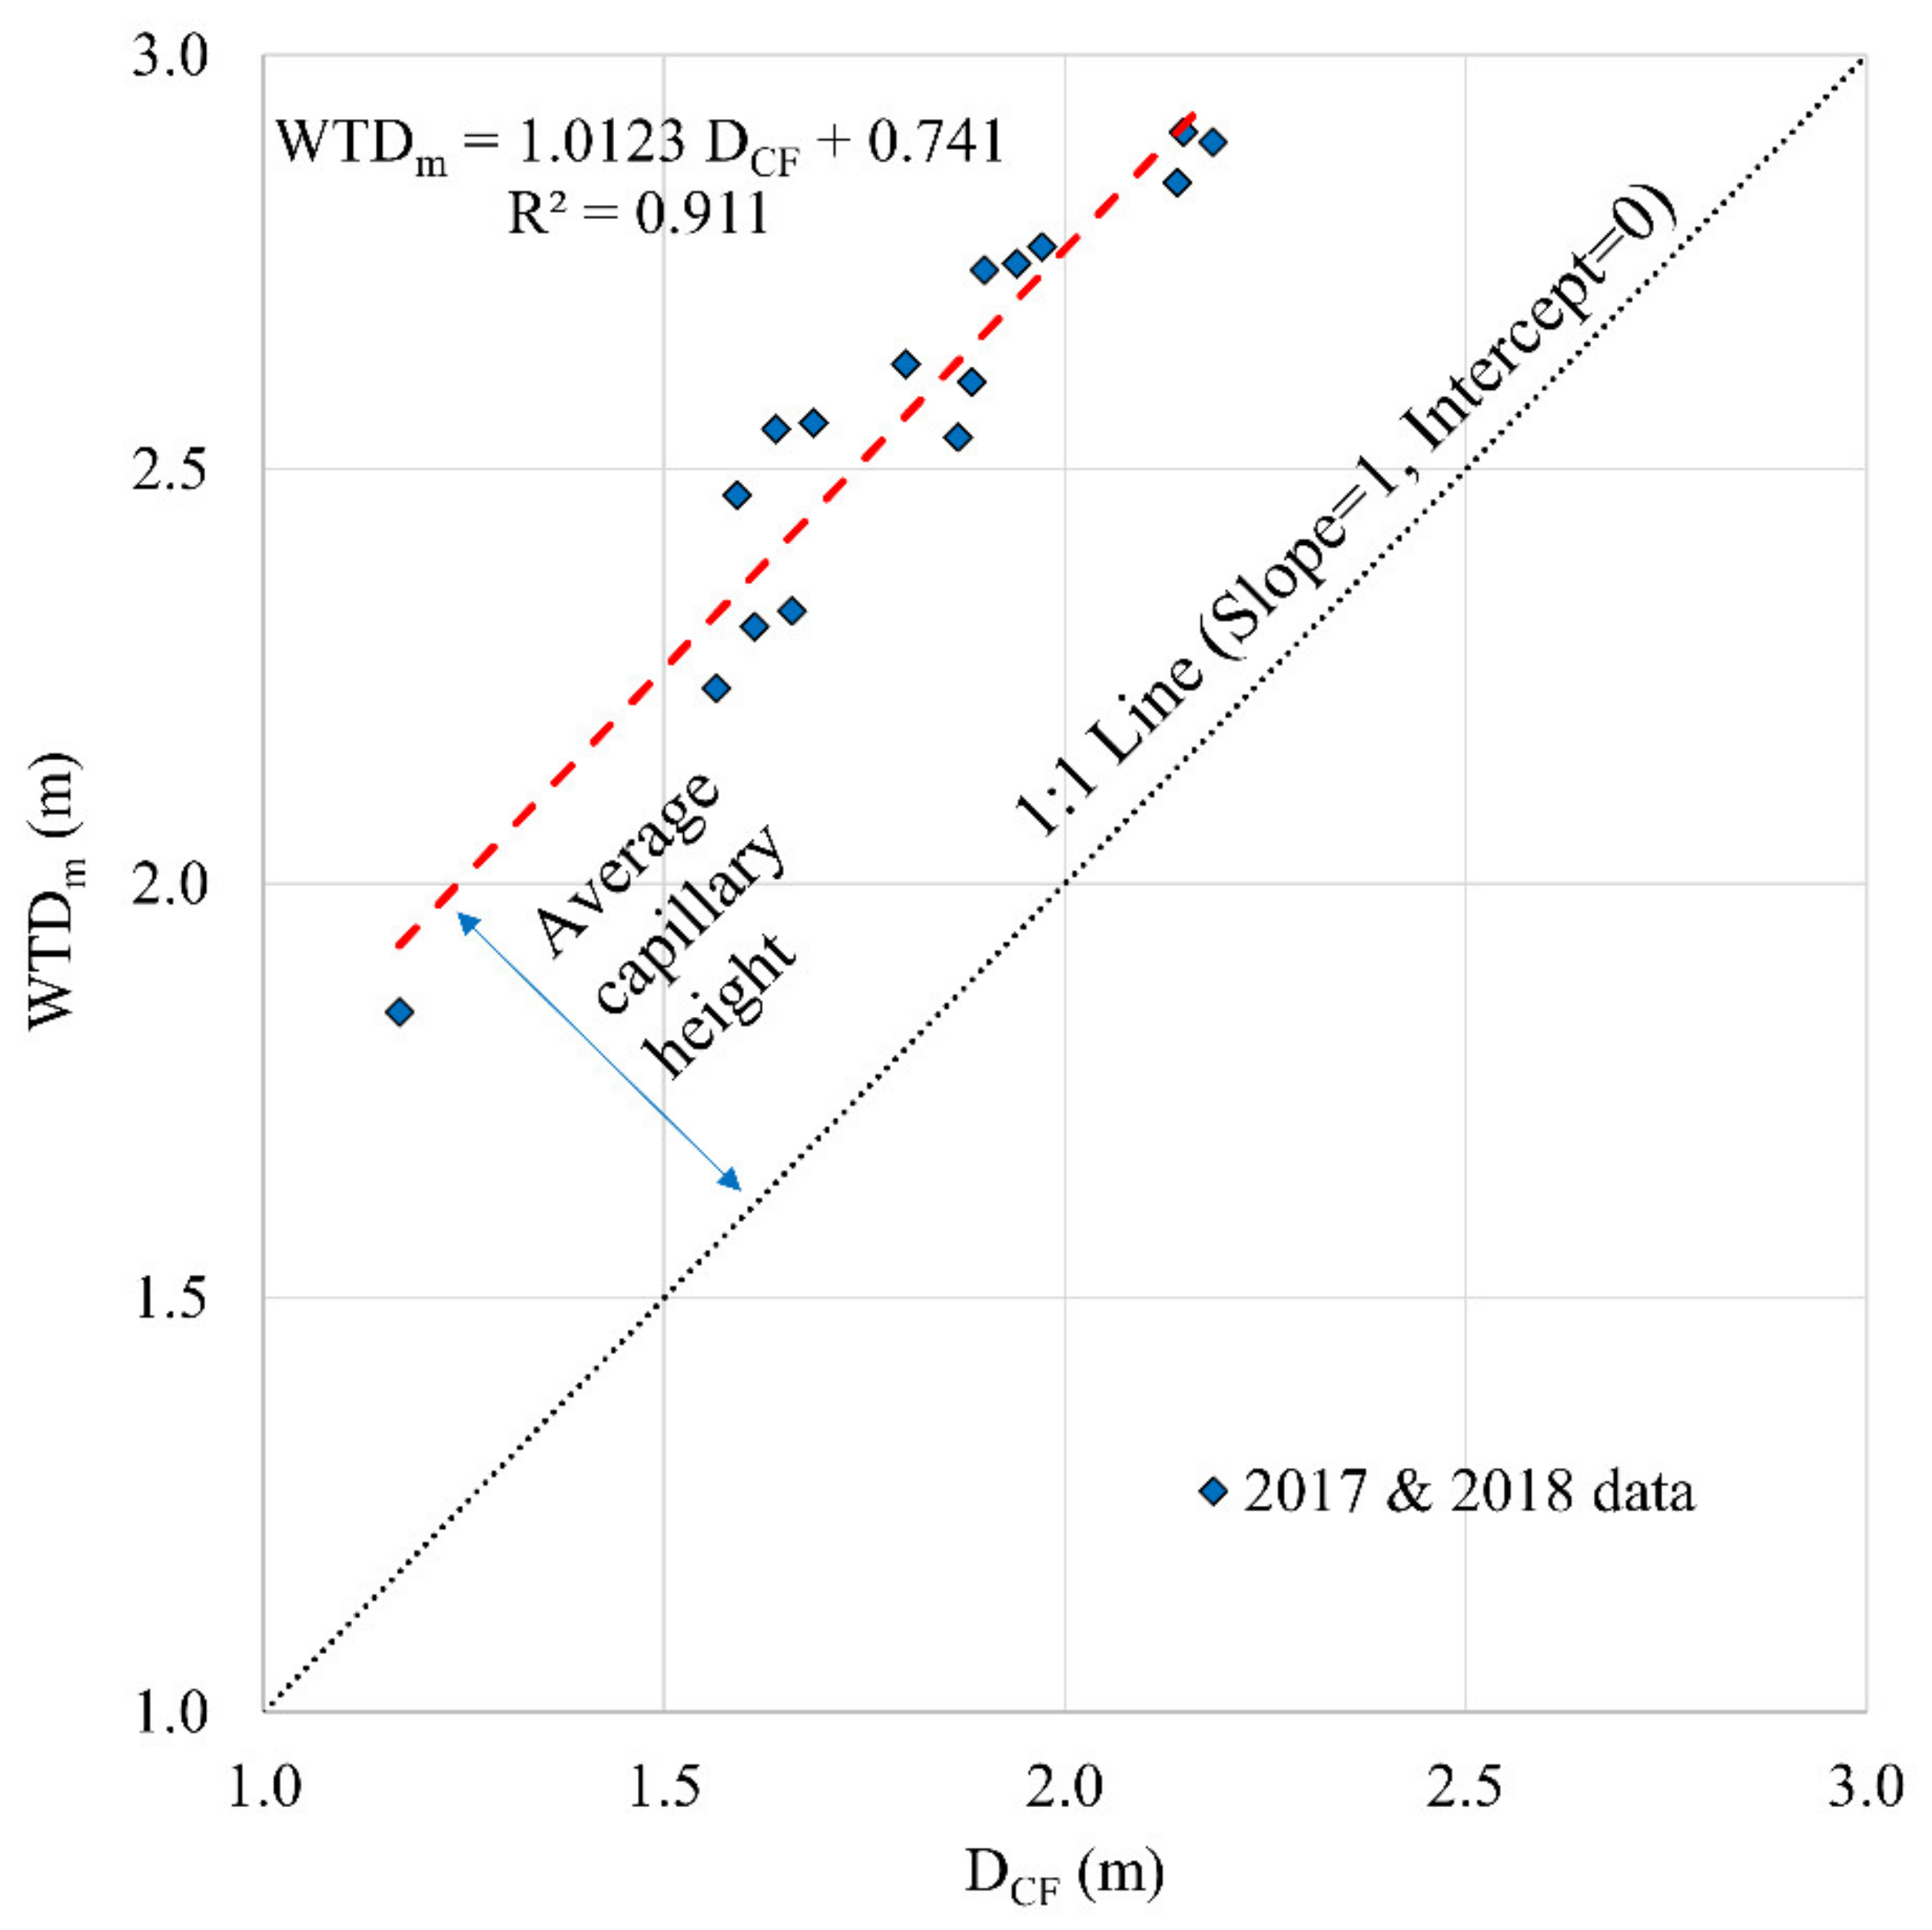
As seen in Figure 9, WTDm and DCF for all survey days have a linear relationship (WTDm = 1.0123 DCF + 0.741) with an R2 of 0.91. The slopes of the regression line (1.01) and the slope of the 1:1 line (1.00) are not significantly different at α = 0.05 (p-value = 0.89, df = 28, tcritical = 2.048 > tcalculated = 0.146) (Appendix B, Table A2). Therefore, the intercept of the regression line (0.74 m, n = 16) can be considered as the average capillary height within the growing seasons in 2017 and 2018. As a result, an average capillary height of 0.74 m was suggested for the particular site throughout the growing season. The average value agrees with the value of ~0.70 m capillary height for similar soil conditions described by Liu et al. [69]. However, in contrast, Saintenoy and Hopmans argued that DCF cannot be estimated directly because the maximum reflection is not related to the capillary fringe, but rather, to the inflection point of the transition curve [70]. It is worth noting that in the present study, we believe that transition zone reflections have no effect due to their relatively larger wavelength (i.e., low frequency) when compared to the transition zone thickness, as described by Bano [9].

3.4. Evaluation of Results

3.4.1. Calculation of εr

There are three soil layers in the experimental plot, as described in Section 2.2. The first layer occurs at 0–0.05 m soil depth (d1 = 0.05 m, εr1), the second layer between 0.05–0.35 m (d2 = 0.30 m, εr2), and the third from 0.35 m to the top of the capillary fringe (d3, εr3). The average εr from the surface to the top of the capillary fringe (εr−avg) can be obtained from Equation (1), because vrw is known from the CMP surveys. It is worth noting that CMP analysis might be suitable for layer velocity estimation as well; however, in the present study, the resolution was not sufficient to extract the layer velocities separately, due to low soil layer thickness. Instead, εr1 can be calculated using the GPR direct groundwave arrival time (Equation (3)), while εr2 can be calculated using soil moisture data (Equation (4)). Once εr−avg, εr1, and εr2 are known, εr3, which has the key contribution to the εr−avg, can be calculated.
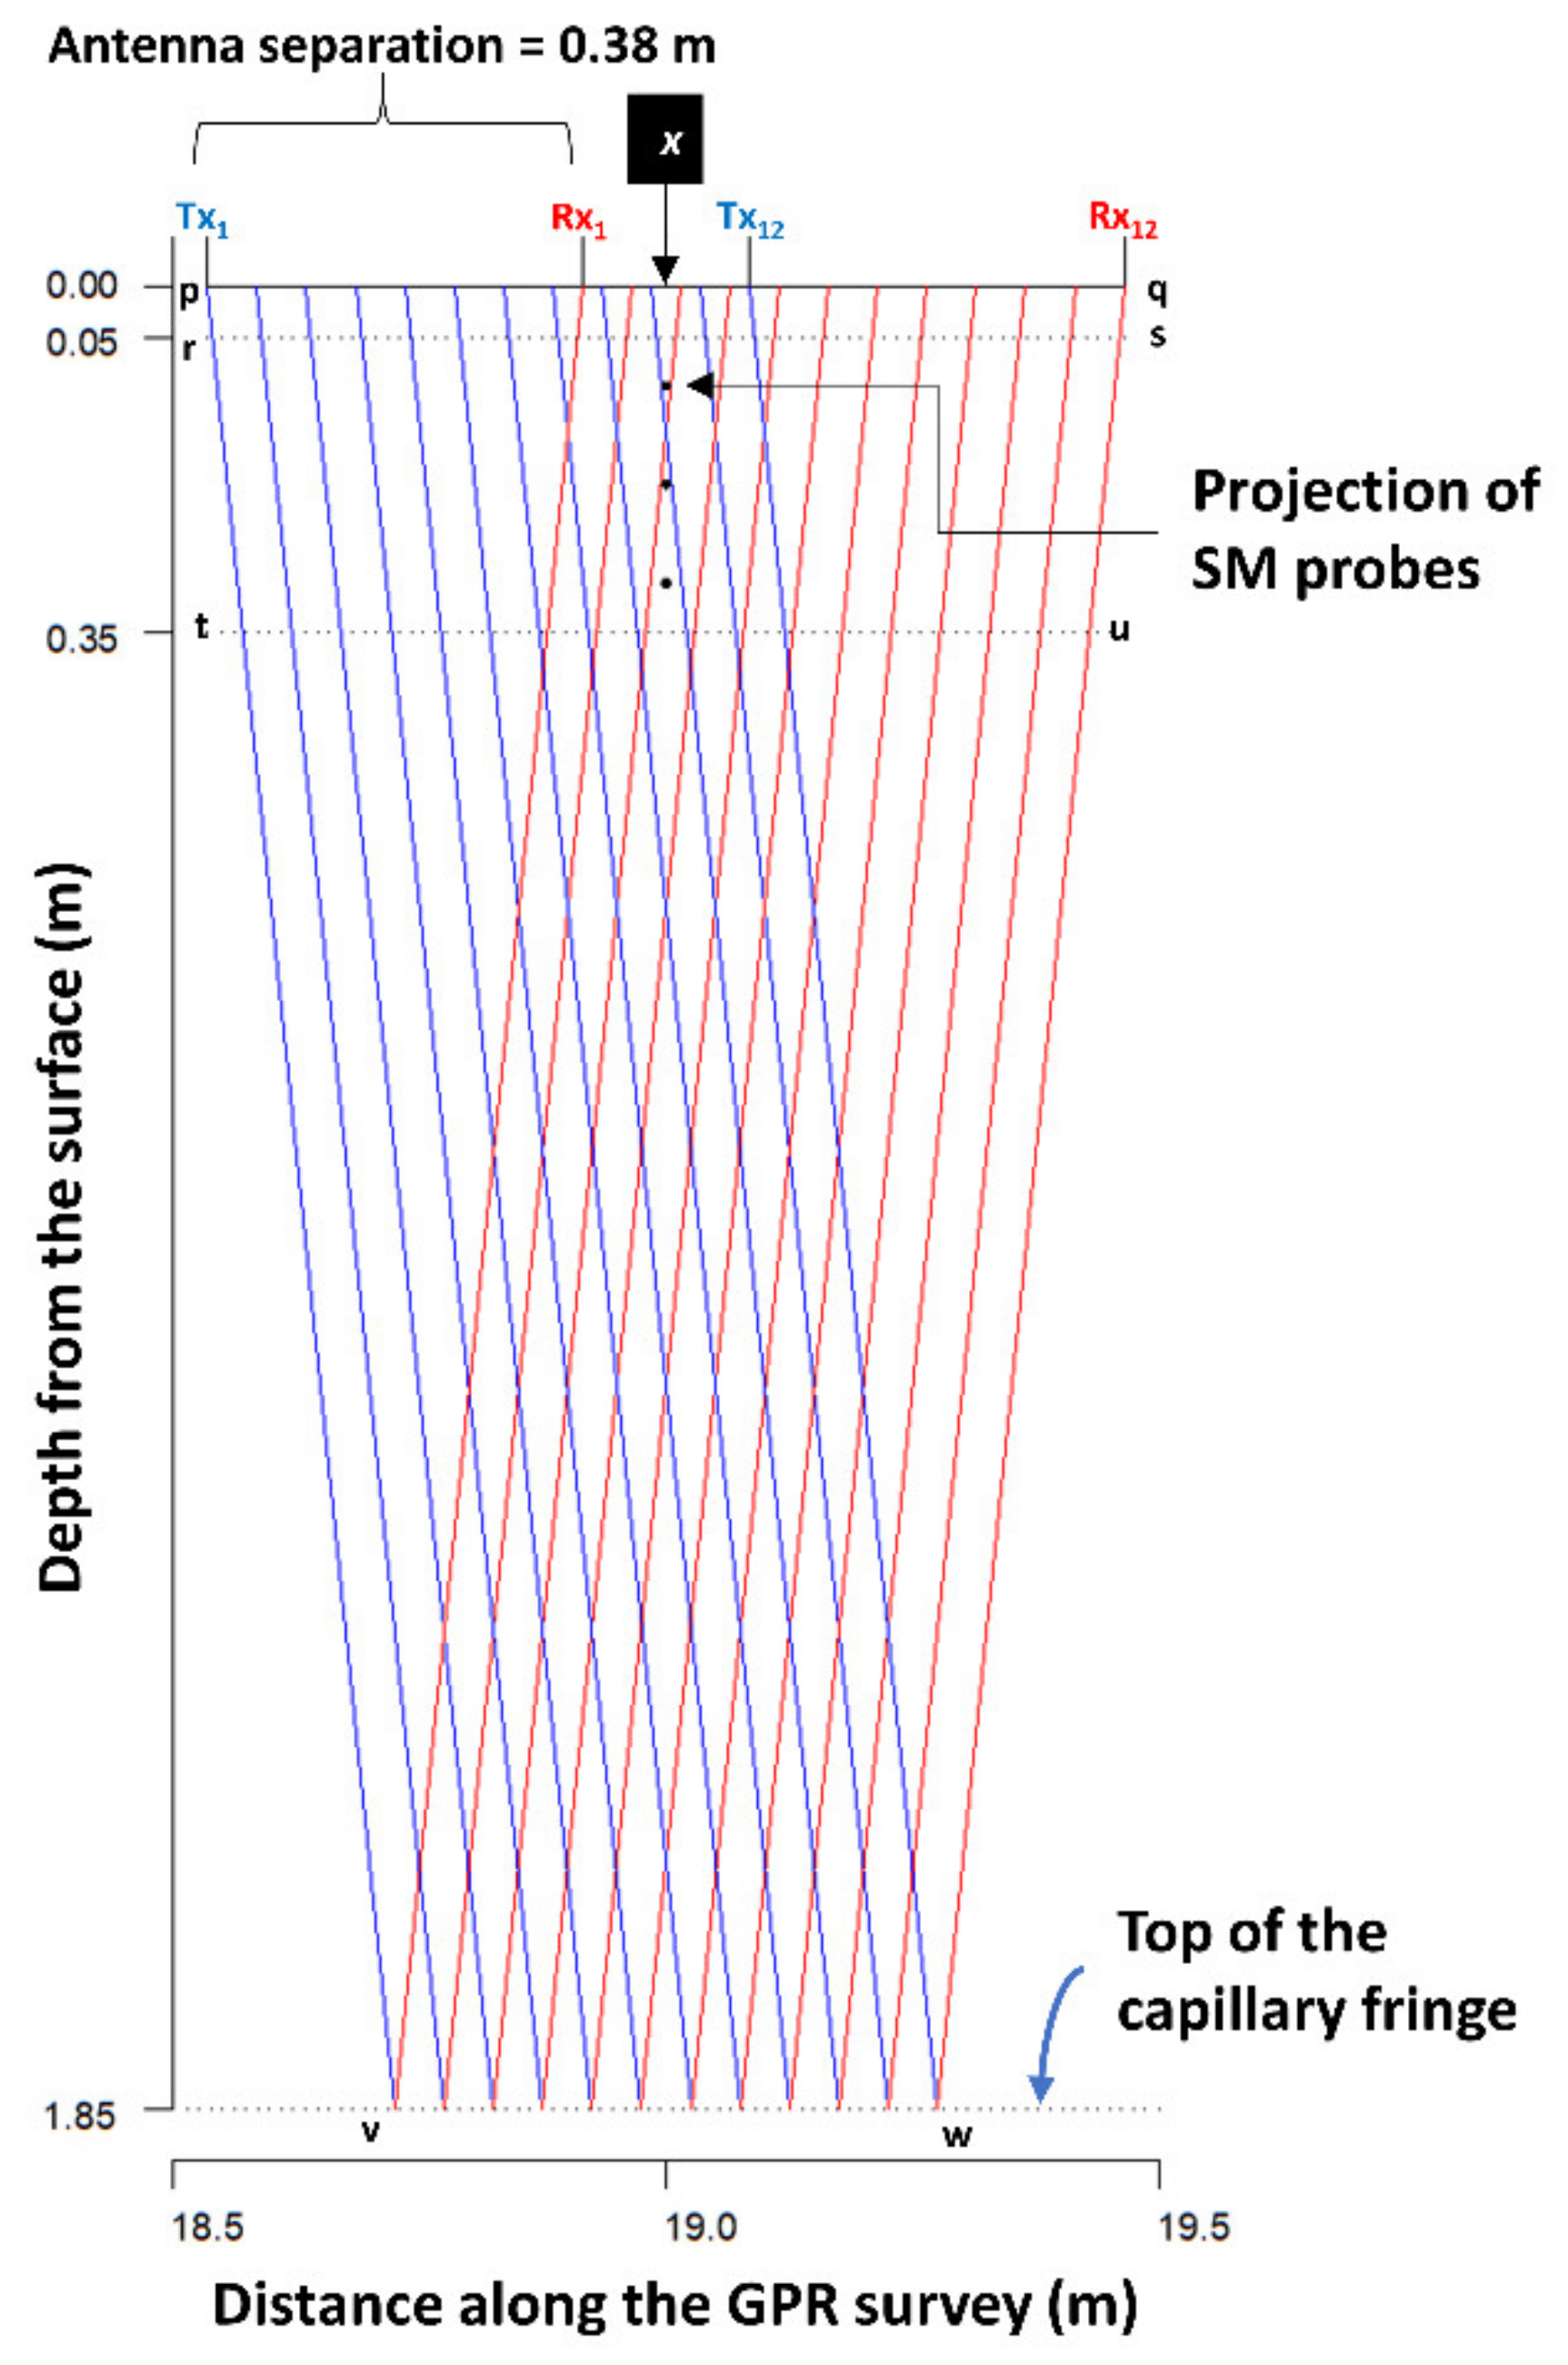
The calculated εr3 was compared with the literature and onsite weather data to evaluate the results of this study. The average WTDm in all GPR survey days (n = 16) was 2.55 m. When the average capillary height was approximated as 0.70 m (according to [69] and the present study), the average d3 was calculated as 1.50 m (2.55 − 0.70 − (0.05 + 0.30)). Figure 10 illustrates the overlapping of these three soil layers with the sampling volume geometry of the GPR CO survey, as suggested by Illawathure et al. [71]. Twelve GPR traces collected near the borehole and the soil moisture probes (i.e., the same as in the calculation of mean tCF) were considered for the illustration and calculations below.
The soil moisture data logging interval was 60 min. Therefore, each daily mean soil moisture data point had 24 replicated measurements. Each soil moisture probe had a cylindrical sampling volume (radius ~ 0.05 m, volume = 0.715 L) that covered 0.05 m soil heights, both above and below the respective probe (Figure 3b) [72,73]. Daily mean soil moisture values at three depths were converted to daily mean εr values using Equation (4); an average εr for the soil layer between 0.05–0.35 m (εr2) was obtained from those εr values.
If the weighted average of εr1, εr2, and εr3 was considered as εr−avg, the percentage sample area of each layer should be calculated with respect to the total GPR sample area (Figure 10 and Table 3). If w is the weight and x the data number, then the weighted average ( x ¯ ) equals:
x ¯ = i = 1 n w i × x i i = 1 n w i
e.g., estimation of the εr3 on 6/23/2017 (first data row in Table 4)
ε r avg = 3.4 % × ε r 1 + 19.5 % × ε r 2 + 77.1 % × ε r 3 100 % ε r 3 = ε r avg 0.034 ε r 1 + 0.195 ε r 2 0.771 ε r 3 = 10.9 0.034 × 23.0 + 0.195 × 10.5 0.771 ε r 3 = 10.5

3.4.2. Correlation Analysis

The results of the Pearson’s correlation test are shown in Figure 11. The dataset and the detailed correlation analysis are given in Appendix C (Table A3 and Figure A3, respectively). The present results reveal that most of the variables tested were not correlated with WTD (also see Figure A1). However, the WTD had strong negative correlations with εr−avg (r = −0.9041, p = 0.0001) and εr3 (r = −0.9019, p = 0.0001). Dry sand had lower εr than wet sand [74,75]. According to Equations (1) and (2), εr and WTD are inversely proportional, based on the fact that water table recharging makes unsaturated soil wetter, and water table discharging makes unsaturated soil drier [73]. It was also clear that εr−avg and εr3 were strongly positively correlated (r = 0.9961, p = 0.0000), as εr3 was dominant in the εr−avg calculation (Figure 10 and Table 3). WTD had negative (but moderate) correlations with P–E 11 through P–E 20, though the p-value of WTD vs. P–E 12 was slightly above the α-level (p = 0.0534). The highest correlation among P–E vs. WTD was for P–E 16 (r = −0.6285, p= 0.0286). This suggested that the WTD does not quickly respond to variables like daily P, daily E, or daily P–E, and that there is a long time-lag between WTD response and P–E timing (Figure A2). This could be due to high runoff, relatively thicker aquifer, etc. [76,77]. Since it is a sandy aquifer, low infiltration was not a factor in the long responsive time of the WTD to the P–E [78,79].
GW–EC or GW–Temp were not correlated with any of other variables tested. The Temp20 had a strong negative correlation with P–E 8, P–E 9, P–E 10, and P–E 11, with the maximum at P–E 10 (r = −0.8478, p = 0.0005). Further, Temp20 had moderate correlations with SM20 and SM30 as well. To support these observations, the collected TDR data were examined. First, the SM10, SM20, and SM30 variables had strong positive correlations with each other (r > 0.95, p = 0.00), since all three values mostly represented the same soil layer. Next, SM10 had no correlation with P, E, or P–E, while both SM20 and SM30 had no correlation with P, E, P–E, P–E 1, or P–E 2. The highest correlations between SM and cumulative P–E were as follows: between SM10 and P–E 6 (r = 0.7121, p = 0.0094), between SM20 and P–E 6 (r = 0.7486, p = 0.0051), and between SM30 and P–E 10 (r = 0.7920, p = 0.0021). From SM10 to SM30, the time lag of P–E increased, as did the strength of the correlation. These results imply that cumulative P–E affected the soil moisture as a function of depth and time. Cumulative P–E also significantly affected the soil temperature at 20 cm, but not the temperature of the groundwater. The same idea was reflected from the correlation analysis between εr and other variables as well [80,81].
εr1 had no correlation with any of the variables tested. It is worth noting that the depth of this first soil layer was only 5 cm. It is obvious that εr2 had a strong positive correlation with SM10, SM20, and SM30 (r > 0.98, p = 0.00), since εr2 was calculated from TDR data. Also, εr2 had a negative but moderate correlation with Temp20 (r = −0.6551, p = 0.0208). There are positive moderate correlations between εr2 and from P–E 3 to P–E 20. εr3 also had a negative but moderate correlation with Temp20 (r = −0.7226, p = 0.0079), and a moderate positive correlation with P–E 11 (r = 0.6516, p = 0.0217) and beyond, except P–E 12 and P–E 15. This was because part of the cumulative P–E infiltrates through the soil, increasing soil moisture and lowering soil temperature [81,82]. The soil moisture governs the dielectric properties of the soil; therefore, the correlation analysis suggested that the behavior of the estimated and calculated data was supported by the measured and onsite weather data.

4. Summary

In GPR, the Rx records different amplitudes of the receiving signals with respect to wave travel time. The GPR interpreter observes the reflected or direct radar waves at Rx in a radargram and obtains relevant TWTTs. Without knowing the vrw, it is impossible to derive DCF (e.g., using Equation (2)). Under these circumstances, there are two challenges to estimating the DCF in a GPR radargram: First, picking the TWTT of the capillary fringe reflection correctly; and second, knowing or properly assuming the average vrw from the surface down to the top of the capillary fringe reflection.
The procedures described in the literature were combined to overcome the challenges of picking the correct TWTT. The standard error of the mean tCF was > 1 except in 4 cases in 2017: 1.44 ns (28 July), 1.26 ns (7 November), 1.11 ns (15 September), and 1.02 ns (3 October). The standard deviation (SD) of the mean tCF was above 3 ns for those four survey days. The error associated with the surveys was mostly due to a high signal-to-noise ratio in the data acquisition. The lowest SDs of the mean tCF were 1.70 ns and 1.35 ns for 23 June 2017 and 29 June 2018, respectively. The inconsistency of the GPR reflection amplitude under wet conditions, as observed by Lunt et al. [21], could be a reason for the error of time picking observed in our data set.
The challenge of defining vrw during GPR data analysis is associated with determining the average εr of the material above the capillary fringe. εr controls the vrw and the reflection coefficients at the interfaces. The common vrw values suggested in the literature may not be accurate for heterogeneous soil profiles in highly variable field conditions under different agricultural practices. In addition, seasonal fluctuation of WTD and capillary height can significantly change the average εr. However, vrw can be measured by using multi-offset GPR survey methods such as CMP and WARR (wide-angle reflection and refraction), even though it is time- and labor- consuming to carry out multi-offset surveys in every field campaign [5,32]. In the present study, three different εr values were assumed for different soil layers above the capillary fringe. A weighted average method using CMP data, ground wave analysis, and TDR data based on the GPR sampling geometry was used to calculate εr of unsaturated soil layers in order to evaluate the velocity estimations.
These types approaches might help in addressing natural barriers of inherent soil properties and the effect of their variability on agriculture. Maintaining the required soil moisture in the root zone will lead to optimum crop yields, and implementing the best possible water management strategies will reduce groundwater pollution threats due to intensive agriculture. Nevertheless, the average capillary height considered (0.70 m) based on the study of Liu et al. [69] to estimate the εr3 is closer to the average capillary height obtained from this study (0.74 m). It should be mentioned that taking an average capillary height would be reasonable under static conditions, but this would not always be suitable if the seasonal fluctuation of WTD is significant during the study period.

Author Contributions

Conceptualization, C.I. and L.G.; methodology, C.I. and L.G.; software, C.I.; validation, C.I. and L.G.; formal analysis, C.I.; investigation, C.I. and L.G.; resources, L.G., M.C. and V.K.; data curation, C.I.; writing—original draft preparation, C.I.; writing—review and editing, C.I., M.C., V.K. and L.G.; visualization, C.I.; supervision, L.G. and M.C.; project administration, L.G.; funding acquisition, L.G. All authors have read and agreed to the published version of the manuscript.

Funding

This research was funded by the Research and Development Corporation of Newfoundland and Labrador through Ignite R&D program (5404-1962-101) and the Research Office of Grenfell Campus, Memorial University of Newfoundland through start-up fund (20160160).

Acknowledgments

Authors wish to acknowledge the Department of Fisheries and Land Resources (FLR) of the Government of Newfoundland and Labrador, NL for providing the field site and other field facilities to carry out this research. Special thanks to Adrian Unc for giving constructive comments for the initial draft. Teamwork, including the data collection support by Kamalesh Sadatcharam, Ivo Arrey, Emmanuel Badewa, and Dinushika Wanniarachchi, is highly acknowledged.

Conflicts of Interest

The authors declare no conflict of interest.

Abbreviations

BHBorehole
CMPCommon mid-point
COCommon offset
DCFDepth to the top of the capillary fringe
GPRGround Penetrating Radar
maxMaximum
minMinimum
nNumber of samples
NLNewfoundland
PBRSPynn’s Brook Research Station
rCorrelation coefficient
RxReceiver antenna
SMSoil moisture
TDRTime Domain Reflectometry
trwReflected wave travel time
TWTTTwo-way travel time of GPR waves
TxTransmitter antenna
vAverage radar velocity
vrwReflected wave velocity
WTDWater table depth
WTDmMeasured water table depth
WTDpPredicted water table depth
αAttenuation coefficient/ significance interval
εAbsolute permittivity
ε0Permittivity of a vacuum
εrRelative permittivity (dielectric constant)
θvVolumetric soil moisture content
σElectrical conductivity

Appendix A. Graphs of Measured Data

Figure A1. (a) Temporal variation of water table depth (WTD) and soil moisture (SM) at three depths measured near the borehole; (b) daily rainfall and daily average WTD fluctuation throughout the study period.
Water 12 01670 g0a1
Figure A2. Time lag for water table response to cumulative P-E (daily precipitation minus daily evapotranspiration; (a) one-day time lag, (b) 8-day time lag, and (c) 16-day time lag.
Water 12 01670 g0a2

Appendix B. Summary of Statistical Analysis

Comparing the Slopes of Regression Line and Prediction Line with 1:1 Line

To test whether the slopes for two independent populations are equal, the following null and alternative hypotheses were tested:
Hypothesis 0 (H0).
β1 = β2 i.e., β1β2 = 0
Hypothesis 1 (H1).
β1β2 i.e., β1β2 ≠ 0
The test statistic is
t = b 1 b 2 s b 1 2 + s b 2 2 ~ T n 1 + n 2 4
n = sample size; b1 and b2 are slopes,
s b = s y . x s x n 1
sy.x = standard error of predicted y for each x in the regression, sx = standard deviation.
If the null hypothesis is true, then
β 1 β 2 ~ N 0 , s b 1 b 2
where
s b 1 b 2 = s b 1 2 + s b 2 2
Table A1. Comparison of regression line and 1:1 line.
Regression1:1 Linesb1-b20.085
n1616t0.146
b1.0121.000df28
sy.x0.0860.000α0.050
sx0.2640.264p-value0.885
sb0.0850.000t-critical2.048
significantNo
Since t < t-critical and p-value > α, two slopes are not significantly different at α = 0.05.
Table A2. Comparison of prediction line and 1:1 line.
Regression1:1 Linesb1-b20.169
n88t3.536
b1.5971.000df12
sy.x0.0860.000α0.050
sx0.1710.171p-value0.004
sb0.1690.000t-critical2.179
significantYes
Since t > t-critical and p-value < α, two slopes are significantly different at α = 0.05.

Appendix C. Tables & Figures

Table A3. Dataset for correlation analysis.
DateWTDGW-Temp (°C) GW-EC (mS/cm) SM30 (m3/m3) SM20 (m3/m3)Temp 20 (°C)SM10 (m3/m3)Daily P (mm)Daily E (mm)
28 July 20172.747.40.2780.19720.144921.00.10290.32.3
18 August 20172.858.40.2810.21530.142417.50.09960.83.1
29 August 20172.898.80.2800.22940.139416.50.09930.03.7
15 September 20172.919.20.2900.28220.216214.00.13840.03.1
03 October 20172.779.40.2870.28080.23449.40.14070.02.3
07 November 20172.639.20.3010.29660.28038.00.166215.20.4
01 June 20182.244.70.2700.28900.246911.80.15010.03.9
20 July 20182.546.40.2590.22600.166820.80.11380.05.7
09 August 20182.658.80.2520.29230.260620.70.162713.73.6
07 September 20182.759.10.2660.29320.260516.10.15980.02.6
03 October 20182.549.60.2670.28500.25348.50.14800.01.0
31 October 20181.859.30.2640.29600.27566.80.15600.30.0
DateP-E 1P-E 2P-E 3P-E 4P-E 5P-E 6P-E 7P-E 8P-E 9P-E 10P-E 11P-E 12
28 July 2017−2.1−6.8−12.0−16.3−20.5−25.5−28.9−32.0−31.6−36.0−41.5−46.6
18 August 2017−2.4−4.1−5.4−10.0−13.6−8.7−5.9−10.7−15.5−19.3−22.7−6.0
29 August 2017−3.7−7.6−11.13.70.31.43.21.90.72.1−1.5−3.9
15 September 2017−3.1−5.88.124.223.121.018.419.827.024.921.625.1
03 October 2017−2.3−4.1−6.4−7.8−8.12.98.933.932.631.631.329.0
07 November 201714.922.220.929.730.629.427.827.827.126.227.331.3
01 June 2018−3.9−7.8−10.17.13.40.8−0.5−0.81.27.35.52.8
20 July 2018−5.7−9.1−10.5−14.7−14.7−14.7−14.7−14.7−14.7−14.7−14.7−14.7
09 August 201810.225.625.122.523.120.617.116.811.76.85.542.1
07 September 2018−2.6−2.6−2.6−2.6−2.6−2.6−2.6−2.6−2.6−5.2−8.3−11.7
03 October 2018−1.0−2.7−3.3−5.2−2.015.725.524.722.620.921.627.7
31 October 20180.2−0.323.742.041.541.048.951.951.250.979.089.3
DateP-E 13P-E 14P-E 15P-E 16P-E 17P-E 18P-E 19P-E 20εr−avgεr1εr2εr3
28 July 2017−51.8−56.9−62.3−67.9−71.2−75.5−80.9−83.96.5137.56.1
18 August 2017−9.2−13.8−18.0−22.4−24.2−8.4−12.1−-15.06.5117.86
29 August 2017−5.6−7.0−11.5−15.1−10.2−7.4−12.3−17.15.3208.14
15 September 201721.720.624.422.919.115.411.58.05.714114.2
03 October 201726.240.241.038.336.640.537.334.77.96.2127
07 November 201729.928.426.825.524.726.529.928.511.2131411
01 June 20185.82.60.10.3−0.62.7−0.5−3.113.3151214
20 July 2018−14.7−14.7−14.7−14.7−14.7−14.7−14.7−14.77208.66.3
09 August 201838.738.534.833.334.342.441.736.95.86.5134
07 September 2018−15.0−18.6−22.6−24.4−26.8−30.6−33.9−37.95.44134.1
03 October 201826.025.423.736.948.649.045.842.810.881211
31 October 201891.099.699.6114.3115.3116.7116.8116.916.5231317
Figure A3. Results of Pearson’s correlation analysis. The correlation coefficients (r) are shown in the lower triangle, and the corresponding p-values are shown in the upper triangle.
Water 12 01670 g0a3

References

  1. De Marsily, G. Quantitative Hydrology; Elsevier: New York, NY, USA, 1986; p. 440. [Google Scholar]
  2. Selker, J.S.; Keller, C.K.; McCord, J.T. An introduction to the vadose zone. In Vadose Zone Processes; CRC Press LLC: Boca Raton, FL, USA, 1999; pp. 3–20. [Google Scholar]
  3. Tindall, J.A.; Kunkel, J.R.; Anderson, D.E. Unsaturated water flow in soil. In Unsaturated Zone Hydrology for Scientists and Engineers, 1st ed.; McConnin, R.A., Ed.; Prentice-Hall, Inc.: Upper Saddle River, NJ, USA, 1999; pp. 183–199. [Google Scholar]
  4. Doolittle, J.A.; Jenkinson, B.; Hopkins, D.; Ulmer, M.; Tuttle, W. Hydropedological investigations with ground-penetrating radar (GPR): Estimating water-table depths and local ground-water flow pattern in areas of coarse-textured soils. Geoderma 2006, 131, 317–329. [Google Scholar] [CrossRef]
  5. Paz, C.; Alcalá, F.J.; Carvalho, J.M.; Ribeiro, L. Current uses of ground penetrating radar in groundwater-dependent ecosystems research. Sci. Total Environ. 2017, 595, 868–885. [Google Scholar] [CrossRef]
  6. Shih, S.; Doolittle, J.; Myhre, D.; Schellentrager, G. Using radar for groundwater investigation. J. Irrig. Drain. Eng. 1986, 112, 110–118. [Google Scholar] [CrossRef]
  7. Annan, A.R.; Cosway, S.W.; Redman, J.D. Water table detection with ground penetrating radar. In SEG Technical Program Expanded Abstracts; Society of Exploration Geophysicists: Tulsa, OK, USA, 1991; pp. 494–496. [Google Scholar]
  8. Loeffler, O.; Bano, M. GPR measurements in a controlled vadose zone: Influence of the water content. Vadose Zone J. 2004, 3, 1082–1092. [Google Scholar] [CrossRef]
  9. Bano, M. Effects of the transition zone above a water table on the reflection of GPR waves. Geophys. Res. Lett. 2006, 33. [Google Scholar] [CrossRef] [Green Version]
  10. Nakashima, Y.; Zhou, H.; Sato, M. Estimation of groundwater level by GPR in an area with multiple ambiguous reflections. J. Appl. Geophys. 2001, 47, 241–249. [Google Scholar] [CrossRef]
  11. Takeshita, Y.; Kobayashi, H.; Tao, K.; Kaihotsu, I. Measurement of groundwater behavior in sandy soils using surface ground penetrating radar. In Proceedings of the 10th International Conference Ground Penetrating Radar, Delft, The Netherlands, 21–24 June 2004; Slob, E., Yarovoy, A., Rhebergen, J.B., Eds.; IEEE: Piscataway, NJ, USA, 2004; pp. 517–520. [Google Scholar]
  12. Steelman, C.M.; Endres, A.L. Assessing vertical soil moisture dynamics using multi-frequency GPR common-midpoint soundings. J. Hydrol. 2012, 436–437, 51–66. [Google Scholar] [CrossRef]
  13. Bevan, M.J.; Endres, A.L.; Rudolph, D.L.; Parkin, G.W. The non-invasive characterization of pumping induced dewatering using ground penetrating radar. J. Hydrol. 2003, 281, 55–69. [Google Scholar] [CrossRef]
  14. Endres, A.L.; Clement, W.P.; Rudolph, D.L. Ground penetrating radar imaging of an aquifer during a pumping test. Ground Water 2000, 38, 566–576. [Google Scholar] [CrossRef]
  15. Tsoflias, G.P.; Halihan, T.; Sharp, J.M., Jr. Monitoring pumping test response in a fractured aquifer using ground-penetrating radar. Water Resour. Res. 2001, 37, 1221–1229. [Google Scholar] [CrossRef] [Green Version]
  16. Corbeanu, R.M.; McMechan, G.A.; Szerbiak, R.B.; Soegaard, K. Prediction of 3D fluid permeability and mudstone distributions from ground-penetrating radar (GPR) attributes: Example from the Cretaceous Ferron Sandstone member, east-central Utah. Geophysics 2002, 67, 1495–1504. [Google Scholar] [CrossRef]
  17. Conant, B., Jr.; Cherry, J.A.; Gillham, R.W. A PCE groundwater plume discharging to a river: Influence of the streambed and near-river zone on contaminant distributions. J. Contam. Hydrol. 2004, 73, 249–279. [Google Scholar] [CrossRef]
  18. Doetsch, J.; Linde, N.; Pessognelli, M.; Green, A.G.; Günther, T. Constraining 3-D electrical resistance tomography with GPR reflection data for improved aquifer characterization. J. Appl. Geophys. 2012, 78, 68–76. [Google Scholar] [CrossRef]
  19. Gish, T.; Dulaney, W.; Kung, K.; Daughtry, C. Evaluating use of ground-penetrating radar for identifying subsurface flow pathways. Soil Sci. Soc. Am. J. 2002, 66, 1620–1629. [Google Scholar] [CrossRef] [Green Version]
  20. Lambot, S.; Slob, E.; Chavarro, D.; Lubczynski, M.; Vereecken, H. Measuring soil surface water content in irrigated areas of southern Tunisia using full-waveform inversion of proximal GPR data. Near Surf. Geophys. 2008, 6, 403–410. [Google Scholar] [CrossRef]
  21. Lunt, I.A.; Hubbard, S.S.; Rubin, Y. Soil moisture content estimation using ground penetrating radar reflection data. J. Hydrol. 2005, 307, 254–269. [Google Scholar] [CrossRef]
  22. McClymont, A.F.; Hayashi, M.; Bentley, L.R.; Liard, J. Locating and characterizing groundwater storage areas within an alpine watershed using time-lapse gravity, GPR and seismic refraction methods. Hydrol. Process. 2012, 26, 1792–1804. [Google Scholar] [CrossRef]
  23. Oliver, T.S.N.; Woodroffe, C.D. Chronology, Morphology and GPR-imaged Internal Structure of the Callala Beach Prograded Barrier in Southeastern Australia. J. Coast. Res. 2016, 75, 318–322. [Google Scholar] [CrossRef]
  24. Schmelzbach, C.; Tronicke, J.; Dietrich, P. Three-dimensional hydrostratigraphic models from ground-penetrating radar and direct-push data. J. Hydrol. 2011, 398, 235–245. [Google Scholar] [CrossRef]
  25. Schmelzbach, C.; Tronicke, J.; Dietrich, P. High-resolution water content estimation from surface-based ground-penetrating radar reflection data by impedance inversion. Water Resour. Res. 2012, 48, 1–16. [Google Scholar] [CrossRef]
  26. Słowik, M. Analysis of fluvial, lacustrine and anthropogenic landforms by means of ground-penetrating radar (GPR): Field experiment. Near Surf. Geophys. 2014, 12, 777–791. [Google Scholar] [CrossRef]
  27. Talley, J.; Baker, G.S.; Becker, M.W.; Beyrle, N. Four-dimensional mapping of tracer channelization in sub horizontal bedrock fractures using surface ground penetrating radar. Geophys. Res. Lett. 2005, 32, 1–4. [Google Scholar] [CrossRef] [Green Version]
  28. Tsoflias, G.P.; Becker, M.W. Ground-penetrating-radar response to fracture-fluid salinity: Why lower frequencies are favorable for resolving salinity changes. Geophysics 2008, 73, J25–J30. [Google Scholar] [CrossRef] [Green Version]
  29. Yang, X.; Klotzsche, A.; Meles, G.; Vereecken, H.; van der Kruk, J. Improvements in crosshole GPR full-waveform inversion and application on data measured at the Boise Hydrogeophysics Research Site. J. Appl. Geophys. 2013, 99, 114–124. [Google Scholar] [CrossRef]
  30. Van Overmeeren, R.A. Radar facies of unconsolidated sediments in The Netherlands: A radar stratigraphic interpretation method for hydrogeology. J. Appl. Geophys. 1998, 40, 1–18. [Google Scholar] [CrossRef]
  31. Davis, J.L.; Annan, A.P. Ground-penetrating radar for high-resolution mapping of soil and rock stratigraphy. Geophys. Process. 1989, 37, 531–551. [Google Scholar] [CrossRef]
  32. Huisman, J.; Hubbard, S.S.; Redman, J.D.; Annan, A.P. Measuring soil water content with ground penetrating radar: A review. Vadose Zone J. 2003, 2, 476–491. [Google Scholar] [CrossRef]
  33. Annan, A.P. GPR methods for hydrogeological studies. In Hydrogeophysics; Rubin, Y., Hubbard, S., Eds.; Springer: New York, NY, USA, 2005; pp. 185–213. [Google Scholar]
  34. Daniels, D.J. Ground Penetrating Radar, 2nd ed.; The Institute of Electrical Engineers: London, UK, 2004. [Google Scholar]
  35. Strobach, E.; Harris, B.D.; Dupuis, J.C.; Kepic, A.W.; Martin, M.W. GPR for large-scale estimation of groundwater recharge distribution. In Proceedings of the 13th International Conference on Ground Penetrating Radar, Lecce, Italy, 21–25 June 2010; pp. 1–6. [Google Scholar] [CrossRef]
  36. Agliata, R.; Bogaard, T.A.; Greco, R.; Mollo, L.; Slob, E.C.; Steele-Dunne, S. Non-invasive estimation of moisture content in tuff bricks by GPR. Constr. Build. Mater. 2018, 160, 698–706. [Google Scholar] [CrossRef] [Green Version]
  37. Algeo, J.; Van Dam, R.L.; Slater, L. Early-Time GPR: A method to monitor spatial variations in soil water content during irrigation in clay soils. Vadose Zone J. 2016, 15. [Google Scholar] [CrossRef] [Green Version]
  38. Galagedara, L.W. The GPR Direct Ground Wave Method for Soil Moisture Content Estimation: Field Experiments and Modeling. PhD Thesis, University of Guelph, Guelph, ON, Canada, 2003. [Google Scholar]
  39. Galagedara, L.W.; Parkin, G.W.; Redman, J.D. An analysis of the ground-penetrating radar direct ground wave method for soil water content measurement. Hydrol. Process. 2003, 17, 3615–3628. [Google Scholar] [CrossRef]
  40. Galagedara, L.W.; Parkin, G.W.; Redman, J.D.; Von Bertoldi, P.; Endres, A.L. Field studies of the GPR ground wave method for estimating soil water content during irrigation and drainage. J. Hydrol. 2005, 301, 182–197. [Google Scholar] [CrossRef]
  41. Steelman, C.M.; Endres, A.L. Comparison of petrophysical relationships for soil moisture estimation using GPR ground waves. Vadose Zone J. 2011, 10, 270–285. [Google Scholar] [CrossRef]
  42. Kowalczyk, S.; Lejzerowicz, A.; Kowalczyk, B. Groundwater table level changes based on ground penetrating radar images: A case study. In Proceedings of the 17th International Conference on Ground Penetrating Radar, Rapperswil, Switzerland, 18–21 June 2018; pp. 1–4. [Google Scholar] [CrossRef]
  43. Greaves, R.J.; Lesmes, D.P.; Lee, J.M.; Toksoz, M.N. Velocity variations and water content estimated from multi-offset, ground-penetrating radar. Geophysics 1996, 61, 683–695. [Google Scholar] [CrossRef]
  44. Gueting, N.; Klotzsche, A.; Kruk, J.V.D.; Vanderborght, J.; Vereecken, H.; Englert, A. Imaging and characterization of facies heterogeneity in an alluvial aquifer using GPR full-waveform inversion and cone penetration tests. J. Hydrol. 2015, 524, 680–695. [Google Scholar] [CrossRef]
  45. Khalil, M.A.; Hafez, M.A.; Monteiro Santos, F.; Ramalho, E.C.; Mesbah, H.S.A.; El-Qady, G.M. An approach to estimate porosity and groundwater salinity by combined application of GPR and VES: A case study in the Nubian sandstone aquifer. Near Surf. Geophys. 2010, 8, 223–233. [Google Scholar] [CrossRef]
  46. Mahmoudzadeh, M.R.; Francés, A.P.; Lubczynski, M.; Lambot, S. Using ground-penetrating radar to investigate the water table depth in weathered granites—Sardon case study, Spain. J. Appl. Geophys. 2012, 79, 17–26. [Google Scholar] [CrossRef]
  47. Mahmoudzadeh, M.R.; Lambot, S.; Frances, A.P.; Mohammed, A.A.; Lubczynski, M. Water table detection by GPR in Sardon, Salamanca, Spain. In Proceedings of the 13th International Conference on Ground Penetrating Radar, Lecce, Italy, 21–25 June 2010. [Google Scholar] [CrossRef]
  48. Seger, M.A.; Nashait, A.F. Detection of water table by using Ground Penetration Radar (GPR). J. Eng. Technol. 2011, 29, 554–566. [Google Scholar]
  49. Beres, M.; Haeni, F.P. Application of ground penetrating radar methods in hydrogeologic studies. Ground Water 1991, 29, 375–386. [Google Scholar] [CrossRef]
  50. Johnson, D.G. Use of ground-penetrating radar for water table mapping, Brewster and Harwich, Massachusetts. In Water Resources Investigations Report 90-4086; U.S. Geological Survey: Marlborough, MA, USA, 1992. [Google Scholar]
  51. Livari, T.A.; Doolittle, J.A. Computer simulations of depths to water table using ground-penetrating radar in topographically diverse terrains. In Groundwater Quality Management; Kovar, K., Soveri, J., Eds.; Publication No. 220; IAHS: Wallingford, UK, 1994; pp. 11–20. [Google Scholar]
  52. Van Overmeeren, R.A. Georadar for hydrogeology. First Break 1994, 12, 401–408. [Google Scholar] [CrossRef]
  53. Daniels, J.J.; Allred, B.; Binley, A.; Labrecque, D.; Alumbaugh, D. Hydrogeophysical case studies in the vadose zone. In Hydrogeophysics; Rubin, Y., Hubbard, S.S., Eds.; Springer: Basel, Switzerland, 2005; pp. 413–440. [Google Scholar]
  54. Bear, J. Dynamics of Fluids in Porous Media; Elsevier: New York, NY, USA, 1972; p. 764. [Google Scholar]
  55. Bentley, L.; Trenholm, N. The accuracy of water table elevation estimates determined from ground penetrating radar data. J. Environ. Eng. Geophys. 2002, 7, 37–53. [Google Scholar] [CrossRef] [Green Version]
  56. Igel, J.; Stadler, S.; Günther, T. High-resolution investigation of the capillary transition zone and its influence on GPR signatures. In Proceedings of the16th International Conference on Ground Penetrating Radar (GPR), Hong Kong, China, 13–16 June 2016; pp. 1–5. [Google Scholar] [CrossRef]
  57. Rejiba, F.; Bobée, C.; Maugis, P.; Camerlynck, C. GPR imaging of a sand dune aquifer: A case study in the niayes ecoregion of tanma, Senegal. J. Appl. Geophys. 2012, 81, 16–20. [Google Scholar] [CrossRef]
  58. Booth, A.; Clark, R.; Murray, T. Semblance response to a ground penetrating radar wavelet and resulting errors in velocity analysis. Near Surf. Geophys. 2010, 8, 235–246. [Google Scholar] [CrossRef]
  59. Neal, A. Ground penetrating radar and its use in sedimentology: Principles, problems and progress. Earth Sci. Rev. 2004, 66, 261–330. [Google Scholar] [CrossRef]
  60. Topp, G.C.; Davis, J.L.; Annan, A.P. Electromagnetic determination of soil water content: Measurements in coaxial transmission lines. Water Resour. Res. 1980, 16, 574–582. [Google Scholar] [CrossRef] [Green Version]
  61. Mukhlisin, M.; Saputra, A. Performance evaluation of volumetric water content and relative permittivity models. Sci. World J. 2013, 2013, 421762. [Google Scholar] [CrossRef]
  62. Kirby, G.E. Soils of the Pasadena-Deer Lake Area, Newfoundland. 1988. Available online: http://sis.agr.gc.ca/cansis/publications/surveys/nf/nf17/nf17_report.pdf (accessed on 5 March 2018).
  63. Badewa, E.; Unc, A.; Mumtaz, C.; Kavanagh, V.; Galagedara, L. Soil moisture mapping using multi-frequency and multi-coil electromagnetic induction sensors on managed podzols. Agronomy 2018, 8, 224. [Google Scholar] [CrossRef] [Green Version]
  64. Government of Canada Website. Available online: https://weather.gc.ca (accessed on 17 February 2019).
  65. Grote, K.; Hubbard, S.; Rubin, Y. Field-scale estimation of volumetric water content using ground-penetrating radar ground wave techniques. Water Resour. Res. 2003, 39, 1321. [Google Scholar] [CrossRef] [Green Version]
  66. Byrne, M.P.; O’Gorman, P.A. The response of precipitation minus evapotranspiration to climate warming: Why the “Wet-Get-Wetter, Dry-Get-Drier” scaling does not hold over land. Am. Meteorol. Soc. 2015, 28, 8078–8092. [Google Scholar] [CrossRef]
  67. Reppert, P.; Morgan, F.; Toksoz, M. Dielectric constant determination using ground-penetrating radar reflection coefficients. J. Appl. Geophys. 2000, 43, 189–197. [Google Scholar] [CrossRef]
  68. Salim, R.L. Extent of Capillary Rise in Sands and Silts. Master’s Thesis, Western Michigan University, Kalamazoo, MI, USA, 2016. Available online: https://scholarworks.wmich.edu/masters_theses/688 (accessed on 20 February 2018).
  69. Liu, Q.; Yasufuku, N.; Miao, J.; Ren, J. An approach for quick estimation of maximum height of capillary rise. Soil Found. 2014, 54, 1241–1245. [Google Scholar] [CrossRef] [Green Version]
  70. Saintenoy, A.; Hopmans, J.W. Ground penetrating radar: Water table detection sensitivity to soil water retention properties. IEEE J. Sel. Top. Appl. Earth Obs. Remote Sens. 2011, 4, 748–753. [Google Scholar] [CrossRef] [Green Version]
  71. Illawathure, C.; Parkin, G.; Lambot, S.; Galagedara, L. Evaluating soil moisture estimation from ground-penetrating radar hyperbola fitting with respect to a systematic time-domain reflectometry data collection in a boreal podzolic agricultural field. Hydrol. Process. 2020, 34, 1428–1445. [Google Scholar] [CrossRef]
  72. Sakaki, T.; Limsuwat, A.; Smits, K.M.; Illangasekare, T.H. Empirical two-point α-mixing model for calibrating the ECH2O EC-5 soil moisture sensor in sands. Water Resour. Res. 2008, 44. [Google Scholar] [CrossRef]
  73. Meter Group Company Website. Available online: www.metergroup.com (accessed on 10 January 2019).
  74. Cihlar, J.; Ulaby, F.T. Dielectric Properties of Soils as a Function of Moisture Content; Technical Report, Document ID 19750018483; NASA: Washington, DC, USA, 1974. Available online: https://ntrs.nasa.gov (accessed on 18 February 2018).
  75. Reynolds, J.M. An Introduction to Applied and Environmental Geophysics, 2nd ed.; John Wiley & Sons Ltd.: West Sussex, UK, 1997; pp. 565–586. [Google Scholar]
  76. Miles, O.W.; Novakowski, K.S. Large water-table response to rainfall in a shallow bedrock aquifer having minimal overburden cover. J. Hydrol. 2016, 541, 1316–1328. [Google Scholar] [CrossRef]
  77. Molina-Sánchez, L.; Sánchez-Martos, F.; Daniele, L.; Vallejos, A.; Pulido-Bosch, A. Interaction of aquifer-wetland in a zone of intensive agriculture: The case of campo de Dalías (Almería, SE Spain). Environ. Earth Sci. 2015, 73, 2869–2880. [Google Scholar] [CrossRef]
  78. Klenk, P.; Keicher, V.; Jaumann, S.; Roth, K. Current limits for high precision GPR measurements. In Proceedings of the 15th International Conference on Ground Penetrating Radar, Belgium, Brussels, 30 June–4 July 2014. [Google Scholar] [CrossRef]
  79. Mohammad, H.M. Integrating gpr and geostatistical techniques to map the spatial extent of a shallow groundwater system. J. Geophys. Eng. 2004, 1, 56–62. [Google Scholar] [CrossRef]
  80. Pyke, K.; Eyuboglu, S.; Daniels, J.; Vendl, M. A controlled experiment to determine the water table response using ground penetrating radar. J. Environ. Eng. Geophys. 2008, 13, 335–342. [Google Scholar] [CrossRef]
  81. Zurek, A.J.; Witczak, S.; Dulinski, M.; Wachniew, P.; Rozanski, K.; Kania, J.; Postawa, A.; Karczewski, J.; Moscicki, W.J. Quantification of anthropogenic impact on groundwater-dependent terrestrial ecosystem using geochemical and isotope tools combined with 3-D flow and transport modelling. Hydrol. Earth Syst. Sci. 2015, 19, 1015–1033. [Google Scholar] [CrossRef] [Green Version]
  82. Slowik, M. GPR and aerial imageries to identify the recent historical course of the Obra River and changes of spatial extent of Obrzańskie Lake, altered by hydro-technical works. Environ. Earth Sci. 2013, 70, 1277–1295. [Google Scholar] [CrossRef] [Green Version]
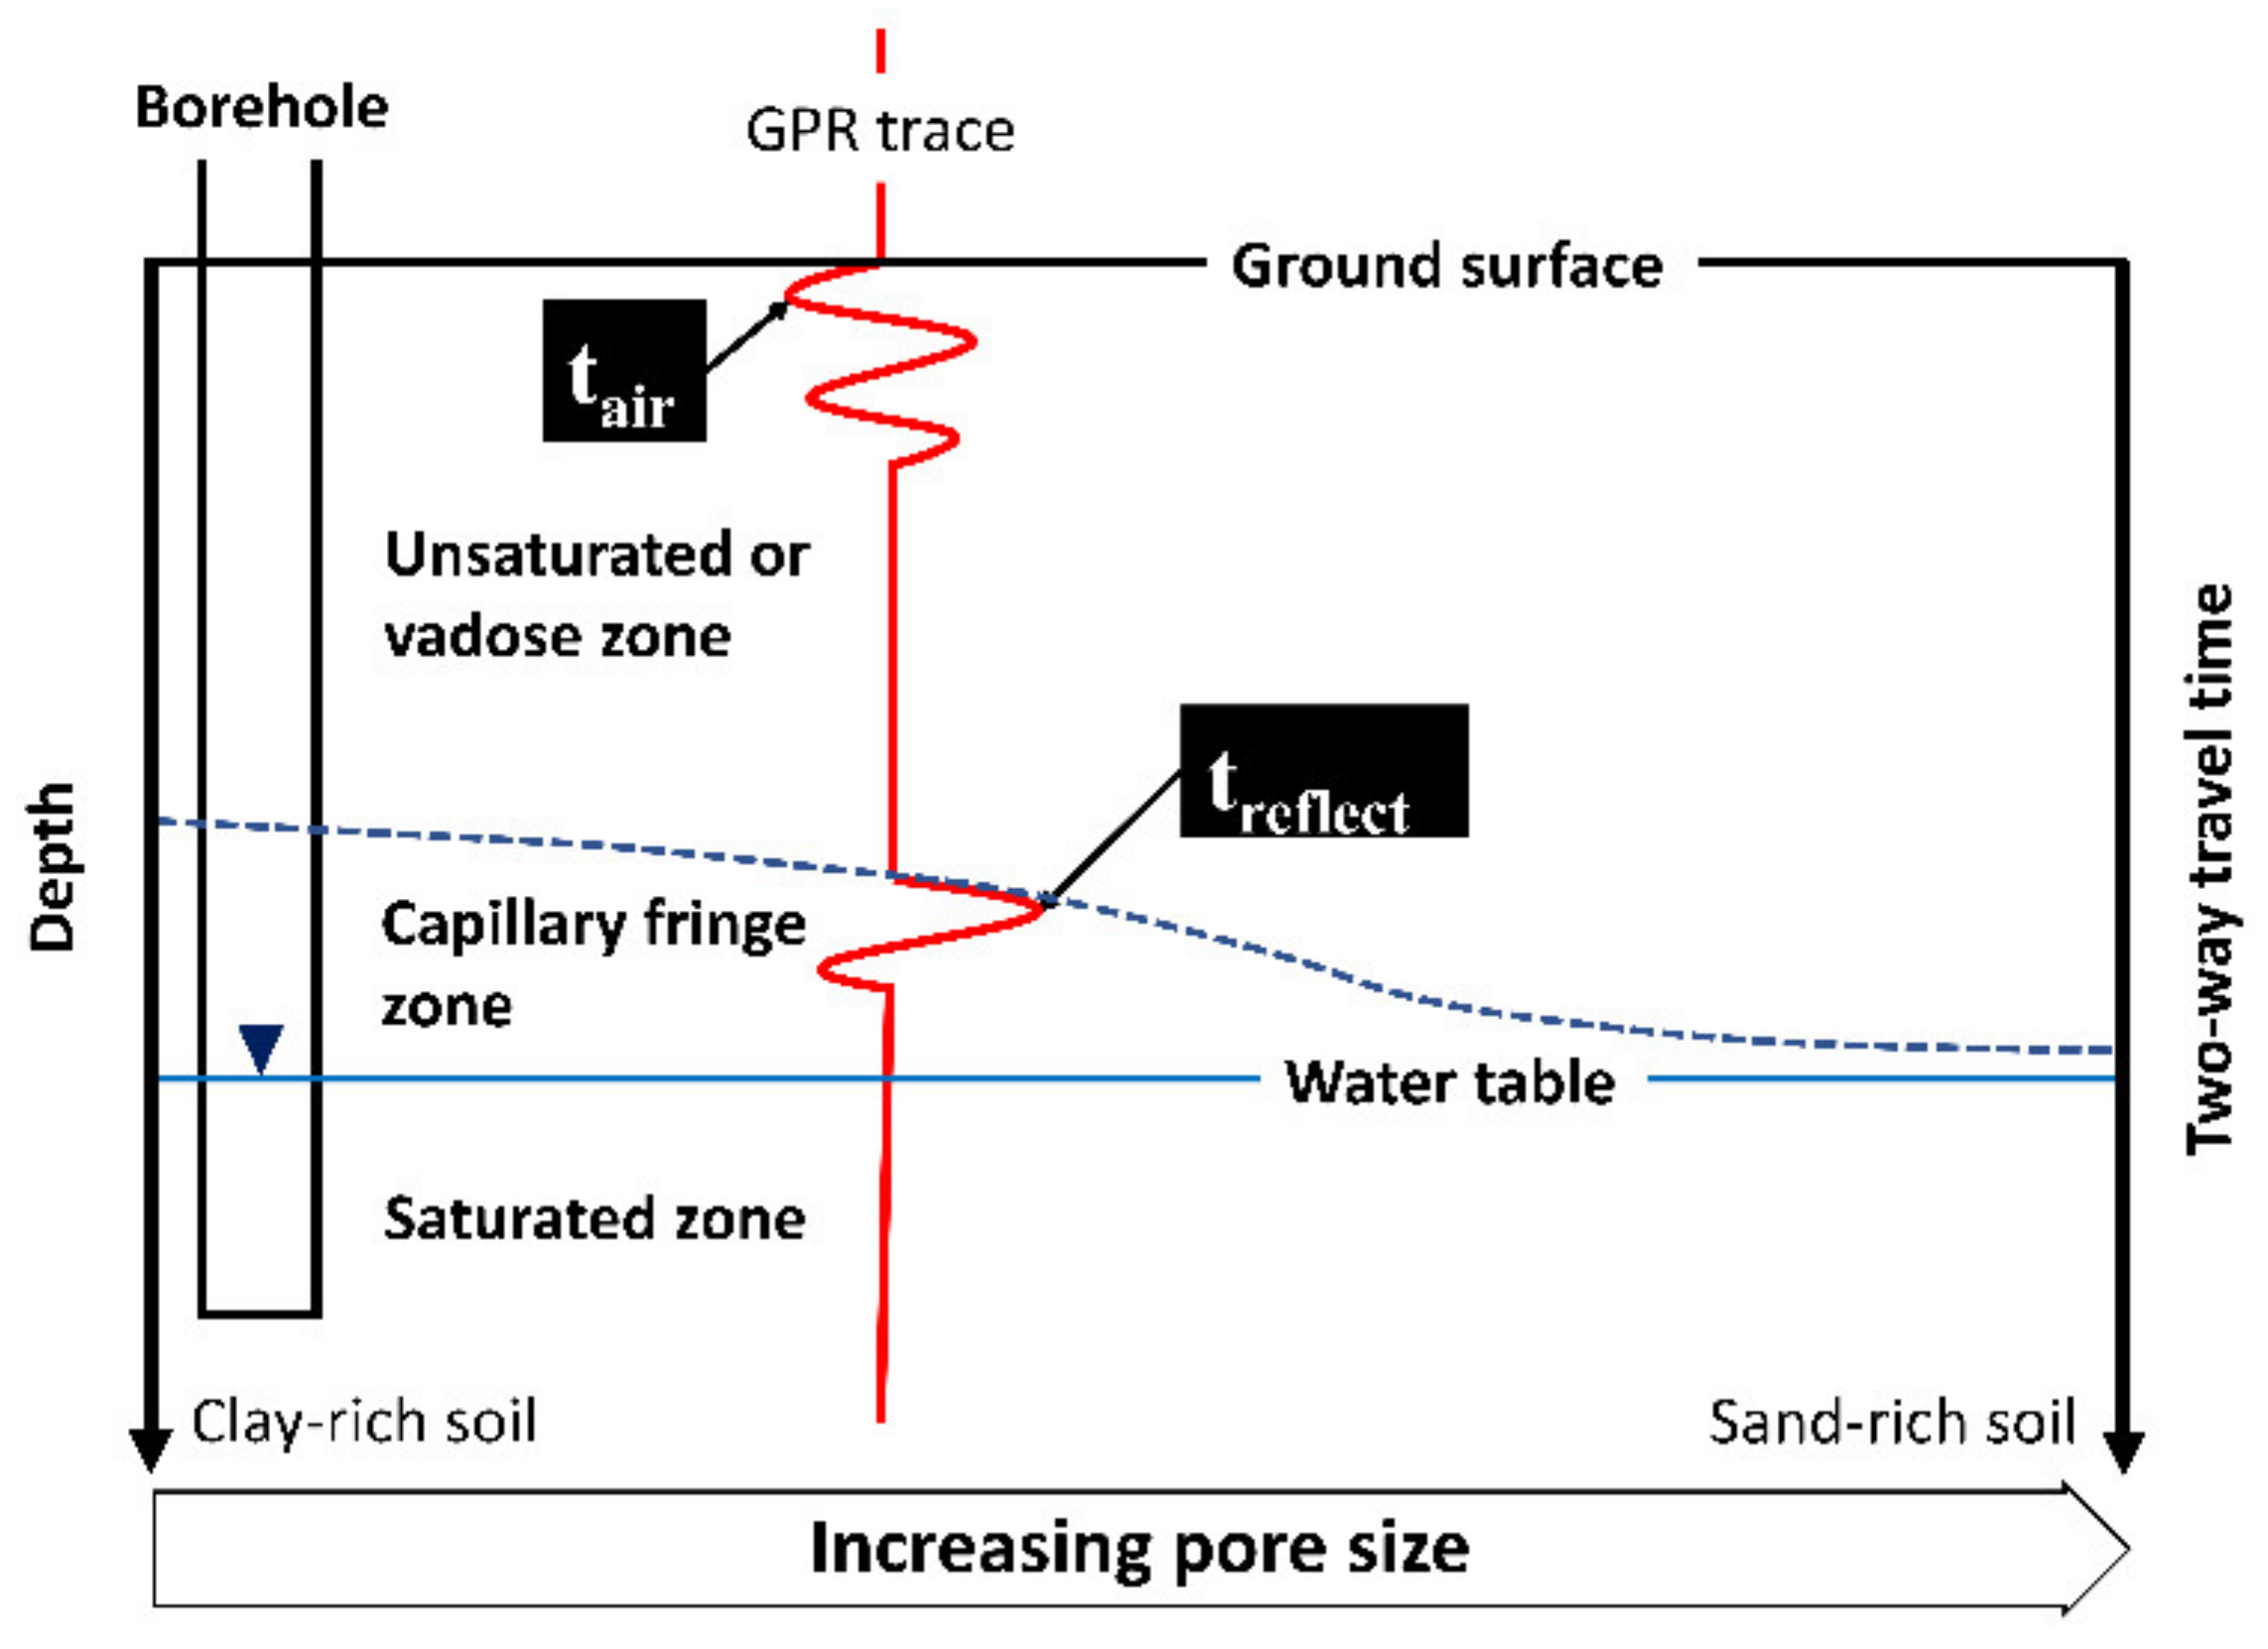
Figure 1. Schematic diagram showing the uncertainty of the water table depth (WTD) estimation using ground penetrating radar (GPR) due to effect of capillary rise under variable pore sizes (modified from Paz et al. [5]).
Water 12 01670 g001
Figure 2. (a) Photograph captured during a 100 MHz survey at the starting point of the ground penetrating radar (GPR) survey line. (b) Plan view of the borehole (BH) location with GPR survey line and the location of soil moisture (SM) probes. A–A1 cross section is illustrated in Figure 3. The intersection of the A–A1 section and GPR survey line is marked as “x”.
Water 12 01670 g002
Figure 3. (a) A–A1 vertical cross-sectional view of the soil profile and the details of the borehole (BH). (b) The sampling areas of soil moisture (SM) probes. “x” marks the position of the ground penetrating radar (GPR) survey line.
Water 12 01670 g003
Figure 4. Two-way travel time (TWTT) picks of the maximum amplitude of the reflection (treflect), after time-correction (tCF), and the mean tCF. Ground penetrating radar (GPR) estimated (250 MHz) depth to the capillary fringe (DCF) and the measured water table depth (WTDm) at the borehole (BH): (a) under wet soil moisture conditions on 23 June, (b) under median soil moisture conditions on 3 October and (c) under dry soil moisture conditions on 29 August in the growing season of 2017.
Water 12 01670 g004
Figure 5. Comparison of (a) 100 MHz, and (b) 250 MHz ground penetrating radar (GPR) radargrams. Two-way travel time (TWTT) picks after time-correction, tCF, and the mean tCF are shown with measured water table depth (WTDm) at the borehole (BH): (above) under wet soil moisture conditions on 1 June, (middle) under median soil moisture conditions on 20 July, and (below) under dry soil moisture conditions on 9 August in the growing season of 2018.
Water 12 01670 g005
Figure 6. Semblance analysis for velocity estimation of common midpoint (CMP) data on (a) 23 June 2017 (vrw = 0.091 m/ns) and (b) 31 October 2018 (vrw = 0.074 m/ns).
Water 12 01670 g006
Figure 7. (a) Linear regression plot of measured water table depth (WTDm) vs. ground penetrating radar (GPR) estimated depth to the capillary fringe (DCF) for 2017 data (n = 8). (b) The 1:1 plot of the predicted water table depth (WTDp) vs. WTDm in 2018 (n = 8).
Water 12 01670 g007
Figure 8. Temporal variability of the measured water table depth (WTDm) and the estimated depth to the capillary fringe (DCF) using ground penetrating radar (GPR) for both years, and the predicted water table depth (WTDp) for 2018.
Water 12 01670 g008
Figure 9. Comparison of the measured water table depth (WTDm) and the estimated depth to the capillary fringe (DCF) based on ground penetrating radar (GPR) data for all 16 GPR surveys. 1:1 line indicates the measured and GPR-based water table depth.
Water 12 01670 g009
Figure 10. Ground penetrating radar (GPR) wave paths related to twelve GPR traces at the intersection of the GPR survey line and the A–A1 plane. A 250 MHz CO survey with 0.38 m antenna separation and 0.05 m sampling interval was considered. Tx1 and Tx12 = transmitter positions, Rx1 and Rx12 = receiver positions, corresponding to first and twelfth trace. x = intersection of A–A1 plane (refer to Figure 2b). Note that GPR wave paths are assumed to be straight.
Water 12 01670 g010
Figure 11. Pearson’s correlation coefficient (r) of 33 variables tested (p > 0.05 are crossed).
Water 12 01670 g011
Table 1. Details of different soil layers.
Soil LayerDepth Range (m)Layer Thickness (m)Relative Permittivity
Topsoil0–0.05d1 = 0.05εr1
Loamy sand0.05–0.35d2 = 0.30εr2
Sand (unsaturated)0.35—top of the capillary fringed3 = WTDm 1 − CF 2 − 0.35εr3
1 Measured water table depth; 2 Height of the capillary fringe.
Table 2. Ground penetrating radar (GPR) estimated depth to the top of the capillary fringe (DCF) which is derived from the mean two-way travel time (TWTT) to the capillary fringe reflection (tCF) and common mid point (CMP) derived radar wave velocity (vrw) using Equation (2) for all GPR surveys. Standard error (SE) of mean, and minimum (Min), median, and maximum (Max) of tCF time picks are also given.
DatetCF (ns)CMP Derived vrw (m/ns)DCF (m) (= vrw × tCF/2)
MinMedianMaxMeanSE
23 June 201732.6535.0838.0435.07 ± 1.700.430.0911.60
6 July 201727.9728.5134.8029.21 ± 1.930.580.1121.64
28 July 201727.7128.8239.7832.40 ± 5.391.440.1171.90
18 August 201732.1137.8139.6736.43 ± 2.870.700.1172.13
29 August 201730.2132.2939.1633.59 ± 2.900.700.1302.18
15 September 201727.7035.2338.8334.31 ± 3.861.110.1252.14
3 October 201732.8036.2642.1536.84 ± 3.691.020.1071.97
7 November 201733.0939.4544.3640.23 ± 4.531.260.0901.81
1 June 201835.6439.3540.5938.08 ± 2.060.470.0821.56
20 June 201830.1831.3840.5433.35 ± 3.820.830.1001.67
29 June 201830.0730.7334.4031.18 ± 1.350.330.1031.61
20 July 201828.0735.2037.5632.89 ± 3.330.770.1131.86
9 August 201828.1528.8032.6930.25 ± 2.010.440.1251.89
7 September 201827.7829.2936.4730.05 ± 2.670.670.1291.94
2 October 201834.3335.4241.3136.93 ± 2.650.610.0911.68
31 October 201827.9331.2735.5631.64 ± 2.780.610.0741.17
Table 3. Percentage sample area of each soil layer out of the total ground penetrating radar (GPR) sample area related to twelve GPR traces collected from the top of the soil moisture probes on the vertical plane of the GPR survey (refer to Figure 10).
Soil LayerPolygon
(Refer to Figure 9)
Area (m2)Percentage Out of Total GPR Sample Area (%)
Topsoilpqsr0.04623.4
Loamy sandrsut0.266719.5
Sand (unsaturated)tuwv1.056177.1
Totalpqwv1.3690100.0
Table 4. Assumed depth of unsaturated sandy layer (d3), and calculated relative permittivities.
DateWTD (m)d3 (= WTD − 0.7 − d1 − d2) (m)εr−avgεr1εr2εr3
23 June 20172.471.4210.923.010.510.5
6 July 20172.551.507.14.012.26.0
28 July 20172.741.696.513.27.56.1
18 August 20172.851.806.510.97.86.0
29 August 20172.901.855.319.58.14.0
15 September 20172.911.865.714.011.24.2
3 October 20172.771.727.96.211.67.0
7 November 20172.631.5811.213.113.710.5
1 June 20182.241.1913.315.212.213.5
20 June 20182.331.289.114.012.58.0
29 June 20182.311.268.419.512.17.0
20 July 20182.541.497.020.08.66.3
9 August 20182.611.565.86.512.84.0
7 September 20182.751.705.44.012.84.1
2 October 20182.561.5110.88.012.410.5
31 October 20181.860.8116.523.313.117.0