Article

The Hydrogeochemical Characteristics of Groundwater Subjected to Seawater Intrusion in the Archipelago, Korea

1
Department of Science Education, Ewha Womans University, Seoul 03760, Korea
2
Korea Institute of Geoscience and Mineral Resources, Daejeon 34132, Korea
*
Authors to whom correspondence should be addressed.
Water 2020, 12(6), 1542; https://doi.org/10.3390/w12061542
Submission received: 29 April 2020 / Revised: 22 May 2020 / Accepted: 23 May 2020 / Published: 28 May 2020
(This article belongs to the Section Hydrology)

Abstract

:
The effect of seawater on the groundwater in archipelago of South Korea where it has rarely been investigated was analyzed by examining the hydrogeochemical characteristics. A total of 74 groundwater samples were classified by water quality type and Cl/HCO3 molar ratio. First, 36 samples of the Ca–Cl type and 32 samples of the Na–Cl type (accounting for 91.9% of the total) were considered to have been influenced by seawater. When the samples had been classified based on the Cl/HCO3 molar ratio, the samples with a Cl/HCO3 molar ratio of 2.8 or higher (indicating that seawater had highly influenced the groundwater) accounted for 40 out of 74 samples. This confirms that the groundwater in the study area had been affected by seawater. When quantitatively determining the influence of seawater on the groundwater, the seawater mixing ratios using either Cl or Br ion were found to be almost the same. In the case of Cl ion, the mixing ratio was in the range of 0–10.4% (average of 1.0%), while when using Br ion, the mixing ratio was in the range of 0–7.6% (average of 0.6%). From a principal component analysis, it can be seen that the influence of seawater occupied the first component of 54.1% and it is evident that the samples with a large mixing ratio of seawater were from regions where seawater has a large influence. The ion-exchange reaction was proceeded by calculating the ionic delta value to indicate the seawater intrusion and cation exchange, and specific trends of the ions participating in the geochemical reaction related to the seawater mixing ratio are reported herein. It was found that the ionic delta value of each ion had a mixing ratio and specific tendency according to the change in mixing ratio before the constant value of the seawater mixing ratio saturated with Na2+. Our results show that it can be possible to grasp the contribution of the geochemical reactions of each ion to the seawater mixing ratio.

1. Introduction

Seawater intrusion constitutes the main environmental problem facing coastal aquifers worldwide [1,2,3]. Impacts of recent climate changes on temperature and precipitation (i.e., rising sea level and continental drought) and groundwater vertical movements (i.e., tectonic uplift and land subsidence) affected by both natural and anthropogenic processes drive the advance and retreat of the fresh groundwater/seawater interface [4,5]. Coastal aquifers form the interface between the oceanic and terrestrial hydrological systems and recent studies expect fresh-saline-water interfaces to move inland [2]. Among the causes of groundwater contamination, salinization is one of the processes that threaten the quality of coastal freshwater reserves and restrict their uses [6]. Salinization of coastal aquifers can occur due to simple, direct seawater intrusion, but it can also involve a range of complex geochemical processes, which control water quality in different ways, for example, water–rock interactions, mobilization of brines and anthropogenic contamination [7]. In this context, understanding of the chemical processes involved in salinization of coastal aquifer is crucial for future management of the vulnerable water resources.
Knowing the origin of groundwater salinity is essential for the proper management of aquifers [3]. The coastal groundwater/seawater mixing zone has thus received extensive investigations both globally and locally and many studies mostly focus on physical processes, such as tidal fluctuation, heterogeneity of the aquifers and seasonal hydrogeology variations [8]. However, the chemical compositions of groundwater in the transition zone are significantly influenced by the interactions between the liquid phase and solid matrix [6]. For the chemical interactions, the hydrogeochemistry techniques that have been most widely utilized are ionic ratios of major, minor and trace elements, ionic deltas, mixing calculations, and geochemical modeling [3]. The hydrogeochemical studies aiming at explaining the anthropogenic or natural processes that determine aquifer salinization are of great importance to develop sustainable management guidelines for water resources.
In many regions, for instance, the United States, Mediterranean region, southern Italy, the eastern part of Spain, Greece, Turkey, and Israel are more vulnerable to localized seawater intrusion due to more irregular and longer coastlines than that of other continents, including South Korea [9,10]. A number of studies related to seawater intrusion have been carried out from various viewpoints and with a variety of methods, albeit mainly in coastal areas and large islands [11,12]. For this reason, research for coastal groundwater/seawater mixing zone, related to seawater intrusion, is being carried out steadily in these regions [13]. In particular, the water supply in the archipelago is nearly entirely dependent upon groundwater sources, but only a few studies have investigated the mixture of groundwater and seawater despite obtaining water by means of drilled wells in the last decades [14]. Globally, studies on hydrogeochemical characteristics of groundwater in the vicinity of archipelagos are not common and this study is the first attempt for an effect of seawater intrusion on groundwater in the archipelago of Korea. The aims of this study are thus, (1) to investigate hydrogeochemical characteristics of the transition zone on the majority of the islands from the archipelago of South Korea, (2) to characterize the major ion chemistry of drilled wells, (3) to address the effects of mixing between groundwater and seawater, and (4) to quantify the hydrogeochemical evolution of groundwater to better understand the interactions between the liquid phase and solid matrix (“cation exchange”) during the mixing.

2. Study Area and Methods
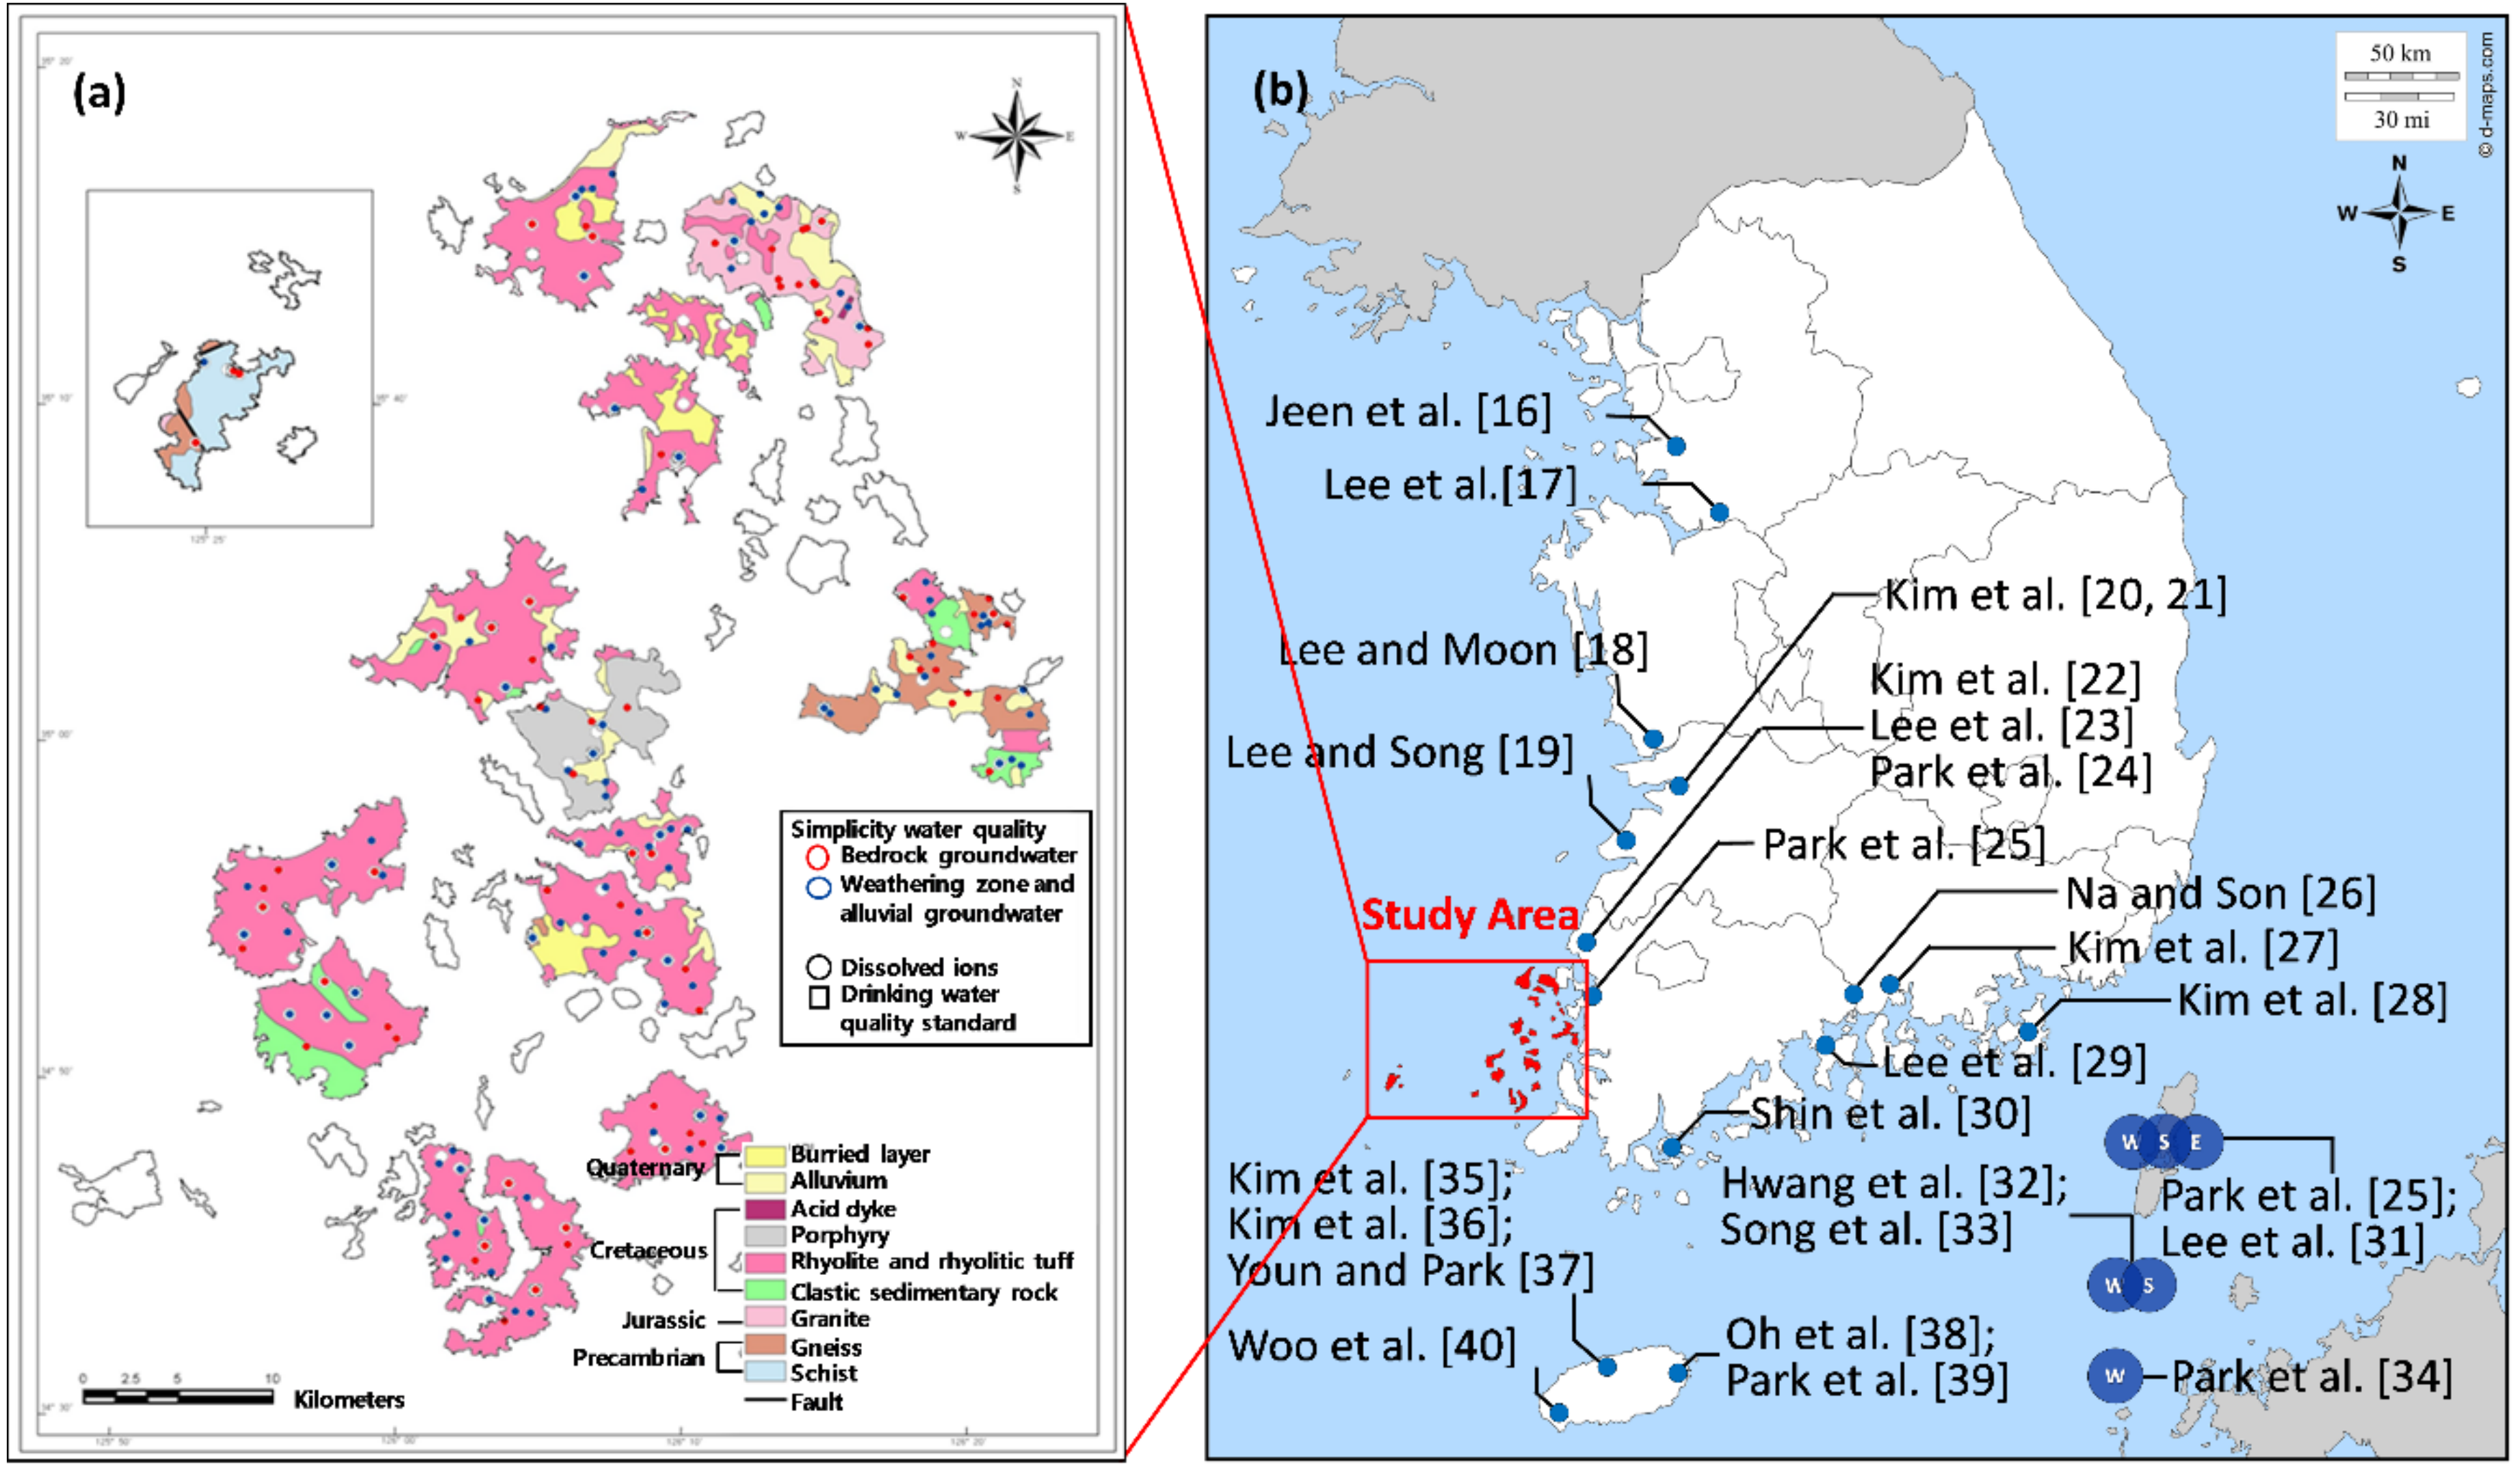
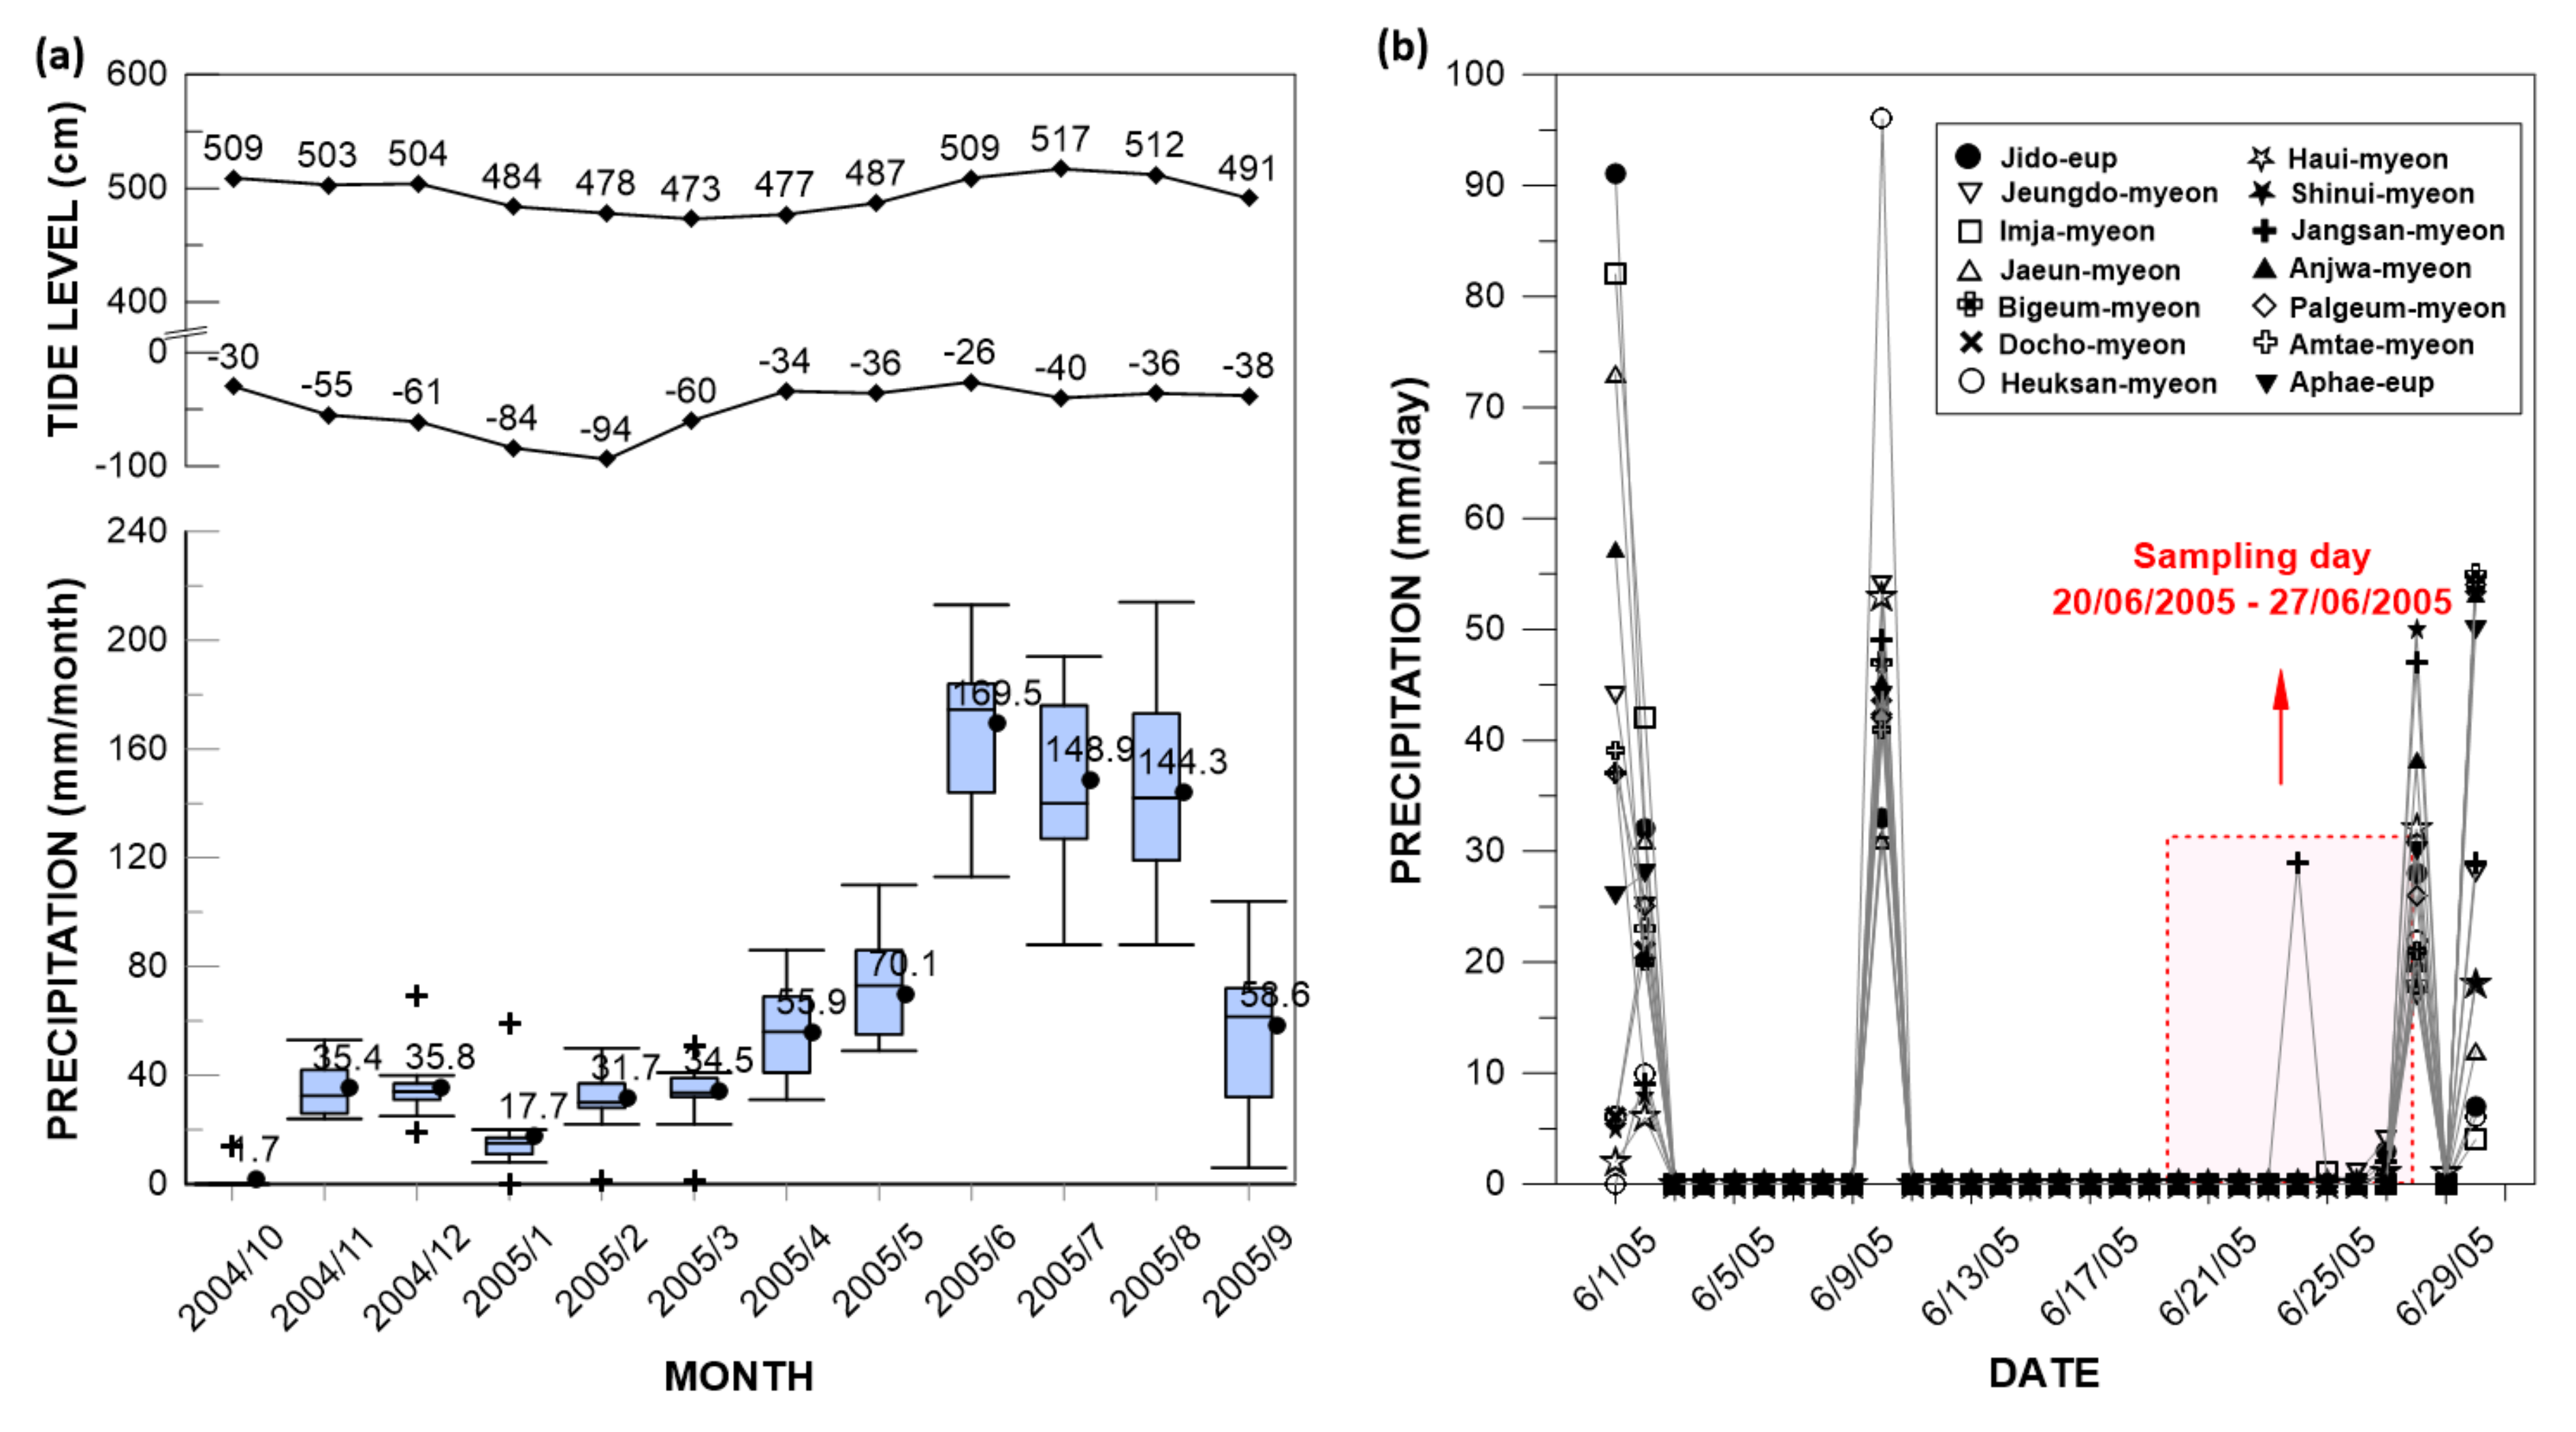
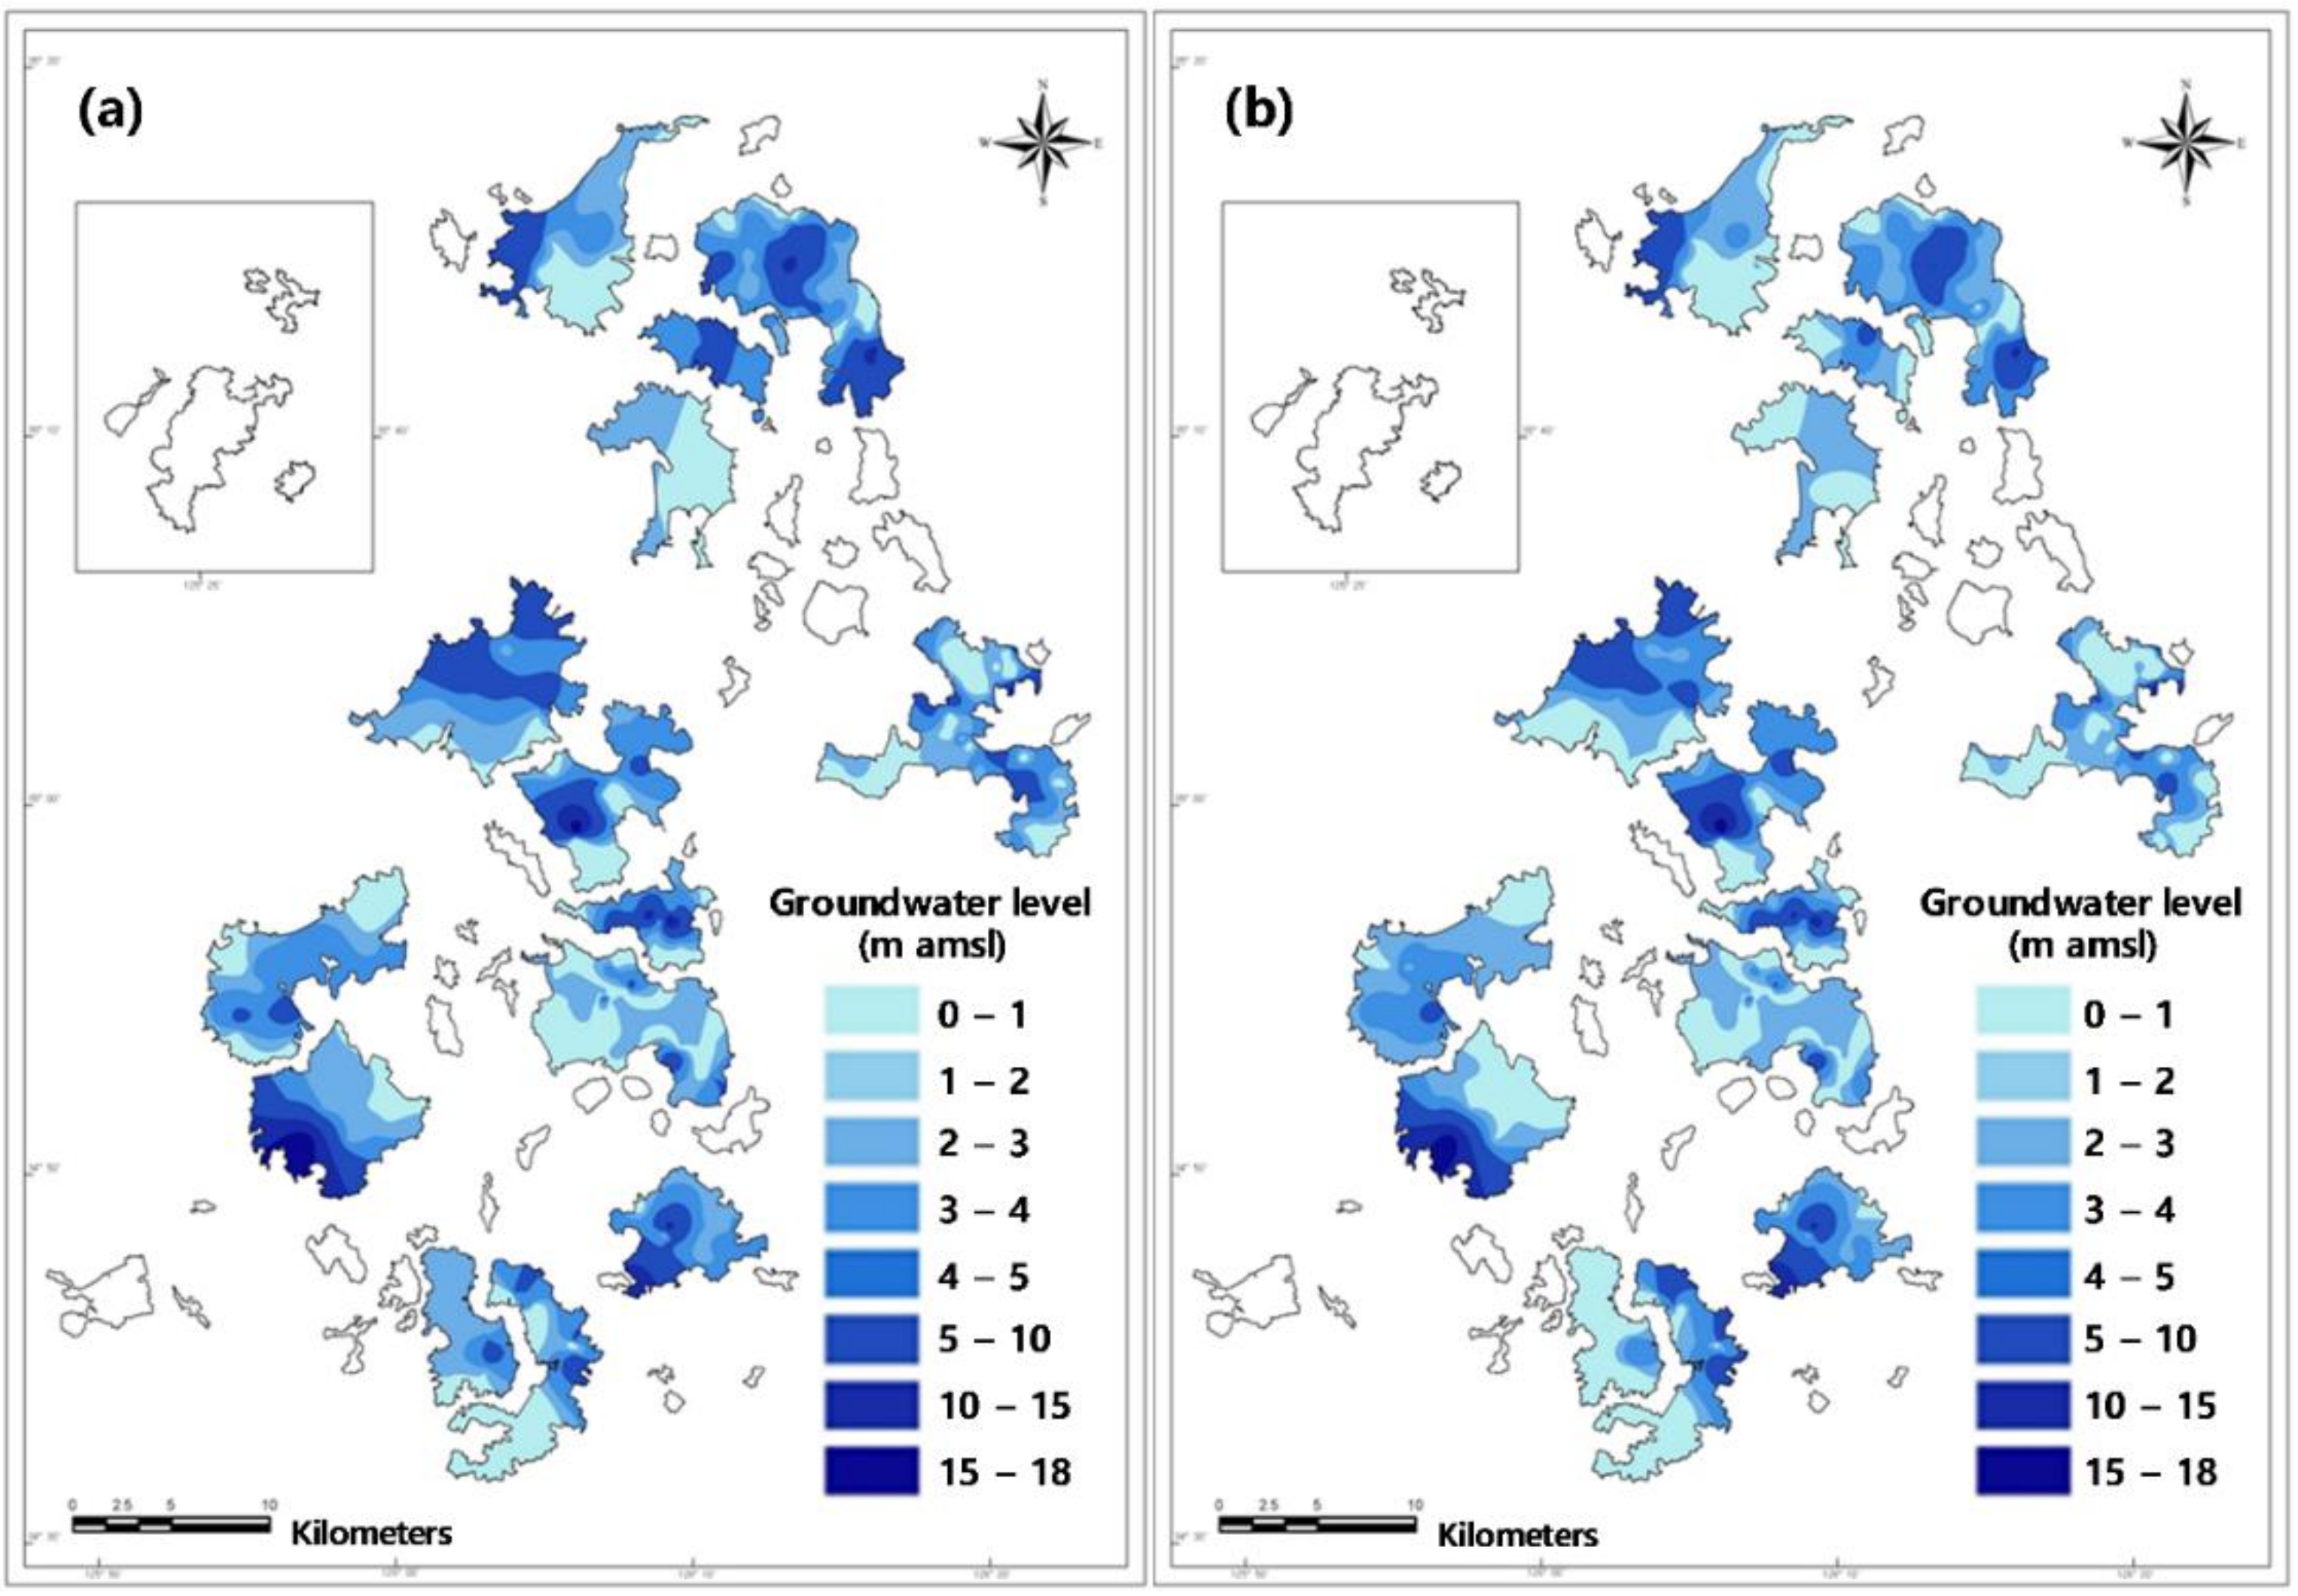
2.1. Study Area

The study area is located at an archipelago in the southwestern sea, adjacent to the Muan Peninsula over the southwestern part of South Korea. Geographically, the cities of Muan and Mokpo lie to the east, the Nagwol islands of Yeonggwang-gun to the north, the archipelago to the south and the West Sea to the west. The coast, formed by the low-relief terrain, is in the form of a rias with severe embayment. The total area is 654.12 km2 and consists of one island, Jido-eup, connected to the mainland and another 827 islands (74 inhabited and 753 uninhabited) (Figure 1).
The land area comprises around half forest land (328.26 km2) and 32.6% agricultural land (216.16 km2) [15]. A total of 1907 groundwater development and utilization facilities are in use, accounting for 78.1% of the total number of facilities for agricultural use. Shinan county shows typical rural water use characteristics.
The Shinan area corresponds to the southwestern end of the Ogcheon era. Jurassic Daebo granite has intruded and is distributed along with the metamorphic rocks, consisting of gneiss and schist from the Precambrian era as bedrock, which is covered by the unconfined clastic sedimentary rocks of the Cretaceous period. Rhyolitic and rhyolitic tuff, porphyry, and acid dikes of the Cretaceous Yucheon stratigraphy have erupted and penetrated in succession, and the fourth alluvial layer composed of unconsolidated sediments has covered the aforementioned strata unconformably (Figure 1, MOLIT et al. [15]). The area of Shinan is 268.74 km2 (41.2% of the total area) with an elevation of 10 m or less with the terrain slope, comprising a low and flat topography (38.2% of the area is below 2°). The dominant soil textures at the study site are coarse loamy, coarse silty, and fine loamy. Among them, the most widely distributed soil is fine loamy, which is a weathering product of granite.
The effects of seawater intrusion on the west and the south coasts are more affected by the difference in the groundwater use in the agricultural irrigation canals than on the east coast in Korea [4,13,16]. As a natural factor, the ocean tide has a greater impact on seawater intrusion than rainfall [21]. Indeed, domestic studies on seawater intrusion have mostly been conducted on the west and the south coasts (Figure 1). The surveyed network of seawater intrusion by the Korea Rural Community Corporation in 92 locations was also located in the coastal area only [25]. Furthermore, it is of utmost importance to determine whether groundwater has been contaminated due to seawater intrusion, especially in the case of island areas, since it is difficult to develop water resources there and the dependence on groundwater is high due to the geographical characteristics.
According to the Mokpo Meteorological Observatory adjacent to Shinan-gun, the annual precipitation (from 1971–2000) is 1142.2 mm, which is heavily concentrated in the summer season. The annual average temperature is 13.7 °C, with the lowest temperature around January and the temperature gradually increases again around March. Both the monthly precipitation of the groundwater sampling period and the supreme tidal current observed at Mokpo tidal observatory are shown in Figure 2a. The daily precipitation during the period of sampling groundwater and seawater is shown in Figure 2b; in the case of Jangsan-myeon, which was the only area to have rainfall during the sampling period, the sample was taken on June 23rd, 2005, so it was not affected by on-precipitation on June 24th.
A total of 288 sampling sites, capable of being used to determine the groundwater level were selected; the observation network was constructed, and a short-term simultaneous investigation was conducted four times a year. The results of the measurements in the dry season (January 17th, 2005–February 1st, 2005) and in the wet season (August 9th–13th, 2005) are shown in Figure 3. Based on the measurements, the null hypothesis, “the water level in the wet season is higher than in the dry season”, was established and a T-test was performed under the assumption of equal variance. As a result, the one-sided test P (T ≤ t) showed a probability value of 0.026, indicating that the water level in the wet season was higher than in the dry season.

2.2. Sampling and Chemical Analysis

A total of 74 groundwater samples were collected from June 20th–27th, 2005 (Figure 1). Water samples were taken from domestic wells, having long and multiple screened intervals. In this regard, it is difficult to specify the exact sampling depth so that we assumed water samples are mixed over the whole vertical section where wells are installed. Seven samples were collected in Jido-eup and Aphae-eup and five samples were collected from the remaining 12 areas. In the case of Jangsan-myeon, which was the only area to have rainfall during the sampling period, the precipitation on June 24th, 2005 did not affect the Jangsan-myeon sample because it was sampled on June 23rd, 2005. The analysis of the influence of seawater on the groundwater quality was based on field water quality measurements of electrical conductivity (EC), total dissolved solids (TDS), pH, and temperature (°C), and a dissolved ion analysis was conducted to evaluate the hydrochemical properties of the aquifers. The temperature was measured with a SK-2500WPII-K thermometer (SATO, Tokyo, Japan), the pH with a HQ40d pH/DO multi meter (Hach, Loveland, CO, USA), the EC and TDS with a 340i EC meter (WTW, Weilheim in Oberbayern, Germany). All samples were filtered in situ through a 0.45 μm membrane. To analyze cations, samples were collected in 125 mL I-CHEM LDPE bottles and acidified to less than a pH 2 of with ultra-pure HNO3. Samples for analysis of dissolved anions were packed in 125 ml Nalgene bottles without a headspace. All samples were refrigerated until analyzed.
An analysis of alkalinity and dissolved ions was performed using the analytical equipment of the Korea Institute of Geoscience and Mineral Resources (KIGAM). The alkalinity measurement was carried out in a laboratory using an automatic titrator (Mettler Toledo Excellence) and measured by acid titration to pH 4.5. The major cations were measured using inductively coupled plasma-optical emission spectrometry (Perkin Elmer Optima 7300DV, Waltham, MA, USA) and major anions were analyzed using ion chromatography (Dionex ICS-1500, Sunnyvale, CA, USA). The detection limit was 0.09 mg/L, the uncertainty was 0.01 mg/L, and the dissolved ion charge balance by the analysis was within ±10%.

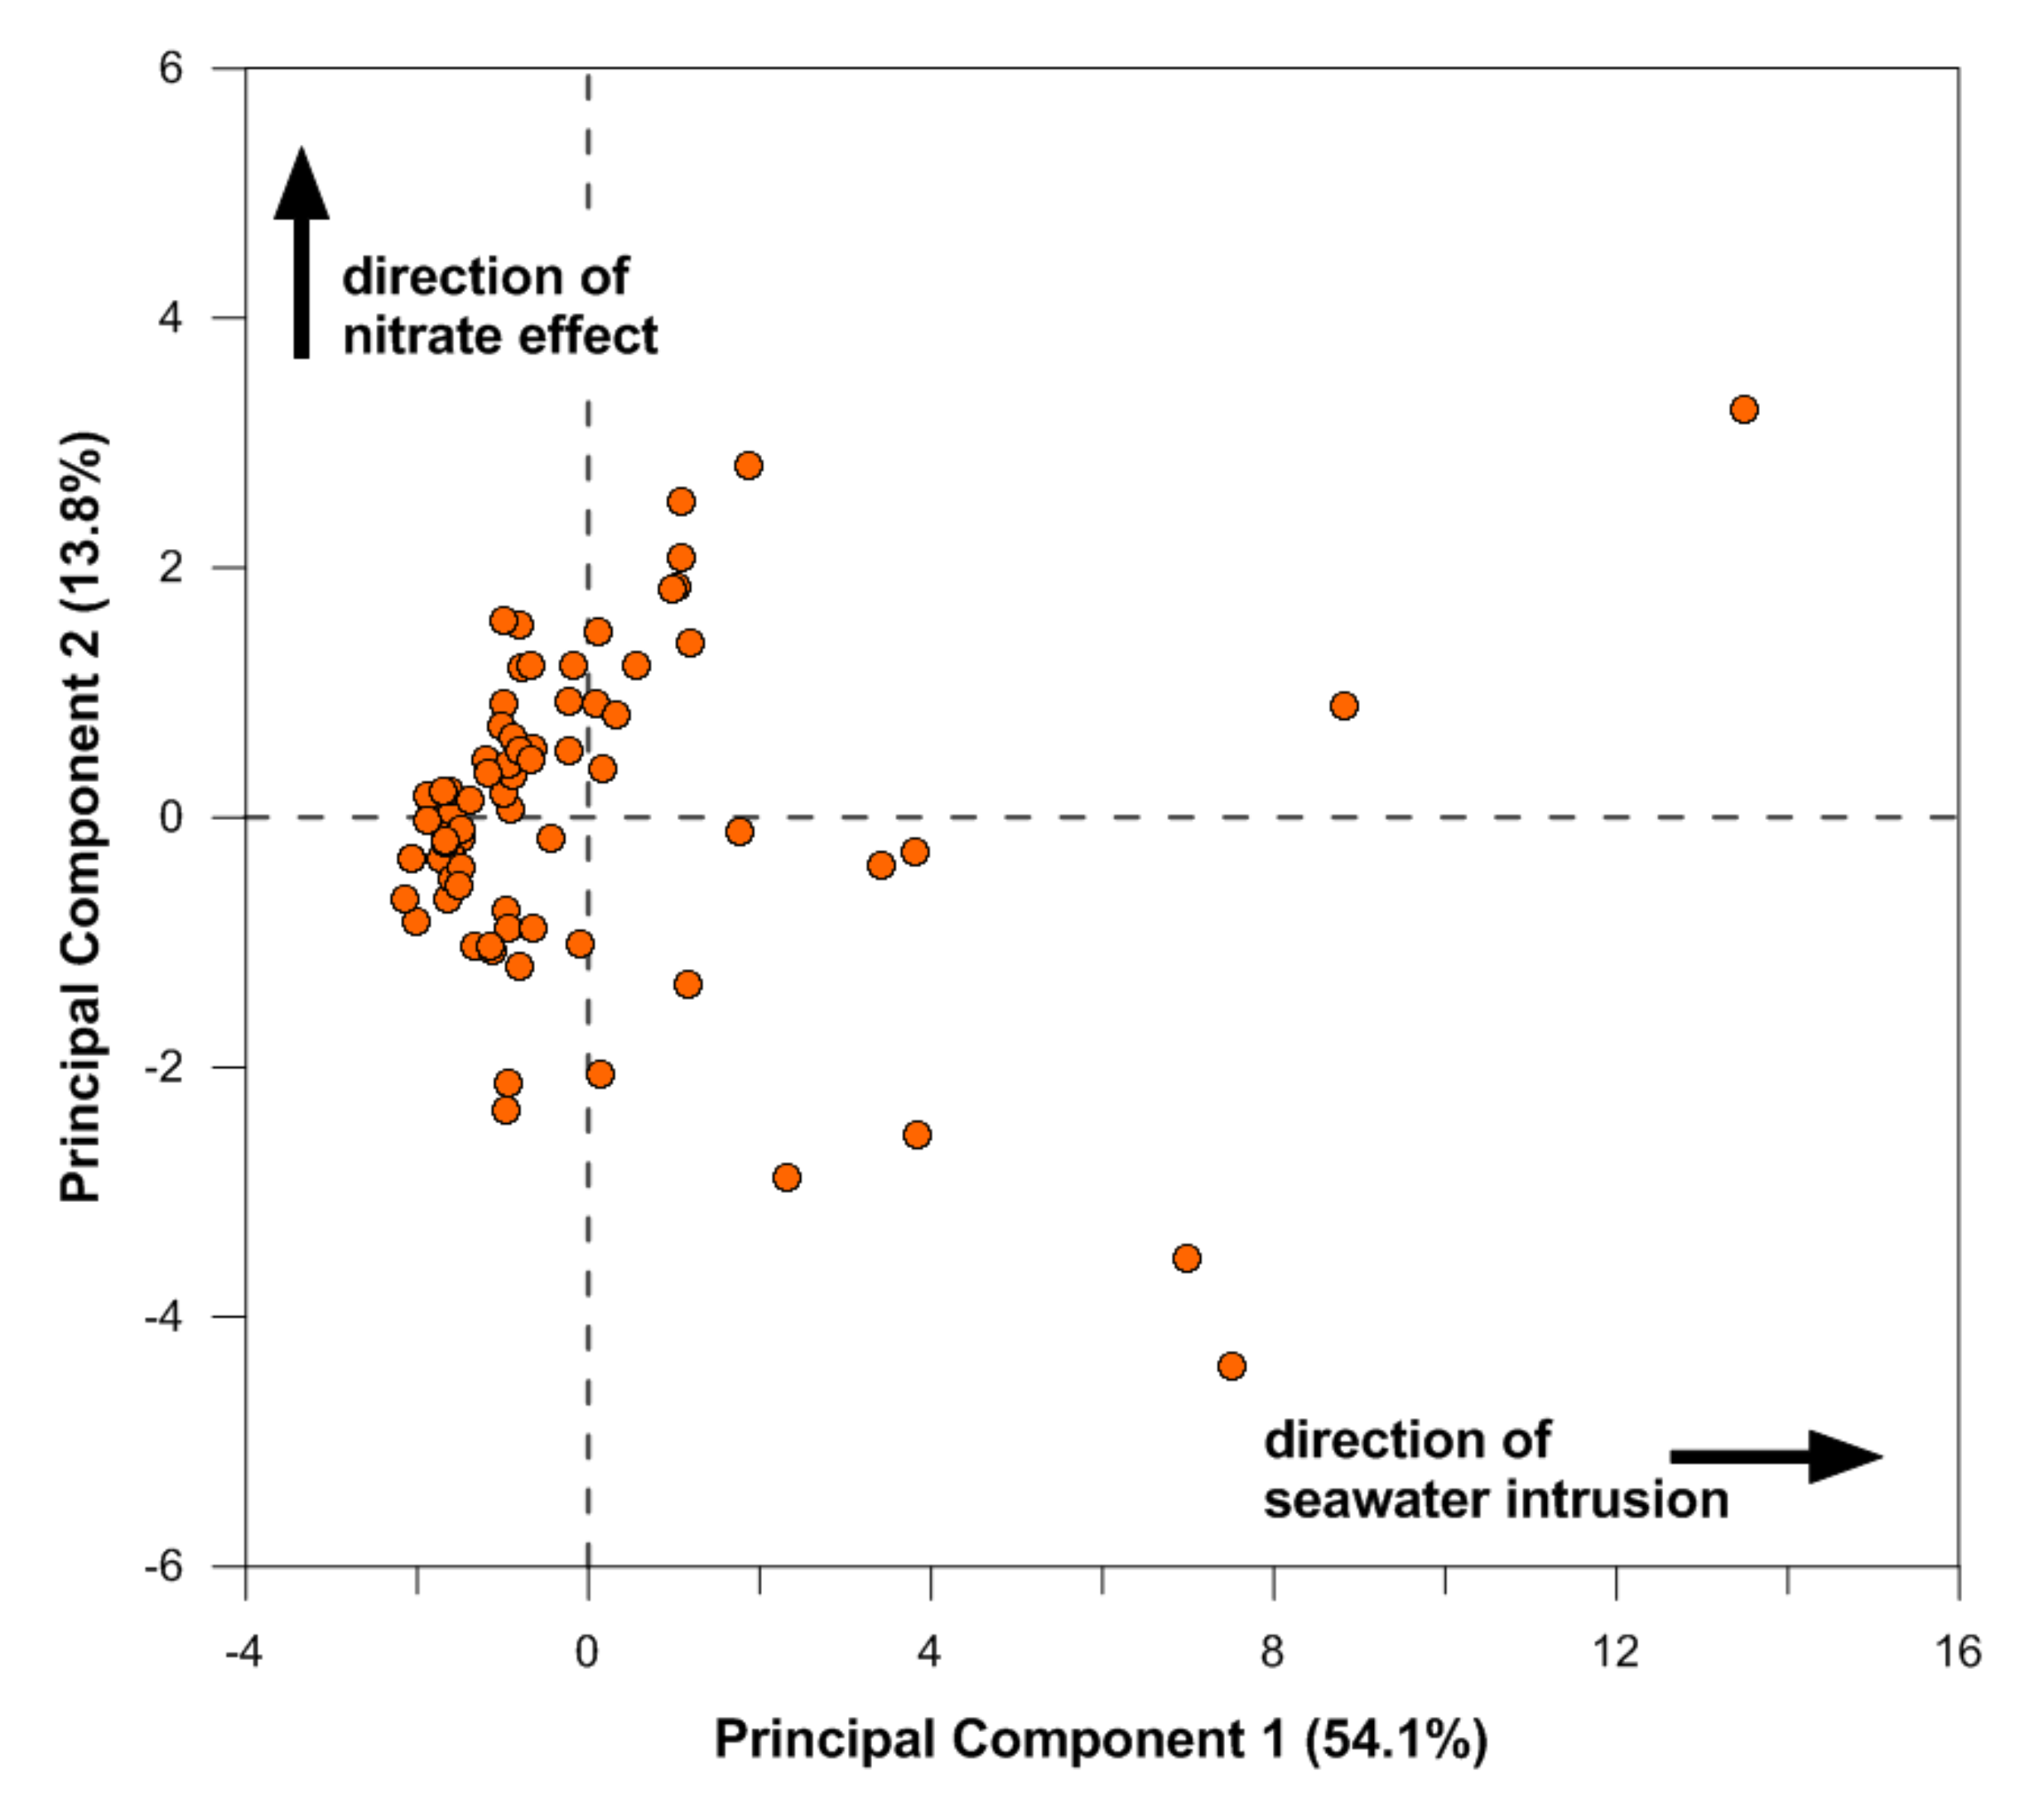
2.3. Principal Component Analysis (PCA)

Multivariate statistical analysis, principal component analysis (PCA) was applied to the data set. PCA reduces the information in many variables into a set of weighted linear combinations of those variables, which does not differentiate between common and unique variance [42,43,44]. Since PCA is based on entirely on eigenvalue analysis of a correlation or covariance matrix, the data are not required to be normally distributed. The hydrochemical data, including major cations and anions (TDS, EC, Ca2+, Mg2+, Na+, K+, SO42−, HCO3, NO3, Cl, Br, and F) have been used for the PCA. In this work, PCA was applied to the correlation matrix because the variables vary by different orders of magnitude. In the correlation matrix, each variable is normalized to unit variance and contributes equally. The summarized information shown in the PCA plot is used for finding relationships, patterns, and waters that have extreme chemical composition, and for further statistical modeling [45]. Values for elements below the method detection limits (<DL) were substituted with DL/2 prior to statistical analyses as suggested by Stetzenbach et al. [46]. Detailed explanations and complete mathematical development can be found in Rencher [47]. The statistical calculations were carried out using JMP®.

2.4. Ioninc Detas by Mixing Ratio

The mixing ratios (x) using either Cl or Br ion, which are widely used to determine the mixing of freshwater and seawater, are obtained as follows using the law of mass conservation:
x = C sample C freshwater C seawater C freshwater
where C is the concentration of chloride and bromide ion, respectively. The lowest value of the analyzed groundwater data was used in the end-member mixing analysis (EMMA) using either Cl or Br as tracers. In the case of seawater concentration, Cl were used for the analysis of the study area samples, while Br were used for the average value of domestic seawater, mentioned previously.
Ionic delta (Δ) is usually as an important indicator for geochemical reactions between the solid and liquid phase in coastal aquifers. This indicator is widely utilized in studies on seawater intrusion and cation exchange between the rocks and the mixed groundwater between fresh groundwater and seawater [1,6,48]. It indicates the difference between the measured and theoretical concentrations of ion i, when freshwater and seawater are mixed conservatively:
Δ C i = C i,sample C i,mix
where ΔCi is the ionic delta of the ion i, Ci,sample is the measured concentration of i in the sample, and Ci,mix is the theoretical concentration of i in the conservative mixture of fresh water and seawater. The theoretical concentrations are calculated by taking into account the seawater content (fsea) based on the Br concentration in the sample (CBr,sample), the Br concentration in the freshwater (CBr,f), and the Br concentration of the seawater (CBr,sea) as follows:
f sea = C Br,ssample C Br,f C Br,sea C Br,f
In this way, the seawater concentration of each sample can be calculated, which is the same as the previous calculation method for the mixing ratio using Br ions (Equation (1)). This seawater concentration was then used to calculate the theoretical concentration of each ion:
C i,mix = f sea C i,sea + 1 f sea C i,f
These calculations take into account the fact that Br is a conservative tracer. In fact, Br is not usually removed from the system due to its high solubility. The only inputs are either from the aquifer matrix salts or from a salinization source as seawater intrusion.

3. Results

The basic statistics of the chemical compositions of groundwater samples, including in situ measurements (EC, TDS, pH, and temperature) are listed in Table 1. Except for pH and temperature, the high spatial dispersion of most of the high standard deviation (SD), which may indicate variability in hydrochemical compositions between samples, points to the presence of spatial variations, likely caused by polluting sources. In particular, high standard deviations of Na+ and Cl indicate that the groundwater in the study area can be affected by various factors, such as seawater intrusion, silicate chemical weathering, and so on.
The ion ratios between different chemical species have frequently been used to evaluate the seawater intrusion in coastal areas [10,49]. To understand the effect of seawater intrusion, the results of the dissolved ion analysis were classified according to the Cl/HCO3 molar ratio and water quality type in this study. The value of r(Cl/HCO3) has been used as an effective factor to determine the effect of seawater. Less than 0.5 means that there is no effect of seawater, more than 0.5 and less than 1.3 means that there is a slight effect, more than 1.3 and less than 2.8 means a moderate one, 2.8 to 6.6 means a severe effect, and 6.6 or more can be interpreted as the seawater effect is very severe [50]. From the results of analyzing the influence of seawater on the groundwater in terms of r(Cl/HCO3), it was considered to have been present in all of the islands’ groundwater to some degree. In particular, a level of 2.8 or more, indicating a high seawater effect, was present in 40 samples (54.1% of the total). The relationship between r(Cl/HCO3) and the Na+/Cl molar ratio is shown in Figure 4. In this case, samples with r(Cl/HCO3) of less than 1.3 (not subject to seawater contamination) showed a very wide range of Na+/Cl molar ratios, but those with r(Cl/HCO3) of 2.8 or more (significant seawater pollution) attained an Na+/Cl molar ratio close to the composition of seawater (i.e., 0.94). It can be concluded that more than half of the groundwater samples in the Shinan area have been affected by seawater. Although we tried to relate the degrees of seawater intrusion to the distance between coastal line and the sampling site in each island, there is no clear relationship between them because of different topography of the islands.
Principal component analysis (PCA) was performed to determine the factors that had the greatest influence on the chemical compositions of groundwater in the study area and to estimate the factors that determine the groundwater chemical compositions. The variables, TDS, EC, Ca2+, Mg2+, Na+, K+, SiO2, SO42−, HCO3, NO3, Cl, Br, and F were applied when conducting the PCA. The results of the PCA of the data set are presented in Figure 5. The PC 1 is plotted along the horizontal axis and PC 2 is plotted along the vertical axis. The first principal component (PC 1) accounted for 54.1% of the variance and is highly explained by most variables: TDS, EC, Ca2+, Mg2+, Na+, Cl, SO42−, and Br. The first set of PCA loadings (PC 1) is taken to be related to the seawater intrusion. The second principal component (PC 2) explains 13.8% of the variance and includes NO3 and SiO2 (positive loadings), and HCO3 and F (negative loadings) (Table 2). The second set of PCA loadings (PC 2) can be explained by nitrate contamination (the highest loading).
The results of the dissolved ion analysis of the groundwater samples are shown in the Piper diagram in Figure 6 and classified into the four aforementioned types. As a result, it is evident that 43.24% of the samples belonging to the Na–Cl type have been directly affected by seawater. The Ca–Cl type, which is the Na–Cl type after being subjected to seawater intrusion, comprised 48.65%, which indicates that the influence of seawater is continuing.
The enrichment of cations and anions can play an important role as an indicator of diagnosing the seawater intrusion. Br is predominantly supplied from seawater only in this study area, so it is a suitable proxy for the seawater intrusion. Figure 7 shows correlations between the main dissolved ions with Br, most of which, except for HCO3, K+, and NO3, showed a good correlation (especially Ca2+, Mg2+, Na+, SO42−, and Cl), thus clarifying the mixing tendency of groundwater and seawater (see Table 3). The dotted line in each plot represents a mixing line between groundwater and seawater. For example, the chloride ions are very well correlated with the bromide ions, which were mostly by the seawater influence. In case of sodium and calcium, the linear line between sodium and bromide is below the mixing line, whereas the linear line for calcium is above the mixing line. The expected sodium concentration is lower, but the expected calcium concentration is higher. This indicates that there is a cation exchange when the mixing between seawater and groundwater proceeds, which will be discussed in the following section.

4. Discussion

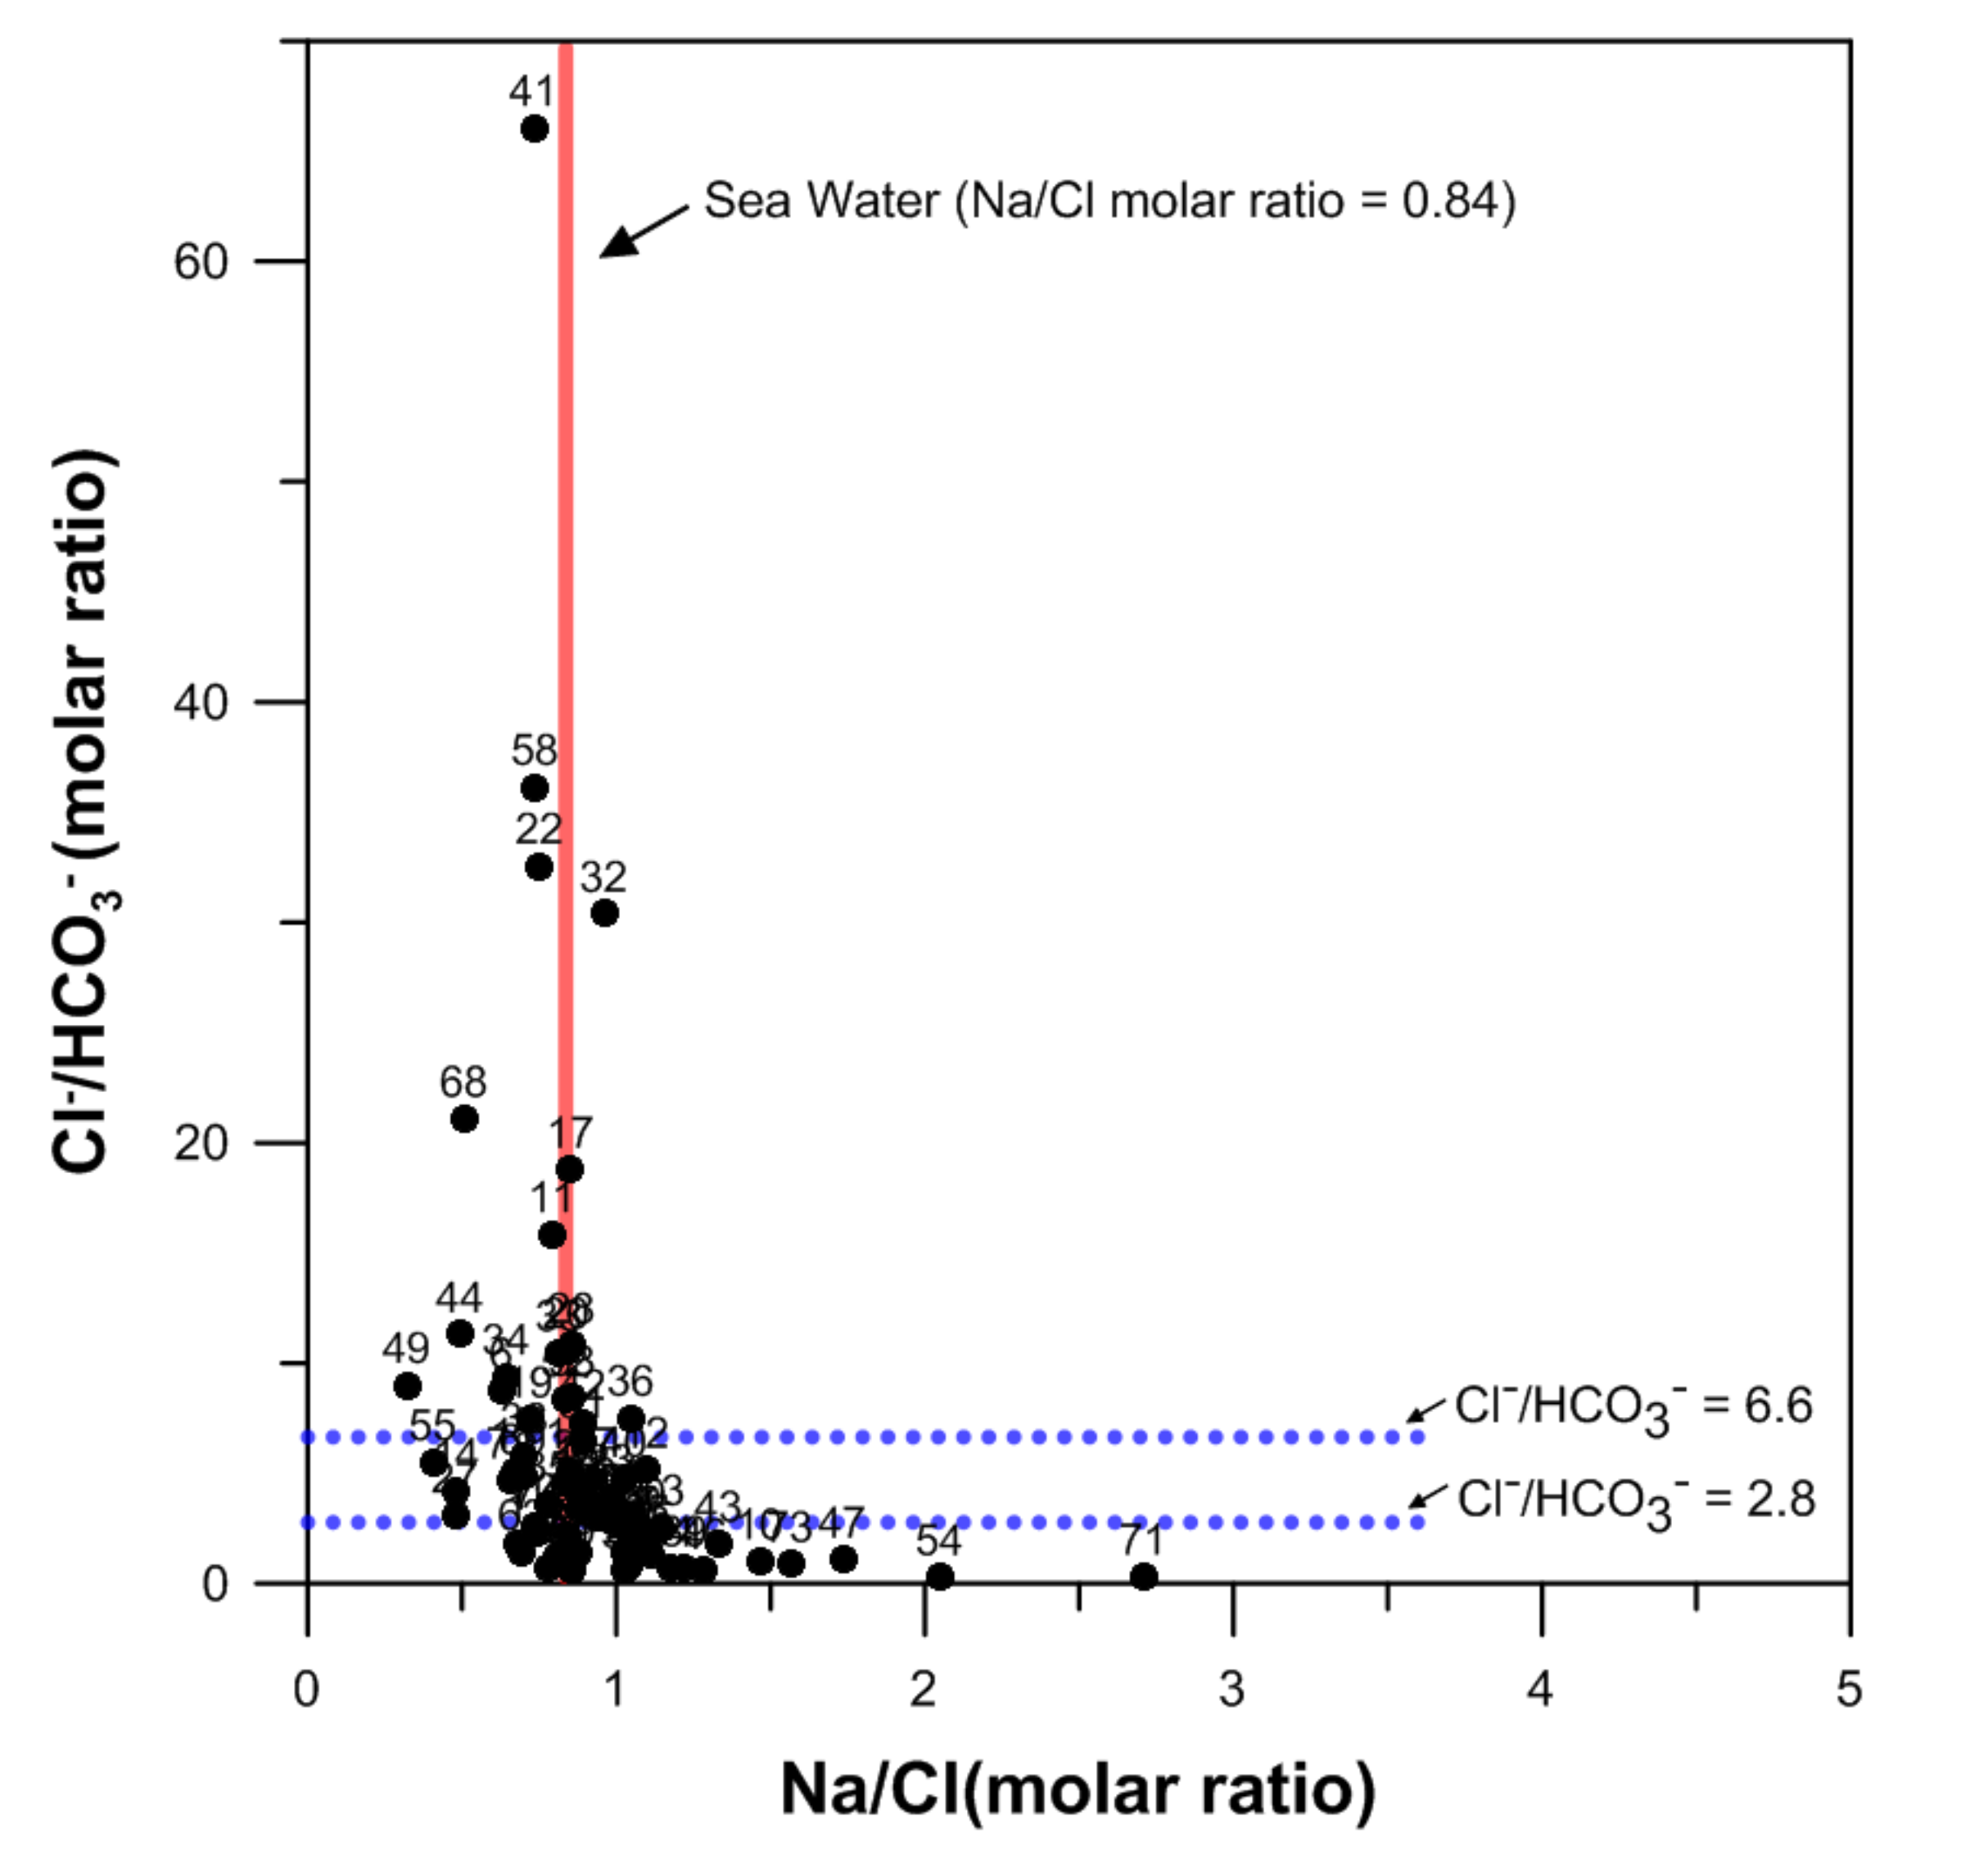
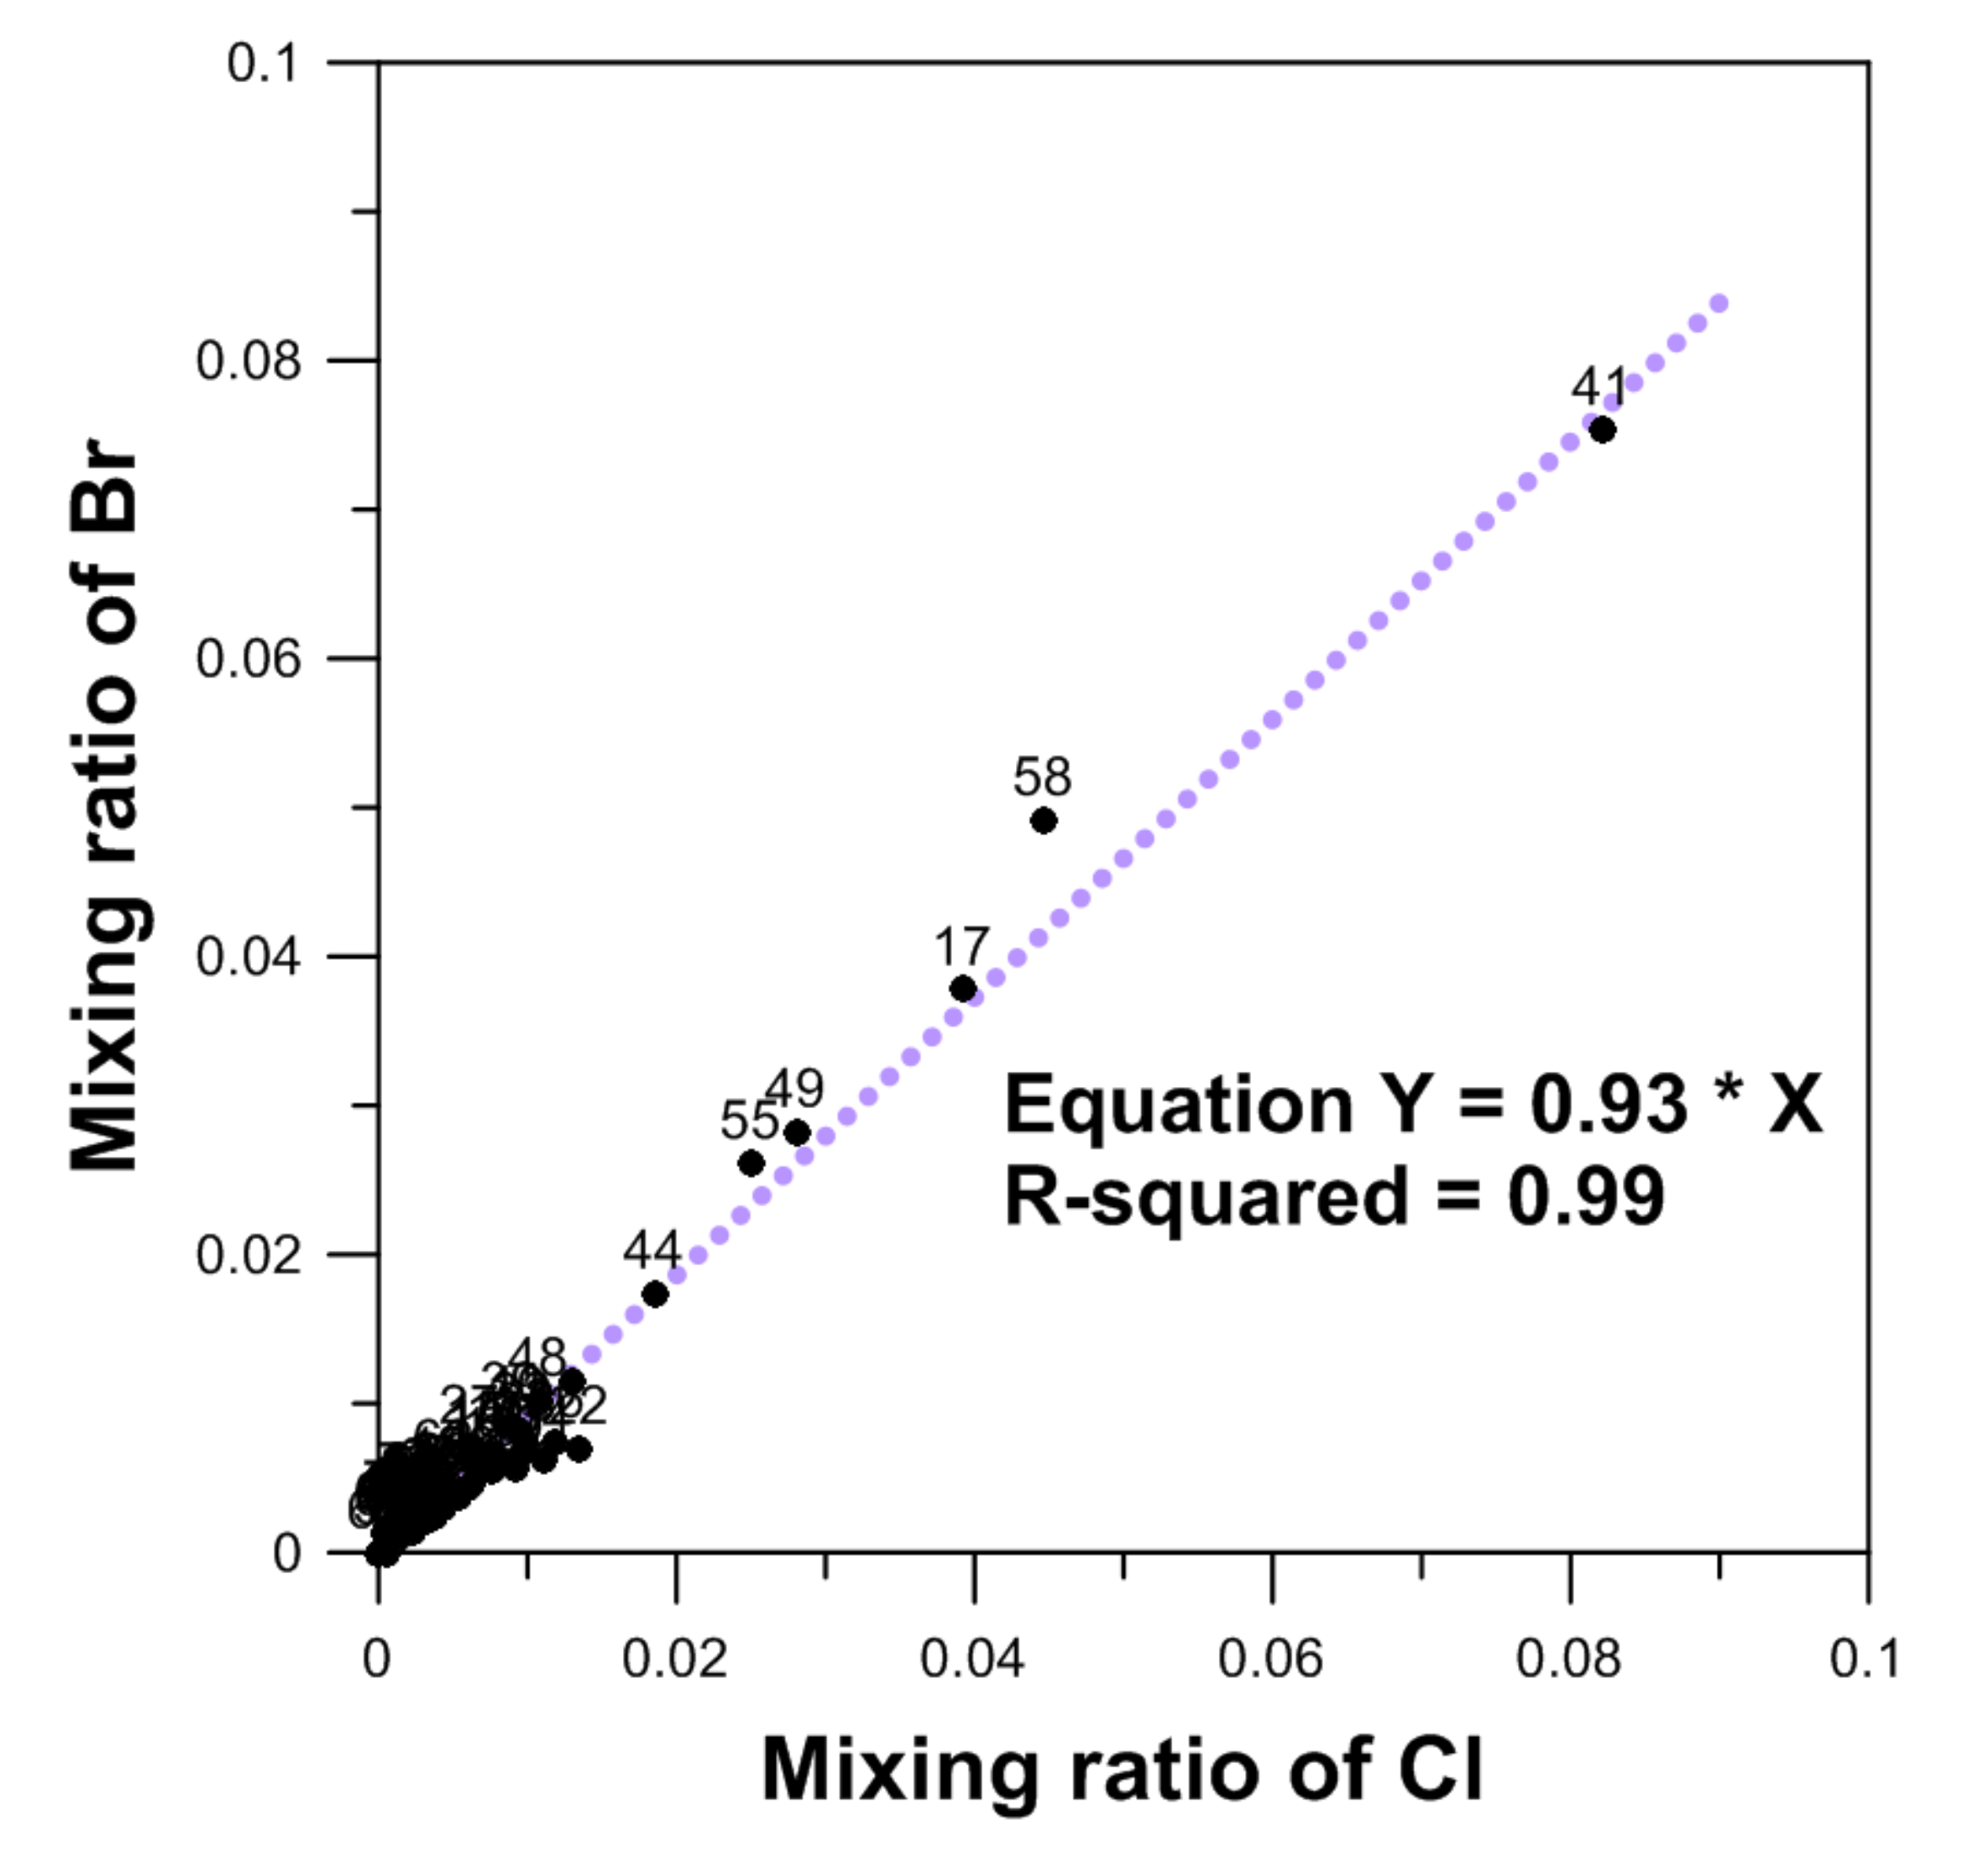
4.1. The Mixing Ratio between Groundwater and Seawater

Table 3 summarizes the mean chemical data of seawater from the previous studies utilized for this study. The non-reactive halogens, Br and Cl, are adsorbed onto reducing environmental organisms, do not form insoluble sediments and do not react with a variety of other ions. In general, the Cl concentration is low in freshwater and the higher it is, the more likely point contamination from external factors and potential contamination has occurred. Chemically, Br ions have similar properties to Cl ions and are commonly used in seawater studies as well [6,51]. Therefore, the Br or Cl ion concentration in freshwater, which are generally influenced by seawater intrusion [52,53], are similar to each other and can be used to trace the salinity origin in freshwater and to determine whether freshwater and seawater have been mixed [5].
The mixing ratio using Cl ion was in the range of 0–10.4% with a mean value of 1.0% and a standard deviation of 1.6%. The uncertainty of the mixing ratio using Cl ion was calculated with reference to the hydrological separation system error calculation method [54] with an average value of ±0.02%. In the case of Br ion, the mixing ratio was in the range of 0–7.6% with an average value of 0.6% and a standard deviation of 1.2%. As shown in Figure 8, the mixing ratio calculated using Br ions tended to be underestimated compared with that calculated using Cl ions. However, the mixing ratios with either Cl or Br ion had an almost positive correlation with the correlation coefficient (R2) value of 0.99, and the values showed similar tendencies.

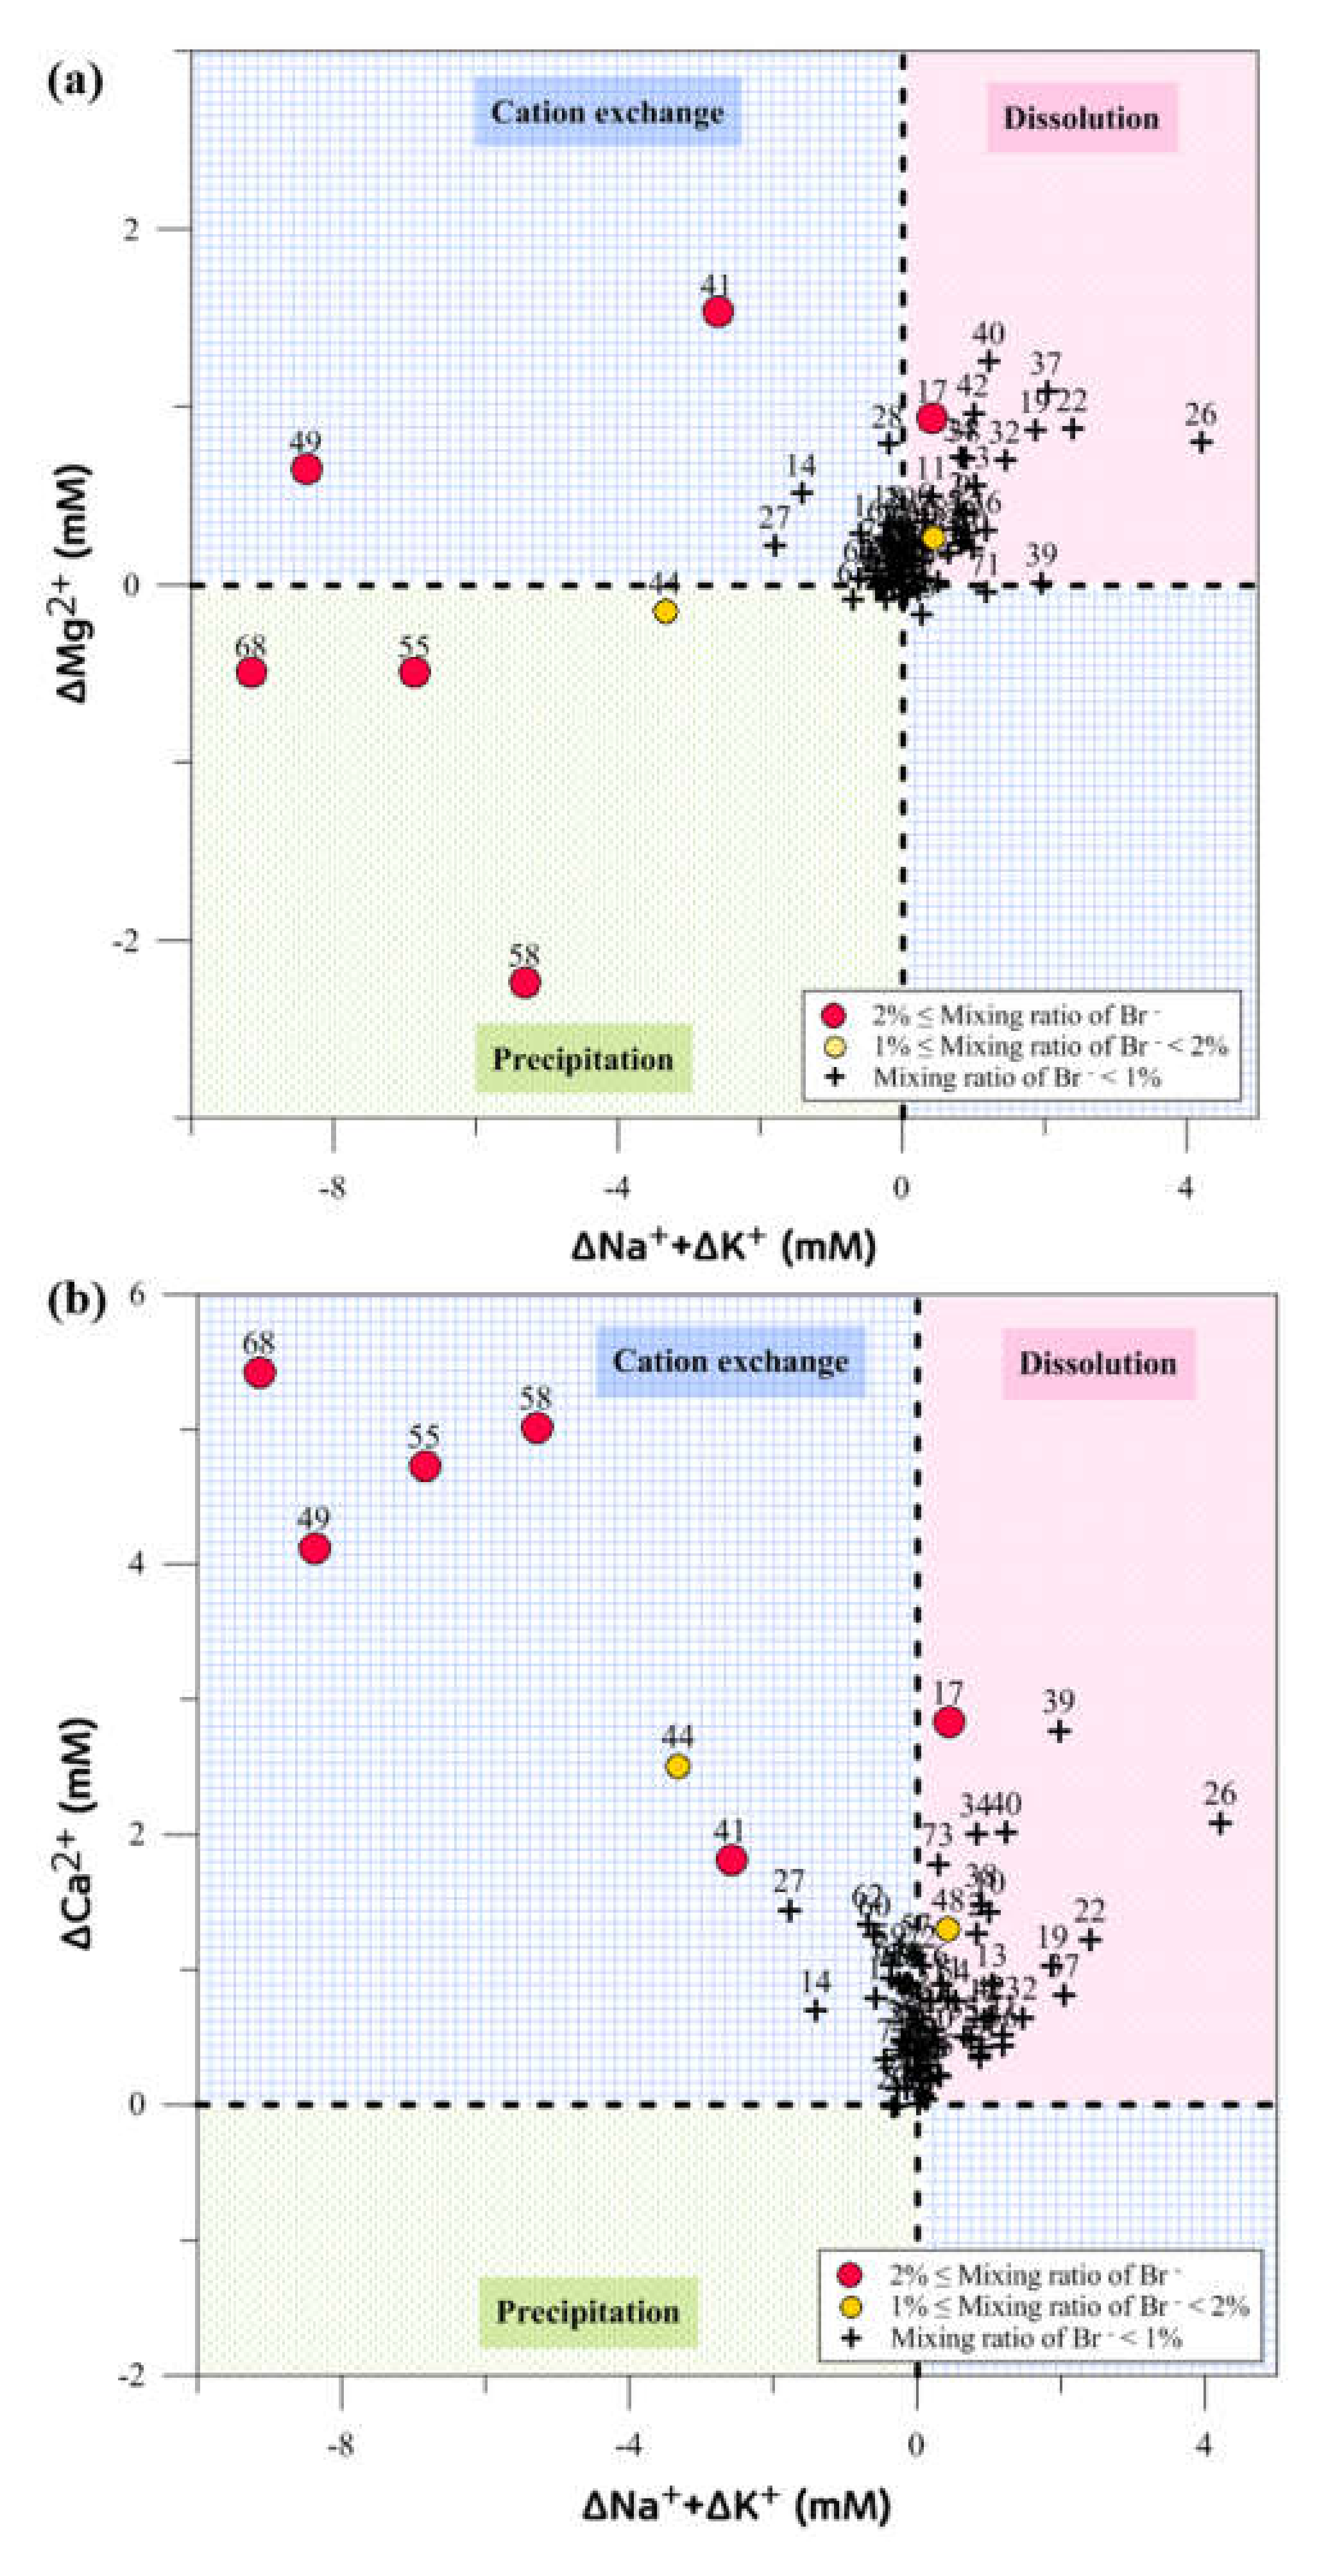
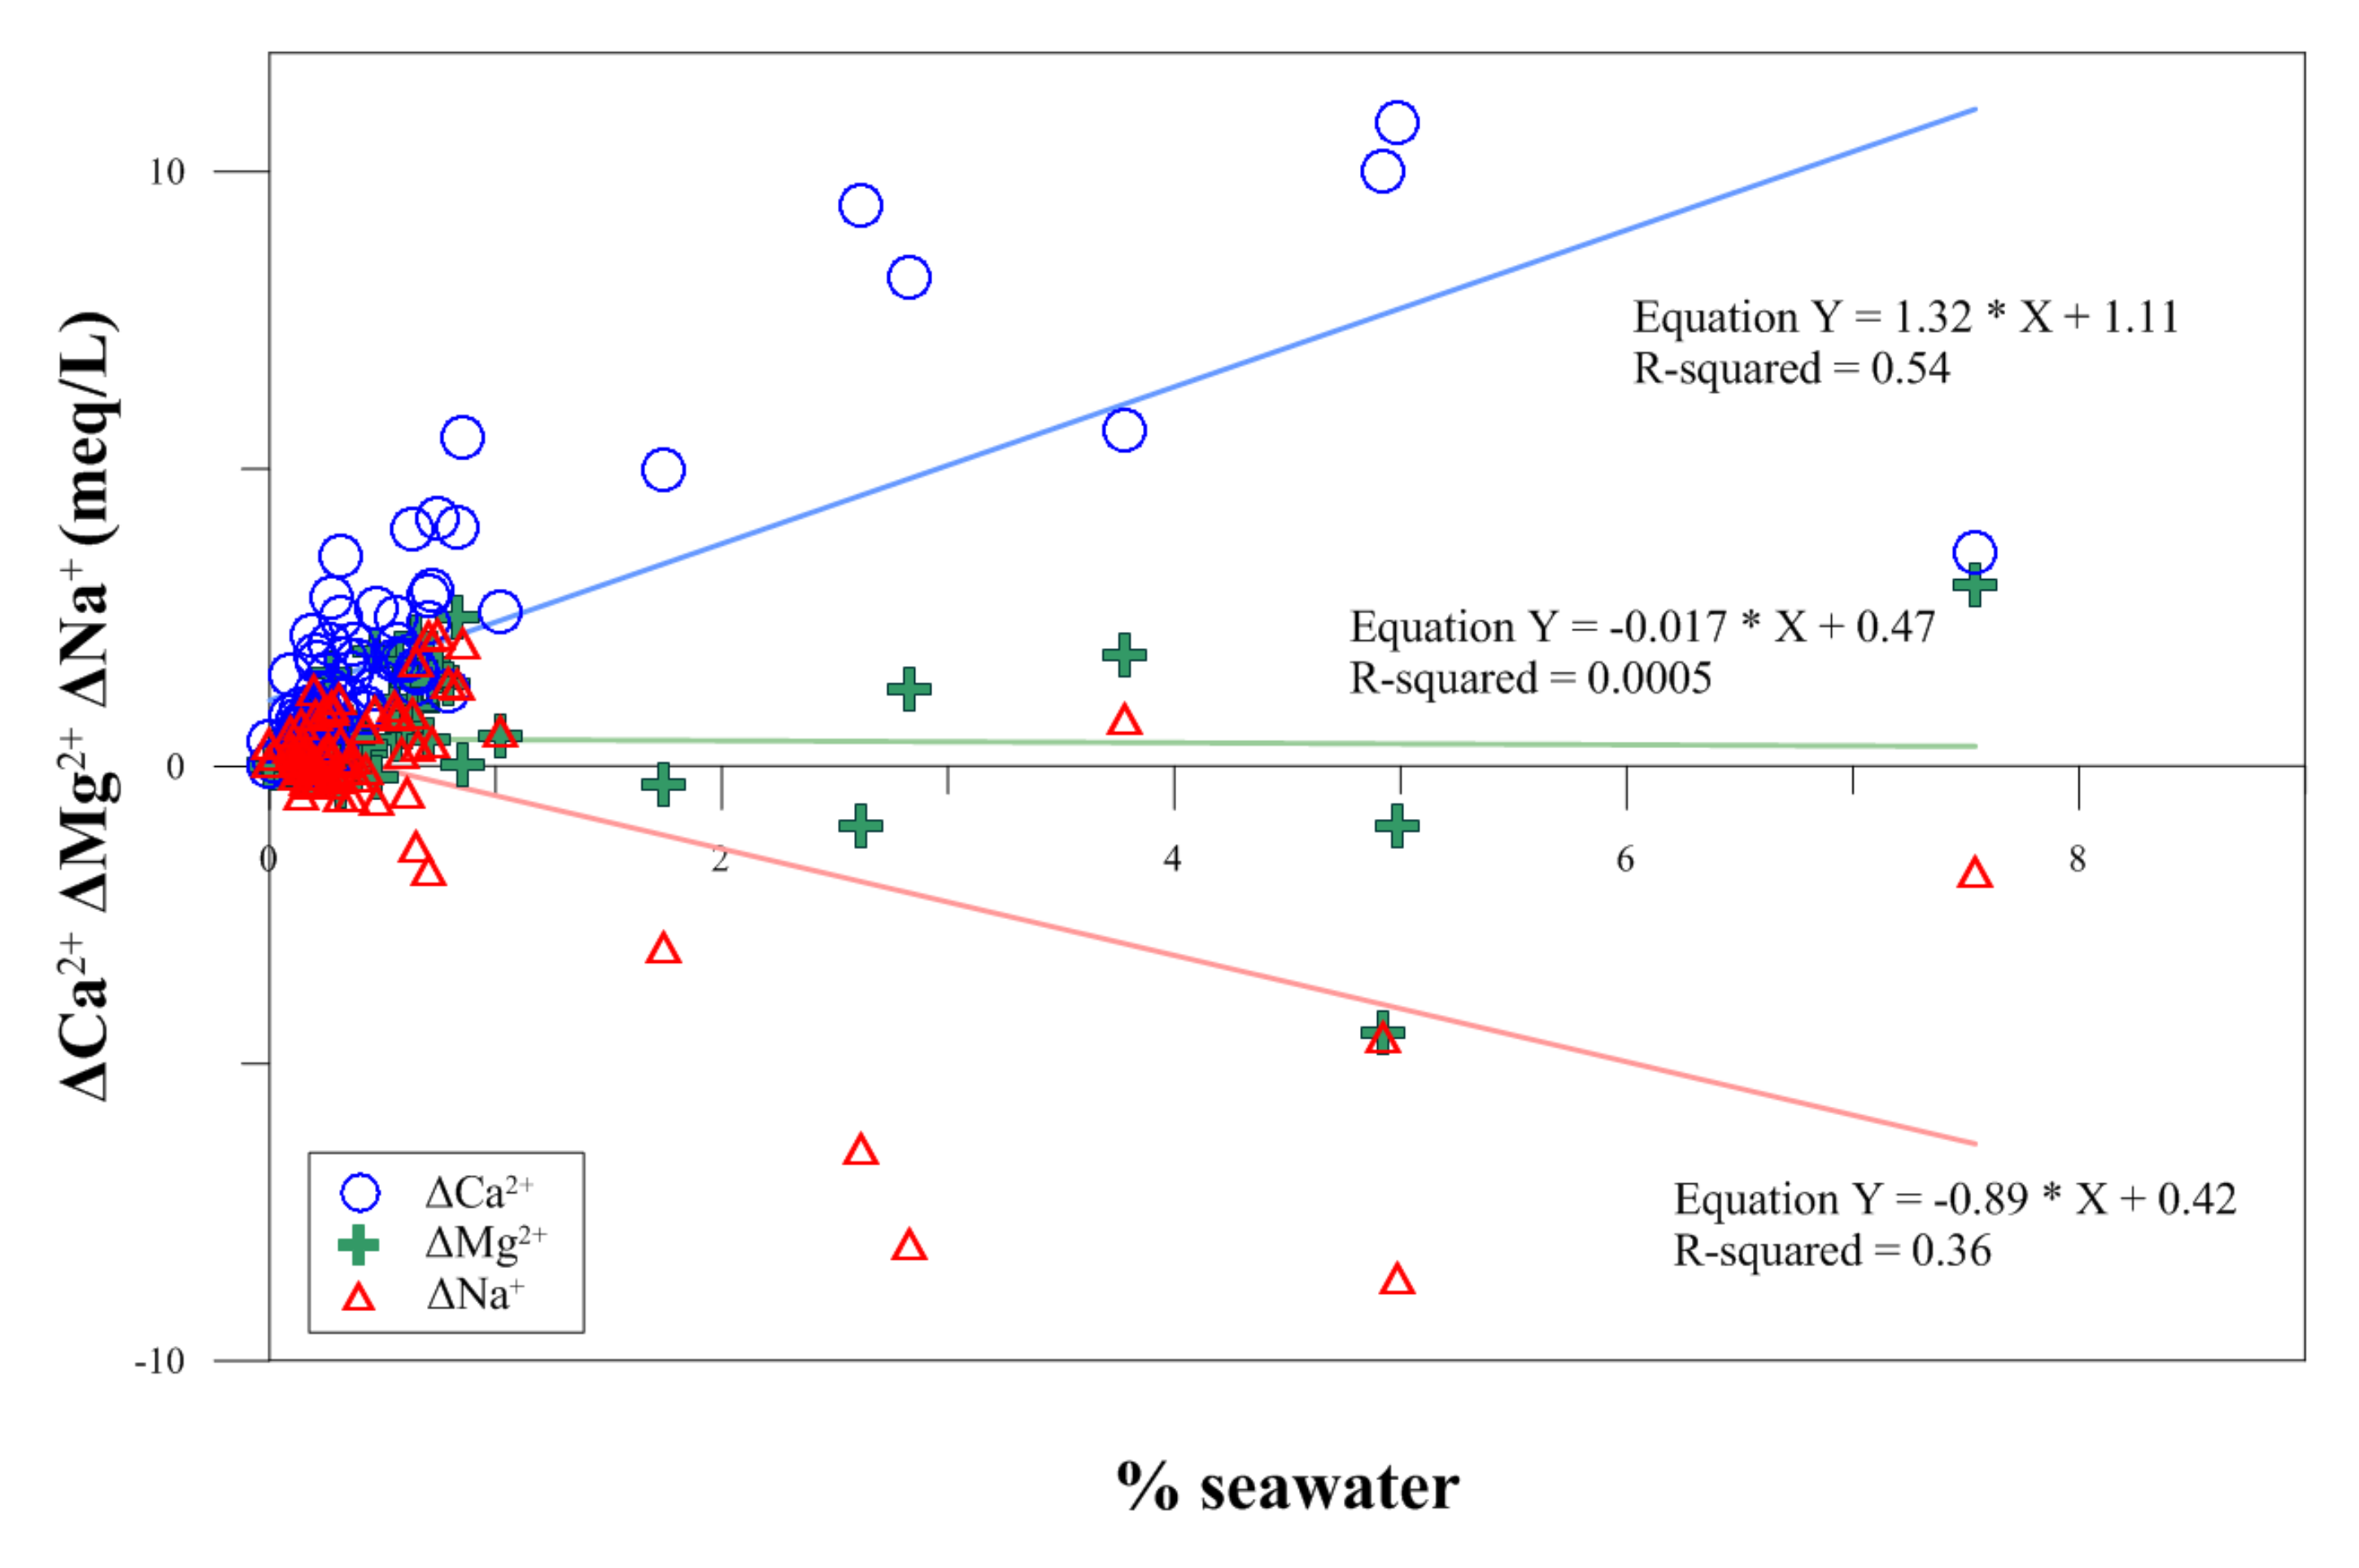
4.2. Hydrogeochemical Processes by Seawater Intrusion

Figure 9 presents the relationship between ΔCa2+, ΔMg2+ vs. ΔNa+ + ΔK+. The data located in second and fourth quadrants (the blue area) explain the cation exchange process. In the second quadrant, Mg2+ or Ca2+ is exchanged by Na+ or K+ while in the fourth quadrant the reverse process occurs. The external sources (dissolution) or sinks (precipitation) play an important role in controlling the concentrations of ions in groundwater at the first and third quadrants. In the first quadrant, the input of ions would induce the exchange of this input ion with other cations adhered on the surface of sediment and subsequently release the ions into groundwater, resulting in the positive ionic delta (Δ) values for all cations. The third quadrant describes the net removal process of ions from groundwater, such as precipitation of minerals in the aquifer. For instance, if Mg2+ or Ca2+ precipitates as dolomite or calcite, respectively, then Mg2+ or Ca2+ in the groundwater decreases. To compensate the solution, the Mg2+ or Ca2+ on the sediment exchanger will desorb into the groundwater. In this study, the enrichment of all cations is observed except cation exchange between Na+ or K+ and Ca2+ (second quadrant in Figure 9b). The enrichment of all cations is caused by both mixing between seawater and groundwater and water–rock interactions.
The cation exchange is one of the most important reactions in the soil and governs the change of matter, migration, and weathering of minerals. It also has an important relationship with soil physical properties and nutrient supply. The following reactions occur in cation exchange:
2 Na + + Ca X 2 2 Na X + Ca 2 +
2 Na + + Mg X 2 2 Na X + Mg 2 +
In this case, X is a soil ion exchanger. When groundwater and seawater are mixed in an aquifer, an ion-exchange reaction occurs between Ca2+, Mg2+, and Na+ until the Na+ concentration of seawater-intruded groundwater is saturated due to seawater. Overall, all the ionic deltas are positive (ΔNa+ + ΔK+ > 0, ΔMg2+ > 0, and ΔCa2+ > 0), which cannot simply be attributed to the ion exchange. The same phenomenon can also be found in the sandy aquifer at the coastal area of Zealand, Denmark, which can be explained by the external input of Ca2+ into the water due to dissolution calcite minerals in the aquifer [3]. However, calcite precipitation was not observed in our study area because the aquifers are mostly weathered granite, being unsaturated with respect to calcium ion.
The relationship between the seawater mixing ratio (X) and the ionic delta (Y) value of each ion is shown in Figure 10. In the case of ΔCa2+, it increased as the mixing ratio increased, while ΔNa+ showed a tendency to decrease. Since Na+ and Ca2+ participated in a cation exchange reaction, the Na ions were adsorbed by ion exchangers and Ca2+ was released, so that as the seawater mixing ratio increased, ΔCa2+ increased and ΔNa+ decreased. It was found that the ionic delta value of each ion had a mixing ratio and specific tendency according to the change in mixing ratio value before the constant value of the seawater mixing ratio saturated with Na2+. Liu et al. [3] reported different result from ours, which was a simultaneous increase or decrease of ΔCa2+ and ΔNa+ + ΔK+. Both ΔCa2+ and ΔNa+ increased and then decreased with the increase of the seawater fraction. They ascribed the similar trend due to hydrological variations caused by heavy rainfall. When the seawater mixed with fresh groundwater, additional Na+ may arouse the cation exchange with Ca2+ very quickly. In our work period, the mixing ratio was less than 10%, which is relatively small compared to other seawater intrusion studies [3,49]. Additional research should be conducted in the study area since it should be possible to determine the contribution of each ion participating in the geochemical reaction depending on the seawater mixing ratio.

5. Conclusions

The purpose of this study was to investigate the effect of seawater on the groundwater in the study area by examining the characteristics of groundwater quality in the archipelago of South Korea. To determine whether seawater intrusion occurred in the study area, a total of 74 groundwater samples were classified into water quality type and by their Cl/HCO3 molar ratio. Based on the Cl/HCO3 molar ratio, 40 samples out of 74 (54.1%) had a value of 2.8 or more, indicating severe and very severe effects of seawater.
Using the EMMA analysis with either Cl or Br ion, the mixing ratio using Cl ion was in the range of 0–10.4% with a mean value of 1.0%, a standard deviation of 1.6%, and an uncertainty with an average value of 0.02%. In the case of Br ion, the mixing ratio was in the range of 0–7.6% with an average value of 0.6% and a standard deviation of 1.2%. From the PCA, it can be seen that the influence of seawater occupied the first component of 54.1% and that the samples with a large mixing ratio of seawater were shown to be in the region where seawater has a lot of influence. An ion-exchange reaction proceeded by calculating the ionic delta indicates seawater intrusion and cation exchange. In the case of ΔCa2+, it increased as the mixing ratio increased, while ΔNa+ showed a tendency to decrease. Since Na+ and Ca2+ participated in a cation exchange reaction, the Na ions were adsorbed by ion exchangers and Ca2+ was released, so that as the seawater mixing ratio increased, ΔCa2+ increased and ΔNa+ decreased.
It was found that the ionic delta value of each ion had a mixing ratio and specific tendency according to the change in mixing ratio value before the constant value of the seawater mixing ratio saturated with Na2+. Although this should be investigated further, it nevertheless shows that there is a specific trend between the ionic deltas and mixing ratios of the ions when associated with the seawater mixing ratio among the ions participating in the geochemical reaction. It should be possible to grasp the contribution of each ion in the geochemical reaction depending on the seawater mixing ratio. Due to the limitation of proximity to the islands, we were not able to relate the hydrological properties to the seawater intrusion. The degrees of mixing between seawater and fresh groundwater can be affected by the precipitation amount, which results in the changes of cation exchange found in this work.

Author Contributions

K.S. was responsible for the implementation of the reference collection, processing, and writing of the manuscript. D.-C.K. initiated this study and provided constructive comments and funding. H.J. provided constructive comments for this manuscript. J.L. was responsible for designing and analyzing the work. All authors have read and agreed to the published version of the manuscript.

Funding

This work was supported by the Basic Research Project (15-3420) of the Korea Institute of Geoscience and Mineral Resources (KIGAM) funded by the Ministry of Science, ICT, and Future Planning, and partially supported by a research grant KIMST20190361 from the Korean Ministry of Oceans and Fisheries.

Acknowledgments

We are grateful to Min Joe Cho for supporting the administration of the project and to staff of Hanseo Engineering for their hard work in the field investigations.

Conflicts of Interest

The authors declare no conflict of interest.

References

  1. Andersen, M.S.; Nyvang, V.; Jakobsen, R.; Postma, D. Geochemical processes and solute transport at the seawater/freshwater interface of a sandy aquifer. Geochim. Cosmochim. Acta 2005, 69, 3979–3994. [Google Scholar] [CrossRef]
  2. Werner, A.D.; Simmons, C.T. Impact of sea-level rise on sea water intrusion in coastal aquifer. Groundwater 2009, 47, 197–204. [Google Scholar] [CrossRef] [PubMed]
  3. Liu, Y.; Jiao, J.J.; Liang, W.; Kuang, X. Hydrogeochmical characteristics in coastal groundwater mixing zone. Appl. Geochem. 2017, 85, 49–60. [Google Scholar] [CrossRef]
  4. Kazakis, N.; Pavlou, A.; Vargemezis, G.; Voudouris, K.S.; Soulios, G.; Pliakas, F.; Tsokas, G. Seawater intrusion mapping using electrical resistivity tomography and hydrochemical data. An application in the coastal area of eastern Thermaikos Gulf, Greece. Sci. Total Environ. 2016, 543, 373–387. [Google Scholar] [CrossRef] [PubMed]
  5. Alfarrah, N.; Walraevens, K. Groundwater overexploitation and seawater intrusion in coastal areas of arid and semi-arid regions. Water 2018, 10, 143. [Google Scholar] [CrossRef] [Green Version]
  6. Mahlknecht, J.; Merchan, D.; Rosner, M.; Meixner, A.; Ledesma-Ruiz, R. Assessing seawater intrusion in an arid coastal aquifer under high anthropogenic influence using major constituents, Sr and B isotopes in groundwater. Sci. Total Environ. 2017, 587, 282–295. [Google Scholar] [CrossRef]
  7. Mondal, N.C.; Singh, V.P.; Singh, V.S.; Saxena, V.K. Determining the interaction between groundwater and saline water through groundwater major ions chemistry. J. Hydrol. 2010, 388, 100–111. [Google Scholar] [CrossRef]
  8. Vallejos, A.; Daniele, L.; Sola, F.; Molina, L.; Pulido-Bosch, A. Anthropic-induced salinization in a dolomite coastal aquifer. Hydrogeochemical processes. J. Geochem. Explor. 2020, 209, 106438. [Google Scholar] [CrossRef]
  9. Sánchez-Martos, F.; Pulido-Bosch, A.; Molina-Sánchez, L.; Vallejos-Izquierdo, A. Identification of the origin of salinization in groundwater using minor ions (Lower Andarax, Southeast Spain). Sci. Total Environ. 2002, 297, 43–58. [Google Scholar] [CrossRef]
  10. Vengosh, A.; Rosenthal, E. Saline groundwater in Israel: Its bearing on the water crisis in the country. J. Hydrol. 1994, 156, 389–430. [Google Scholar] [CrossRef]
  11. Giménez-Forcada, E.; Bencini, A.; Pranzini, G. Hydrogeochemical considerations about the origin of groundwater salinization in some coastal plains of Elba Island (Tuscany, Italy). Environ. Geochem. Health 2010, 32, 243–257. [Google Scholar] [CrossRef] [PubMed]
  12. Singaraja, C.; Chidambaram, S.; Prasanna, M.V.; Thivya, C.; Thilagavathi, R. Statistical analysis of the hydrogeochemical evolution of groundwater in hard rock coastal aquifers of Thoothukudi district in Tamil Nadu, India. Environ. Earth Sci. 2014, 71, 451–464. [Google Scholar] [CrossRef]
  13. Chang, S.W. A review of recent research into coastal groundwater problems and associated case studies. J. Eng. Geol. 2014, 24, 597–608. [Google Scholar] [CrossRef] [Green Version]
  14. Cruz, J.V.; Coutinho, R.; Pacheco, D.; Cymbron, R.; Antunes, P.; Freire, P.; Mendes, S. Groundwater salinization in the Azores archipelago (Portugal). Environ. Earth Sci. 2011, 62, 1273–1285. [Google Scholar] [CrossRef]
  15. Ministry of Land, Infrastructure and Transportation (MOLIT); K-Water and Korea Institute of Geoscience and Mineral Resources (KIGAM). Report On the Basic Groundwater Investigation of Shinan; MOLIT: Sejong, Korea, 2005. (In Korean)
  16. Jeen, S.W.; Kim, J.M.; Ko, K.S.; Yum, B.W.; Chang, H.W. Hydrogeochemical characteristics of groundwater in a mid-western coastal aquifer system, Korea. Geosci. J. 2001, 5, 339–348. [Google Scholar] [CrossRef]
  17. Lee, J.H.; Kim, J.H.; Kim, H.-M.; Chang, H.W. Statistical approach to determine the salinized ground water flow path and Hydrogeochemical features around the underground LPG cavern, Korea. Hydrol. Process. 2007, 21, 3615–3626. [Google Scholar] [CrossRef]
  18. Lee, B.J.; Moon, S.H. Integrated approach for evaluating the characteristics of seawater intrusion using factor analysis and time series analysis: Seocheon-Gunsan area. J. Geol. Soc. Korea 2008, 44, 219–232. [Google Scholar]
  19. Lee, J.Y.; Song, S.H. Groundwater chemistry and ionic ratios in a western coastal aquifer of Buan, Korea: Implication for seawater intrusion. Geosci. J. 2007, 11, 259–270. [Google Scholar] [CrossRef]
  20. Kim, J.H.; Kim, R.H.; Lee, J.; Chang, H.W. Hydrogeochemical characterization of major factors affecting the quality of shallow groundwater in the coastal area at Kimje in South Korea. Environ. Geol. 2003, 44, 478–489. [Google Scholar] [CrossRef]
  21. Kim, J.H.; Lee, J.H.; Cheong, T.J.; Kim, R.H.; Koh, D.C.; Ryu, J.S.; Chang, H.W. Use of time series analysis for the identification of tidal effect on groundwater in the coastal area of Kimje, Korea. J. Hydrol. 2005, 300, 188–198. [Google Scholar] [CrossRef]
  22. Kim, R.H.; Kim, J.H.; Ryu, J.S.; Chang, H.W. Salinization properties of a shallow groundwater in a coastal reclaimed area, Yeonggwang, Korea. Environ. Geol. 2006, 49, 1180–1194. [Google Scholar] [CrossRef]
  23. Lee, B.J.; Hwang, S.H. Evaluation of characteristics of seawater intrusion based on the groundwater fluctuations: Baksu area, Yeonggwang-gun. J. Geol. Soc. Korea 2008, 44, 232–240. [Google Scholar]
  24. Park, K.G.; Shin, J.H.; Hwang, S.H.; Park, I.H. Fresh water injection test to mitigate seawater intrusion and geophysical monitoring in coastal area. Korean Soc. Earth Explor. Geophys. 2007, 10, 353–360. [Google Scholar]
  25. Park, Y.Y.; Lee, J.Y.; Kim, J.H.; Song, S.H. National scale evaluation of groundwater chemistry in Korea coastal aquifers: Evidences of seawater intrusion. Environ. Earth Sci. 2012, 66, 707–718. [Google Scholar] [CrossRef]
  26. Na, C.K.; Son, C.I. Groundwater quality and pollution characteristics at Seomjin river basin: Pollution source and risk assessment. Econ. Environ. Geol. 2005, 35, 261–272. [Google Scholar]
  27. Kim, H.J.; Hamm, S.Y.; Cheong, J.Y.; Lee, J.H. Characteristics of groundwater contamination caused by seawater intrusion and agricultural activity in sacheon and hadong areas, Republic of Korea. Econ. Environ. Geol. 2009, 42, 575–589. [Google Scholar]
  28. Kim, C.S.; Kim, K.S.; Bae, D.S.; Song, S.H. Hydrogeological characteristics of seawater intrusion in the coastal area. J. Korean Soc. Groundw. Environ. 1997, 4, 61–72. [Google Scholar]
  29. Lee, J.H.; Kim, R.H.; Chang, H.W. Interaction between groundwater quality and hydraulic head in an area around an underground LPG storage cavern, Korea. Environ. Geol. 2002, 13, 901–912. [Google Scholar] [CrossRef]
  30. Shin, I.H.; Park, C.Y.; Ahan, K.S.; Jeong, Y.J. Hydrogeochemistry of Groundwaters at the Gogum island area in Jeonnam, Korea. J. Korean Earth Sci. Soc. 2002, 23, 474–485. [Google Scholar]
  31. Lee, Y.H.; Hong, W.H.; Lee, J.S. The vulnerability assessment of water supply through the analysis of emergency water shortage in cut off water supply-prone island area. J. Archit. Inst. Korea Plan. Des. 2014, 30, 253–260. [Google Scholar] [CrossRef]
  32. Hwang, S.H.; Park, K.G.; Shin, J.H.; Lee, S.K. Relationship between the groundwater resistivity and NaCl equivalent salinity in western and southern coastal areas, Korea. Geophys. Geophys. Explor. 2007, 10, 361–368. [Google Scholar]
  33. Song, S.H.; Lee, J.Y.; Yi, M.J. Evaluation of long-term data obtained from seawater intrusion monitoring network using variation type analysis. J. Korean Earth Sci. Soc. 2007, 28, 478–490. [Google Scholar] [CrossRef] [Green Version]
  34. Park, S.C.; Yun, S.T.; Chae, G.T.; Yoo, I.S.; Shin, K.S.; Heo, C.H.; Lee, S.K. Regional hydrochemical study on salinization of coastal aquifers, western coastal area of South Korea. J. Hydrol. 2005, 313, 182–194. [Google Scholar] [CrossRef]
  35. Kim, Y.J.; Lee, K.S.; Koh, D.C.; Lee, D.H.; Lee, S.G.; Park, W.B.; Koh, G.W.; Woo, N.C. Hydrogeochemical and isotopic evidence of groundwater salinization in a coastal aquifer: A case study in Jeju volcanic island, Korea. J. Hydrol. 2003, 270, 282–294. [Google Scholar] [CrossRef]
  36. Kim, K.H.; Shin, J.Y.; Koh, E.H.; Koh, G.W.; Lee, K.K. Sea level rise around Jeju Island due to global warming and movement of groundwater/seawater interface in the eastern part of Jeju Island. J. Soil Groundw. Environ. 2009, 14, 68–79. [Google Scholar]
  37. Youn, J.S.; Park, S.W. Hydrochemical characteristics of spring water in Cheju Island. J. Korean Soc. Groundw. Environ. 1998, 5, 66–79. [Google Scholar]
  38. Oh, T.G.; Kim, Y.J.; Kim, K.S.; Kim, S.R. Nitrate and chloride characteristics in the groundwater in Jeju area. J. Environ. Res. 2006, 3, 1–14. [Google Scholar]
  39. Park, N.S.; Koh, B.R.; Lim, Y.D. Impacts of fresh and saline groundwater development in Sungsan watershed, Jeju Island. J. Korea Water Resour. Assoc. 2013, 46, 783–794. [Google Scholar] [CrossRef] [Green Version]
  40. Woo, N.C.; Kim, H.D.; Lee, K.S.; Park, W.B.; Koh, G.W.; Moon, Y.S. Interpretation of groundwater system and contamination by water-quality monitoring in the Daejung watershed, Jeju Island. Econ. Environ. Geol. 2001, 34, 485–498. [Google Scholar]
  41. Chae, G.T.; Yun, S.T.; Yun, S.M.; Kim, K.H.; So, C.S. Seawater-freshwater mixing and resulting calcite dissolution: An example from a coastal alluvial aquifer in eastern South Korea. Hydrol. Sci. J. 2012, 57, 1672–1683. [Google Scholar] [CrossRef] [Green Version]
  42. Lee, J.; Ko, K.S.; Kim, J.M.; Chang, H.W. Multivariate statistical analysis of underground gas storage caverns on groundwater chemistry in Korea. Hydrol. Process. 2008, 22, 3410–3417. [Google Scholar] [CrossRef]
  43. Ko, K.S.; Lee, J.; Lee, K.K.; Chang, H.W. Multivariate statistical analysis for groundwater mixing ratios around underground storage caverns in Korea. Carbonates Evaporites 2010, 25, 35–42. [Google Scholar] [CrossRef]
  44. Kim, J.M.; Lee, J. Time series analysis for evaluating hydrological responses of pore-water pressure to rainfall in a slope. Hydrol. Sci. J. 2017, 62, 1412–1421. [Google Scholar] [CrossRef]
  45. Laaksoharju, M.; Skårman, C.; Skårman, E. Multivariate mixing and mass balance (M3) calculations, a new tool for decoding hydrogeochemical information. Appl. Geochem. 1999, 14, 861–871. [Google Scholar] [CrossRef]
  46. Stetzenbach, K.J.; Farnham, I.M.; Hodge, V.F.; Johannesson, K.H. Using multivariate statistical analysis of groundwater major cation and trace element concentrations to evaluate groundwater flow in a regional aquifer. Hydrol. Process. 1999, 13, 2655–2673. [Google Scholar] [CrossRef]
  47. Rencher, A.C. Methods of Multivariate Analysis; Wiley Series in Probability and Mathematical Statistics: Probability and Mathematical Statistics Section; John Wiley & Sons, Inc.: Hoboken, NJ, USA, 1995; ISBN 0471-571-520. [Google Scholar]
  48. Zghibi, A.; Zouhri, L.; Tarhouni, J.; Kouzana, L. Groundwater mineralization processes in Mediterranean semi-arid systems (Cap-Bon, North east of Tunisia): Hydrogeological and geochemical approaches. Hydrol. Process. 2013, 27, 3227–3239. [Google Scholar]
  49. Argamasilla, M.; Barberá, J.A.; Andreo, B. Factors controlling groundwater salinization and hydrogeochemical processes in coastal aquifers from southern Spain. Sci. Total Environ. 2017, 580, 50–68. [Google Scholar] [CrossRef]
  50. Revelle, R. Criteria for recognition of seawater in groundwater. Trans. Am. Geophys. Union 1941, 22, 593–597. [Google Scholar] [CrossRef]
  51. Faye, S.; Maloszewski, P.; Stichler, W.; Trimborn, P.; Faye, S.C.; Gaye, C.B. Groundwater salinization in the Saloum (Senegal) delta aquifer: Minor elements and isotopic indicators. Sci. Total Environ. 2005, 343, 243–259. [Google Scholar] [CrossRef]
  52. Giménez, E.; Morell, I. Hydrogeochemical analysis of salinization processes in the coastal aquifer of Oropesa (Castellon, Spain). Environ. Geol. 1997, 29, 118–131. [Google Scholar] [CrossRef]
  53. Santucci, L.; Carol, E.; Kruse, E. Identification of palaeo-seawater intrusion in groundwater using minor ions in a semi-confined aquifer of the Río de la Plata littoral (Argentina). Sci. Total Environ. 1640, 566, 1640–1648. [Google Scholar] [CrossRef] [PubMed]
  54. Lee, J.; Koh, D.C.; Choo, M.K. Influences of fractionation of stable isotopic composition of rain and snowmelt on isotopic hydrograph separation. J. Korean Earth Sci. Soc. 2014, 35, 97–103. [Google Scholar] [CrossRef] [Green Version]
Figure 1. A geologic map and the current and previous study sites [16,17,18,19,20,21,22,23,24,25,26,27,28,29,30,31,32,33,34,35,36,37,38,39,40,41] for seawater intrusion in Korea. W, S, and E indicate the western, southern, and eastern parts of Korea.
Water 12 01542 g001
Figure 2. (a) A box-and-whisker plot showing monthly precipitation by the administrative district in the study area and a plot showing the monthly highest and lowest tide levels; (b) a plot of the daily precipitation during groundwater sampling periods.
Water 12 01542 g002
Figure 3. The groundwater level (m amsl) in (a) the dry season (17th, January 2005–1st, February 2005) and (b) the wet season (9th–13th, August 2005).
Water 12 01542 g003
Figure 4. A plot of the relationship between the Cl/HCO3 and Na+/Cl molar ratios.
Water 12 01542 g004
Figure 5. A diagram of the principal component analysis (PCA) using the chemical composition of the groundwater samples.
Water 12 01542 g005
Figure 6. (a) A Piper diagram of the groundwater and the seawater and (b) a bar chart of classification according to water quality type.
Water 12 01542 g006
Figure 7. The major ions in groundwater and their relationship with Br. The dotted line represents the mixing line between fresh groundwater and seawater.
Water 12 01542 g007
Figure 8. A plot showing the mixing ratio using Cl ions vs. Br ions.
Water 12 01542 g008
Figure 9. (a) ΔMg2+ and (b) ΔCa2+ plotted vs. (ΔNa+ + ΔK+) for each sample to show the mechanism by which major cations participate in the coastal groundwater mixing zone.
Water 12 01542 g009
Figure 10. Plots of ΔCa2+, ΔMg2+, and ΔNa+ vs. the percentage of seawater equal to the mixing ratio using Br ions.
Water 12 01542 g010
Table 1. The statistical data for the analyzed groundwater samples.
pHTemp.Electrical Conductivity (EC)Total Dissolved Solids (TDS)Na+K+Ca2+Mg2+ClHCO3SO42−NO3Br
(°C)(uS/cm)(mg/L)
Min.5.314.712072.79.30.32.51.613.65.93.30.20.003
Median6.416.9513.5335.642.12.43210.473.743.719.744.20.2
Max.8.420.748002870737.285238.5133.61554.7445.9322.73335.19
Mean6.617.2778.2479.175.66.145.915.9154.463.433.358.50.44
Standard Deviation0.61.33805.2460.3107.511.648.419.2243.66447.560.90.79
Table 2. Loadings of the first two PCs in groundwater samples (large values in bold).
VariablesPC 1PC 2
TDS0.370.03
EC0.370.03
Cl0.360.00
Ca2+0.30−0.27
Mg2+0.330.30
Na+0.360.05
K+0.100.02
SO42−0.320.01
Br0.330.04
HCO30.08−0.35
SiO20.030.33
NO30.030.54
F0.16−0.54
Table 3. The dissolved ion concentration data from the seawater used in this study.
Ca2+Mg2+Na+K+HCO3ClSO42−Br
(mg/L)
Kim et al. [35]383.11248.011,100.0405.2135.018,211.02646.064.7
Jeen et al. [16]381.01270.09350.0688.0141.019,300.02450.073.0
Mean382.11259.010,225.0546.6138.018,755.52548.068.9

