Article

A New Method for Rapid Measurement of Canal Water Table Depth Using Airborne LiDAR, with Application to Drained Peatlands in Indonesia

1
Deltares, P.O. Box 177, 2600 MH Delft, The Netherlands
2
Data for Sustainability, 4571 AK Axel, The Netherlands
3
NUS Environmental Research Institute (NERI), National University of Singapore, 5A Engineering Drive 1, #02-03 T-Lab Building, Singapore 117411, Singapore
4
PT Alas Rawa Khatulistiwa, Jl. M.H. Thamrin Kav. 28–30, Jakarta 10350, Indonesia
5
Asia Pulp and Paper Group, Sinar Mas Land Plaza, Jakarta 10350, Indonesia
6
Department of Water Resources of West Java Province, Jl. Braga 137, Bandung 40111, Indonesia
*
Authors to whom correspondence should be addressed.
Water 2020, 12(5), 1486; https://doi.org/10.3390/w12051486
Submission received: 20 March 2020 / Revised: 18 May 2020 / Accepted: 20 May 2020 / Published: 22 May 2020
(This article belongs to the Section Hydrology)

Abstract

:
Water management in lowland areas usually aims to keep water tables within a narrow range to avoid flooding and drought conditions. A common water management target parameter is the depth of the canal water table below the surrounding soil surface. We demonstrated a method that rapidly determines canal water table depth (CWD) from airborne LiDAR data. The water table elevation was measured as the minimum value determined in a grid of 100 m × 100 m applied to a 1 m × 1 m digital terrain model (DTM), and the soil surface was calculated as the median value of values in each grid cell. Results for areas in eastern Sumatra and West Kalimantan, Indonesia, were validated against 145 field measurements at the time of LiDAR data collection. LiDAR-derived CWD was found to be accurate within 0.25 m and 0.5 m for 86% and 99% of field measurements, respectively, with an R2 value of 0.74. We demonstrated the method for CWD conditions in a drained peatland area in Central Kalimantan, where we found CWD in the dry season of 2011 to be generally below −1.5 and often below −2.5 m indicating severely overdrained conditions. We concluded that airborne LiDAR can provide an efficient and rapid mapping tool of CWD at the time of LiDAR data collection, which can be cost-effective especially where LiDAR data or derived DTMs are already available. The method can be applied to any LiDAR-based DTM that represents a flat landscape that has open water bodies.

1. Introduction

Coastal lowland areas tend to be flat, with water tables that are near the soil surface. In their natural state, they are usually wetlands. Many such areas are drained to allow agriculture and human settlement, and the primary aim of water management in such conditions is often to prevent flooding. However, in wetland conservation areas and peatlands, the primary aim is often to prevent water tables from falling too low below the surface [1,2].
The coastal lowlands of Sumatra and Kalimantan in Indonesia alone measure some 19.4 Mha [3], with at least 11.2 Mha being peatland [4]. The impacts of peatland drainage in terms of carbon emissions, fire risk, soil subsidence, biodiversity loss and flood risk are well documented [2,5,6,7,8,9,10,11,12,13,14]. In response, initiatives are being developed to mitigate these problems through improved water management with a focus on raising water levels in peatlands [15]. To define appropriate interventions, accurate and up-to-date water level data are required. Given the very large scale of the area involved, monitoring water levels on the ground in all flood-prone lowlands and drainage-affected peatlands would require enormous resources and capacity. While ground measurements will probably always be needed, it will be necessary to have alternative data sources to understand actual water depth patterns over large areas.
In this study, we explored a new approach that utilizes the capability of LiDAR data to detect both surface water level in canals and ground surface level near canals, allowing the determination of canal water table depth (CWD) below the land surface. Although water typically absorbs the LiDAR near-infrared wavelength of 1064 nm [16,17], reflections of the pulse occur on the water surfaces caused by, amongst others, water turbidity [18], but also because of floating debris and/or plants.
The detection of water surfaces is an essential step in many classification workflows for LiDAR, often to remove them from the dataset to create a digital terrain model (DTM) that should present the land surface only. In a few cases, point cloud LiDAR data have also been used for surface water level measurement in ditches, rivers and reservoirs [16,17,19,20]. The objective of this study was to apply these principles and determine not only the canal water surface elevation (CWE) above mean sea level (MSL), but also, for the first time, the CWD below the surrounding soil surface, that is, the ‘freeboard’ that is a common target parameter in lowland water management practice.

2. Study Areas and Methods

2.1. Study Areas and LiDAR DTM Data

CWD validation was conducted in several areas in eastern Sumatra and West Kalimantan (Figure 1), applying local DTMs created from airborne LiDAR data collected in late 2017 (described in [21]) and August 2018. In these areas, it was possible to organize field measurements on the same day (plus/minus one day) as the LiDAR plane overpass.
After validation, the method was applied to a DTM, covering 744,000 ha of a lowland and peatland area in Central Kalimantan (Indonesia), that was created from full coverage LiDAR data collected in 2011 [21]. The area is part of what is commonly known as the Ex-Mega Rice Project area, which was deforested and drained in 1996. These peatlands remain largely unproductive, and have been burning frequently since 1997 [22,23], while the lowest lying mineral soil areas in some areas have been very flood prone to allow the production of rice or other crops. Apart from data availability, we selected this area as it allows the demonstration of conditions that require water table depth data for management improvements.

2.2. Determining Canal Locations

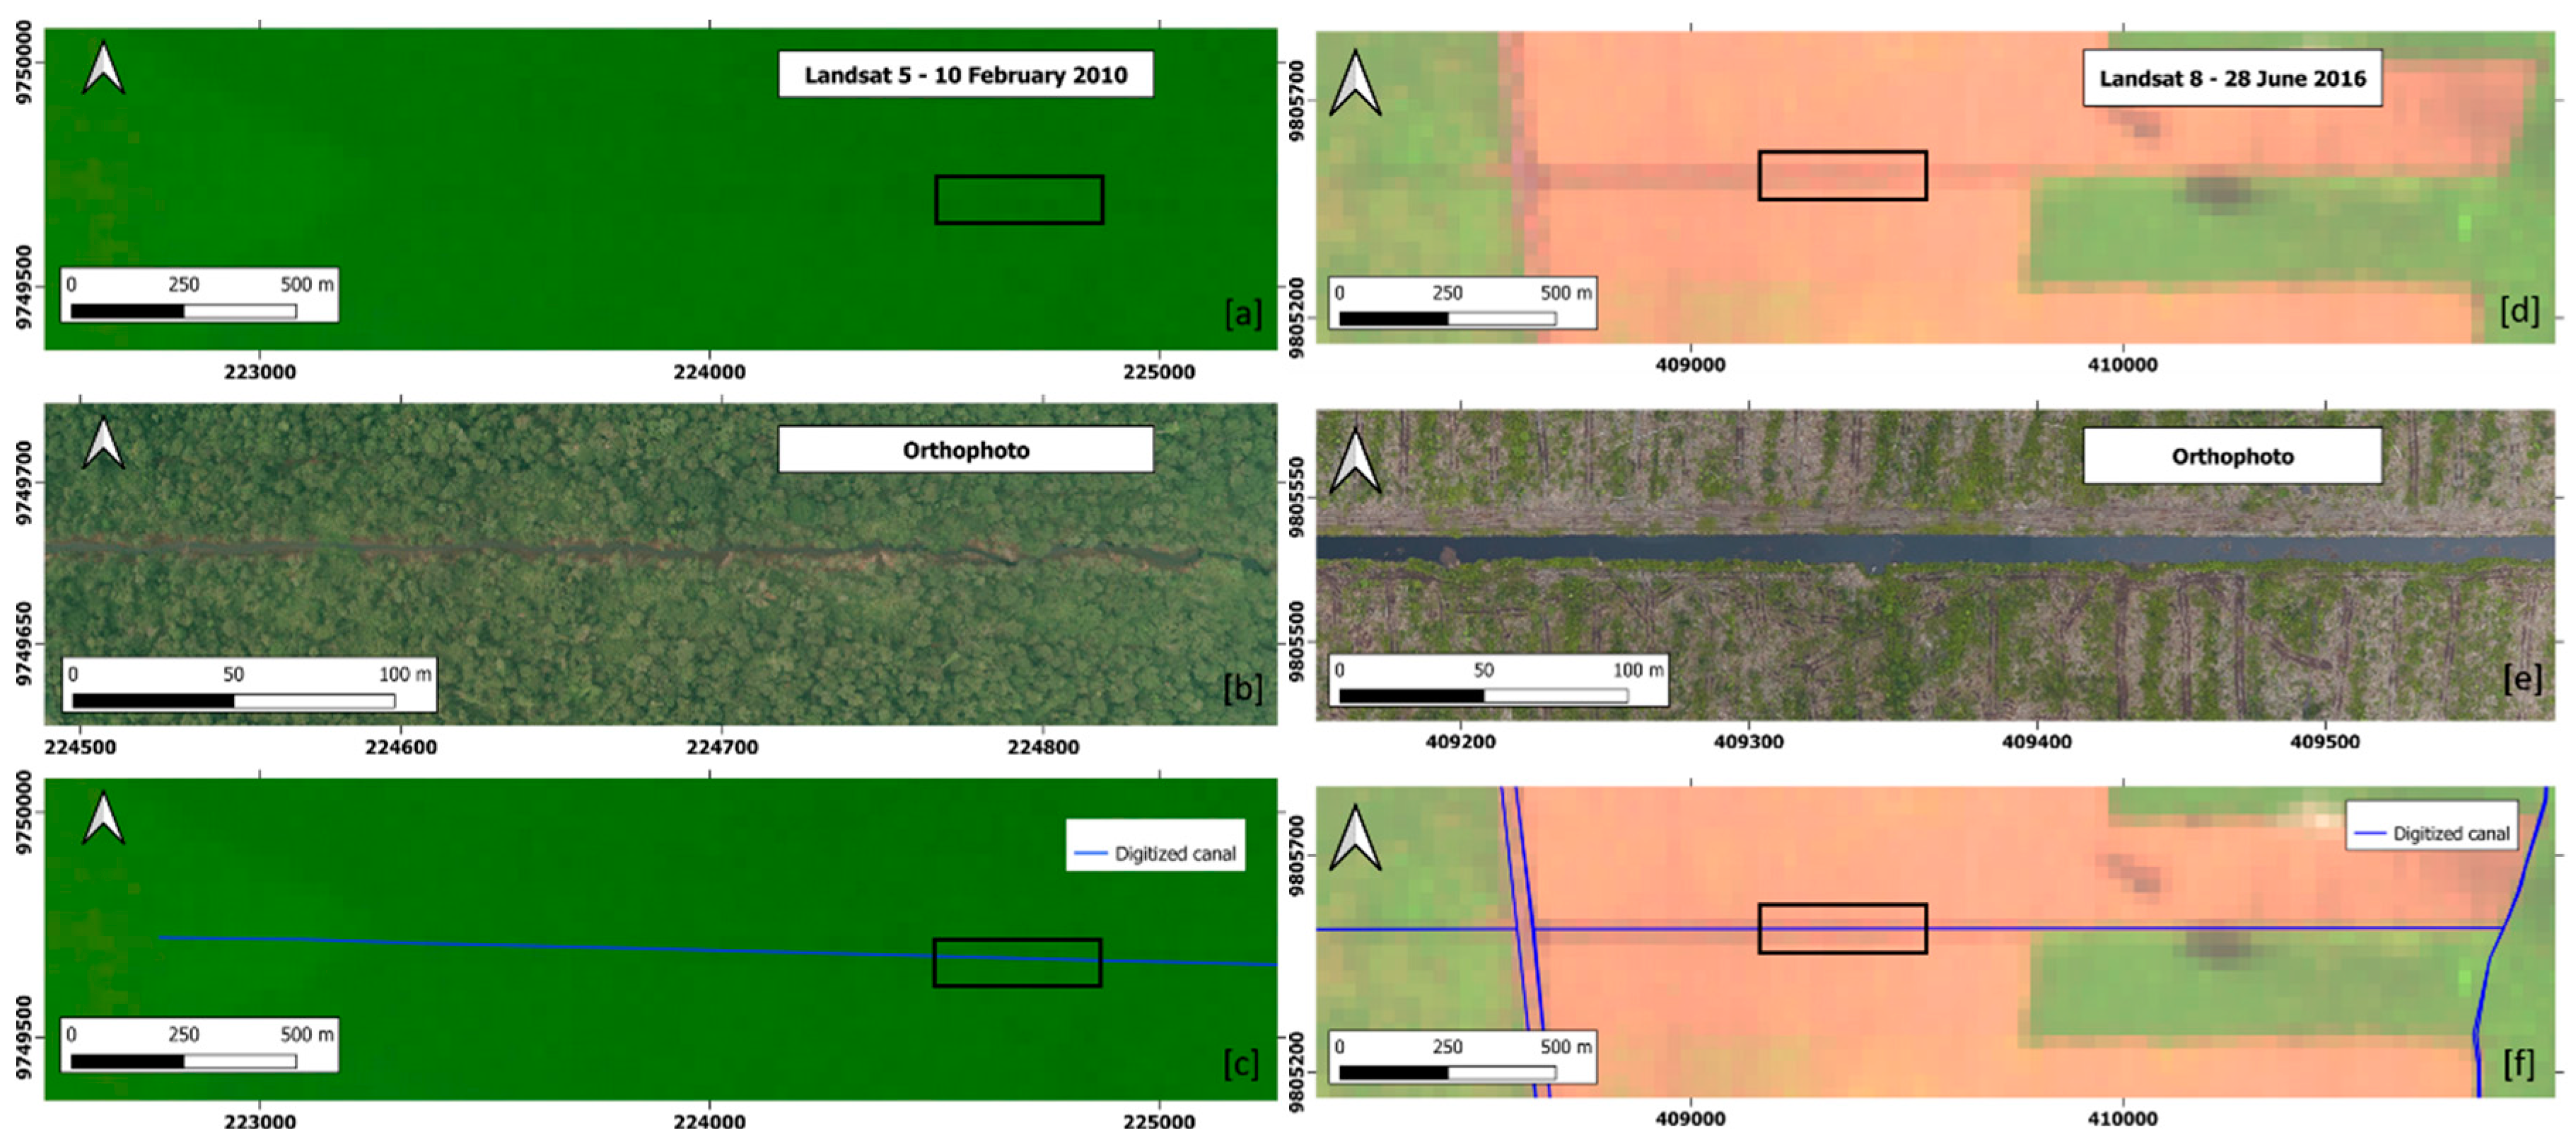
Canals were identified visually from Landsat images, supported by Google Earth and 10 cm resolution orthophotos where available, and the canal centerlines were mapped manually in GIS. From field checks and orthophoto analysis, we determined that such large canals, that were clearly visible in Landsat images (Figure 2), in this region were always over 3 m in width, excluding drains and ditches, and mostly between 5 and 10 m. Where canals were not or less visible because they were largely overgrown with vegetation over part of their length, as was often the case (Figure 2), the canal location was determined though interpolation.

2.3. Determining CWE

A grid of 100 m × 100 m cells was created to identify cells overlapping with canals. In each such cell, minimum values were determined from a DTM of 1 m × 1 m, representing the likely height of the canal water surface, that is, canal water surface elevation (CWE) above MSL. We note that this method is only applicable in flat lands.

2.4. Determining CWD

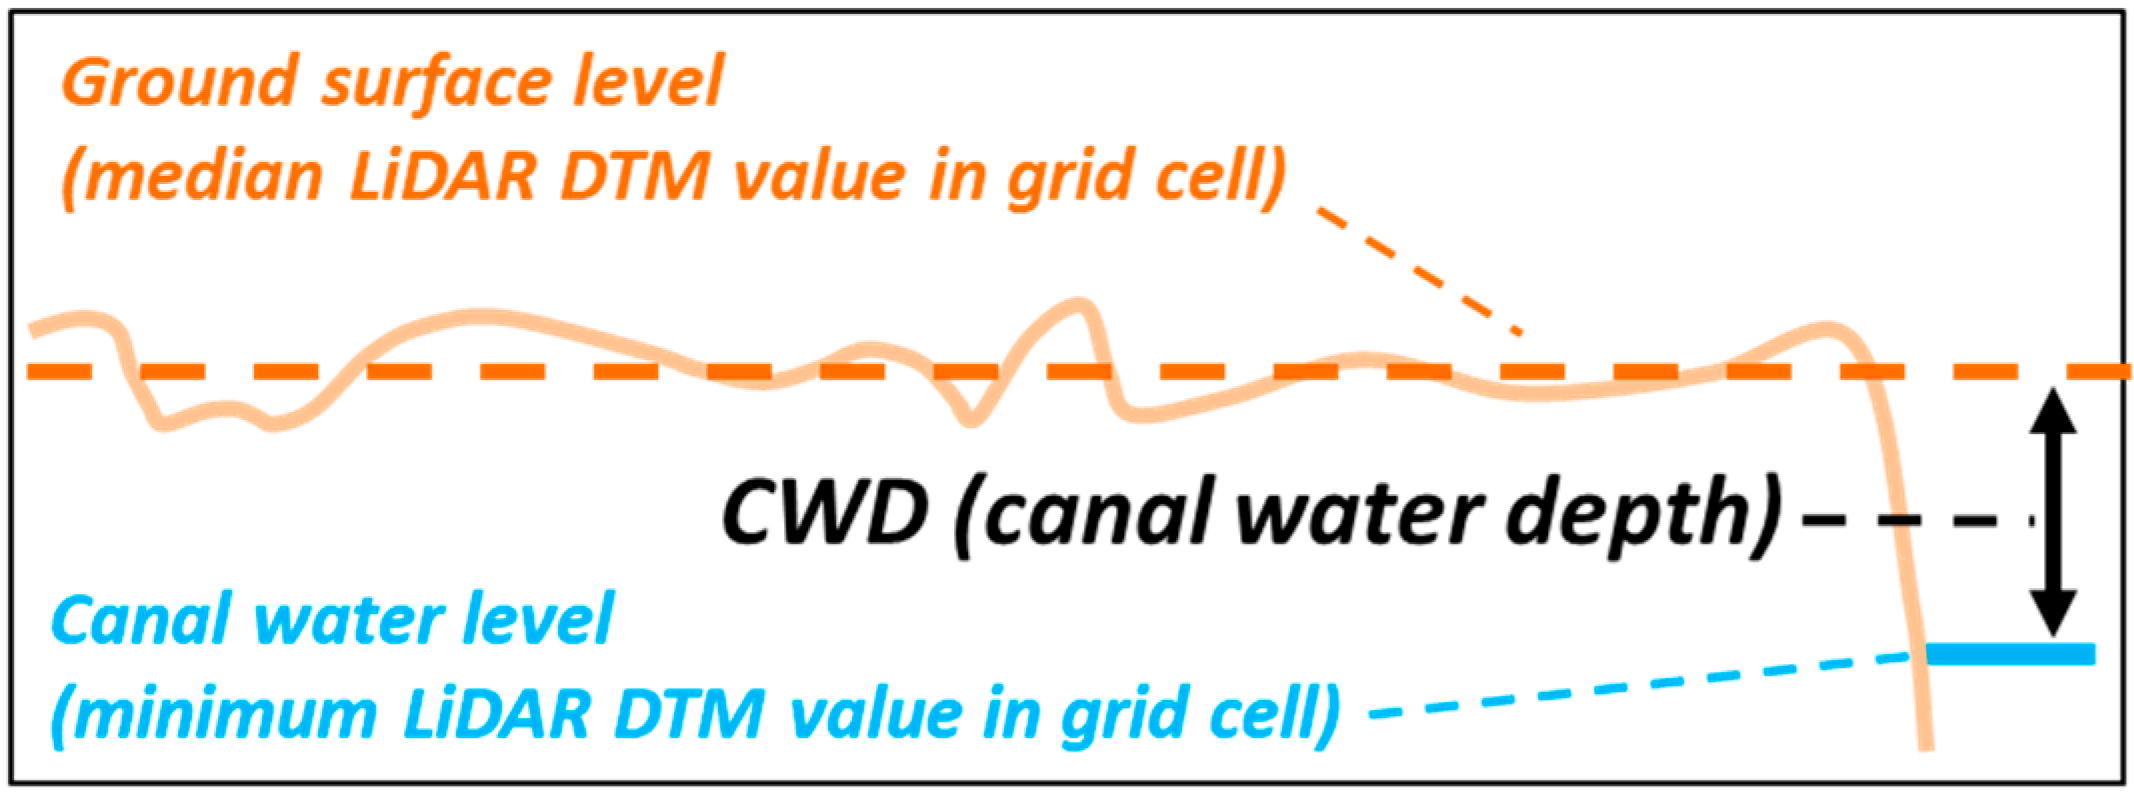
We derived canal water table depth (CWD), sometimes referred to as freeboard by water management practitioners, by subtracting the CWE from the DTM. For each cell in the same grid as applied for CWE mapping, the median DTM value was determined. This elevation was considered to represent ground surface. The difference between CWE and median DTM values was determined as a measure of the depth of the canal water table below the adjoining ground surface, that is, CWD, as illustrated in Figure 3.

2.5. Grid Cell Size Considerations

The 100 m × 100 m grid size was chosen based on the observation that larger canals tend to be at least 100 m apart in drainage and irrigation schemes in Indonesian lowlands. Cell sizes from 50 to 200 m were tested. It was found that applying a larger grid cell risked including several open water bodies with different water levels in one cell. A smaller cell increased the risk of not encountering suitable open water conditions that would allow water surface detection by LiDAR, and also of having a median value that did not represent the true general soil surface elevation, but rather the canal water level elevation. Given the difficulty in determining the precise location of largely overgrown canals, and the usual occurrence of surface disturbance around canals, a cell size of less than 50 meters was found to yield inaccurate results.

2.6. CWD Validation

LiDAR-derived CWD data collected in late 2017 and August 2018 were validated against field measurements for selected Acacia plantation locations in South Sumatra, Jambi, Riau and West Kalimantan provinces. A large number of different locations was required to obtain a sufficiently large number of field validation measurements by different teams because only a few measurements were possible at each individual location at the day of airborne LiDAR plane overpass (plus/minus one day). Each measurement took several hours, including access. In all, 29 separate field teams of 4 staff each contributed to ground measurements.
As canal water levels in these lowlands can fluctuate rapidly in time, the validation field measurements should ideally be on the same day of airborne data collection. However, as only a few ground measurements were done by one team in one day and the timing of plane movements can be somewhat unpredictable due to local weather and permit conditions, we also conducted measurements on the days before and after plane overpass.
At each validation site, canal surface water level was measured as well as ground surface level at ten locations, using an optical levelling instrument. To account for local topographic variations and to avoid canal embankments, ground surface level measurements were conducted in two clusters of five measurements with center points at 25 m from the canal on either side (Figure 4). Within clusters, measurements were 2.5–5.0 m apart. Care was taken to avoid the disturbed zone directly along the canal, where surface elevation will be affected most by dredging materials and excavator tracks. The median of ground surface measurements was calculated, and the CWD was determined by subtracting the canal water elevation measurement. For validation purposes, only single canals without other large canals nearby were selected (i.e., double roadside canals and junctions were excluded).

3. Results and Discussion

3.1. Validation of CWD

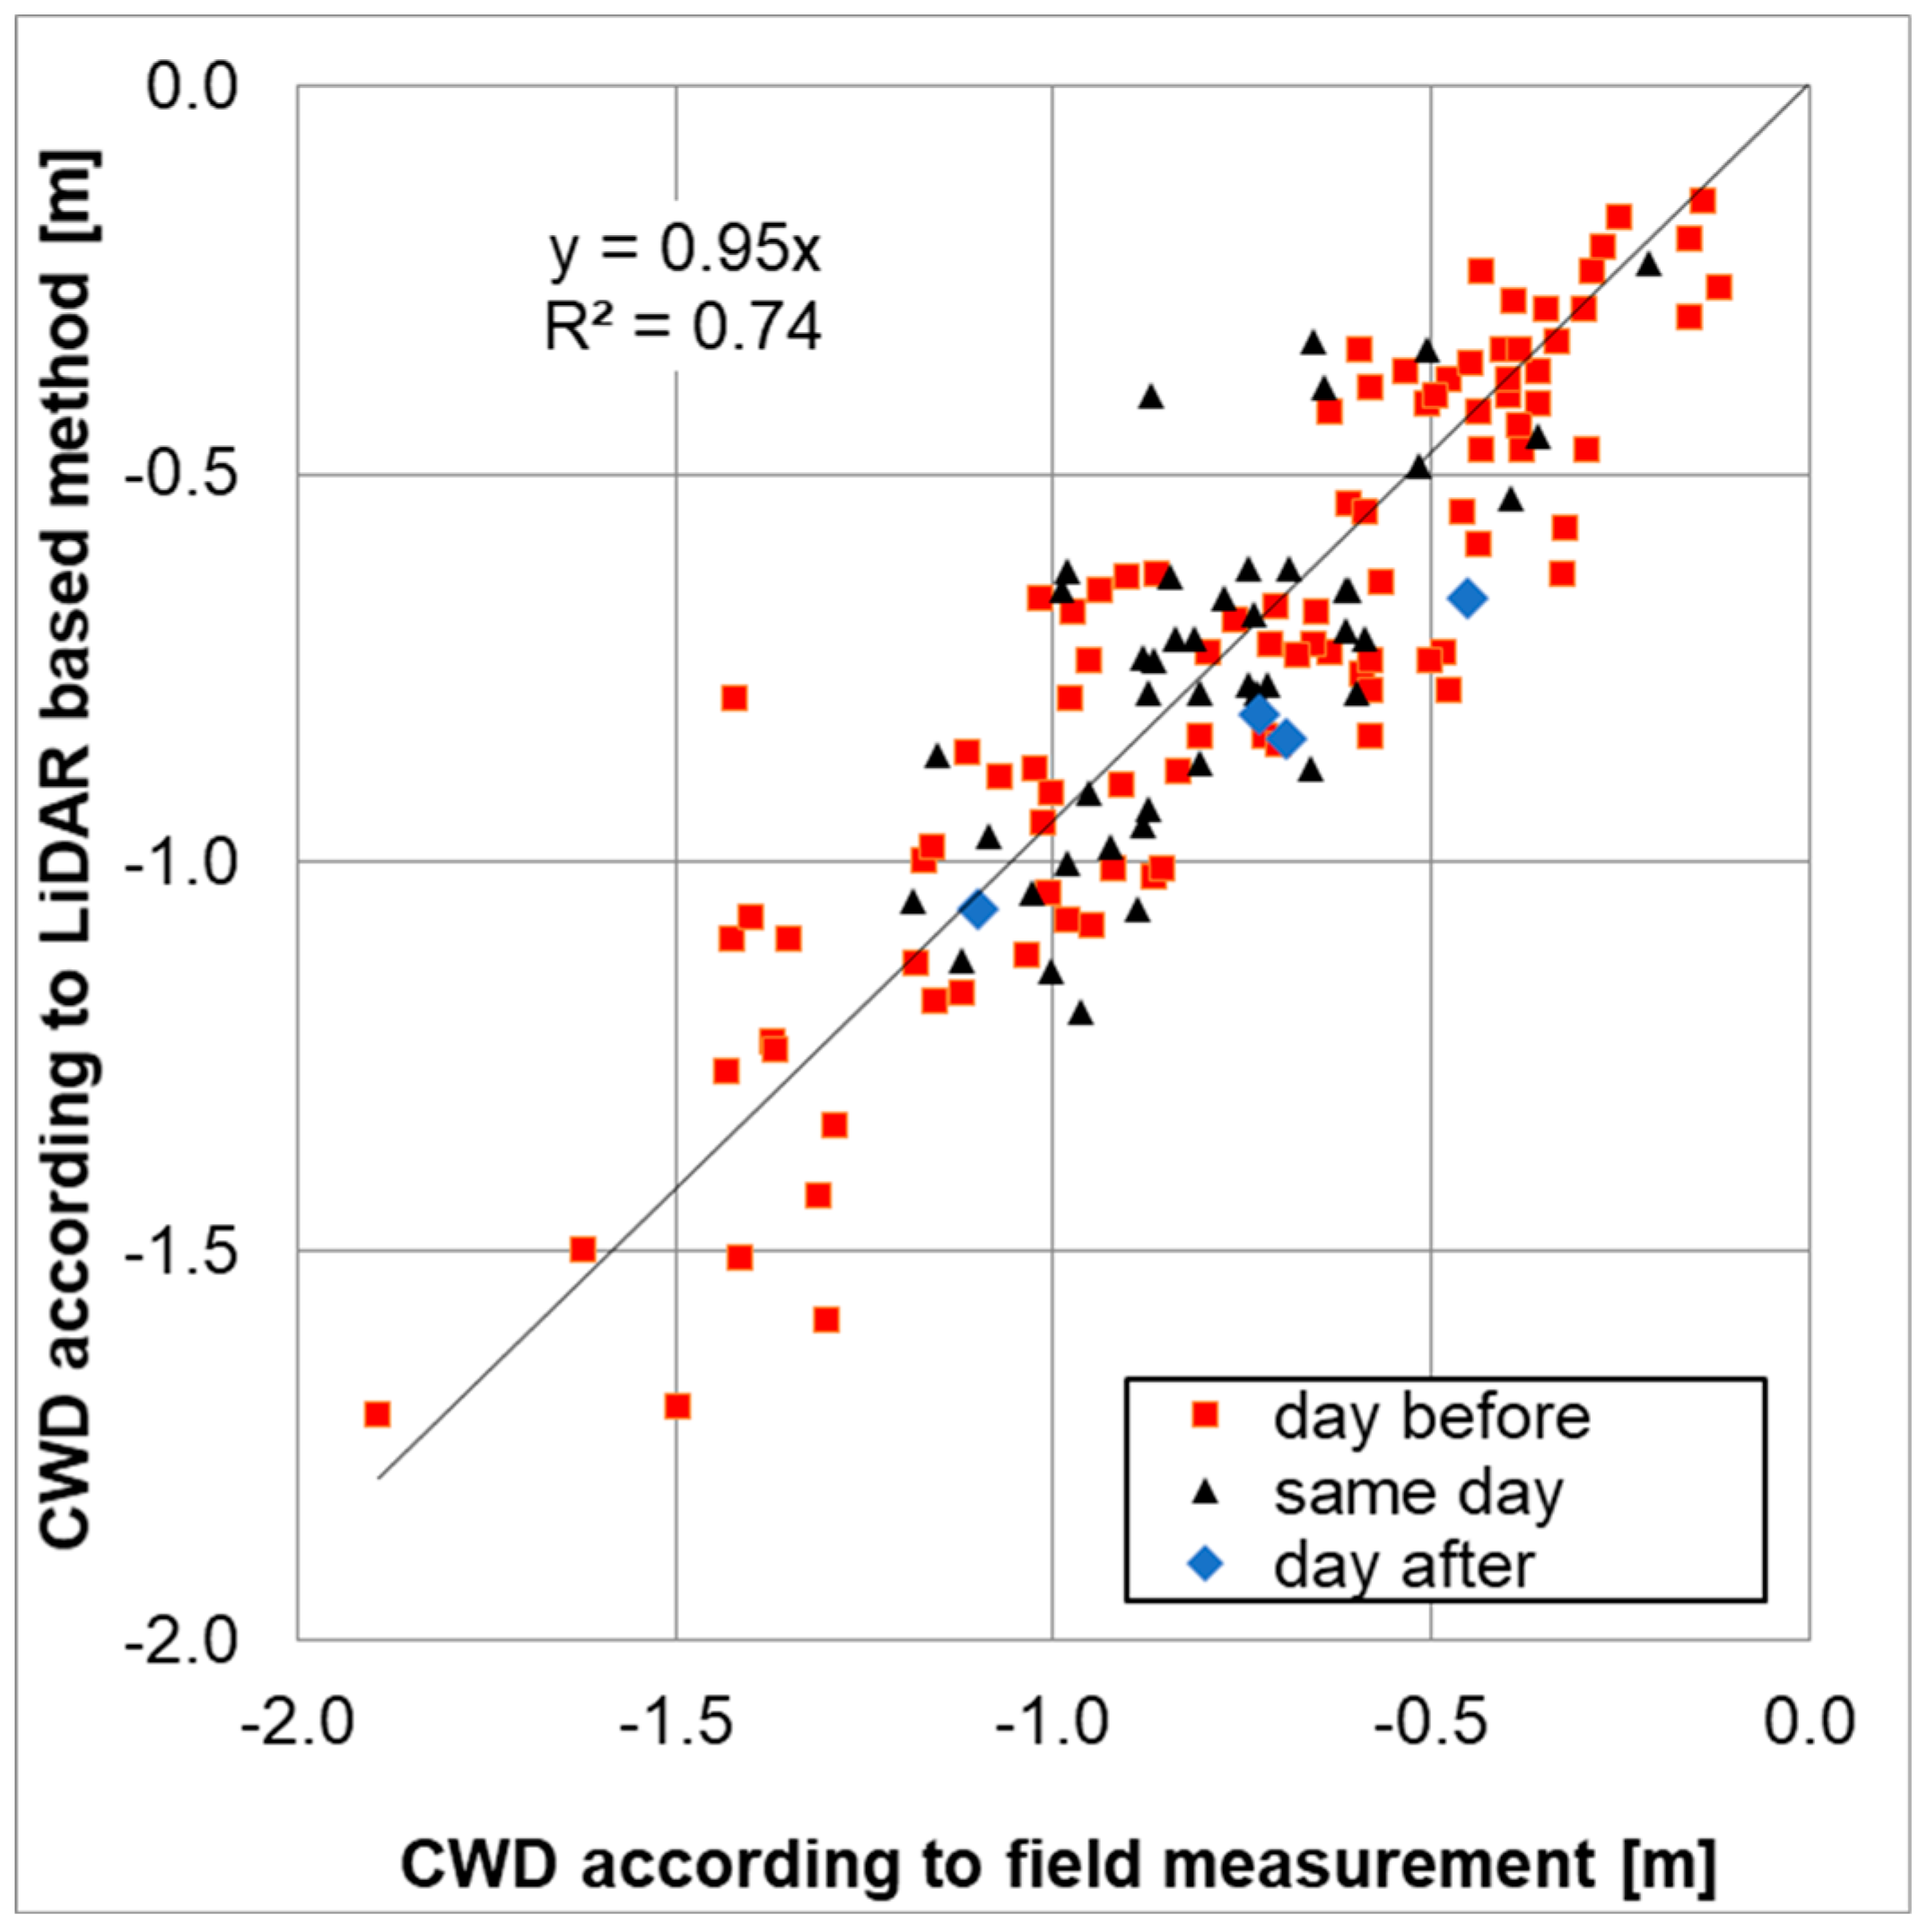
It was found that CWD, as determined from LiDAR data, correlated well with 145 field site measurements in the eastern Sumatra and West Kalimantan validation areas, with an R2 of 0.74 (Figure 5) and a trendline that was close to unity (CWDLiDAR = 0.95 × CWDfield). The average of absolute differences between LiDAR and field measurements was 0.13 m, and differences were within 0.25 m and 0.5 m for 86% and 99% of measurements, respectively.
The distribution of differences between CWDLiDAR and CWDfield greater than 0.25 m over one particular area (Figure 6) does not necessarily indicate an error in either the LiDAR or field measurement result. Another explanation of such differences is that the ground surface in peatlands often varies substantially over short distances, so the LiDAR ground surface reference is unlikely to be exactly the same as the field measurement reference. Within the 290 clusters of 5 elevation measurements collected in plantations for this study, the average difference between the lowest and highest values over a distance of 5–10 m was 0.27 m and the difference exceeded 0.45 m in 10% of cases.
The surface elevation variations in this range or greater are common in tropical peatlands, with [24] reporting ranges of 0.49–1.11 m along transects of 50 m in relatively undisturbed peat swamp forests. Moreover, canal water levels can fluctuate by decimeters day by day, especially around rainfall events, while the two measurements were often on subsequent days. Furthermore, in some cases, the 100 m × 100 m grid cell, over which CWD was calculated, may overlap only with a short canal section, resulting in a less representative CWDLiDAR value. A further factor reducing the accuracy of the method is the uncertainty of precise canal location, in areas where they are overgrown with vegetation. In regions where canals are better defined and maintained, the accuracy of this method would be expected to be higher. In such regions, automated identification of canals may also be possible [25].

3.2. Patterns in CWE in the Central Kalimantan Study Area

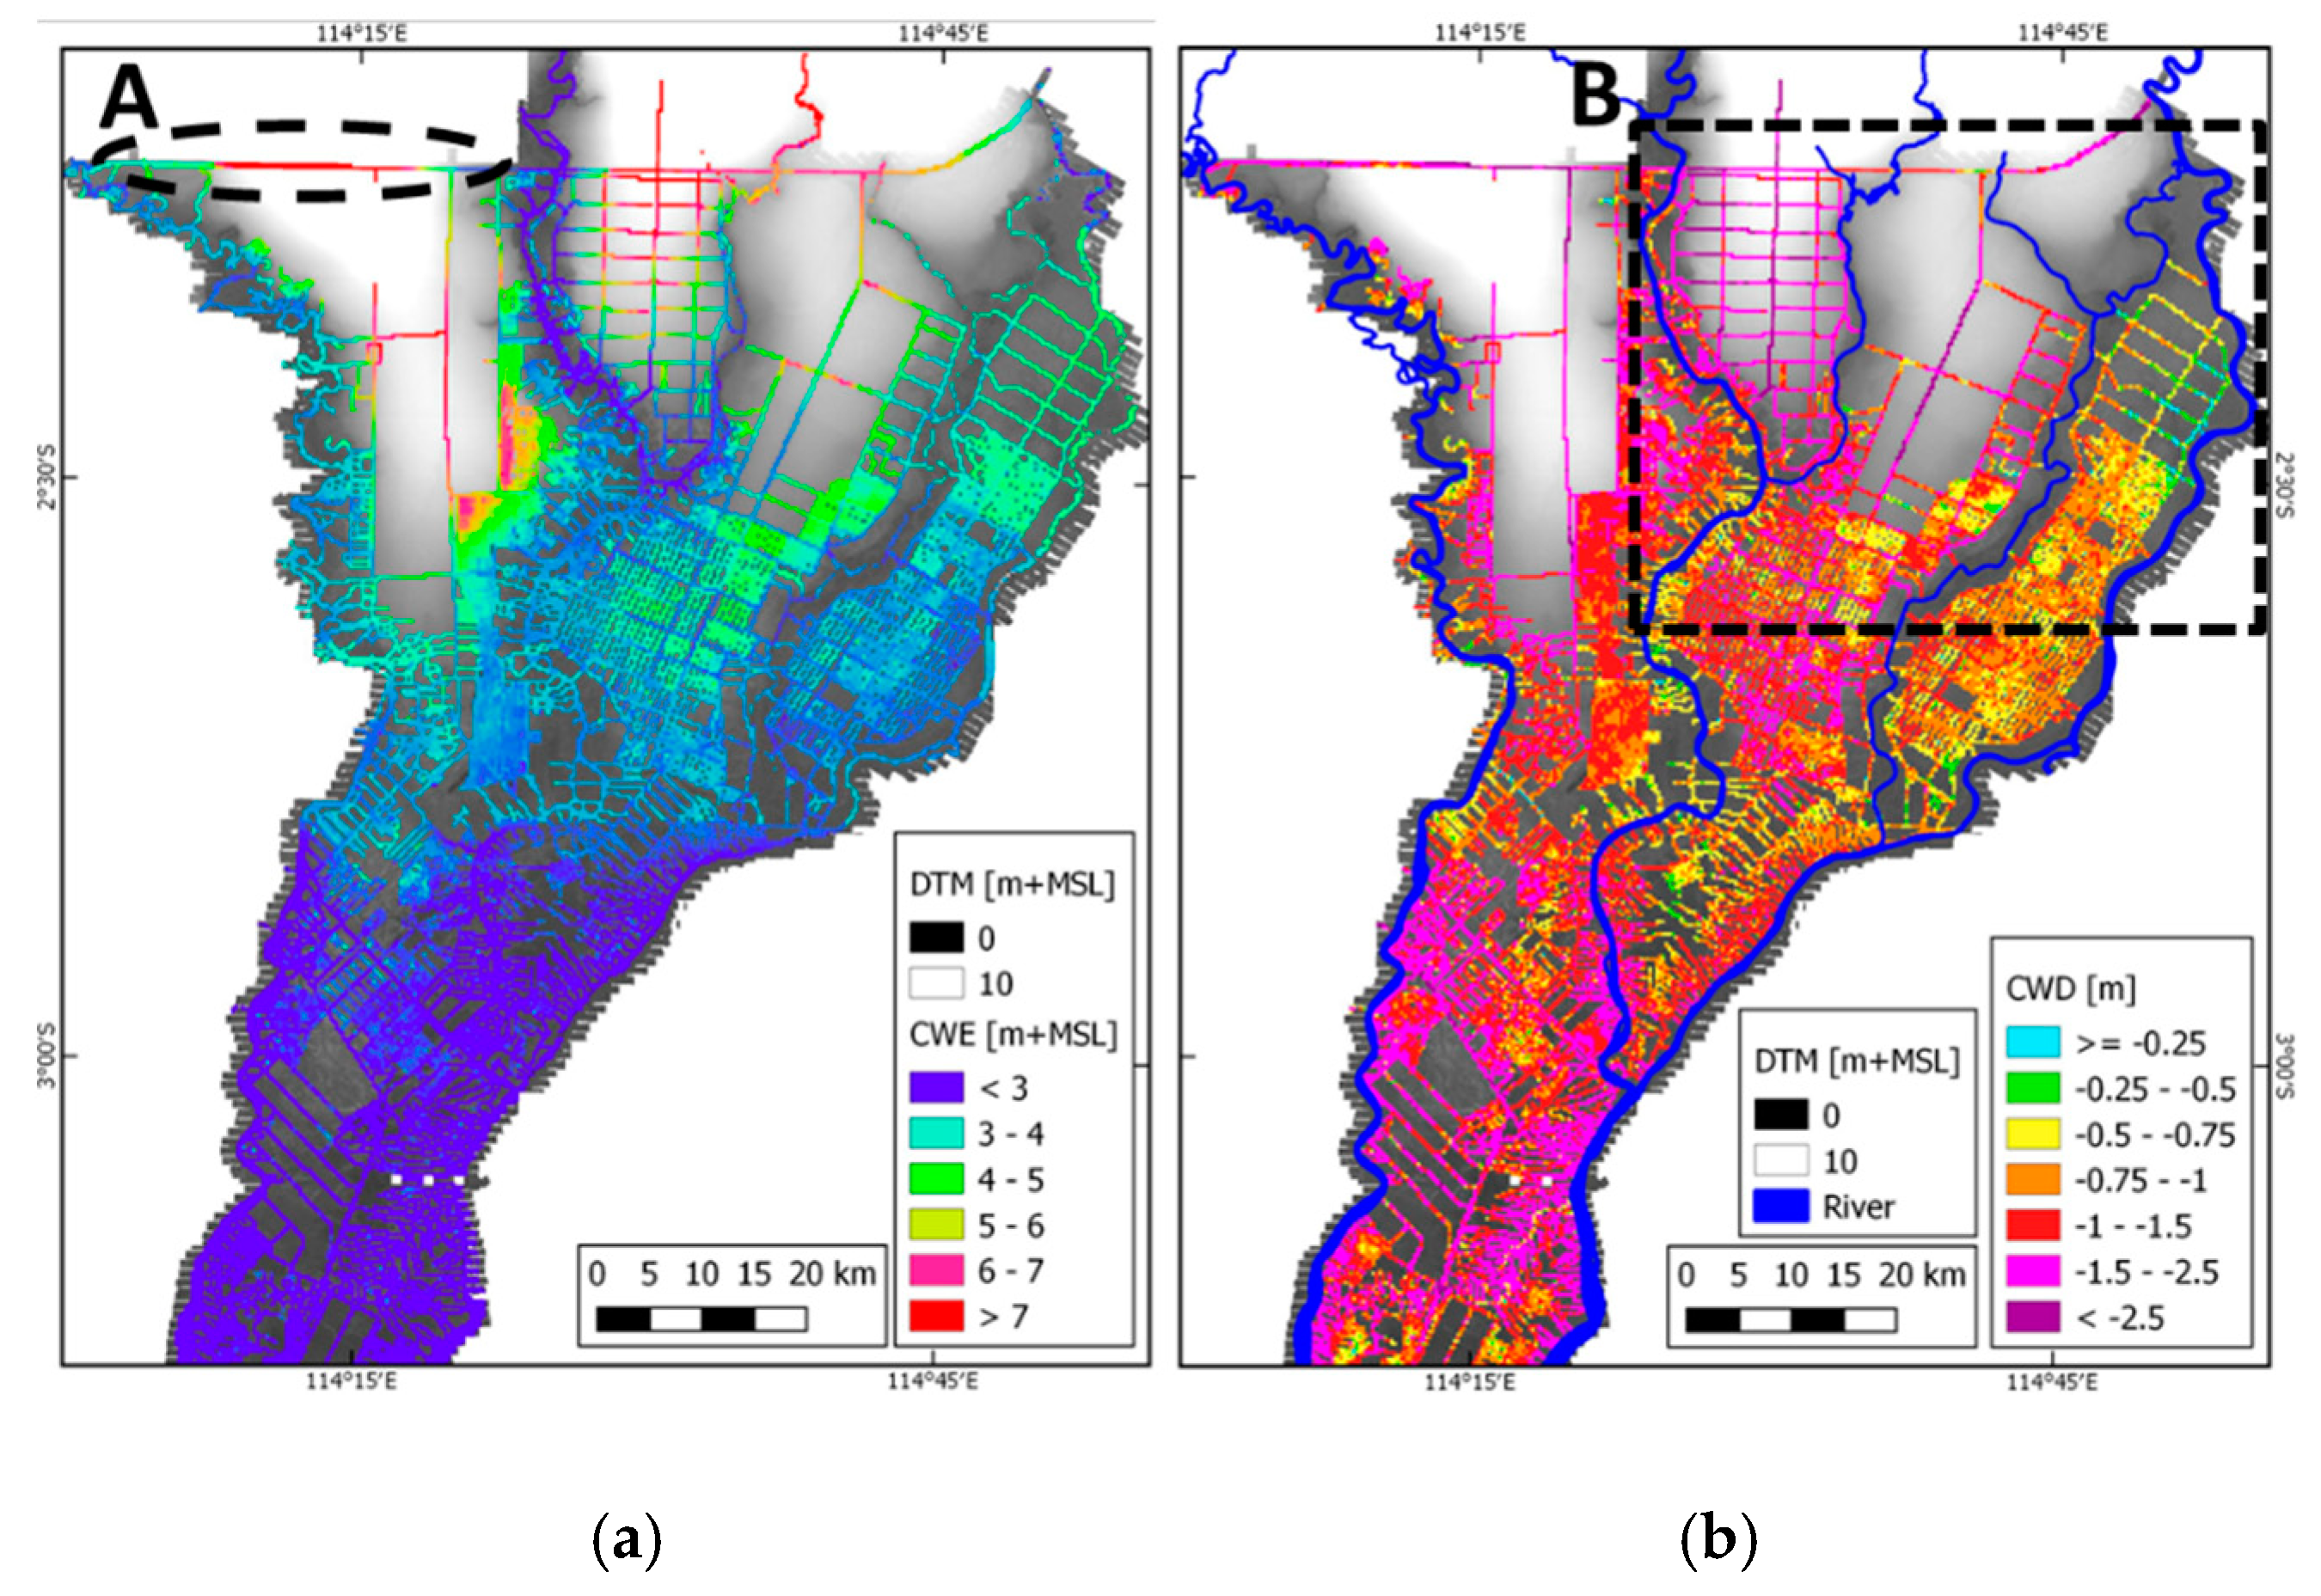
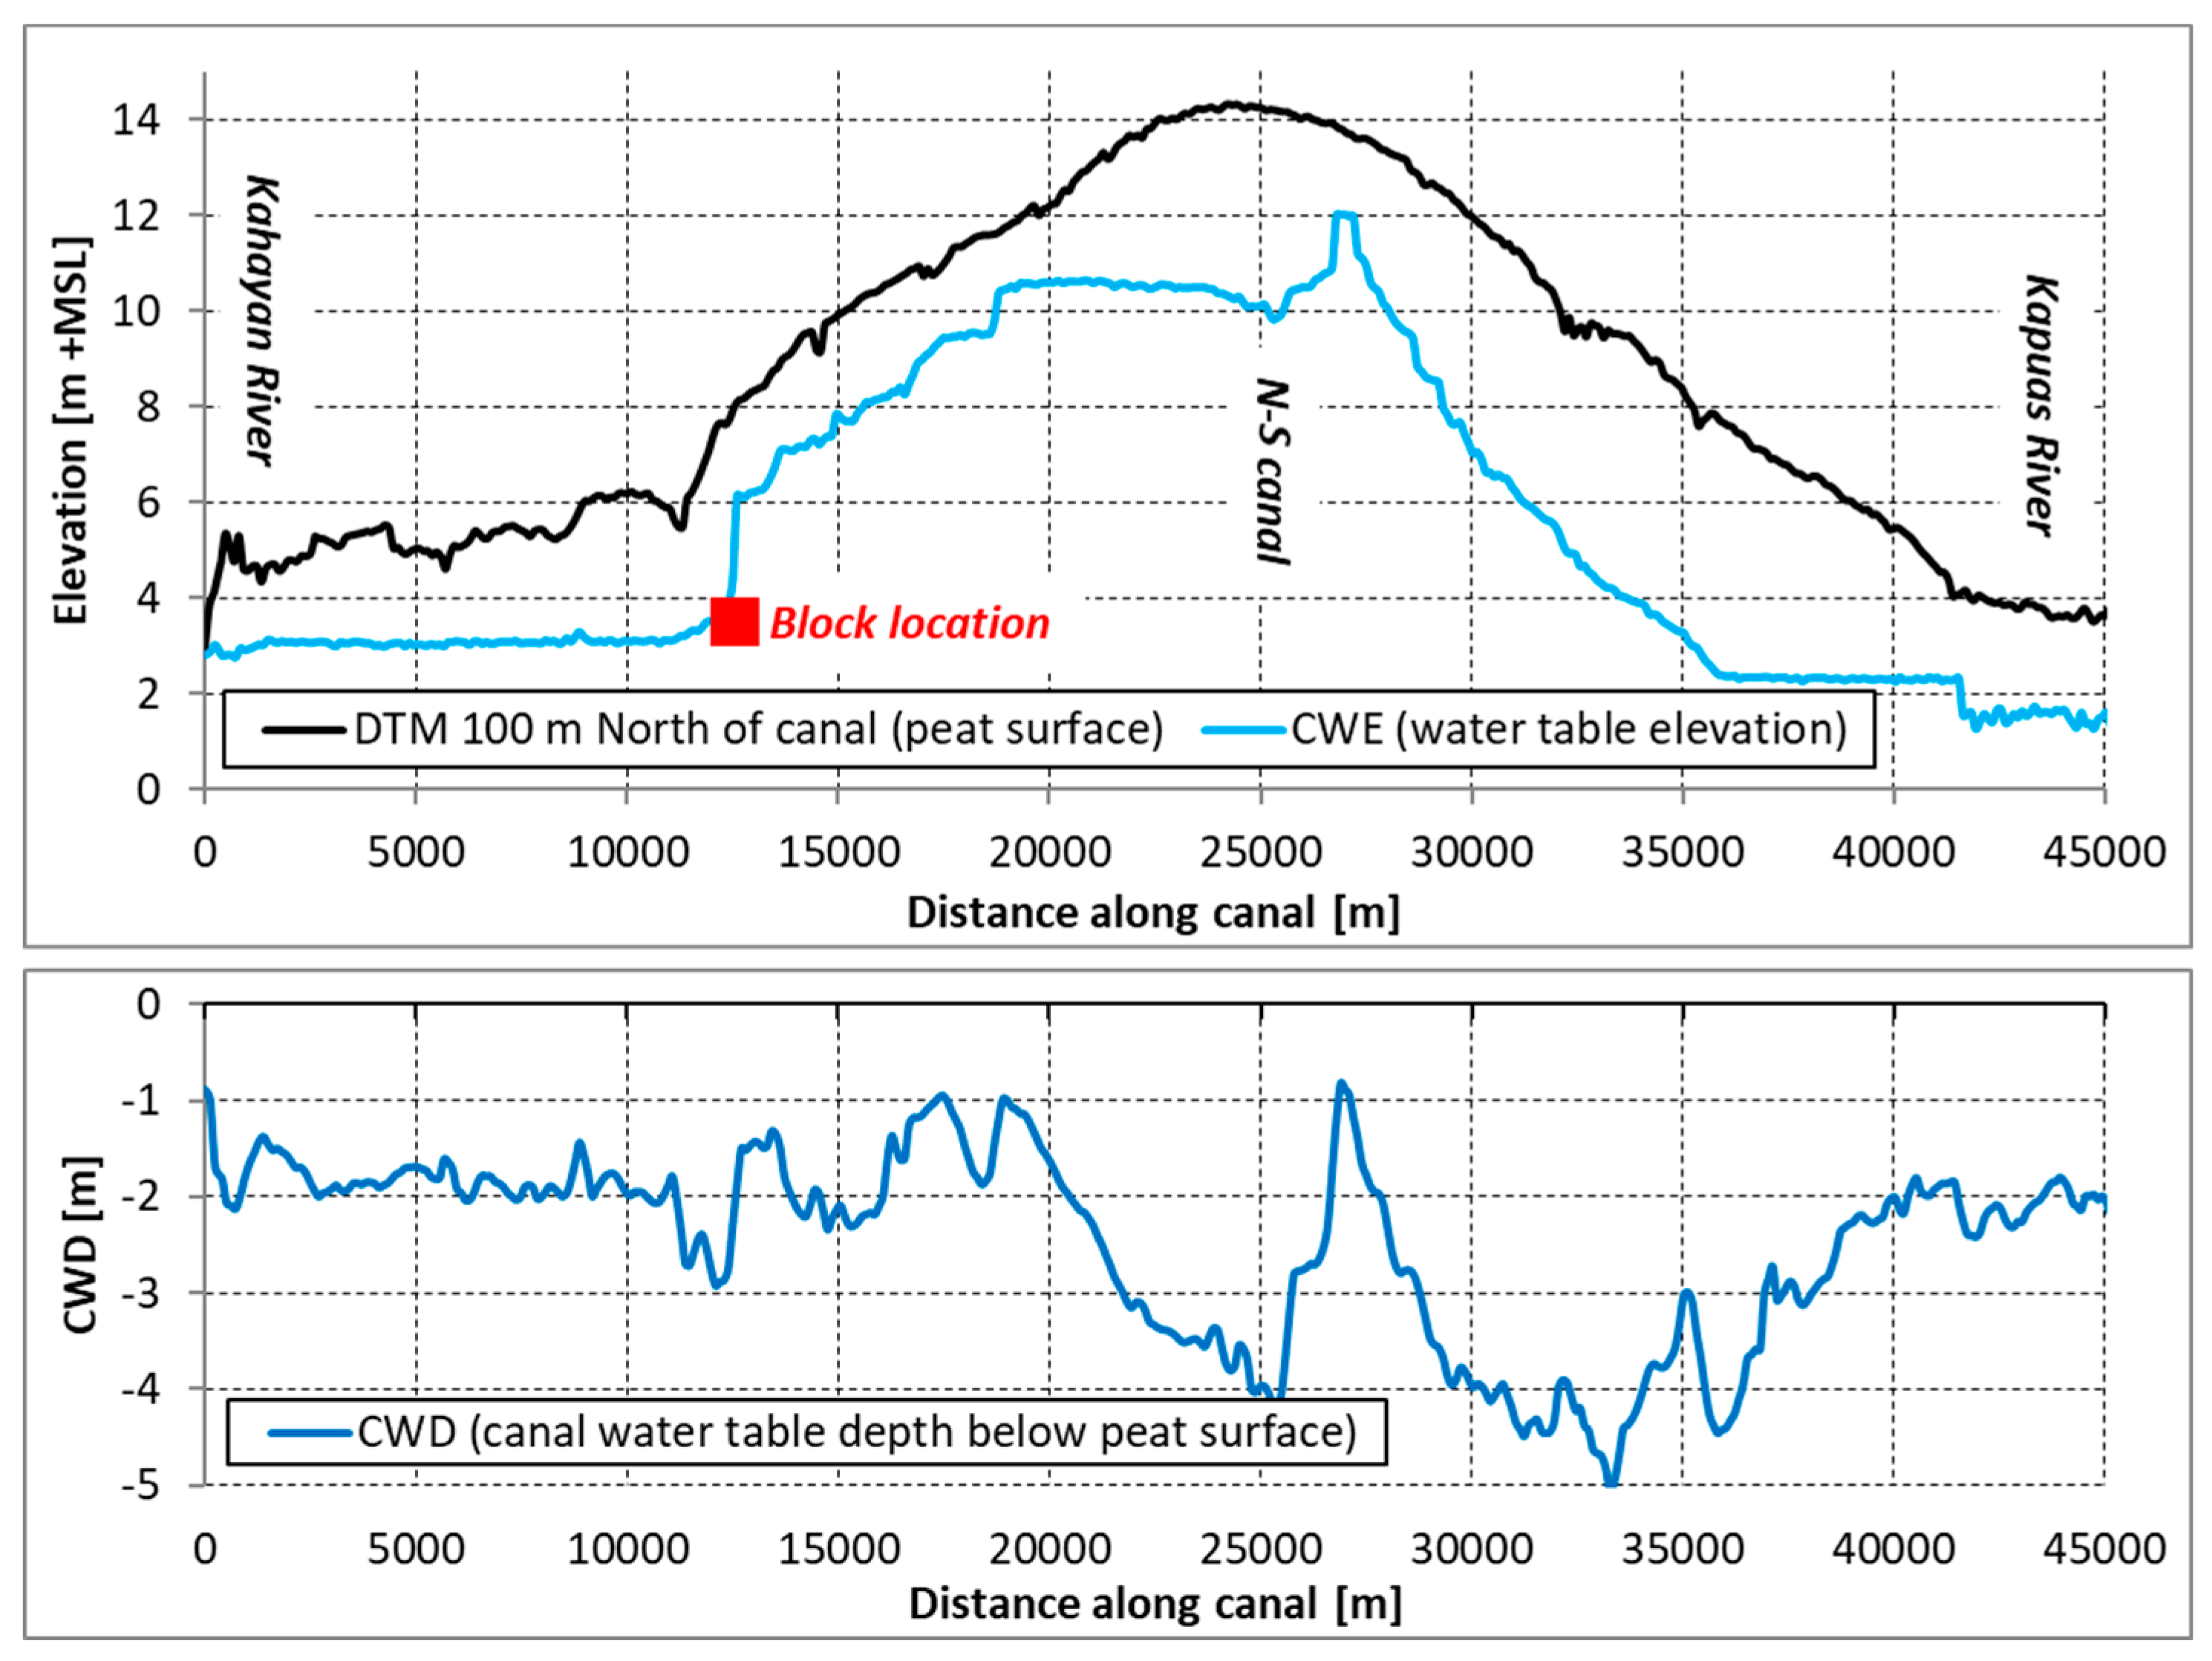
In the Central Kalimantan area, the CWE derived from LiDAR data from August to October 2011 revealed water levels that were gradually sloping or horizontal along canals over long distances, consistent with reality in the dry season when water discharges and canal water level gradients are low (Figure 7 and Figure 8). A few sudden variations in CWE over short distances usually coincided with blockages in canals (Figure 8).

3.3. Patterns in CWD in the Central Kalimantan Study Area

The variation in CWD values was greater than that in CWE values, reflecting the variation of ground surface elevation along canals. In the study area, results reported in [21] showed that gradients are usually below 1 m km-1 (10 cm per 100 m) and very rarely exceed 2 m km−1 (20 cm per 100 m). Along canals across peat domes, CWD tends to increase going further from a river, as ground surface level goes up, while the water surface (i.e., CWE) is relatively flat.
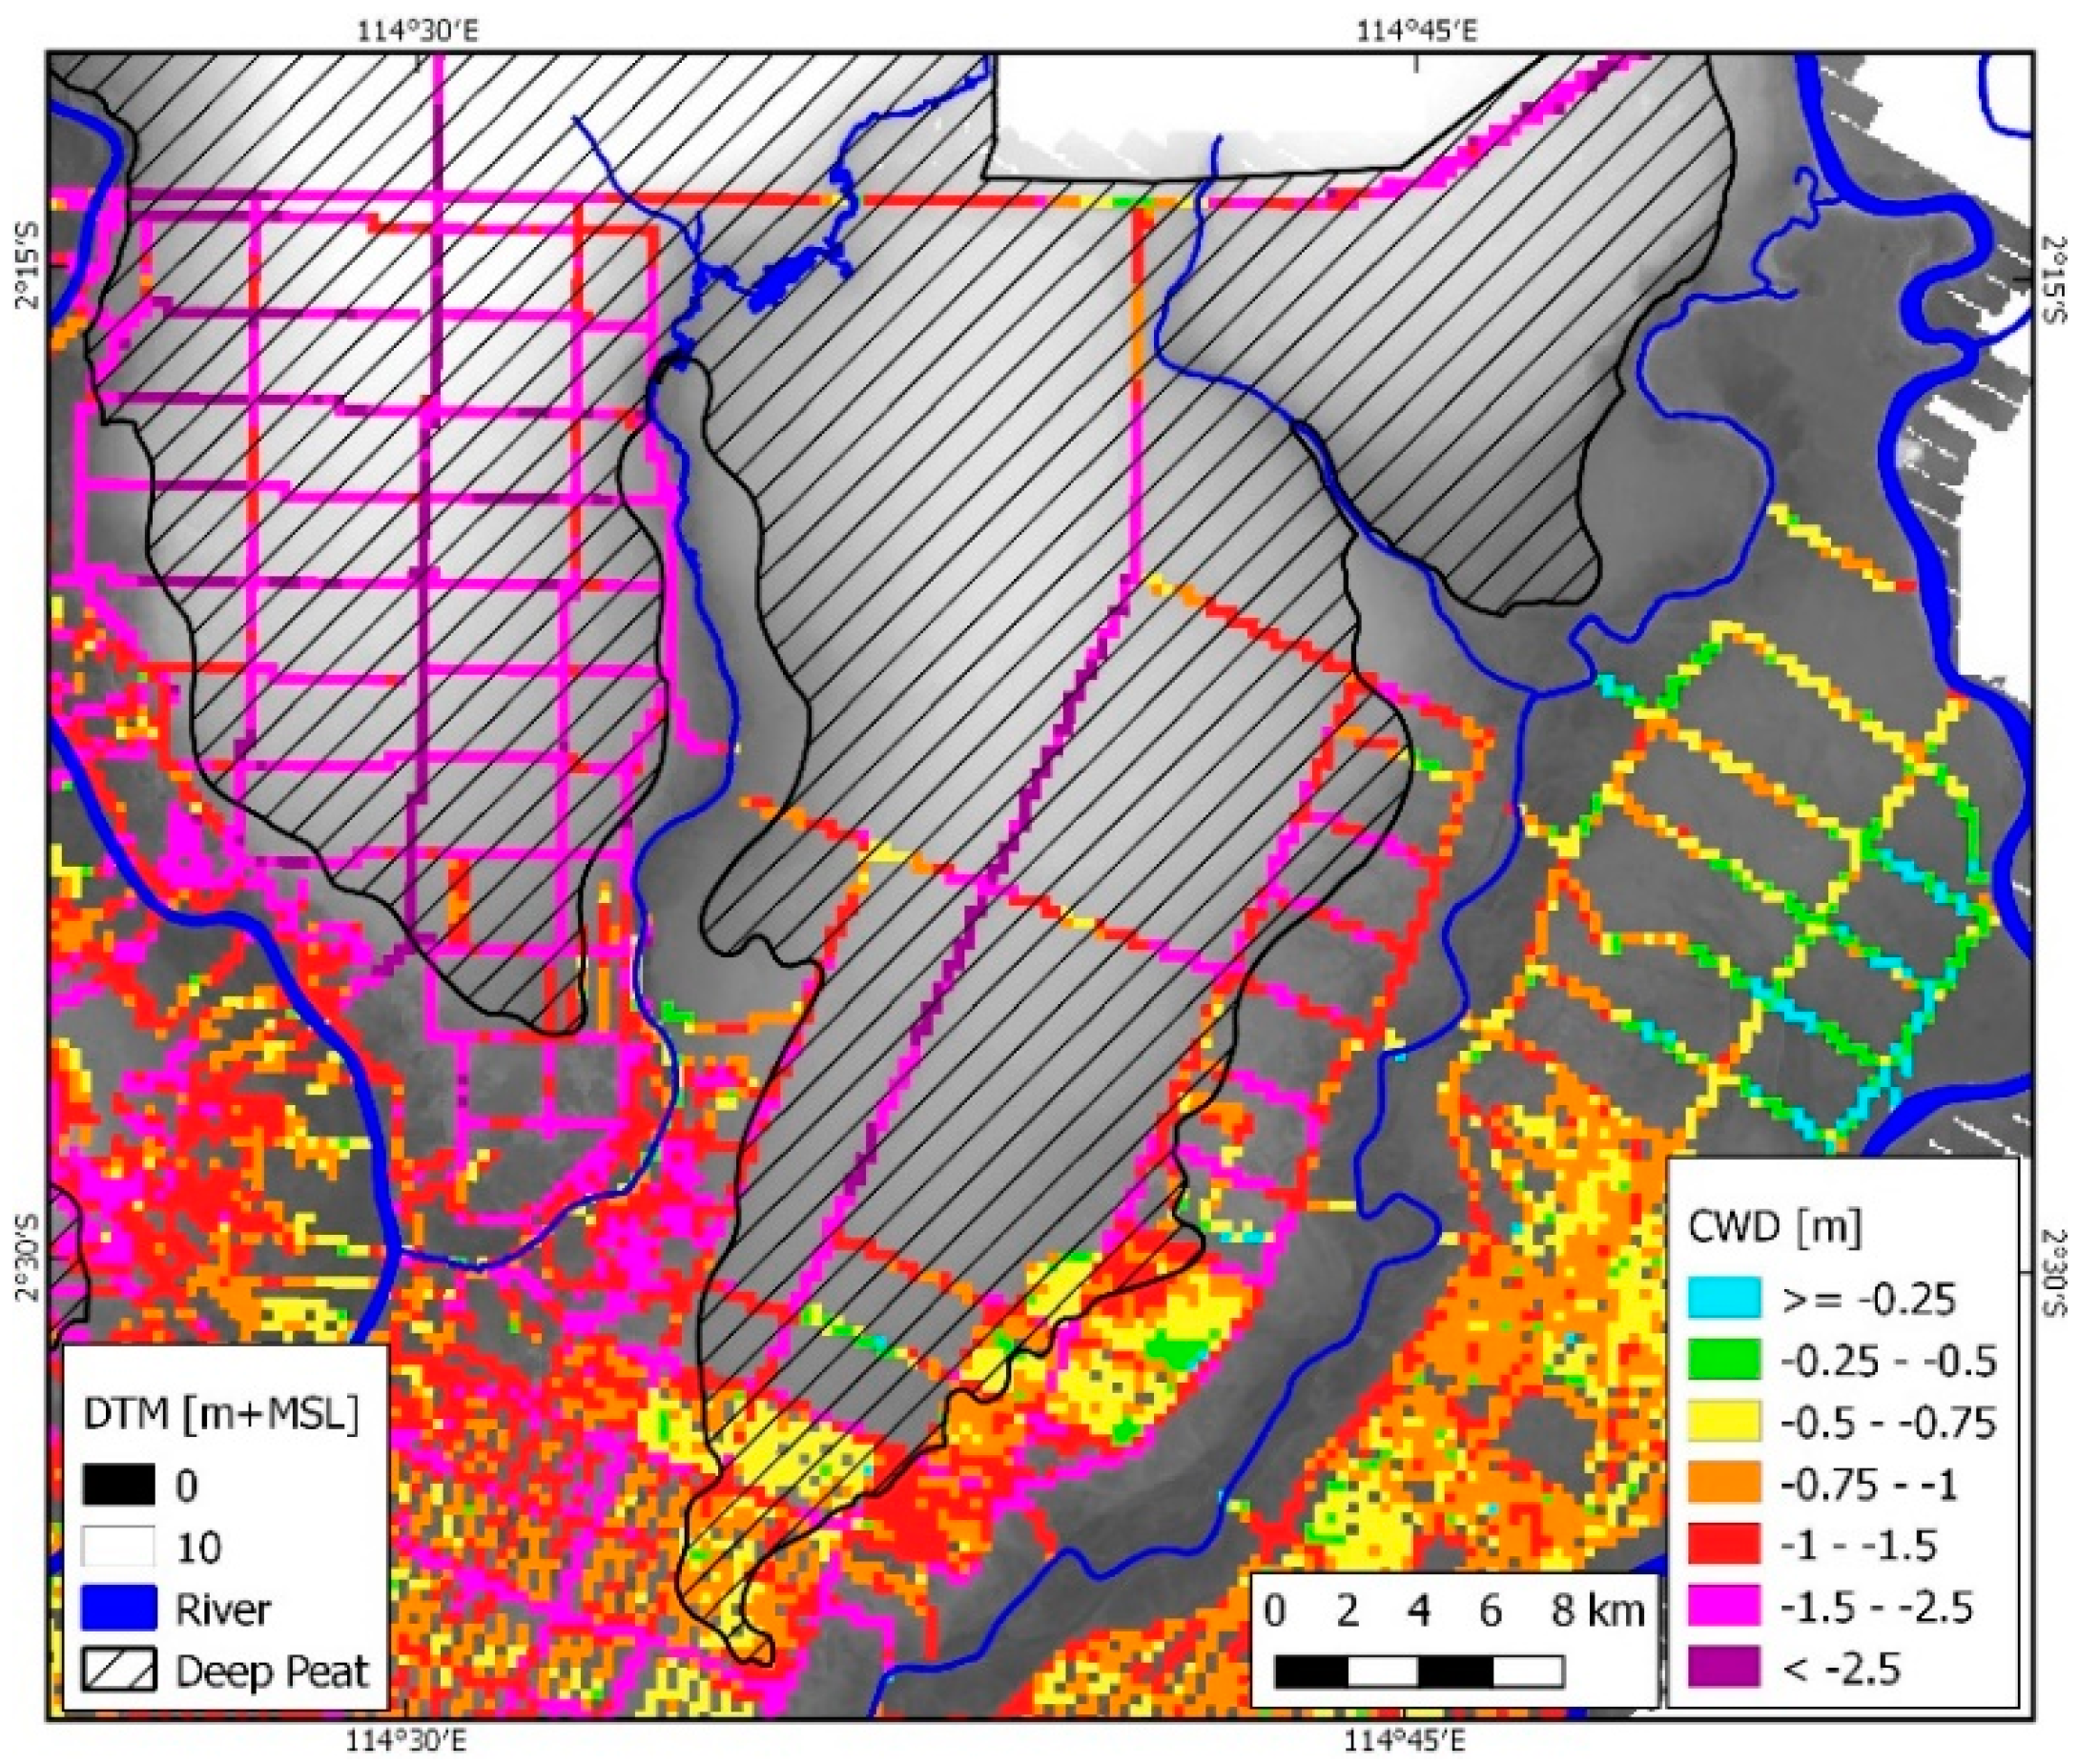
The CWD map (Figure 7) and cross section (Figure 8) indicated that canal water tables were more than 1.5 m below the surrounding peat surface near canals in most peatlands in this area, and more than 2.5 m over large distances, with values as high as 5 m occurring in some locations. Given that the dry season of 2011, when these LiDAR data were collected, had average rainfall, such low water tables confirmed that canals were severely overdraining the peat with negative consequences for forest recovery, fire risk and carbon loss.
In rice scheme irrigation canals in the low-lying mineral soil areas near rivers, large variations in CWD values were visible for over 1 m over short distances, with some areas being flooded even in the dry season, while CWD in others exceeded 2 m (Figure 7 and Figure 9). Such information may be used to optimize water management to achieve more uniform water depth conditions that are optimized for rice growth.

4. Conclusions and Recommendations

Based on the results from this study, we conclude that CWD maps produced with our method provides information that is useful for water management evaluation and improvement, being within 0.25 m from CWD as measured in the field in 86% of validation cases. To our knowledge, no other currently existing method can provide CWD maps with such relative accuracy. When collected on a repeated basis over water systems of particular interest, this method could yield a reliable monitoring tool for canal water table depths. To reduce cost, airborne LiDAR data may be collected over flight lines that are several kilometers apart [21] or along selected key canals that can represent the condition over larger water management systems.
The 2011 dry season CWD values in Central Kalimantan drained peatlands, of generally over 1.5 m and often over 2.5 m, far exceed recommended values that would benefit fire reduction and forest regeneration. Indonesian Government regulations specify a groundwater depth of 0.4 m (BRG, 2016), that is clearly not compatible with a CWD of several meters. The CWD map therefore provides a basis for designing canal blocking systems that are more effective in raising water levels.
A DTM-based CWD map, even though representing only conditions at one moment in time, may be useful for interpreting and improving routine CWD measurements in the field. If the routine measurement is found to be wrong because of erroneous referencing to one point in the canal side only, as is often the case, it can be improved. For this application, it is necessary to know the exact date of LiDAR data collection at each location in the DTM, which can be determined from the LiDAR timestamps.
The CWD dataset for the application area in Central Kalimantan (Figure 7) is available in the public domain from https://doi.org/10.17632/7nnf495jbw.1.
While our study applies the method to peatland water levels in Indonesia, it is applicable in any flat landscape that has canals. The global coverage of DTMs created from LiDAR data will increase with new drone and satellite technology, and such data are already available online for public access for large areas, especially parts of the USA and Europe [25,26,27,28].

Author Contributions

Conceptualization, R.V. and A.H.; methodology, R.V., A.H., D.M., M.P. and A.T.Y.; field survey, D.M. and I.S.; formal analysis, R.V., A.H., D.M., M.P. and A.T.Y.; data curation, R.V., D.M. and A.T.Y.; writing—original draft, R.V. and A.H.; writing—review and editing, D.M., I.S., M.P. and A.T.Y.; visualization, R.V., A.H., D.M. and A.T.Y.; supervision, I.S.; funding acquisition, R.V. and A.H. All authors have read and agreed to the published version of the manuscript.

Funding

The collection of LiDAR data and field measurements in eastern Sumatra and West Kalimantan was supported by Asia Pulp and Paper. The LiDAR data for Central Kalimantan were funded by the Australian Agency for International Development and Dutch government under the Kalimantan Forest and Carbon Partnership.

Acknowledgments

We wish to thank the anonymous reviewers for their useful comments and suggestions that enabled us to improve the content of this paper.

Conflicts of Interest

The authors declare no conflict of interest.

References

  1. Andriesse, J. Nature and management of tropical peat soils. FAO Soils Bull. 1988, 59, 248. [Google Scholar]
  2. Hooijer, A.; Page, S.; Jauhiainen, J.; Lee, W.A.; Lu, X.X.; Idris, A.; Anshari, G. Subsidence and carbon loss in drained tropical peatlands. Biogeosciences 2012, 9, 1053–1071. [Google Scholar] [CrossRef] [Green Version]
  3. Nedeco/Euroconsult; BIEC. Nationwide Study of Coastal and Near-Coastal Swamp Land in Sumatra, Kalimantan and Irian Jaya: Final Report; Nedeco/Euroconsult: Arnhem, The Netherlands, 1984. [Google Scholar]
  4. Ritung, S.; Wahyunto, N.K.; Sukarman, H.; Suparto, T.C. Peta lahan gambut Indonesia. Skala 1:250.000 (Indonesian peatland map at the scale 1:250,000). In Balai Besar Penelitian dan Pengembangan Sumberdaya Lahan Pertanian; Indonesian Center for Agricultural Land Resources Research and Development: Bogor, Indonesia, 2011. [Google Scholar]
  5. Morrogh-Bernard, H.; Husson, S.; Page, S.E.; Rieley, J.O. Population status of the Bornean orang-utan (Pongo pygmaeus) in the Sebangau peat swamp forest, Central Kalimantan, Indonesia. Biol. Conserv. 2003, 110, 141–152. [Google Scholar] [CrossRef] [Green Version]
  6. Posa, M.R.C. Peat swamp forest avifauna of Central Kalimantan, Indonesia: Effects of habitat loss and degradation. Biol. Conserv. 2011, 144, 2548–2556. [Google Scholar] [CrossRef]
  7. Hooijer, A.; Page, S.; Canadell, J.G.; Silvius, M.; Kwadijk, J.; Wösten, H.; Jauhiainen, J. Current and future CO2 emissions from drained peatlands in Southeast Asia. Biogeosciences 2010, 7, 1505–1514. [Google Scholar] [CrossRef] [Green Version]
  8. Giam, X.; Koh, L.P.; Tan, H.H.; Miettinen, J.; Tan, H.T.; Ng, P.K. Global extinctions of freshwater fishes follow peatland conversion in Sundaland. Front. Ecol. Environ. 2012, 10, 465–470. [Google Scholar] [CrossRef]
  9. Gaveau, D.L.A.; Salim, M.A.; Hergoualc’h, K.; Locatelli, B.; Sloan, S.; Wooster, M.; Marlier, M.E.; Molidena, E.; Yaen, H.; DeFries, R.; et al. Major atmospheric emissions from peat fires in Southeast Asia during non-drought years: Evidence from the 2013 Sumatran fires. Sci. Rep. 2014, 4, 6112. [Google Scholar] [CrossRef] [Green Version]
  10. Hooijer, A.; Vernimmen, R.; Visser, M.; Mawdsley, N. Flooding Projections from Elevation and Subsidence Models for Oil Palm Plantations in The Rajang Delta Peatlands, Sarawak, Malaysia; Deltares Report 1207384; Deltares: Delft, The Netherlands, 2015. [Google Scholar]
  11. Hooijer, A.; Vernimmen, R.; Mawdsley, N.; Page, S.; Mulyadi, D.; Visser, M. Assessment of Impacts of Plantation Drainage on The Kampar Peninsula Peatland, Riau; Deltares Report 1207384; Wetlands International, CLUA and Norad: Delft, The Netherlands, 2015. [Google Scholar]
  12. Huijnen, V.; Wooster, M.J.; Kaiser, J.W.; Gaveau, D.L.A.; Flemming, J.; Parrington, M.; Inness, A.; Murdiyarso, D.; Main, B.; van Weele, M. Fire carbon emissions over maritime southeast Asia in 2015 largest since 1997. Sci. Rep. 2016, 6, 26886. [Google Scholar] [CrossRef] [Green Version]
  13. Sumarga, E.; Hein, L.; Hooijer, A.; Vernimmen, R. Hydrological and economic effects of oil palm cultivation in Indonesian peatlands. Ecol. Soc. 2016, 21. [Google Scholar] [CrossRef]
  14. Miettinen, J.; Hooijer, A.; Vernimmen, R.; Liew, S.C.; Page, S.E. From carbon sink to carbon source: Extensive peat oxidation in insular Southeast Asia since 1990. Environ. Res. Lett. 2017, 12, 024014. [Google Scholar] [CrossRef]
  15. BRG. Mengawali Restorasi Gambut Indonesia. Annual Report; Badan Restorasi Gambut: Jakarta, Indonesia, 2016. [Google Scholar]
  16. Höfle, B.; Vetter, M.; Pfeifer, N.; Mandlburger, G.; Stötter, J. Water surface mapping from airborne laser scanning using signal intensity and elevation data. Earth Surf. Process. Landf. 2009, 34, 1635–1649. [Google Scholar] [CrossRef]
  17. Roelens, J.; Dondeyne, S.; Van Orshoven, J.; Diels, J. Extracting cross sections and water levels of vegetated ditches from LiDAR point clouds. Int. J. Appl. Earth Obs. Geoinf. 2016, 53, 64–75. [Google Scholar] [CrossRef]
  18. Brzank, A.; Heipke, C.; Goepfert, J.; Soergel, U. Aspects of generating precise digital terrain models in the Wadden Sea from lidar–water classification and structure line extraction. ISPRS J. Photogramm. Remote Sens. 2008, 63, 510–528. [Google Scholar] [CrossRef]
  19. Hopkinson, C.; Crasto, N.; Marsh, P.; Forbes, D.; Lesack, L. Investigating the spatial distribution of water levels in the Mackenzie Delta using airborne LiDAR. Hydrol. Process. 2011, 25, 2995–3011. [Google Scholar] [CrossRef]
  20. Yuan, C.; Gong, P.; Bai, Y. Performance Assessment of ICESat-2 Laser Altimeter Data for Water-Level Measurement over Lakes and Reservoirs in China. Remote Sens. 2020, 12, 770. [Google Scholar] [CrossRef] [Green Version]
  21. Vernimmen, R.; Hooijer, A.; Yuherdha, A.T.; Visser, M.; Pronk, M.; Eilander, D.; Akmalia, R.; Fitranatanegara, N.; Mulyadi, D.; Andreas, H.; et al. Creating a Lowland and Peatland Landscape Digital Terrain Model (DTM) from Interpolated Partial Coverage LiDAR Data for Central Kalimantan and East Sumatra, Indonesia. Remote Sens. 2019, 11, 1152. [Google Scholar] [CrossRef] [Green Version]
  22. Page, S.E.; Siegert, F.; Rieley, J.O.; Boehm, H.-D.V.; Jaya, A.; Limin, S. The amount of carbon released from peat and forest fires in Indonesia during 1997. Nature 2002, 420, 61–65. [Google Scholar] [CrossRef]
  23. Konecny, K.; Ballhorn, U.; Navratil, P.; Jubanski, J.; Page, S.E.; Tansey, K.; Hooijer, A.; Vernimmen, R.; Siegert, F. Variable carbon losses from recurrent fires in drained tropical peatlands. Glob. Chang. Biol. 2016, 22, 1469–1480. [Google Scholar] [CrossRef] [Green Version]
  24. Lampela, M.; Jauhiainen, J.; Kämäri, I.; Koskinen, M.; Tanhuanpää, T.; Valkeapää, A.; Vasander, H. Ground surface microtopography and vegetation patterns in a tropical peat swamp forest. Catena 2016, 139, 127–136. [Google Scholar] [CrossRef]
  25. Broersen, T.; Peters, R.; Ledoux, H. Automatic identification of watercourses in flat and engineered landscapes by computing the skeleton of a LiDAR point cloud. Comput. Geosci. 2017, 106, 171–180. [Google Scholar] [CrossRef] [Green Version]
  26. Neuenschwander, A.; Pitts, K. The ATL08 land and vegetation product for the ICESat-2 Mission. Remote Sens. Environ. 2019, 221, 247–259. [Google Scholar] [CrossRef]
  27. Roelens, J.; Höfle, B.; Dondeyne, S.; Van Orshoven, J.; Diels, J. Drainage ditch extraction from airborne LiDAR point clouds. ISPRS J. Photogramm. Remote Sens. 2018, 146, 409–420. [Google Scholar] [CrossRef]
  28. Brenner, O.T.; Lentz, E.E.; Hapke, C.J.; Henderson, R.E.; Wilson, K.E.; Nelson, T.R. Characterizing storm response and recovery using the beach change envelope: Fire Island, New York. Geomorphology 2018, 300, 189–202. [Google Scholar] [CrossRef] [Green Version]
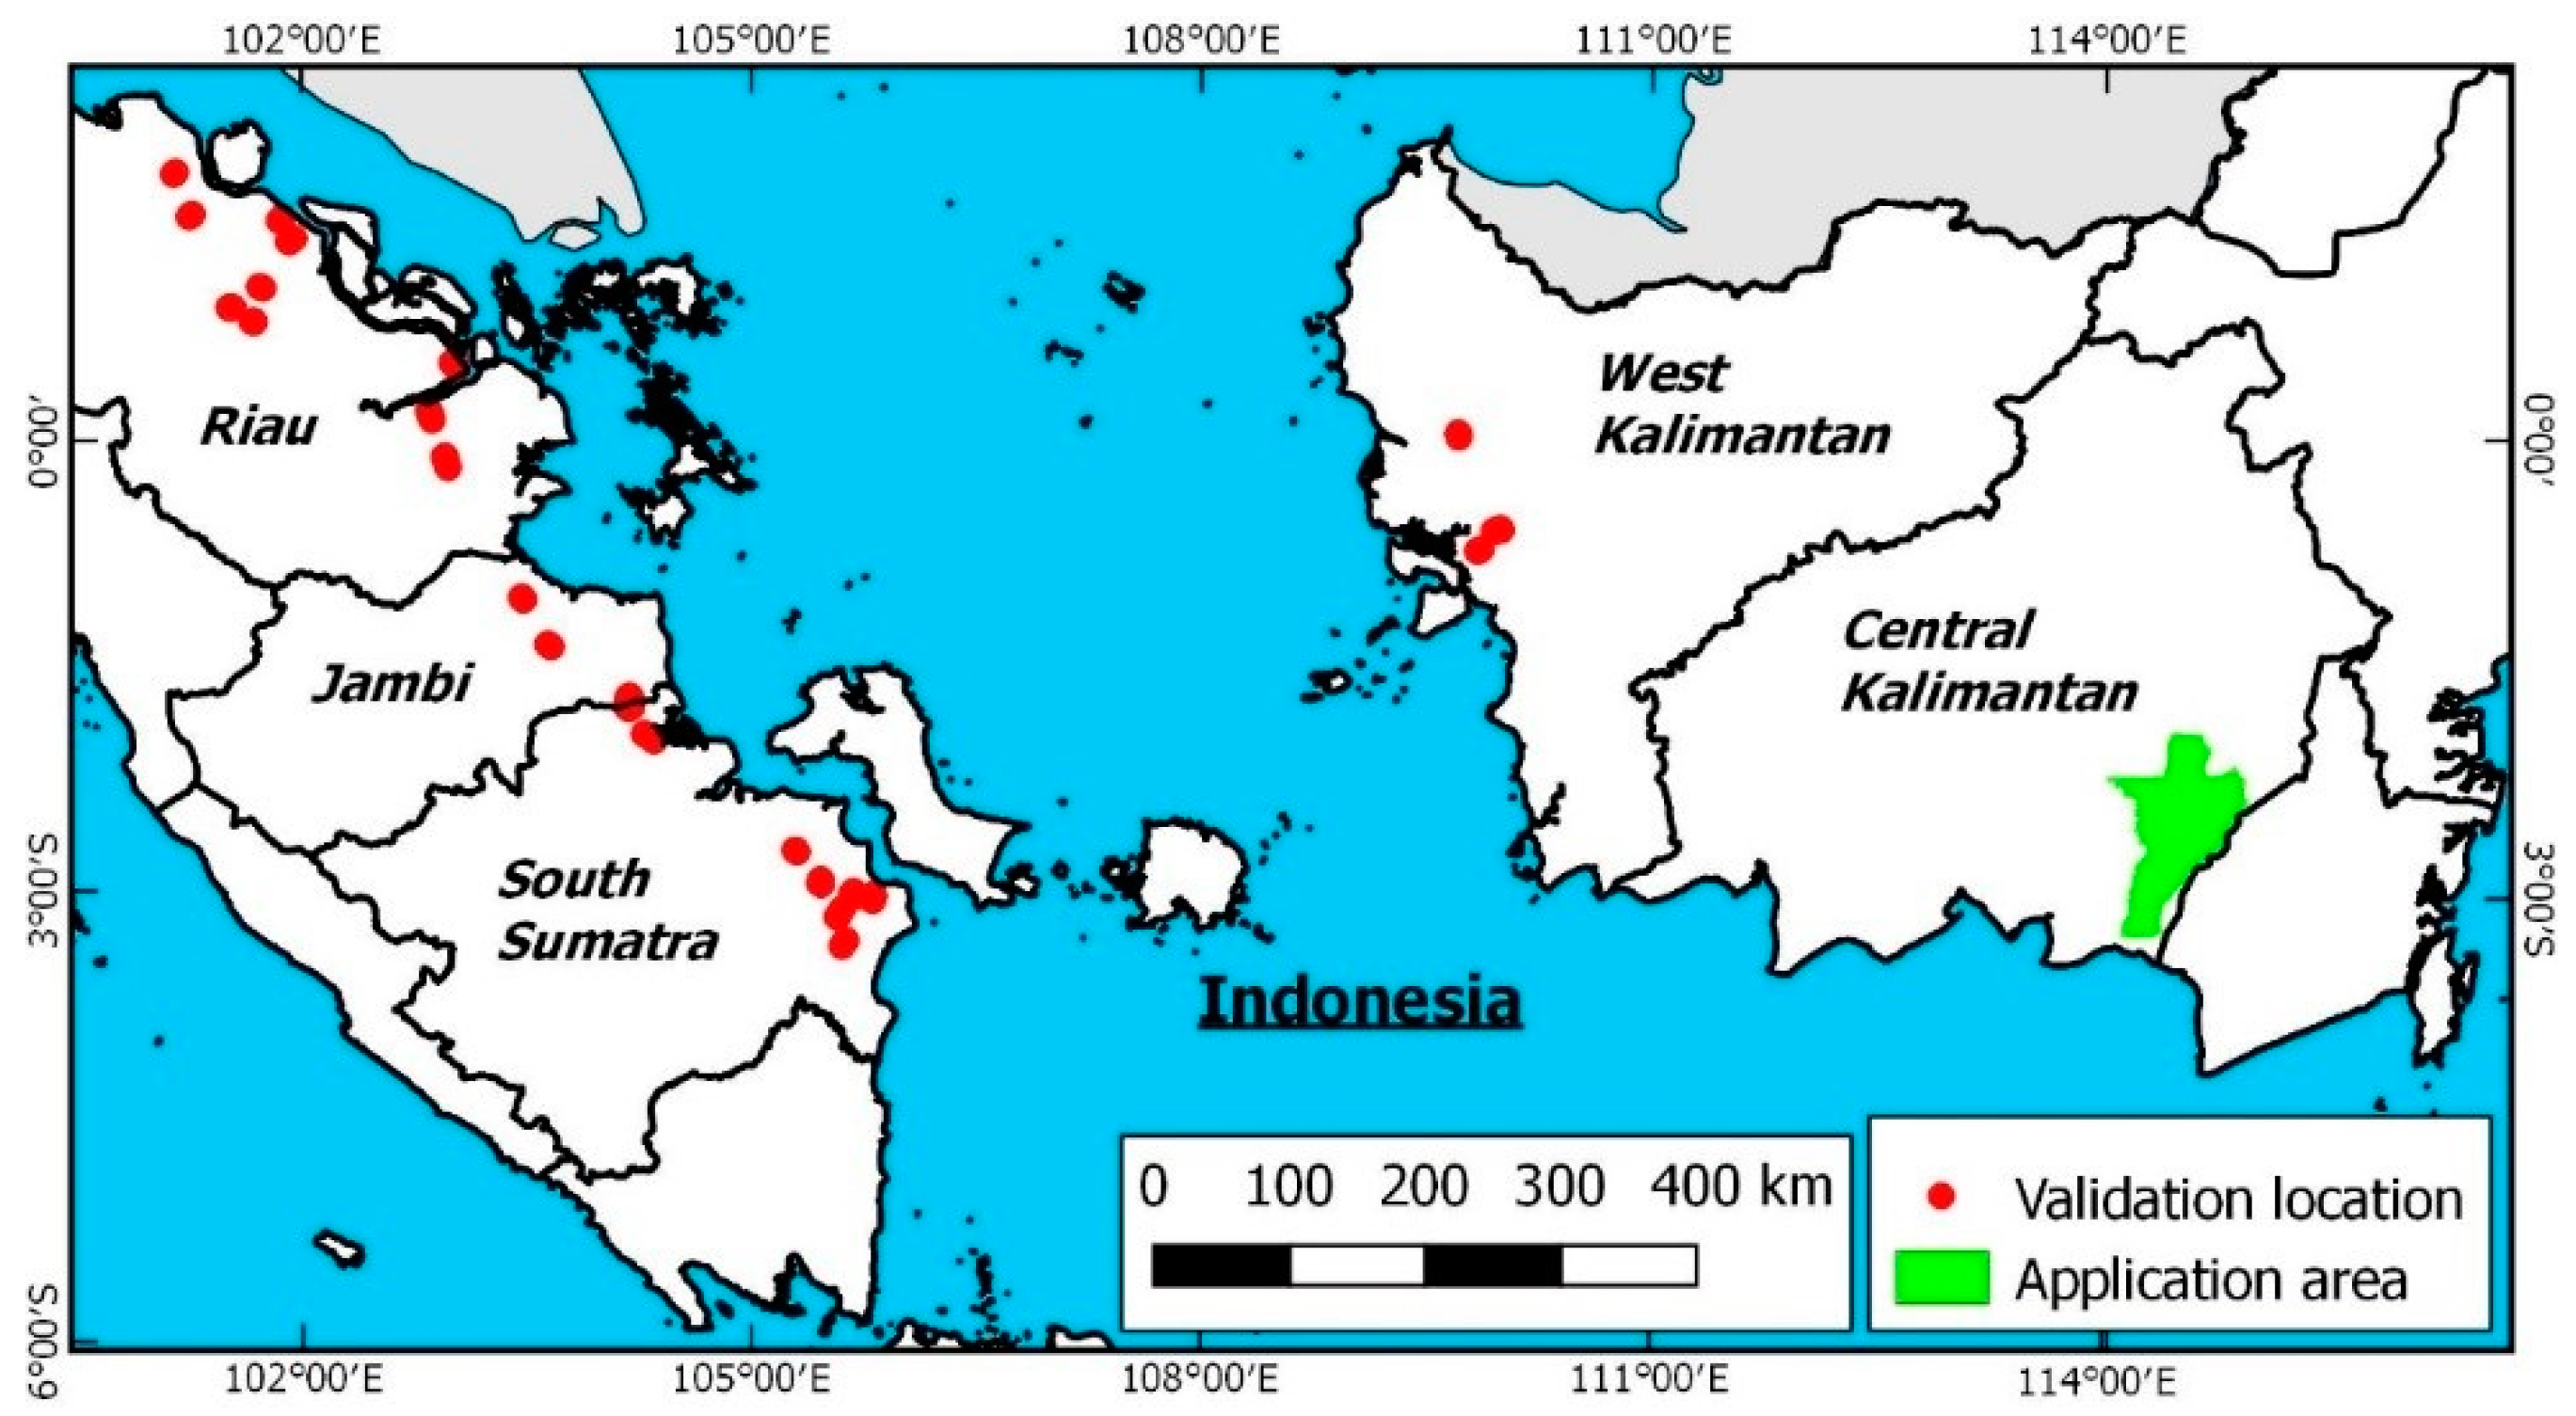
Figure 1. Map of eastern Sumatra and Kalimantan provinces showing canal water table depth (CWD) validation locations and application area.
Water 12 01486 g001
Figure 2. Illustration of canal digitization from Landsat images. (ac) Area in Central Kalimantan where canals are less visible on Landsat, but visible from orthophotos (coordinates in UTM50S) and (df) plantation area in South Sumatra with canals clearly visible from Landsat images (coordinates in UTM48N).
Water 12 01486 g002
Figure 3. Schematic of how canal water table depth (CWD) was determined from a LiDAR-based digital terrain model (DTM) as the elevation difference between soil surface (median value of DTM values in grid cell) and canal surface water level (minimum value of DTM values in grid cell).
Water 12 01486 g003
Figure 4. Schematic and photo of CWD validation measurements across a canal in the field.
Water 12 01486 g004
Figure 5. Validation of CWD as derived from LiDAR with field measurements in 2017 and 2018, conducted on the same day (plus/minus one day), for validation areas in eastern Sumatra and West Kalimantan. The trendline resulting in an R2 value of 0.74 was forced through zero.
Water 12 01486 g005
Figure 6. LiDAR-derived CWD (a) compared with field measurements on the same day (plus/minus one day) (b) for a validation plantation area in South Sumatra. (c) Differences were mostly within 0.25 m. These data were collected in a dry period (August 2018), so water levels were mostly more than 0.5 m below the surface, but still less than 1 m in this area.
Water 12 01486 g006
Figure 7. Maps of LiDAR-derived (a) canal water surface elevation (CWE) and (b) CWD along canals (width >3 m) in the Central Kalimantan study area, as derived from a LiDAR DTM using data collected in the dry season (August–October) of 2011. DTM elevations above ~4 m + mean sea level (MSL) in the northern part of this area indicate the presence of peat domes [21]. Details for areas A and B are provided in Figure 8 and Figure 9.
Water 12 01486 g007
Figure 8. Demonstration of CWE and CWD patterns along cross section A in Figure 7.
Water 12 01486 g008
Figure 9. Demonstration of CWD pattern in area B in Figure 7. The white dashed area is deep peatland (> 3 m [4]). In this area, CWD values on top of peat domes were mostly below −1.5 m and often below −2.5 m in the dry season of 2011, whereas values in the low-lying rice scheme canals to the east of the area varied between −1 and 0 m.
Water 12 01486 g009