Article

Optimal In-Stream Structure Design through Considering Nitrogen Removal in Hyporheic Zone

1
State Environmental Protection Key Laboratory of Integrated Surface Water-Groundwater Pollution Control, School of Environmental Science and Engineering, Southern University of Science and Technology, Shenzhen 518055, China
2
Guangdong Provincial Key Laboratory of Soil and Groundwater Pollution Control, School of Environmental Science and Engineering, Southern University of Science and Technology, Shenzhen 518055, China
3
Department of Civil Engineering, The University of Hong Kong, Hong Kong 999077, China
*
Author to whom correspondence should be addressed.
Water 2020, 12(5), 1399; https://doi.org/10.3390/w12051399
Submission received: 20 April 2020 / Revised: 9 May 2020 / Accepted: 11 May 2020 / Published: 14 May 2020

Abstract

:
The hyporheic zone (HZ), the region beneath or alongside a streambed, can play a vital role in a stream ecosystem. Previous studies have examined the impacts of in-stream structures on the HZ and river restoration; however, studies on optimizing the design of in-stream structures are still lacking. Therefore, this study aims to propose a method for optimizing the design of in-stream structures (e.g., weirs) through comprehensively considering both nitrogen removal amount (NRA) and nitrogen removal ratio (NRR) in the HZ based on numerical modelling. The Hydrologic Engineering Center’s River Analysis System (HEC-RAS) and COMSOL Multiphysics are employed for surface water and hyporheic flow simulations, respectively, and these two models are coupled by the hydraulic head along the surface of the streambed. The NRA and NRR are both closely related with residence time (RT), while the NRA is also influenced by hyporheic flux. Using the model outputs under different scenarios, regression equations for estimating the relevant variables (e.g., the maximum upstream distance in the subsurface flow influenced by the weir, the RT, and the hyporheic flux) are proposed. Then, the cumulative NRA (CNRA) and NRR can be calculated, and an objective function is formulated as the product of the normalized CNRA and NRR. The results show that the optimal height of the weir can be obtained based on the proposed method, and the validation shows the good general performance of this method. Sensitivity analysis indicates that the optimal height generally can be sensitive to the river discharge, i.e., the optimal height increases when the river discharge increases and vice versa. In addition, it is observed that, in the case of the optimal height, hyporheic flux increases when the slope increases while the influence of depth to bedrock on hyporheic flux is not significant. This study enhances our understanding of the optimal in-stream structure design, and potentially benefits river restoration in the face of continual degradation caused by human activities.

1. Introduction

The hyporheic zone (HZ), which is the region beneath or alongside a streambed and characterized by the active mixing of shallow groundwater and surface water, acts as an active/connecting ecotone between groundwater and surface water [1,2,3,4,5,6,7]. The HZ forms a unique environment for macroinvertebrates and biogeochemical reactions, and is paramount to the biological and ecological functions of streams [2,8]. For example, the biogeochemical reactions in the HZ produce unique water conditions different from that of the stream and groundwater, which is important for the spawning and survival of certain species [9]. Moreover, the HZ is also an important reaction zone of solutes from the stream and/or groundwater. As an example, the role of the HZ in denitrification has been confirmed [10,11,12,13].
Given the importance of the HZ, its restoration has attracted more attention in recent years. The studies on hyporheic restoration can generally be divided into two categories. The first category focuses on examining the impacts of existing river restoration structures on the HZ, or retrofitting existing river restoration structures to restore the HZ functions. In the study of Crispell and Endreny [14], the study sites with cross-vane and J-hooks structures as river restoration structures were investigated via in situ experiments; moreover, the changes of hyporheic flux generated by those structures were simulated using computational fluid dynamics, and some suggestions for the modification of those existing structures for improving hyporheic flux were provided. The other category looks into new in-stream structures and their optimal design for hyporheic restoration [15,16,17,18]. In the study of Hester and Doyle [15], three types of in-stream structures (i.e., step, weir, and lateral structures) were proposed for hyporheic restoration. Their performance under different scenarios was discussed and compared using hyporheic flux, residence time (RT) and depth of the HZ, and the weir was concluded to be the most effective structure in improving hyporheic flux. Hester et al. [16] further confirmed the hyporheic flux induced by the river restoration structure can mitigate thermal stress in the stream caused by humans.
In another study by Hester and Gooseff [17], more specific potential goals and relevant possible methods for hyporheic restoration were discussed. More specifically, both improving the hyporheic exchange and deducing the HZ changes induced by human activities were regarded as the two most important goals. Moreover, the main techniques for enhancing the hyporheic exchange in practice could be generalized in the following three aspects: (1) increasing the head drop, (2) prolonging the length of the exchange ways, and (3) increasing the hydraulic conductivity to generate more exchange flux between surface water and groundwater. Hester and Gooseff [17] also pointed out that the choice of an appropriate site and the optimal design of the river restoration structure are the most important parts of the restoration projects.
Similar to the aforementioned studies, the study of Ward et al. [19] also focused on improving the exchange flux through different structure designs. Through analyzing the designed structure length, structure height, hydraulic conductivity, and the spatiotemporal features of the flow paths, they concluded that the hyporheic flux could be potentially changed by hyporheic restoration structure. In addition, Ward et al. [19] emphasized that the exact goal should be determined clearly before hyporheic restoration structure design. They also summarized some possible goals as follows, for example, changing the thermal distribution temporally and/or spatially (i.e., thermal buffering, thermal lag), enhancing the HZ ecological performance (i.e., salmonid spawning), and maximizing the desired chemical reactions (i.e., denitrification).
Besides strengthening the hyporheic flux, some studies have shown that the river restoration structures can act as a sink for nitrate [20,21,22]. The removal of contaminants (e.g., nitrate) usually occurs in the HZ [23]; therefore, reducing nutrient loading and increasing nutrient removal should be considered as the major objectives of the river restoration [24]. Following the recent advance in understanding the role of the HZ in denitrification [10,12,25,26,27,28,29], nitrogen removal has also been considered during river restoration structure design in recent years. Through analyzing the nitrogen removal ratio, Hester et al. [18] indicated that the influence of the in-stream structures on the nitrogen removal could depend significantly on the structural details, sediment conditions and biogeochemical reaction environment in the HZ. The latter two influential factors are in situ conditions that are more difficult to change; therefore, the design of the in-stream structure becomes very important. Hester et al. [18] pointed out that the nitrogen removal should be considered together with the parameters relevant to the exchange flow (e.g., hyporheic flux, flow path, RT, etc.). However, there is very little information that can guide the optimal design of in-stream structures.
Summarizing the studies mentioned above, hyporheic flux is always an important indicator for the evaluation of the in-stream structure in hyporheic restoration. Some in-stream structures have been proposed to improve the hyporheic flux. However, most focused on the HZ changes induced by the river restoration structures, rather than optimizing the design of the structures. Besides designing for new structures, retrofitting existing in-stream structures to improve the hyporheic exchange has also been studied. Moreover, the function of the HZ on pollutant removal has been considered in some recent hyporheic restoration projects. However, there is still a lack of simplified methods which can be widely used for preliminarily evaluating the suitability of a site and optimizing the design of structures for hyporheic restoration.
To fill this gap, this study proposes a method to optimize the design of in-stream structures by considering the nitrogen removal in the HZ based on numerical modelling. The weir is selected as the representative of in-stream structures since it is regarded as the most effective in improving the hyporheic flux [15]. Among the different factors that can influence the performance of the weir in hyporheic restoration, the height of the weir is one of the most important. Hence, in this study, the proposed method aims to evaluate the HZ performance influenced by different heights of the weir using several indicators (e.g., the maximum upstream distance in the subsurface flow influenced by the weir, the RT, and the hyporheic flux). It also specifically considers the denitrification function of the HZ. Overall, the proposed methods and the results obtained will enhance our understanding and facilitate future studies regarding the evaluation of the nitrogen removal ratio in the HZ, which can be important to the stream ecosystem and benefit the restoration of the stream and the HZ [4,14,17,30,31].

2. Materials and Methods

The first step in this study is to build a numerical model that couples surface water and hyporheic flow using the hydraulic head along the surface of the streambed. Second, regression equations to estimate the relevant indicators for the optimal design of the weir are proposed. Third, the height of the weir is optimized, and the results obtained are validated.

2.1. Numerical Model

In order to simulate the flow regime which is influenced by the weir, HEC-RAS (Hydrologic Engineering Center’s River Analysis System) is employed to simulate surface water flow in this study [32]. Using HEC-RAS, the hydraulic head along the surface of the streambed can be calculated based on the energy equation, and is used as the top boundary condition for subsurface water flow simulation. At the same time, COMSOL Multiphysics is employed to simulate the subsurface flow based on the Brinkman–Darcy equation. Both the surface and subsurface flow simulations are conducted in the steady state.

2.1.1. Hydrologic Engineering Center’s River Analysis System (HEC-RAS) for Surface Water Simulation

In the surface water simulation, this study basically follows the study of Hester and Doyle [15]. The length of the domain is 20 m, and the weir is located in the middle of the domain (see Figure 1); the width of the stream is 3 m, and the maximum depth of the stream is 1 m, with the rectangular cross-section as illustrated in Figure 1; the Manning coefficient of the streambed is 0.03. The boundary condition upstream of the weir is set as the calculated critical depth of the flow. In order to detect the exact upstream location at which the depth is critical, the standard step method, which is a computational technique to estimate one-dimensional surface water profiles in open channels with gradually varied flow under steady state conditions, is used in HEC-RAS. In this method, by applying the energy equation from the location of the weir where the water height (above the weir) correlated with the designed stream discharge, the exact upstream location of critical depth can be obtained through an iterative process. In addition, the downstream boundary condition, that is, the right end of the domain, is set as the normal depth (see Figure 1). Based on such information, the hydraulic head along the surface of the streambed can be calculated when the river discharge is designated. The energy equation for the simulation of surface water is as follows [33]:
Z 2 + Y 2 + c 2 V 2 2 2 g = Z 1 + Y 1 + c 1 V 1 2 2 g + h e
where Z1 and Z2 are elevations of the main channel inverts (m), Y1 and Y2 are depths of water at cross sections (m), V1 and V2 are average velocities at cross sections (m/s), c1 and c2 are velocity weighting coefficients, g is gravitational acceleration (m/s2), and he is energy head loss (m).

2.1.2. COMSOL Multiphysics for Hyporheic Flow Simulation

Imposing the hydraulic heads along the surface of the streambed as the upper boundary condition, the hyporheic flow is simulated using COMSOL Multiphysics. In this study, the weir and the surface flow conditions are assumed to govern the hydraulic head distribution along the surface of the streambed; the feedback from the subsurface is, therefore, ignored. The left and right boundary conditions are assumed to have hydraulic heads corresponding to the total hydraulic head of the surface water at those locations, while there is no flow at the bottom boundary of the domain (Figure 1). The Brinkman–Darcy equation for the simulation of subsurface flow is as follows [34]:
ρ ( 1 ε u t + 1 ε 2 ( u u ) ) + p μ e 2 u + μ k u = 0
where ρ is the density of the fluid (kg/m3), u is the flow velocity (m/s), t is the time (s), p is the pressure (Pa), μ is the dynamic viscosity (Pa·s), μe is the effective viscosity (Pa·s), k is the intrinsic permeability (m2), ε is the Brinkman porosity, and μu/k is the Darcy term (Pa/m).

2.1.3. Nitrogen Transport/Removal Calculation

For each subsurface flow path, the concentration of the nitrogen can be assumed to be related to the RT using the first order reaction expression [35]:
C R T = C 0 exp ( r R T ) C = C 0 C R T
where C0 is the initial concentration of the nitrogen (i.e., 0.307 mol/m3 in this study), CRT is the concentration of the nitrogen (mol/m3) with the reaction time of RT, C is the change in the nitrogen concentration in the time duration of RT, and r is the reaction rate constant (day−1). It is worth noting that the unit of the RT in Equation (3) should be day. Thus, the nitrogen removal amount (NRA, mol) for each flow path can be expressed as follows:
N R A = C Q u
Then, the cumulative NRA (CNRA, mol) can be calculated as the sum of the NRA for all the flow paths within the maximum upstream distance in the subsurface flow influenced by the weir (Lmax):
C N R A = i = 1 N N R A i = x = 0 L max C Q u ( x ) d x
where N denotes the total number of the flow paths, and i denotes the i-th path line.
Let NRR be the nitrogen removal ratio, which is regarded as another performance indicator. Here, the NRR of the HZ is defined as the difference between 1 and the ratio of the total nitrogen (TN, mol/m3) in the HZ at the RTmean (i.e., the mean RT) and the total initial nitrogen in the HZ. Thus, the NRR can be computed as follows:
N R R = 1 T N R T m e a n T N 0
Here, RTmean is used as the reaction time because it is considered to be the most single representative value given the variation of RT under different HZ scenarios [6].

2.1.4. Modeling Scenarios

To examine the impact of weir height on the HZ, various modeling scenarios are adopted, as listed in Table 1. In this study, the height of the weir varies from 0.3 m to 0.7 m with equal intervals of 0.1 m, and the variables to be held constant are defined as slope of 0.01, river discharge of 1 m3/s, and depth to bedrock of 5 m. It is worth noting that, in this study, the h values used for determining the optimal h lie within the range of the modeling scenarios (i.e., [0.3, 0.7] m), but with equal intervals of 0.01 m.

2.2. Optimal In-Stream Structure Design

2.2.1. Framework

For designing the optimal weir in hyporheic restoration, hyporheic flux and biochemical reactions (e.g., nitrification and denitrification) are two important factors. Previous studies have found that higher in-stream structures can induce more hyporheic flux, and denitrification is closely related to the RT. Therefore, this study examines the optimal structure design to enhance denitrification in the HZ by increasing hyporheic flux and RT. Specifically, both the hyporheic flux and the RT impacted by the height of the weir are investigated.

2.2.2. Relevant Indicators

In order to make the results of this study more widely applicable and simplify the evaluation procedures of other studies, this study derives empirical equations based on the simulation results to describe the changes in the RT and hyporheic flux at the streambed with the weir in the stream.
This study assumes that the maximum upstream distance in the subsurface flow influenced by the weir (Lmax) can be related to the height of the weir (h). Therefore, the Lmax can be expressed as follows:
L max = f ( h )
Based on the numerical modeling results, this study traces the subsurface flow paths of the particles that fall within the Lmax. It means that particle tracing is first used in the numerical simulations and then the RT values for the subsurface flow paths are used to develop the coefficients of the regression equations. This study assumes that (1) the RT and the hyporheic flux in the upstream (Qu) can be expressed as functions of x using the regression method, where x is the distance measured from the left boundary of the domain, and (2) the coefficients of the regression equations can be related to h. Previous studies have shown that the regression equations in the form of power law can be the best to describe the RT and Qu [36,37] and, therefore, the RT and Qu can be expressed as follows:
R T = a 1 ( h ) x b 1 ( h )
Q u = a 2 ( h ) x b 2 ( h )
where a1(h) and b1(h) are the coefficients of the regression equation for the RT, and a2(h) and b2(h) are the coefficients of the regression equation for the Qu. Based on the simulation results under different scenarios with different h values, the forms of these coefficients can be determined (see Section 3 for details).

2.2.3. Objective Function

For each designated h value, the CNRA and NRR values can be calculated. It is worth noting that a higher h value can lead to a higher CNRA value, but a lower NRR value. As a result, there should be an optimal height of the weir which strikes a balance between the CNRA and NRR values. To this end, the objective function for the optimal design of the weir (i.e., the height of the weir) in this study is expressed by the product of the CNRA and NRR values for each designated h value. Furthermore, to facilitate comparison, the CNRA and NRR values are normalized using the following method:
N C N R A j = C N R A j j = 1 M C N R A j
N N R R j = N R R j j = 1 M N R R j
where CNRAj and NRRj are the CNRA and NRR values corresponding to the j-th h value, respectively; NCNRAj and NNRRj are the j-th normalized CNRA and NRR values; M is the data length, which is equal to the total number of h values.
Therefore, the objective function is formulated as follows:
Max .   { N C N R A j N N R R j }
It indicates that the optimal h of the weir can be obtained when the product of the corresponding NCNRA and NNRR values reaches the maximum.

2.3. Validation and Sensitivity Analysis Methods

Since the optimal h of the weir is obtained from the proposed method, it is important and necessary to validate the effectiveness of this method. In this study, two validation methods are used as follows: the first method compares the results from the numerical models for surface and subsurface flow simulation and the empirical equations for calculating the nitrogen removal (both amount and rate) in the HZ. The second method compares the results of denitrification simulation. The denitrification is simulated and is coupled with the hyporheic flow simulation using COMSOL Multiphysics. The following equation is used for denitrification simulation in the HZ:
c N O 3 t = D 2 c N O 3 z 2 u c N O 3 z k d c N O 3
where u is the flow velocity in the streambed (m/s), D is the dispersion coefficient (m2·s), cNO3- is the concentration of the nitrate (mol/m3), and kd is the reaction rate constant of denitrification (s−1).
The height of the weir is optimal if the nitrogen removal of the whole HZ is the maximum when compared to that of other heights. In this study, two indices are proposed to describe the nitrogen removal performance of the HZ driven by different heights of the weir. One is as follows:
M 1 d e n ( h i ) = 0 R T max ( h i ) [ c N O 3 ( t , h i ) c N O 3 ( t 1 , h i ) ] q H Z ( h i ) d t
where hi is the i-th height (m) and qHZ is the hyporheic flux (m2/s). This index considers the HZ as a single reaction tank, and the RTmax is the maximum value of the denitrification reaction time. The other one is as follows:
M 2 d e n ( h i ) = 0 T [ c N O 3 ( t , h i ) c N O 3 ( t 1 , h i ) ] q H Z ( h i ) d t
The second index regards the HZ as a continuous reaction tank for denitrification simulation. In this equation, T ≥ max(RTmax(hi)).
For both of the above two methods, the result using the optimal h value will be obtained first, and then be compared against those obtained using other h values.
In addition, sensitivity analysis of the proposed method to optimize the height of the weir will be conducted from two aspects: the first investigates the sensitivity to the range of the h values used for searching the optimal h, while the second investigates the sensitivity to the variables to be held constant (e.g., river discharge, slope and depth to bedrock in Table 1).

3. Results and Discussion

3.1. Regression Equations

3.1.1. The Maximum Upstream Distance in the Subsurface Flow Influenced by the Weir (Lmax)

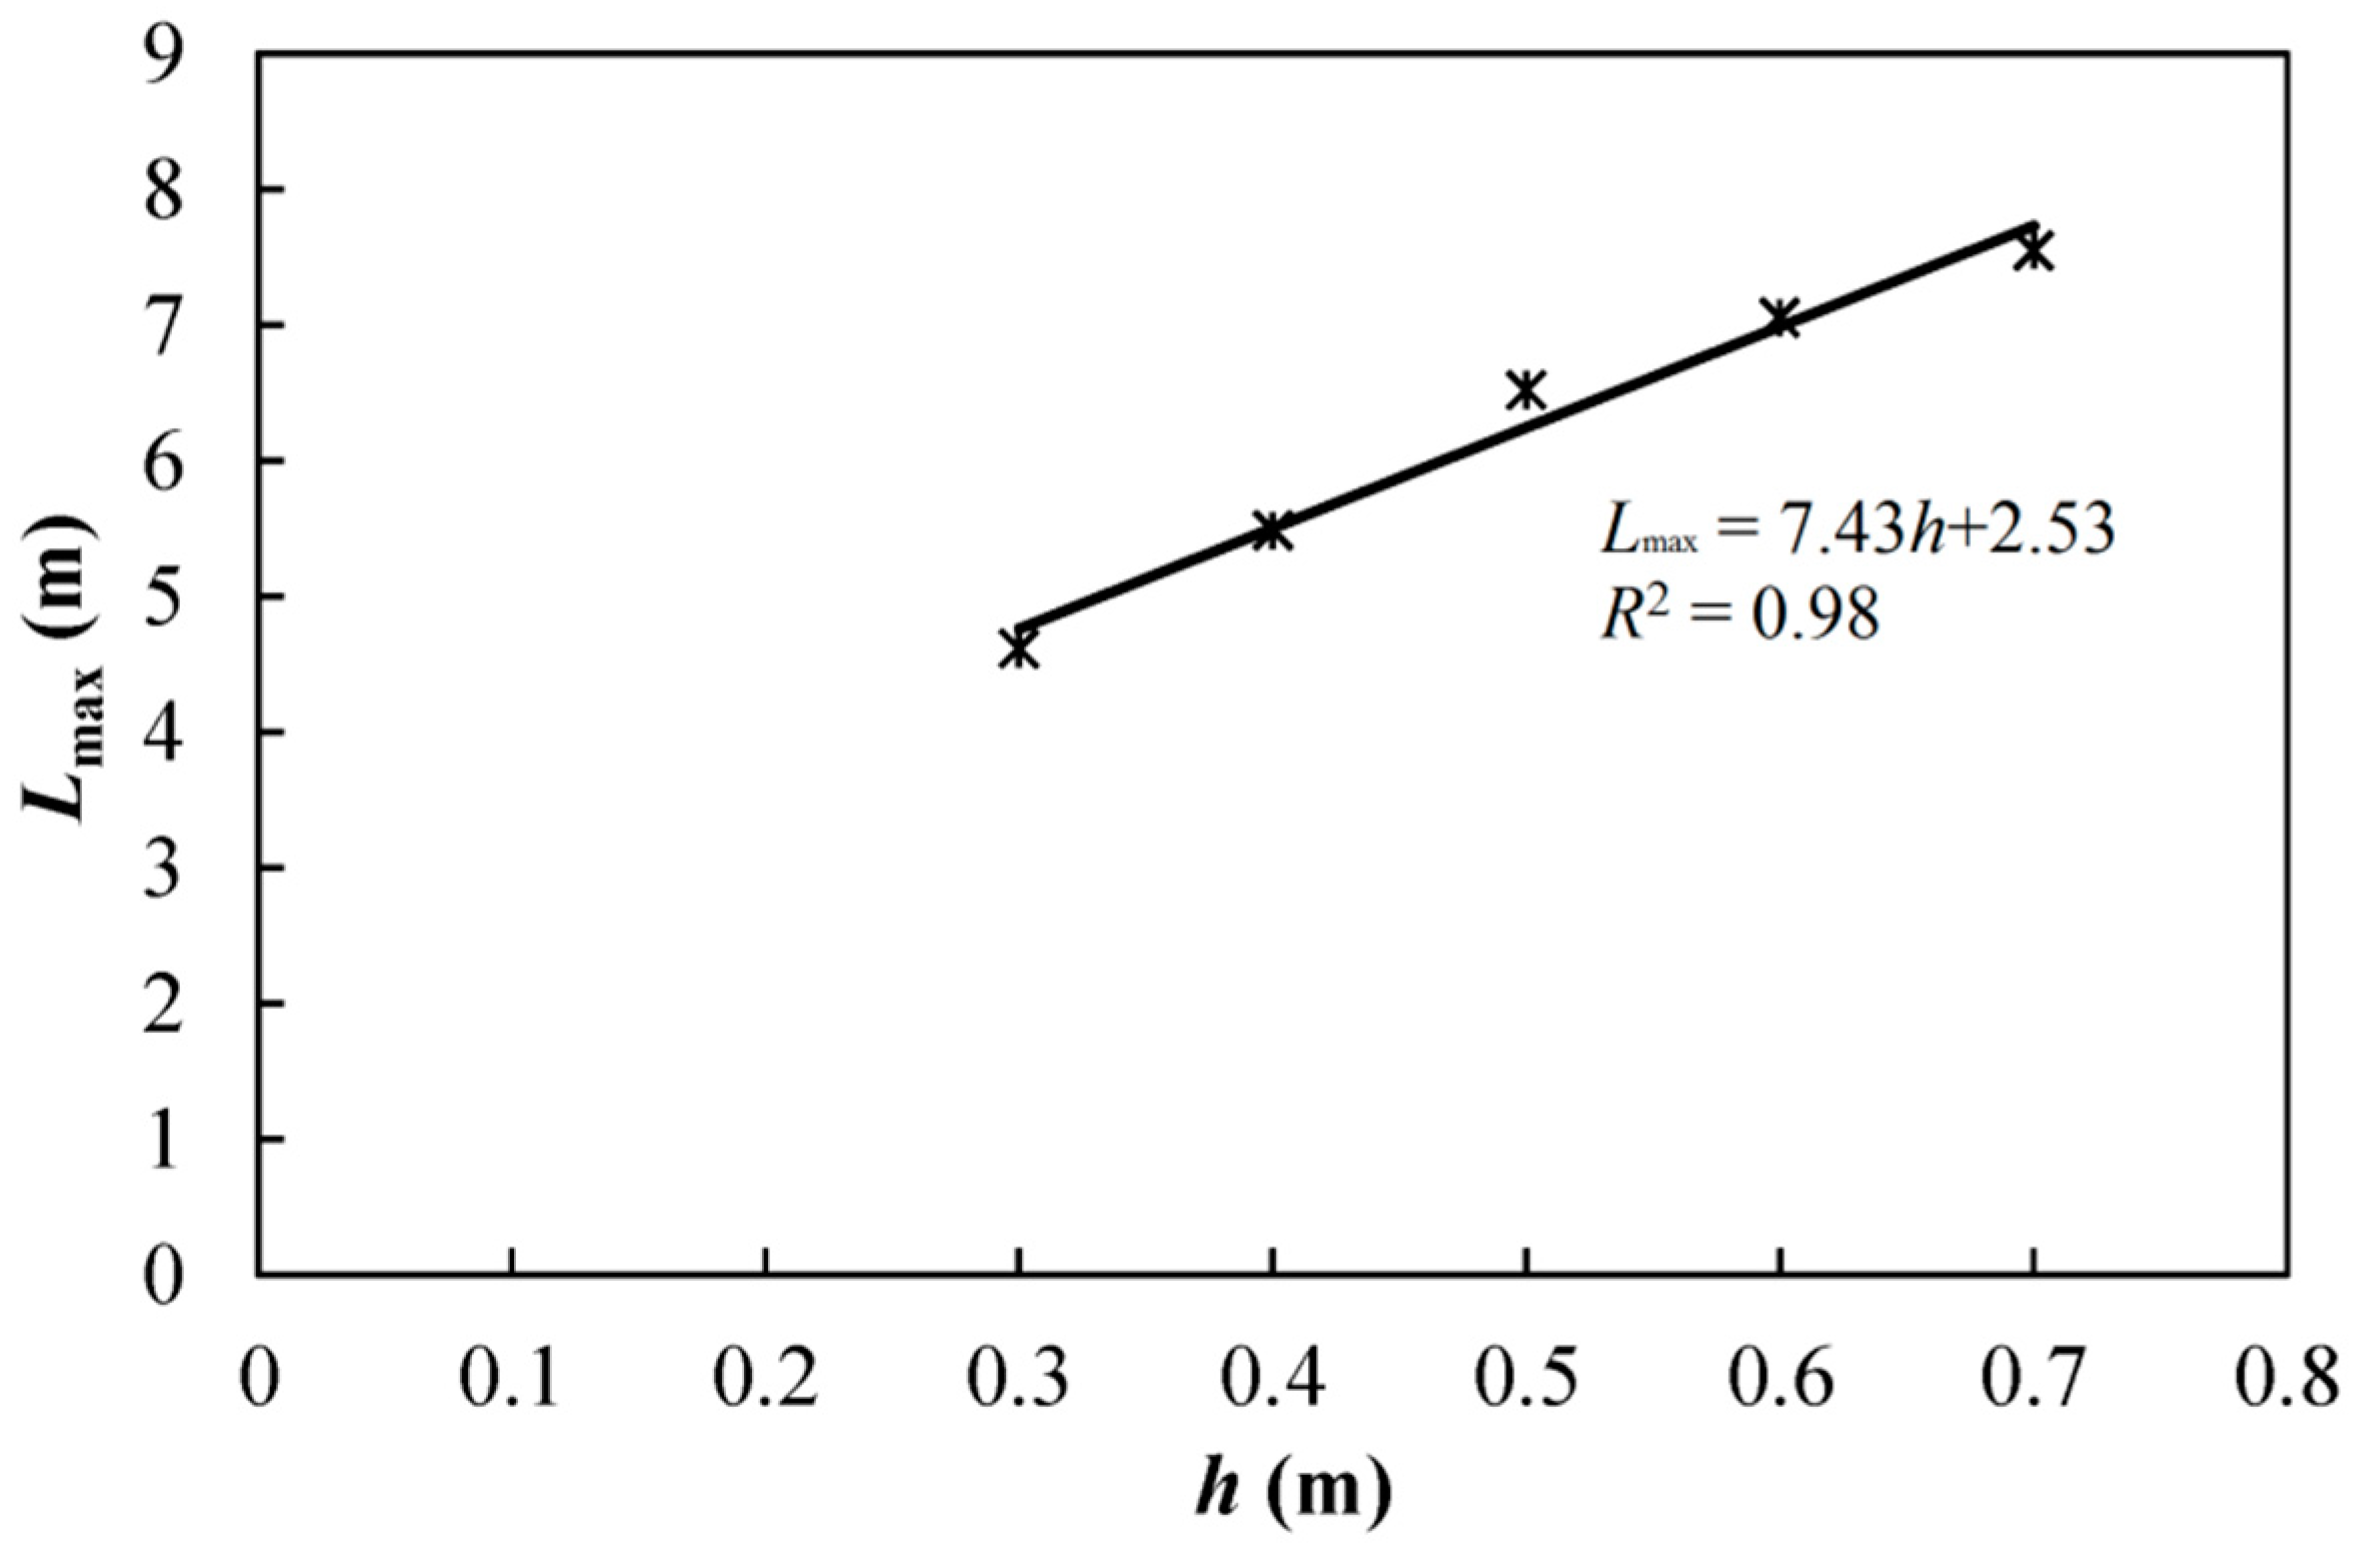
The weir is expected to influence the flow conditions of both surface and subsurface water, which can lead to the change of the Lmax; moreover, a higher weir should lead to a larger Lmax. In this study, the simulation results show that the Lmax increases along with the increase of the height of the weir (h) (Figure 2). In order to evaluate the accuracy of the regression equation, the coefficient of determination (R2) is selected as the assessment criterion. As the R2 value is very high (i.e., 0.98), the relationship between Lmax and h can be expressed as follows:
L max = 7.43 h + 2.53 , R 2 = 0.98
The positive coefficient of the h in Equation (16) confirms that a higher weir can lead to a larger Lmax. Moreover, the relationship is simple and linear, which could be partly due to the homogeneity of the streambed.

3.1.2. Residence Time (RT)

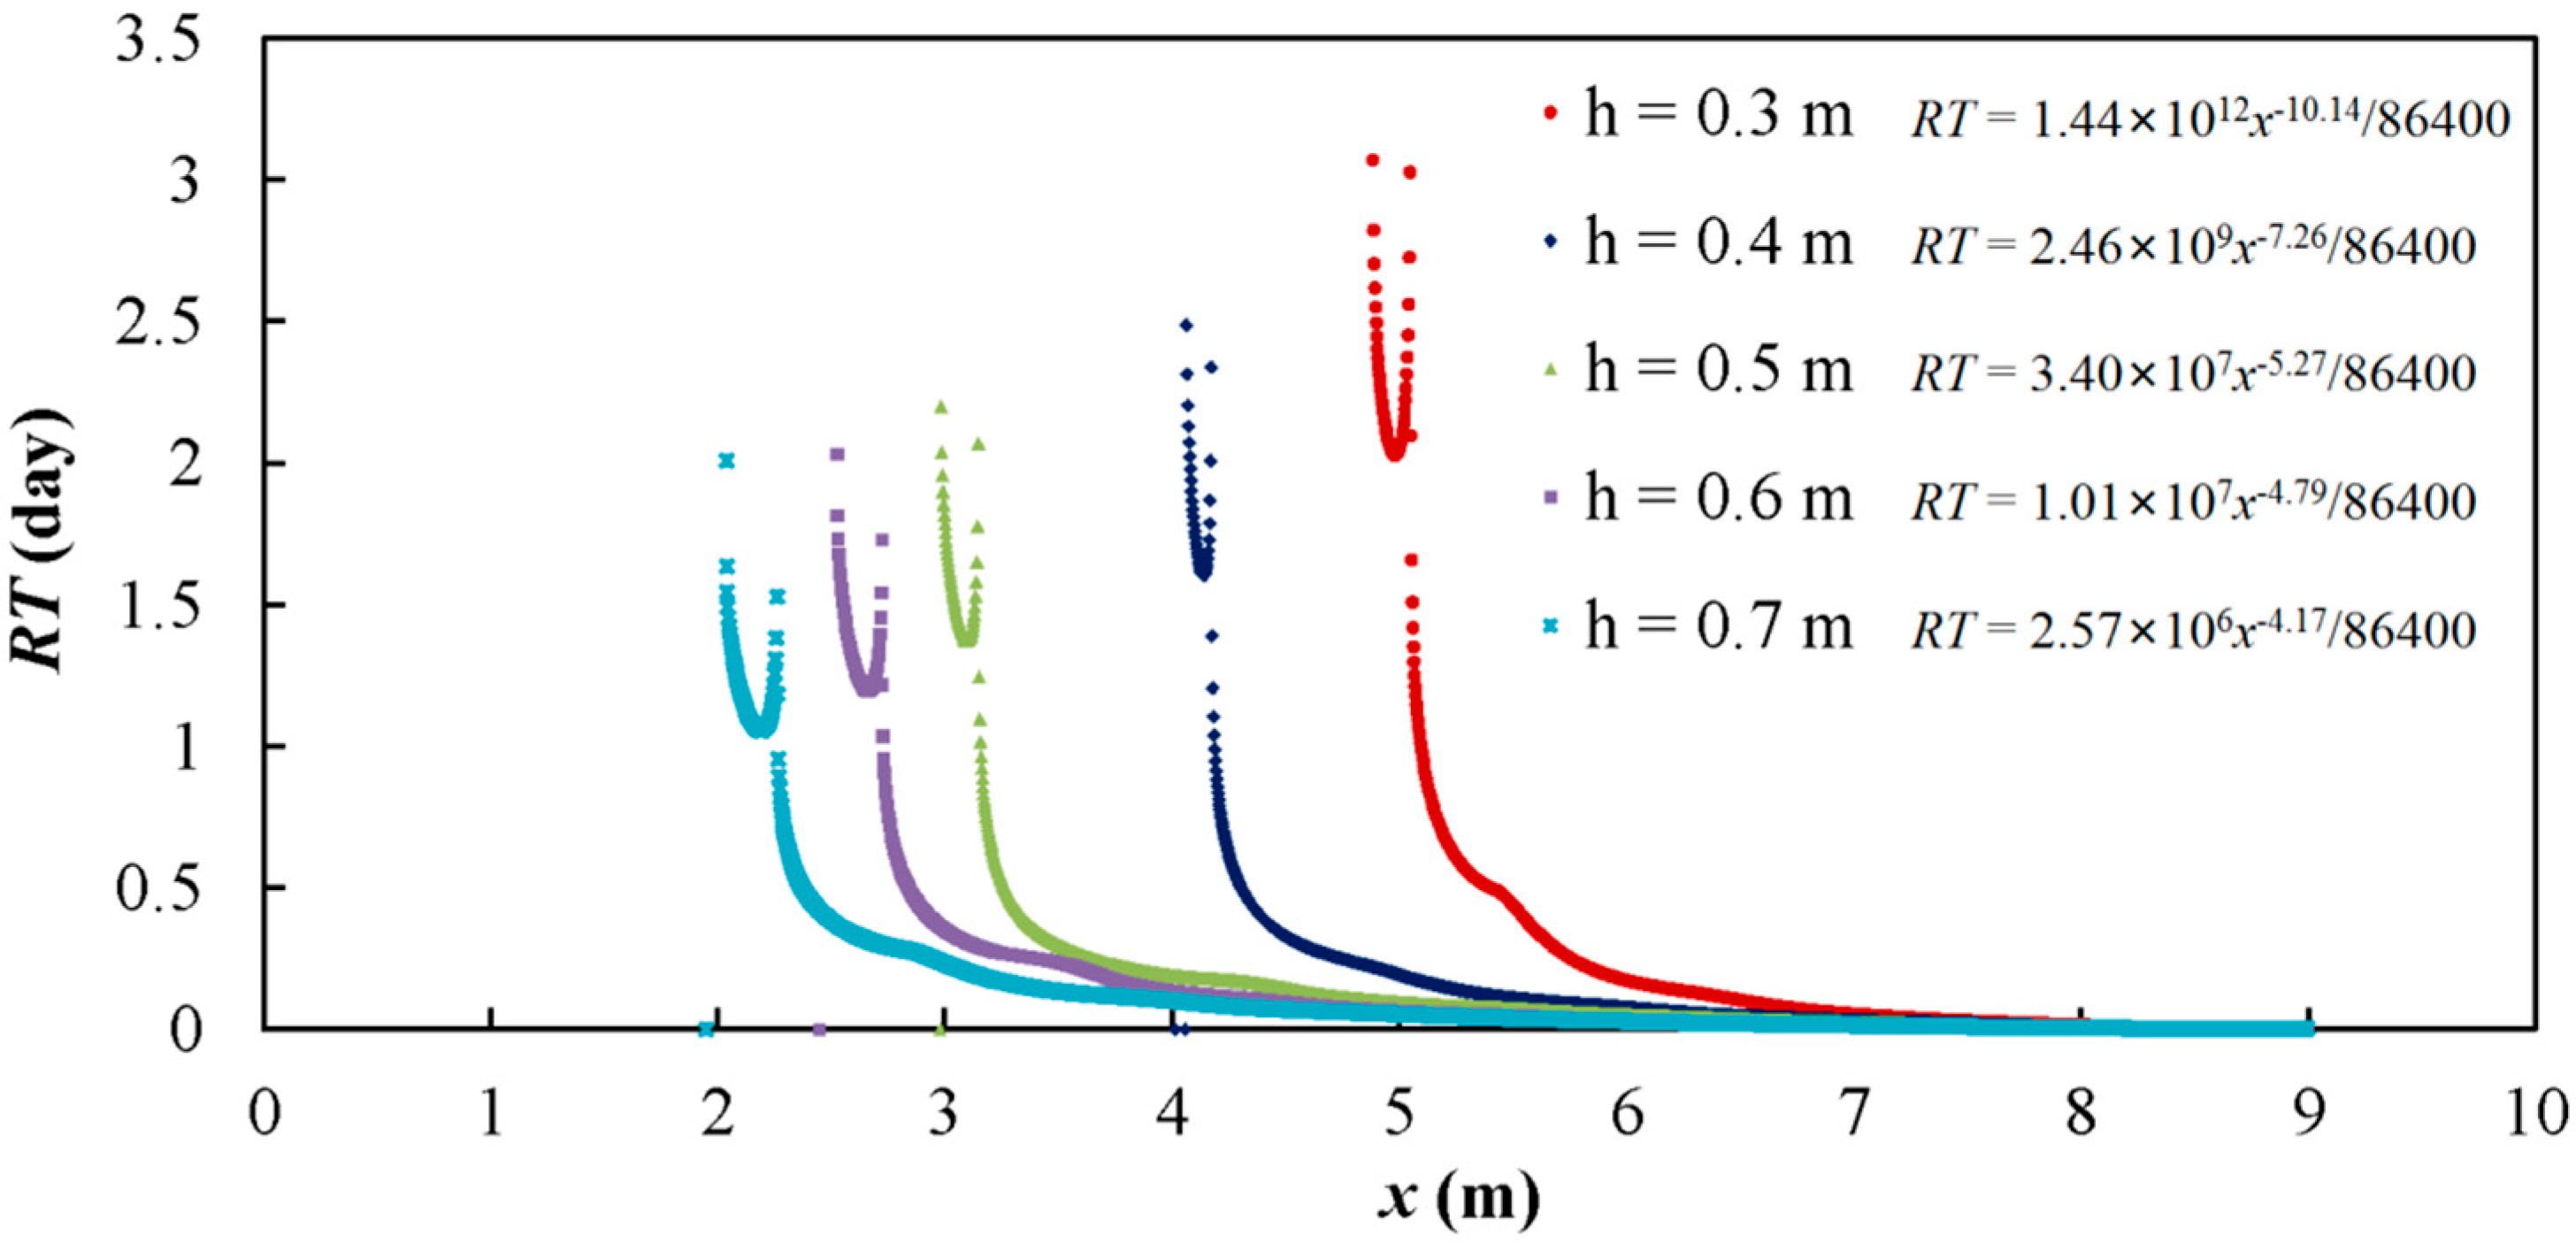
Figure 3 shows the relationship between the RT and the distance from the left boundary of the domain under the five modeling scenarios with different h values. It is observed that the maximum RT value decreases along with the increase of the h. Figure 3 also proves that the Lmax increases along with the increase of the h. According to the assumptions in Section 2.2.2, the RT can be expressed as the function of x in the form of a power law using the regression method. Therefore, the coefficients of the regression equations for all h values can be obtained, which are listed in Table 2. The R2 values of the regression equations are also shown in this table, and they are all higher than 0.91, indicating that the regression equations fit the simulation results very well.
As mentioned in Section 2.2.2, the coefficients of the regression equations can be related to the h, and Figure 4 shows that a1 decreases with the increase of the h while b1 increases with the increase of the h. Thus, the relationships between the two coefficients and h can be expressed as follows:
a 1 ( h ) = e x p ( 31.97 h + 35.56 ) , R 2 = 0.89 b 1 ( h ) = 14.41 h 13.53 , R 2 = 0.88
It is worth noting that the logarithmic values of a1 (i.e., Ln(a1)) are used for establishing the regression equation because the range of a1 is large. The R2 values are high, i.e., 0.89 for Ln(a1) and 0.88 for b1, respectively, which indicate that these two coefficients can be represented well by the h.
Additionally, in Figure 3, for different weir heights, the RT first generally increases along the upstream direction. It then sharply decreases and increases. This is possibly influenced by the backwater from the weir, and the location with sharp decrease and increase of the RT could show the extent of the HZ influenced by different ranges of the backwater from the weir. To be specific, when the weir height is 0.3 m, the influenced range is around 4 m (i.e., = 9–5 m in Figure 3) from the weir. However, when the weir height is 0.7 m, this influenced range could reach around 6.7 m (i.e., = 9–2.3 m in Figure 3).

3.1.3. Hyporheic Flux in the Upstream (Qu)

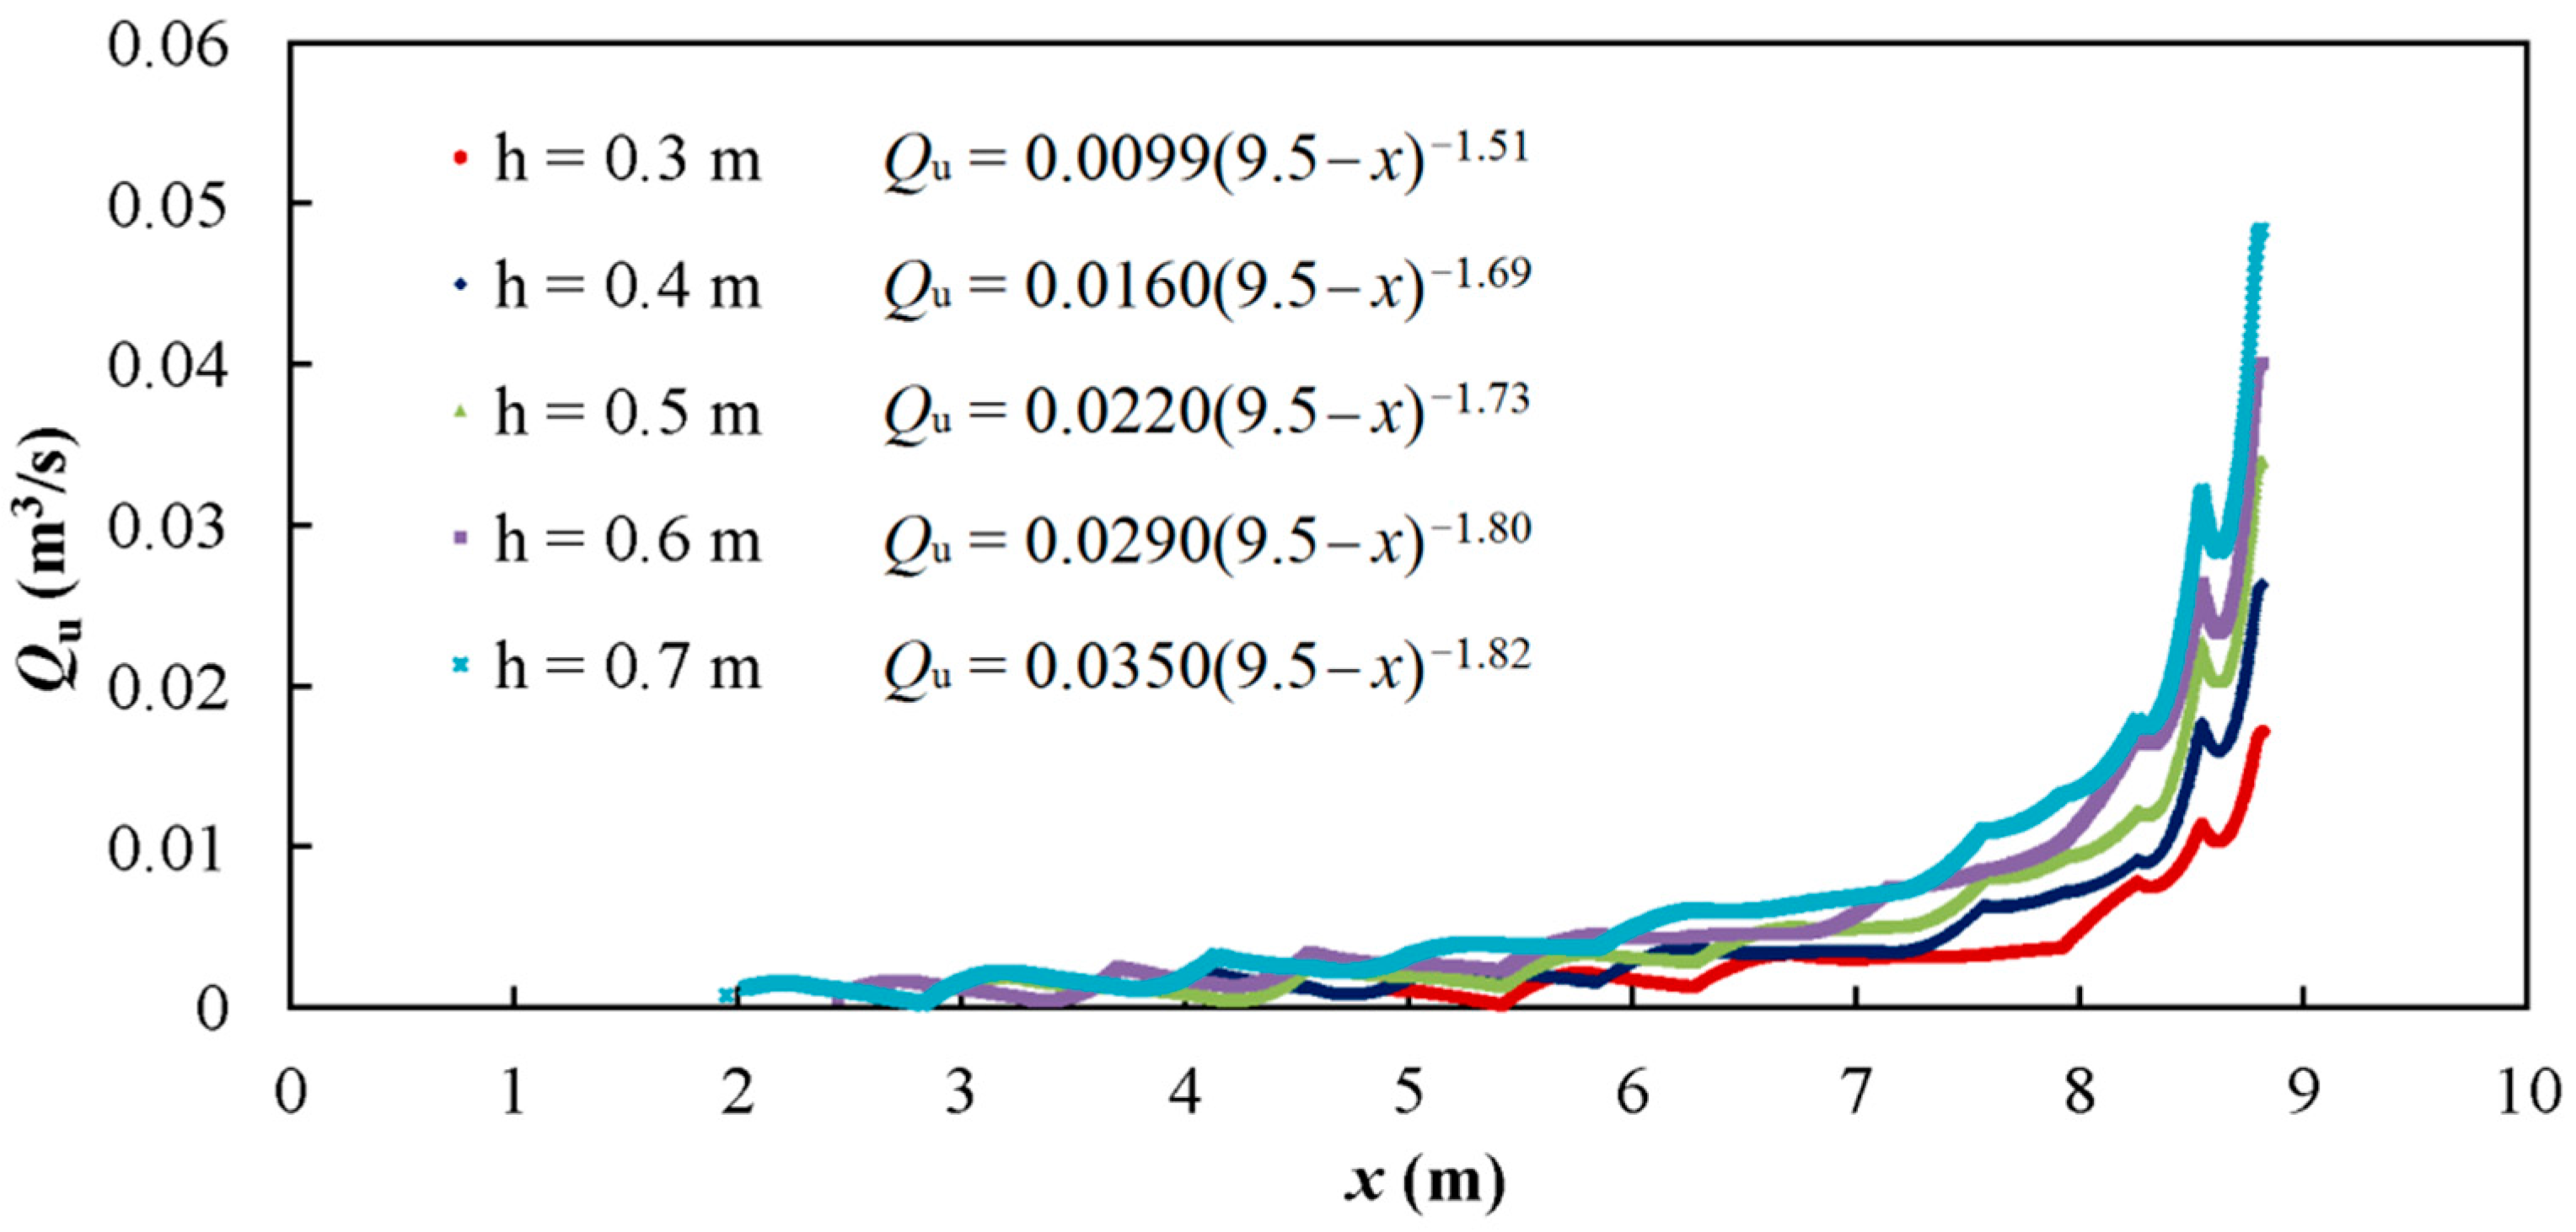
Figure 5 shows the relationship between the Qu and the distance from the left boundary of the domain under the five modeling scenarios with different h values. It can be observed that the maximum Qu increases along with the increase of the h. In order to better match the simulation results, Equation (9) is adjusted as follows:
Q u = a 2 ( h ) ( 9.5 x ) b 2 ( h )
where the value of 9.5 simply accounts for the location of the weir measured from the left boundary of the domain. Table 3 lists the coefficients of the regression equations for calculating the Qu under the five modeling scenarios with different h values. The R2 values of the regression equations are all higher than 0.71, indicating that the regression equations can basically fit the simulation results.
Similar to the RT, Figure 6 shows the relationships between the two coefficients of the regression equations for the Qu and h. It is observed that a2 increases with the increase of the h while b2 decreases with the increase of the h. Thus, the relationships between the two coefficients and h can be expressed as follows:
a 2 ( h ) = 0.06 h 0.01 , R 2 = 1.00 b 2 ( h ) = 0.74 h 1.34 , R 2 = 0.87
It is worth noting that the R2 value for a2 is equal to 1.00, which indicates the perfect fit; the R2 value for b2 is also high, i.e., 0.87. As a result, these two coefficients can be closely related to the h.

3.2. Objective Function Calculation

3.2.1. Cumulative Nitrogen Removal Amount (CNRA) and Nitrogen Removal Ratio (NRR)

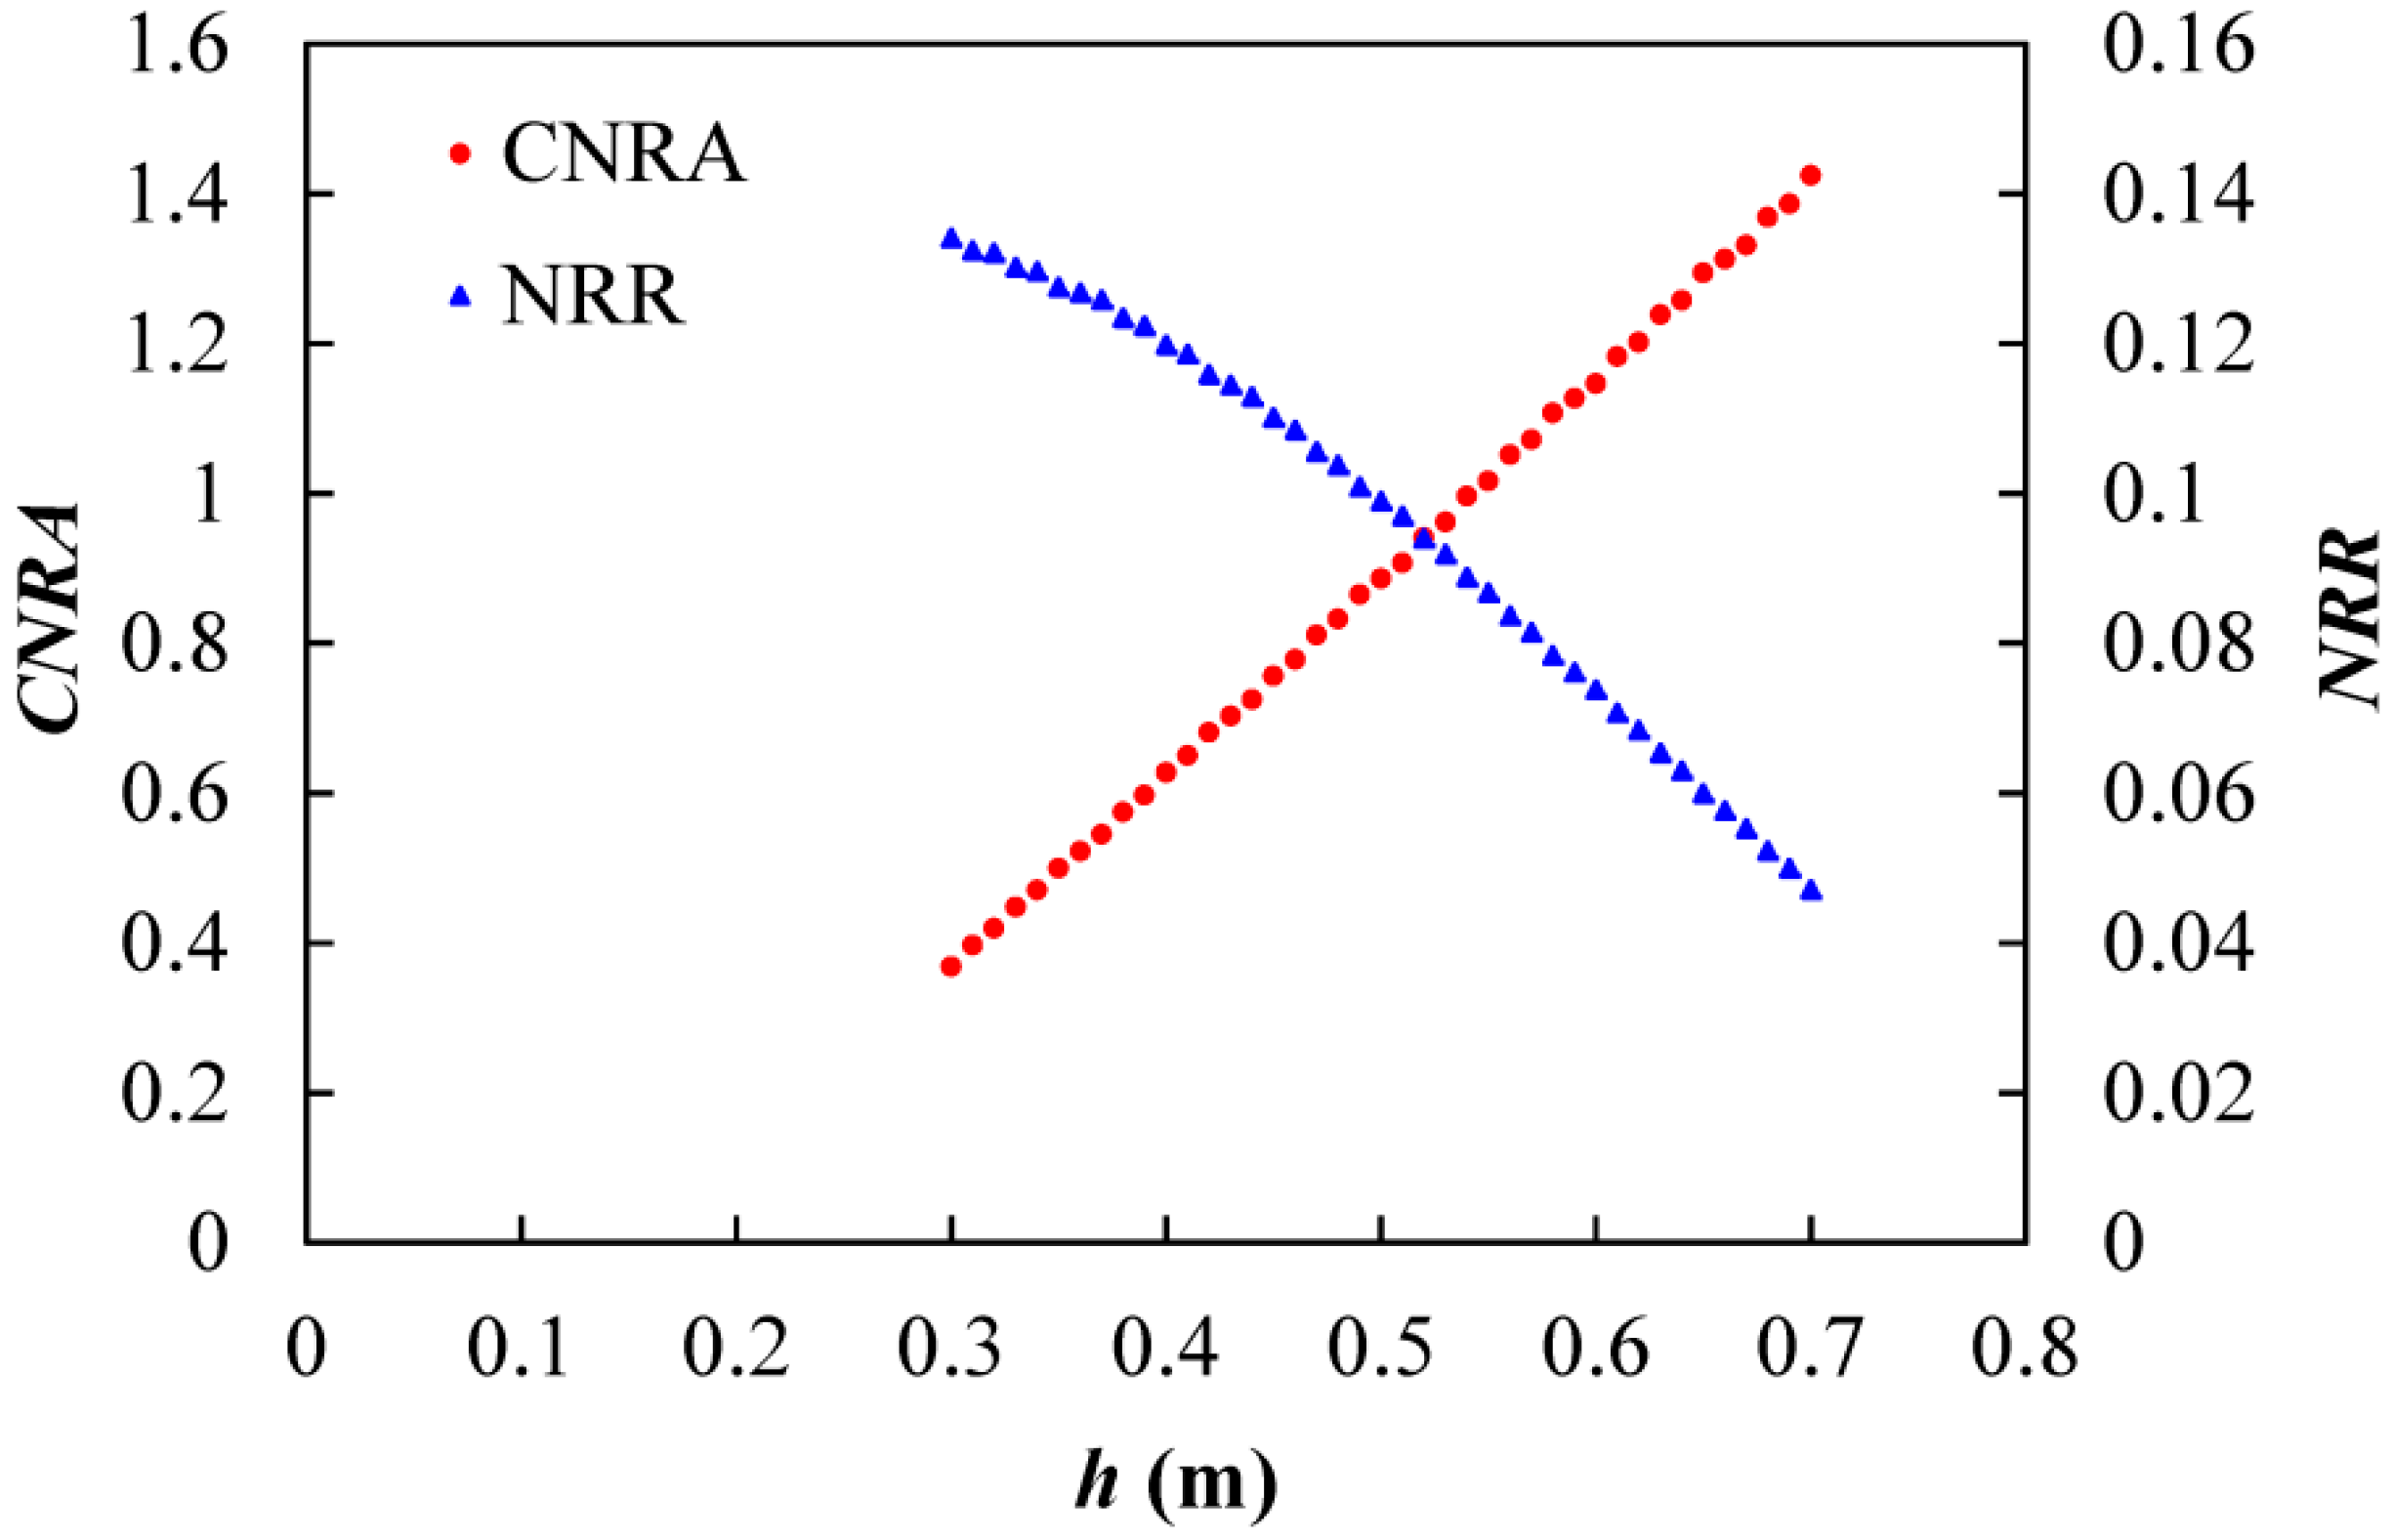
Based on the equations obtained in Section 3.1, the CNRA and NRR values for each designated h value can be calculated. For example, the RT and Qu values for each designated h value can be firstly calculated based on Equations (8) and (17)–(19), and then, the corresponding CNRA values can be calculated based on Equations (3)–(5). Similarly, the NRR values for each designated h value can be calculated based on Equations (6), (8) and (17). Figure 7 shows the relationships of the CNRA and NRR with the h. As h increases, the CNRA increases but the NRR decreases. It is clear that there will be an optimal h which strikes a balance between the two indicators.

3.2.2. Optimal Height of the Weir

The CNRA and NRR values are firstly normalized using Equations (10) and (11), and then, the objective function, which is the product of the CNRA and NRR values, is calculated. Figure 8 shows the relationship between the objective function and the h. It is observed that, as h increases, the objective function firstly increases and then decreases. The maximum value of the objective function is associated with the optimal h, which is 0.54 m.

3.2.3. Validation

In order to validate the effectiveness of this method, the numerical models of HEC-RAS and COMSOL Multiphysics are run using the optimal h value of 0.54 m, and the results are compared against those obtained with the h values of 0.5 m and 0.6 m. The CNRA and NRR values and their products under these three scenarios are calculated and listed in Table 4. Along with the increase of the h value, the CNRA value increases but the NRR value decreases. This is the same as that shown in Figure 7. The product under the scenario using the optimal h value of 0.54 m (i.e., 0.63) is larger than those under the scenarios using the h values of 0.5 m (i.e., 0.40) and 0.6 m (0.50). As a result, the good performance of the proposed method is confirmed.
In addition, the effectiveness of the proposed method is further validated through directly simulating the denitrification in the HZ. The two indices for describing the nitrogen removal performance of the HZ are calculated, and Table 5 lists the results of denitrification simulations with the five h values. It is observed that both indices show that the height of 0.54 m gives the best performance. Therefore, the effectiveness of the proposed method is further validated from the aspect of temporal accumulation of the nitrogen removal in the HZ.

3.3. Sensitivity Analysis

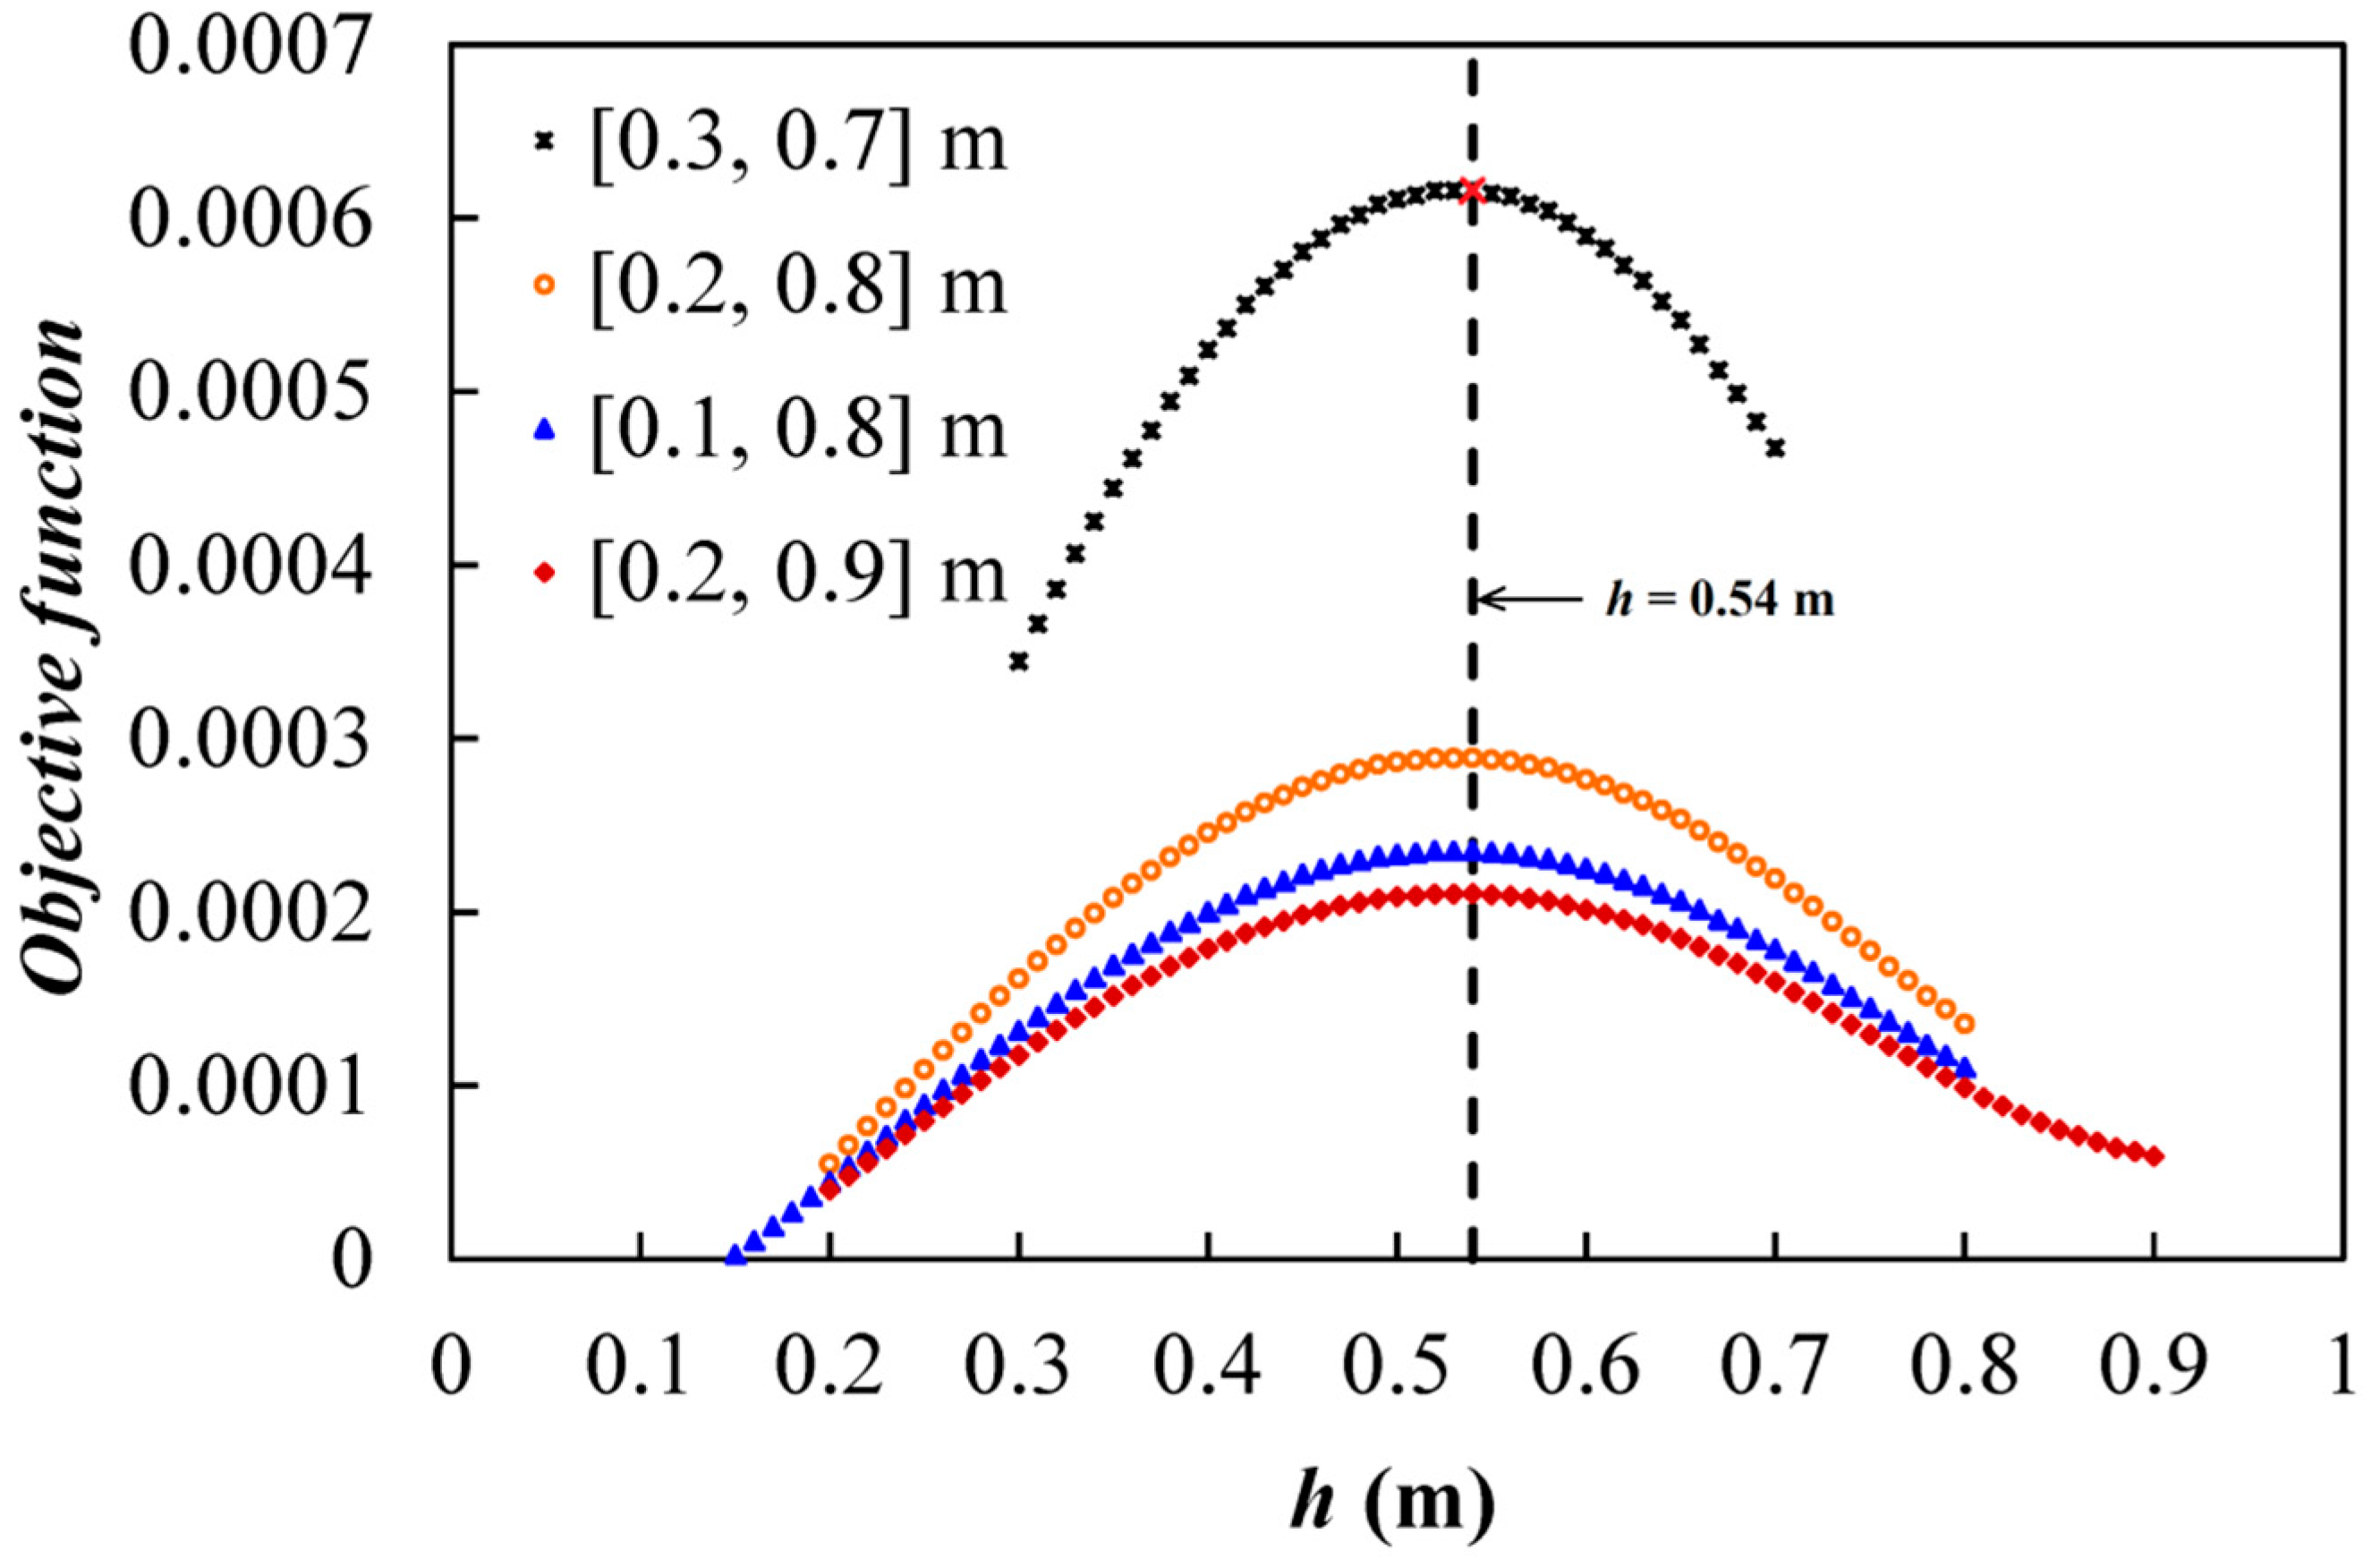
In order to investigate the sensitivity of the proposed method to the range of the h values used for searching the optimal h, different ranges of the h values, e.g., [0.1, 0.8] m, [0.2, 0.8] m, and [0.2, 0.9] m, are selected. The relevant results are compared and shown in Figure 8. It is observed that the optimal h (i.e., 0.54 m, the dash line in Figure 8) remains the same, and that it is not sensitive to the range of the h values used for searching the optimal h.
The influence of different river discharges on the optimal height of the weir is also examined. As the river discharge of the base case is 1.0 m3/s (Table 1), two other river discharges (i.e., 0.5 m3/s and 1.5 m3/s) are used to investigate the change of the optimal h when river discharge increases/decreases by 50%. The denitrification simulation method mentioned in Section 2.3 is adopted and M1den is employed to evaluate the performance of the weir in the nitrogen removal. For each of the three river discharges, simulations under three different heights of the weir (i.e., 0.53 m, 0.54 m and 0.55 m) are conducted in order to detect the generic trends of the optimal h.
Table 6 lists the simulation results. If the river discharge decreases from 1.0 m3/s to 0.5 m3/s, the maximum M1den value, which indicates the best performance in the nitrogen removal, is associated with the height of 0.53 m (see column 1 in Table 6), and the actual optimal height might be lower for the discharge of 0.5 m3/s. Even 0.53 m might not be the optimal h under the river discharge of 0.5 m3/s, and it is smaller than the optimal h under the river discharge of 1.0 m3/s (i.e., 0.54 m). Therefore, it can be concluded that the optimal h decreases when the river discharge decreases. Conversely, if the river discharge increases from 1.0 m3/s to 1.5 m3/s, the maximum M1den value is associated with the height of 0.55 m (see column 3 in Table 6), which indicates that the optimal h increases when the river discharge increases. As a result, the optimal h can be generally sensitive to the river discharge. It is not surprising, as the larger river discharge may bring more nitrogen from surface water to the HZ; if the nitrogen loading is below the HZ nitrate removal capacity, the weir should be higher in order to improve the performance in the nitrogen removal because the higher weir can enhance the interaction between surface water and groundwater and the denitrification in the HZ. However, if the nitrogen loading is above the nitrogen removal capacity of the HZ, the water should be treated first instead of increasing the height of the weir.
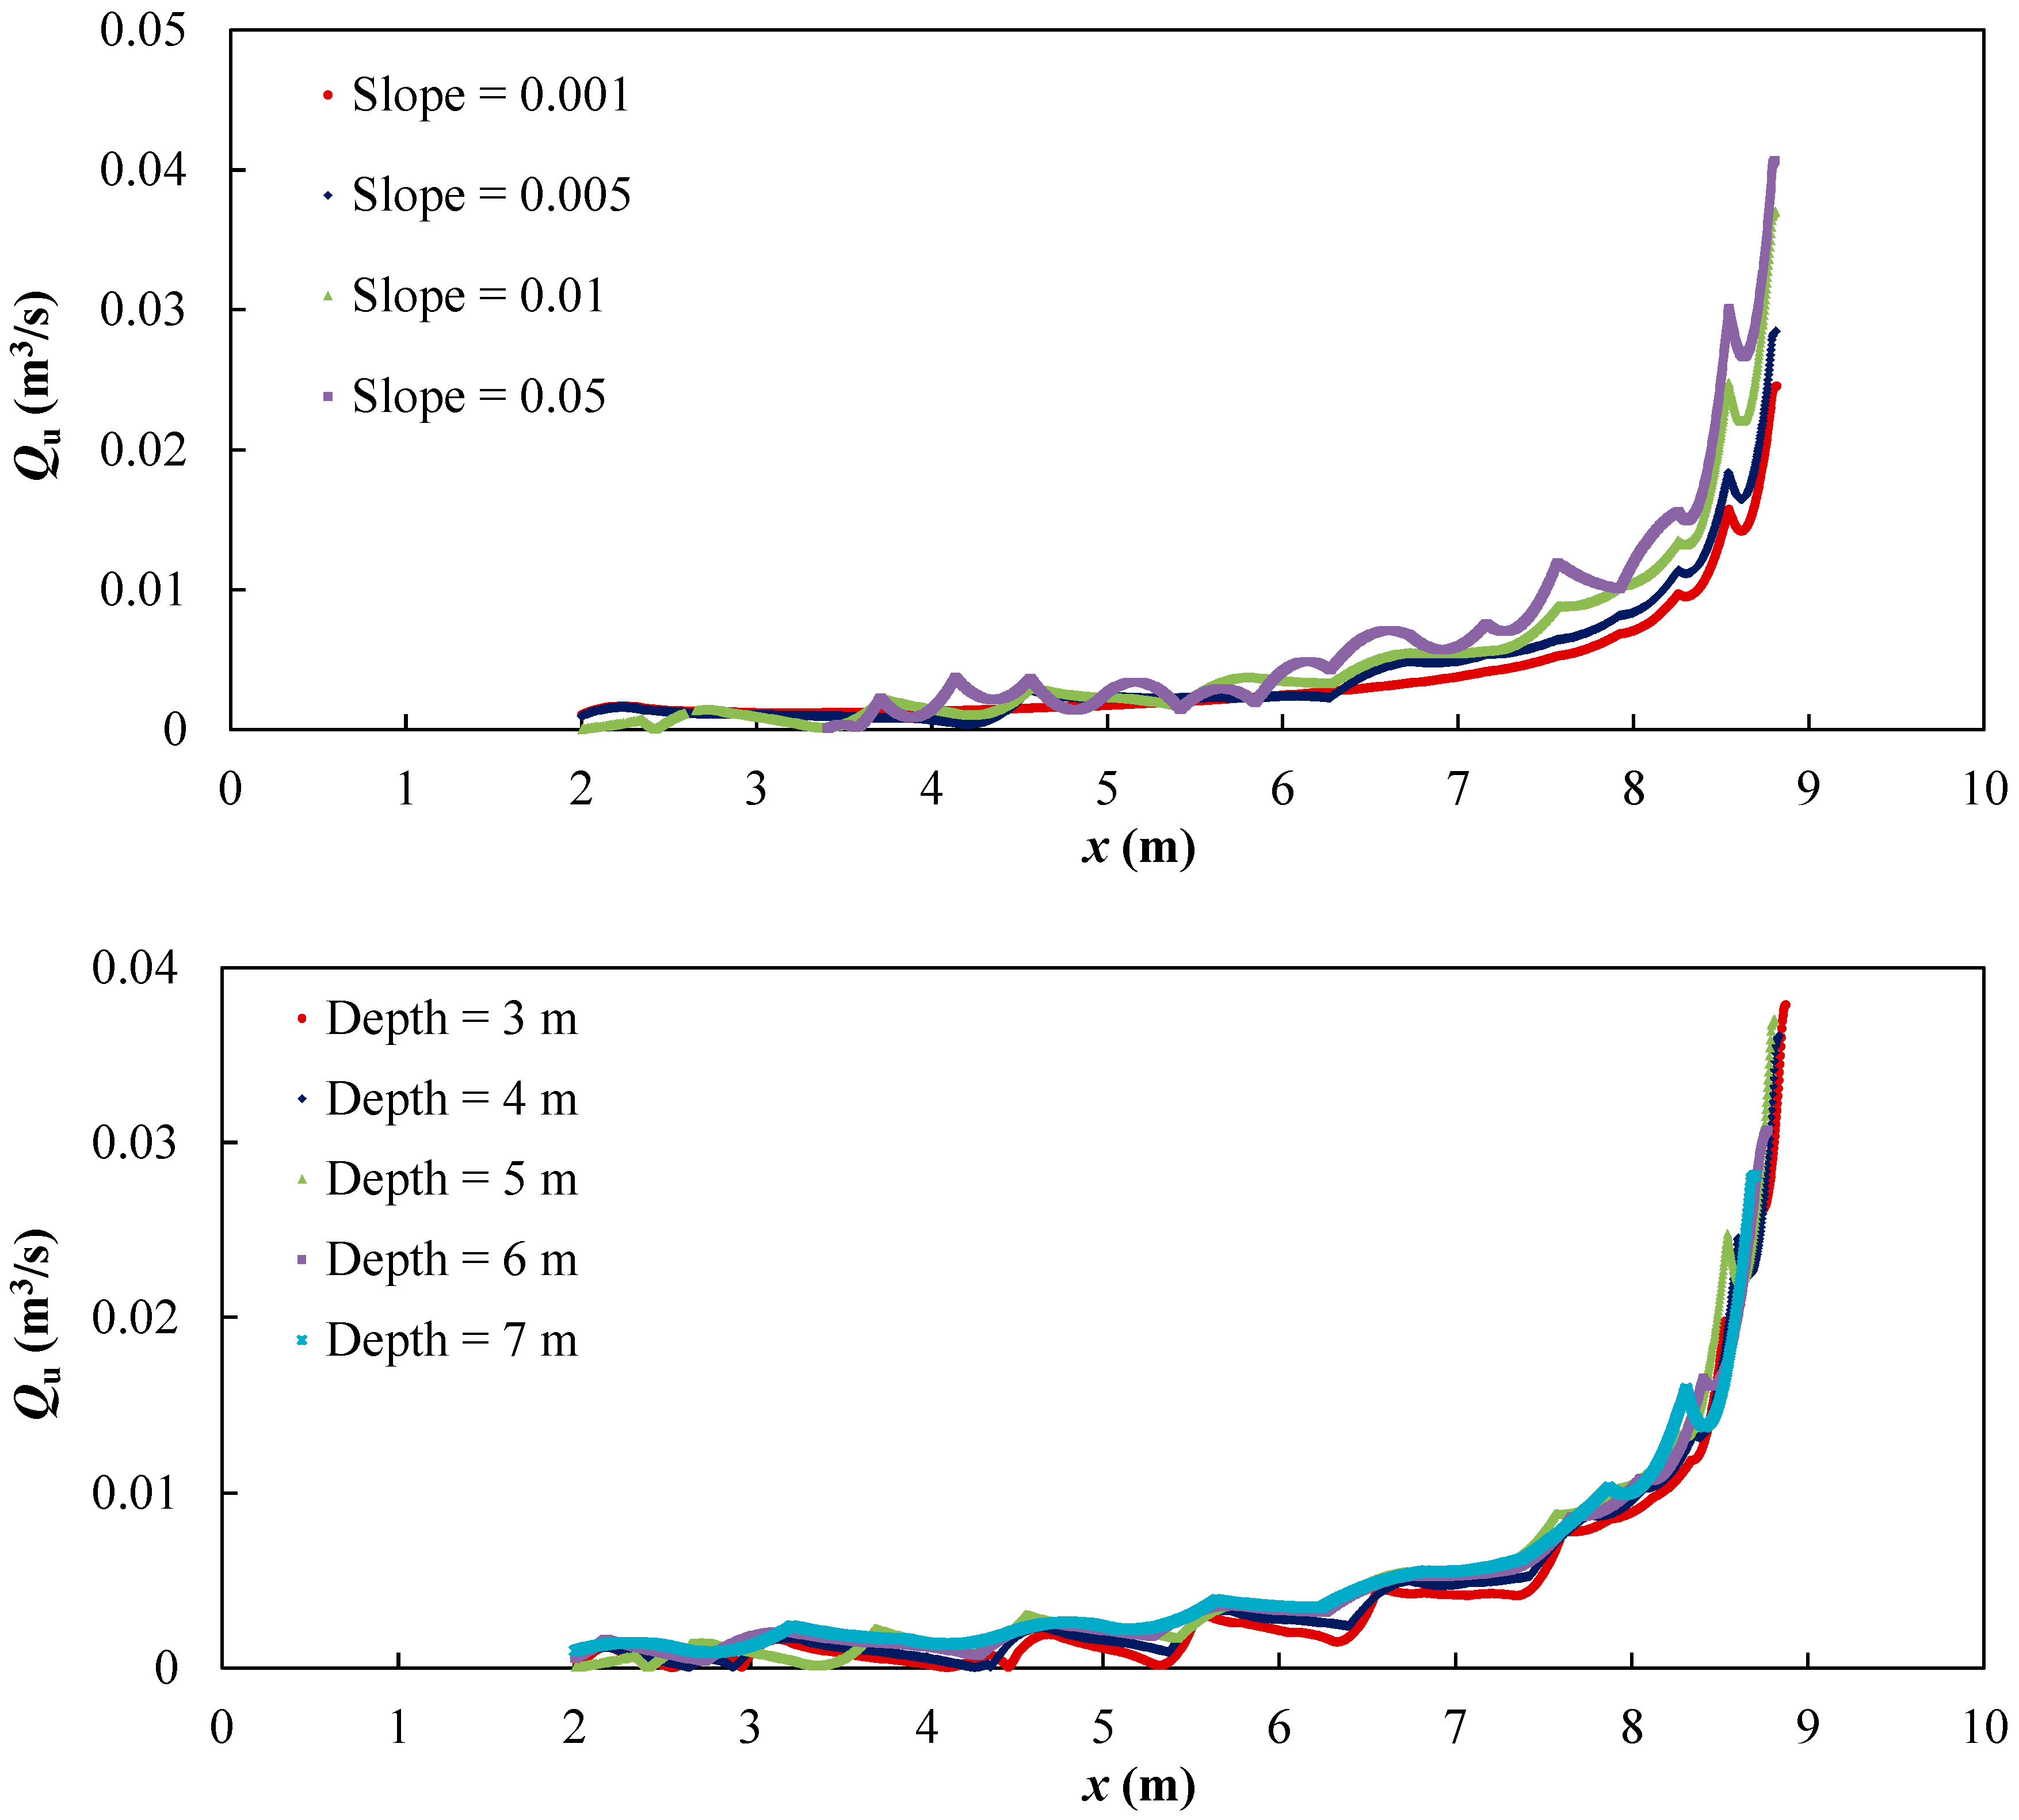
Finally, sensitivity analyses are also conducted under the case of the optimal height (i.e., 0.54 m) based on different slopes (i.e., 0.001, 0.005 and 0.05) and depths to bedrock (i.e., 3 m, 4 m, 6 m and 7 m), respectively, and hyporheic flux is used for evaluating the different HZ performances. The relevant results, i.e., the influences of different slopes and depths to bedrock on hyporheic flux in the upstream (Qu), are shown in Figure 9. It is observed that hyporheic flux increases when the slope increases. In contrast, the influence of depth to bedrock on hyporheic flux is not significant, which indicates that the active zone of the HZ can be limited to a narrow range.

3.4. Limitations and Future Studies

The limitations of this study mainly include the following five aspects. First, the simulations in this study are all conducted in the steady state, ignoring the transient changes. Thus, the optimal in-stream structure design for purposes with temporal changes (e.g., under the transient conditions such as flooding, changes in carbon availability, microbiological populations, etc.) should be further investigated. Second, only the optimal height of the weir has been discussed in this study; following the proposed method, the optimal design of other variables of different in-stream structures (e.g., shapes, widths and thicknesses) can be further discussed. Third, the results are case-dependent. For other cases (e.g., cases of different slopes and depths to bedrock), the regression equations should be re-established based on the observed data or new simulation results. Fourth, the effects of regional groundwater inflow on the HZ are not considered in this study. However, according to our previous study [29], such effects could be ignored compared to the effects of the surface water. Finally, the results of this study have not been compared to the field data. Although it is in practice very challenging to obtain field data during river restoration projects, laboratory experiments may be conducted to further validate the proposed method.
With awareness of the above limitations, the method proposed in this study can provide a new avenue for investigating optimal in-stream structure design, which would be valuable for hyporheic restoration in river restoration projects. Hyporheic restoration can play its vital role in the ecological functions and services linked to riverine habitats through providing the proper hydro-environment and space.

4. Conclusions

This study proposes a method for optimizing in-stream structure design based on numerical modelling, through comprehensively considering nitrogen removal in the HZ. The major findings of this study can be summarized as follows:
First, a numerical model which couples HEC-RAS and COMSOL Multiphysics by the hydraulic head along the surface of the streambed is built for both surface water and hyporheic flow simulations. Simulations under five different scenarios are conducted, and the model outputs are used to derive an optimal design of an in-stream structure (e.g., the weir in this study).
Second, based on the model outputs under five different scenarios, regression equations for estimating the relevant variables (e.g., the maximum upstream distance influenced by the weir, the RT, and hyporheic flux) are established. Then, the CNRA and NRR can be calculated.
Third, a framework of optimal in-stream structure design by considering the nitrogen removal in the HZ is proposed. Taking the height of the weir as the example, the objective function is formulated as the product of the normalized CNRA and NRR in this study. The optimal height of the weir can be obtained as the height at which the objective function is maximized. Validation shows that this method produces generally good performance. Sensitivity analysis indicates that the optimal height generally can be sensitive to the river discharge, i.e., the optimal height increases when the river discharge increases and vice versa. It is also observed that, in the case of the optimal height, hyporheic flux increases when the slope increases while the influence of depth to bedrock is not significant.
Overall, the modeling and results presented facilitate future studies on optimizing in-stream structure design for the nitrogen removal in the HZ, an important goal of river restoration projects.

Author Contributions

Conceptualization, S.L. and T.F.M.C.; methodology, S.L.; validation, S.L.; formal analysis, S.L.; writing—original draft preparation, S.L.; writing—review and editing, T.F.M.C.; supervision, T.F.M.C.; project administration, T.F.M.C.; funding acquisition, T.F.M.C. All authors have read and agreed to the published version of the manuscript.

Funding

This research was funded by a grant from the Research Grants Council of the Hong Kong Special Administrative Region, China (Project No. HKU17203815) and Guangdong Provincial Key Laboratory of Soil and Groundwater Pollution Control (2017B030301012).

Acknowledgments

This research was also supported by State Environmental Protection Key Laboratory of Integrated Surface Water-Groundwater Pollution Control.

Conflicts of Interest

The authors declare no conflict of interest.

References

  1. Boulton, A.J.; Findlay, S.; Marmonier, P.; Stanley, E.H.; Valett, H.M. The functional significance of the hyporheic zone in streams and rivers. Annu. Rev. Ecol. Syst. 1998, 29, 59–81. [Google Scholar] [CrossRef] [Green Version]
  2. Soulsby, C.; Malcolm, I.; Youngson, A. Hydrochemistry of the hyporheic zone in salmon spawning gravels: A preliminary assessment in a degraded agricultural stream. River Res. Appl. 2001, 17, 651–665. [Google Scholar] [CrossRef]
  3. Peterson, E.W.; Sickbert, T.B.; Moore, S.L. High frequency stream bed mobility of a low-gradient agricultural stream with implications on the hyporheic zone. Hydrol. Process. 2008, 22, 4239–4248. [Google Scholar] [CrossRef]
  4. Hester, E.T.; Gooseff, M.N. Moving beyond the banks: Hyporheic restoration is fundamental to restoring ecological services and functions of streams. Environ. Sci. Technol. 2010, 44, 1521–1525. [Google Scholar] [CrossRef]
  5. Peralta-Maraver, I.; Reiss, J.; Robertson, A.L. Interplay of hydrology. Community ecology and pollutant attenuation in the hyporheic zone. Sci. Total Environ. 2018, 610, 267–275. [Google Scholar] [CrossRef] [Green Version]
  6. Liu, S.N.; Chui, T.F.M. Impacts of streambed heterogeneity and anisotropy on residence time of hyporheic zone. Groundwater 2018, 56, 425–436. [Google Scholar] [CrossRef]
  7. Liu, S.N.; Chui, T.F.M. Impacts of different rainfall patterns on hyporheic zone under transient conditions. J. Hydrol. 2018, 561, 598–608. [Google Scholar] [CrossRef]
  8. Montgomery, D.R.; Buffington, J.M.; Peterson, N.P.; Schuett-Hames, D.; Quinn, T.P. Stream-bed scour. Egg burial depths, and the influence of salmonid spawning on bed surface mobility and embryo survival. Can. J. Fish. Aquat. Sci. 1996, 53, 1061–1070. [Google Scholar] [CrossRef]
  9. Bilby, R.E.; Fransen, B.R.; Bisson, P.A. Incorporation of nitrogen and carbon from spawning coho salmon into the trophic system of small streams: Evidence from stable isotopes. Can. J. Fish. Aquat. Sci. 1996, 53, 164–173. [Google Scholar] [CrossRef]
  10. Harvey, J.W.; Böhlke, J.K.; Voytek, M.A.; Scott, D.; Tobias, C.R. Hyporheic zone denitrification: Controls on effective reaction depth and contribution to whole-stream mass balance. Water Resour. Res. 2013, 49, 6298–6316. [Google Scholar] [CrossRef]
  11. Sheibley, R.W.; Jackman, A.P.; Duff, J.H.; Triska, F.J. Numerical modeling of coupled nitrification–denitrification in sediment perfusion cores from the hyporheic zone of the Shingobee River, MN. Adv. Water Resour. 2003, 26, 977–987. [Google Scholar] [CrossRef]
  12. Zarnetske, J.P.; Haggerty, R.; Wondzell, S.M.; Baker, M.A. Labile dissolved organic carbon supply limits hyporheic denitrification. J. Geophys. Res. Biogeosci. 2011, 116. [Google Scholar] [CrossRef] [Green Version]
  13. Meghdadi, A.; Javar, N. Evaluation of nitrate sources and the percent contribution of bacterial denitrification in hyporheic zone using isotope fractionation technique and multi-linear regression analysis. J. Environ. Manag. 2018, 222, 54–65. [Google Scholar] [CrossRef] [PubMed]
  14. Crispell, J.K.; Endreny, T.A. Hyporheic exchange flow around constructed in-channel structures and implications for restoration design. Hydrol. Process. 2009, 23, 1158–1168. [Google Scholar] [CrossRef]
  15. Hester, E.T.; Doyle, M.W. In-stream geomorphic structures as drivers of hyporheic exchange. Water Resour. Res. 2008, 44. [Google Scholar] [CrossRef]
  16. Hester, E.T.; Doyle, M.W.; Poole, G.C. The influence of in-stream structures on summer water temperatures via induced hyporheic exchange. Limnol. Oceanogr. 2009, 54, 355–367. [Google Scholar] [CrossRef]
  17. Hester, E.T.; Gooseff, M.N. Hyporheic Restoration in Streams and Rivers, in Stream Restoration in Dynamic Fluvial Systems; American Geophysical Union: Washington, DC, USA, 2013. [Google Scholar] [CrossRef]
  18. Hester, E.T.; Hammond, B.; Scott, D.T. Effects of inset floodplains and hyporheic exchange induced by in-stream structures on nitrate removal in a headwater stream. Ecol. Eng. 2016, 97, 452–464. [Google Scholar] [CrossRef] [Green Version]
  19. Ward, A.S.; Gooseff, M.N.; Johnson, P.A. How can subsurface modifications to hydraulic conductivity be designed as stream restoration structures? Analysis of Vaux’s conceptual models to enhance hyporheic exchange. Water Resour. Res. 2011, 47. [Google Scholar] [CrossRef]
  20. Kasahara, T.; Hill, A.R. Effects of riffle step restoration on hyporheic zone chemistry in N-rich lowland streams. Can. J. Fish. Aquat. Sci. 2006, 63, 120–133. [Google Scholar] [CrossRef]
  21. Lautz, L.; Fanelli, R. Seasonal biogeochemical hotspots in the streambed around restoration structures. Biogeochemistry 2008, 91, 85–104. [Google Scholar] [CrossRef]
  22. Fanelli, R.M.; Lautz, L.K. Patterns of water. heat, and solute flux through streambeds around small dams. Groundwater 2008, 46, 671–687. [Google Scholar] [CrossRef] [PubMed]
  23. Grant, S.B.; Stolzenbach, K.; Azizian, M.; Stewardson, M.J.; Boano, F.; Bardini, L. First-order contaminant removal in the hyporheic zone of streams: Physical insights from a simple analytical model. Environ. Sci. Technol. 2014, 48, 11369–11378. [Google Scholar] [CrossRef] [Green Version]
  24. Lammers, R.W.; Bledsoe, B.P. What role does stream restoration play in nutrient management? Environ. Sci. Technol. 2017, 47, 335–371. [Google Scholar] [CrossRef]
  25. Patrick, W.; Reddy, K. Nitrification-denitrification reactions in flooded soils and water bottoms: Dependence on oxygen supply and ammonium diffusion. J. Environ. Qual. 1976, 5, 469–472. [Google Scholar] [CrossRef]
  26. Hill, A.R. Nitrate removal in stream riparian zones. J. Environ. Qual. 1996, 25, 743–755. [Google Scholar] [CrossRef]
  27. Ward, B. Nitrification and denitrification: Probing the nitrogen cycle in aquatic environments. Microb. Ecol. 1996, 32, 247–261. [Google Scholar] [CrossRef] [PubMed]
  28. Peng, Y.; Zhu, G. Biological nitrogen removal with nitrification and denitrification via nitrite pathway. Appl. Microbiol. Biotechnol. 2006, 73, 15–26. [Google Scholar] [CrossRef]
  29. Liu, S.N.; Chui, T.F.M. Numerical modelling for evaluation of the nitrogen removal rate in hyporheic zone and its implication to stream management. Hydrol. Process. 2019, 33, 3084–3097. [Google Scholar] [CrossRef]
  30. Roley, S.S.; Tank, J.L.; Williams, M.A. Hydrologic connectivity increases denitrification in the hyporheic zone and restored floodplains of an agricultural stream. J. Geophys. Res. Biogeosci. 2012, 117. [Google Scholar] [CrossRef] [Green Version]
  31. Gordon, R.P.; Lautz, L.K.; Daniluk, T.L. Spatial patterns of hyporheic exchange and biogeochemical cycling around cross-vane restoration structures: Implications for stream restoration design. Water Resour. Res. 2013, 49, 2040–2055. [Google Scholar] [CrossRef]
  32. Hydrologic Engineering Center (HEC). HEC-RAS River Analysis System User’s Manual; US Army Corps of Engineers (USACE): Washington, DC, USA, 2016.
  33. HEC. HEC-RAS River Analysis System Hydraulic Reference Manual; US Army Corps of Engineers (USACE): Washington, DC, USA, 2016.
  34. Brinkman, H.C. A calculation of the viscous force exerted by a flowing fluid on a dense swarm of particles. Appl. Sci. Res. 1949, 1, 27–34. [Google Scholar] [CrossRef]
  35. Sawyer, C.N. Chemistry for Environmental Engineering and Science; McGraw-Hill: New York, NY, USA, 2003. [Google Scholar]
  36. Cardenas, M.B. Surface water-groundwater interface geomorphology leads to scaling of residence times. Geophys. Res. Lett. 2008, 35. [Google Scholar] [CrossRef]
  37. Haggerty, R.; Wondzell, S.M.; Johnson, M.A. Power-law residence time distribution in the hyporheic zone of a 2nd-order mountain stream. Geophys. Res. Lett. 2002, 29. [Google Scholar] [CrossRef] [Green Version]
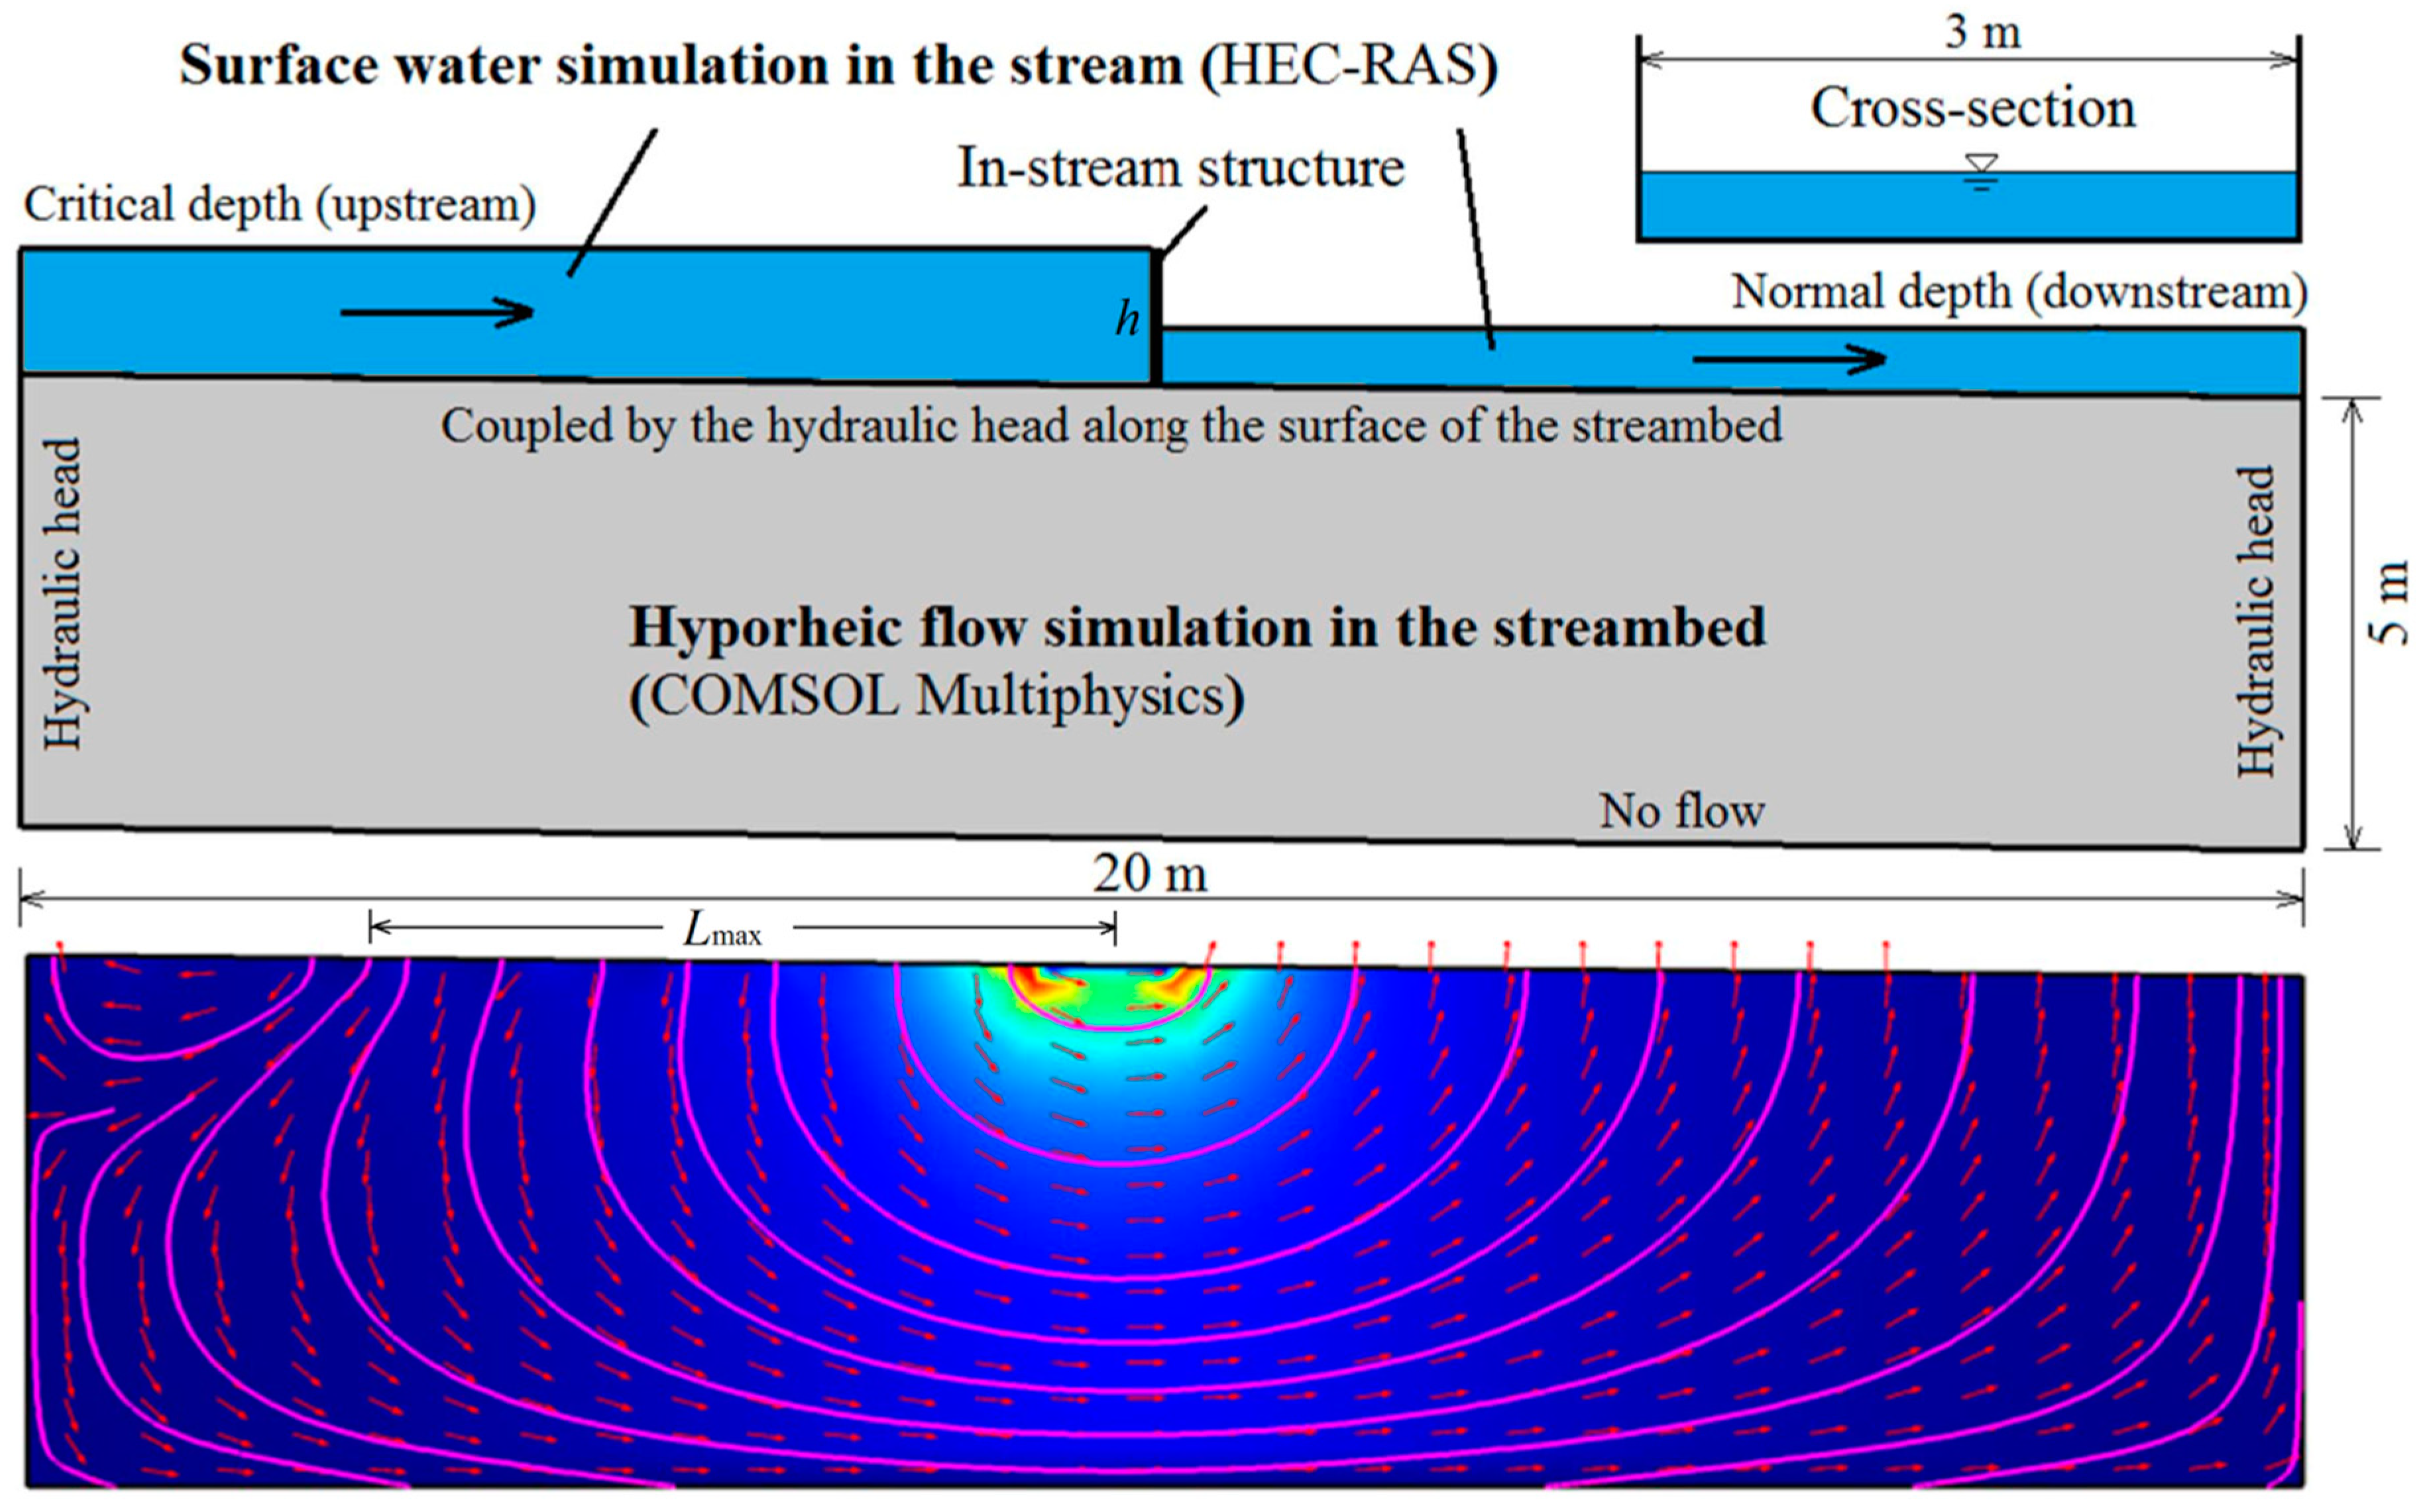
Figure 1. Numerical model and results. The illustration on the top right corner shows the cross-section for surface water simulation. The pink lines in the bottom figure indicate the flow paths and the red arrows indicate the hyporheic flux.
Water 12 01399 g001
Figure 2. Relationship between the maximum upstream distance in the subsurface flow influenced by the weir (Lmax) and the height of the weir (h).
Water 12 01399 g002
Figure 3. Relationship between the residence time (RT) and the location along the stream (x) under the five modeling scenarios with different heights of the weir (h).
Water 12 01399 g003
Figure 4. Relationship between the two coefficients of the regression equation for calculating the residence time (RT) and the height of the weir (h).
Water 12 01399 g004
Figure 5. Relationship between the hyporheic flux (Qu) and the location along the stream (x) under the five modeling scenarios with different heights of the weir (h).
Water 12 01399 g005
Figure 6. Relationship between the two coefficients of the regression equation for calculating the hyporheic flux (Qu) and the height of the weir (h).
Water 12 01399 g006
Figure 7. Relationship of the cumulative nitrogen removal amount (CNRA) and nitrogen removal ratio (NRR) with the height of the weir (h).
Water 12 01399 g007
Figure 8. Comparison of relationships between the value of the objective function and the height of the weir (h) obtained from different h ranges.
Water 12 01399 g008
Figure 9. Influences of different slopes and depths to bedrock on Qu.
Water 12 01399 g009
Table 1. Different modeling scenarios adopted in this study.
Variables to be Held ConstantVariable to be Changed
Slope = 0.01
River discharge = 1 m3/s
Depth to bedrock = 5 m
Height of the weir
= 0.3, 0.4, 0.5, 0.6, and 0.7 m
Table 2. The coefficients of the regression equations for calculating the residence time (RT) under the five modeling scenarios with different heights of the weir (h), and their R2 values.
h (m)h = 0.3h = 0.4h = 0.5h = 0.6h = 0.7
a11.44 × 10122.46 × 1093.40 × 1071.01 × 1072.57 × 106
Ln(a1)28.0021.6217.3416.1314.76
b1−10.14−7.26−5.27−4.79−4.17
R20.970.940.910.930.92
Table 3. The coefficients of the regression equations for calculating the hyporheic flux (Qu) under the five modeling scenarios with different heights of the weir (h), and their R2 values.
h (m)h = 0.3h = 0.4h = 0.5h = 0.6h = 0.7
a20.00990.0160.0220.0290.035
b2−1.51−1.69−1.73−1.80−1.82
R20.830.710.790.780.84
Table 4. Comparison among the results from model outputs with three weir heights (h).
h (m)h = 0.5h = 0.54h = 0.6
CNRA2.813.153.43
NRR14.2%20%14.5%
CNRA·NRR0.400.630.50
Table 5. Comparison among the denitrification simulation results with five weir heights (h).
h (m)h = 0.5h = 0.53h = 0.54h = 0.55h = 0.6
RTmax (day)2.982.962.892.582.33
M1den (mol)1.07 × 10−51.08 × 10−51.12 × 10−59.77 × 10−67.94 × 10⁻⁶
M2den (mol)1.09 × 10−51.10 × 10−51.17 × 10−51.15 × 10−51.01 × 10⁻⁵
Table 6. The results of sensitivity analysis based on different river discharges.
M1den (mol)River Discharge (m3/s)
0.51.01.5
Height of the in-stream structure (m)0.531.01 × 10−51.08 × 10−59.70 × 10−6
0.549.43 × 10−61.12 × 10−51.04 × 10−5
0.558.08 × 10−69.77 × 10−61.06 × 10−5