Machine Learning Methods for Improved Understanding of a Pumping Test in Heterogeneous Aquifers
Abstract
:1. Introduction
2. Materials and Methods
2.1. Study Area
2.2. Pumping Tests
2.3. Methods
2.3.1. Pearson Correlation Analysis
2.3.2. Cluster Analysis
2.3.3. Time-Series Analysis Method of Drawdowns within Pumping Wells
2.3.4. Forecasting Method for Groundwater Levels among Observation Wells
2.3.5. Linear Graphic Method in the Theis Model
3. Results
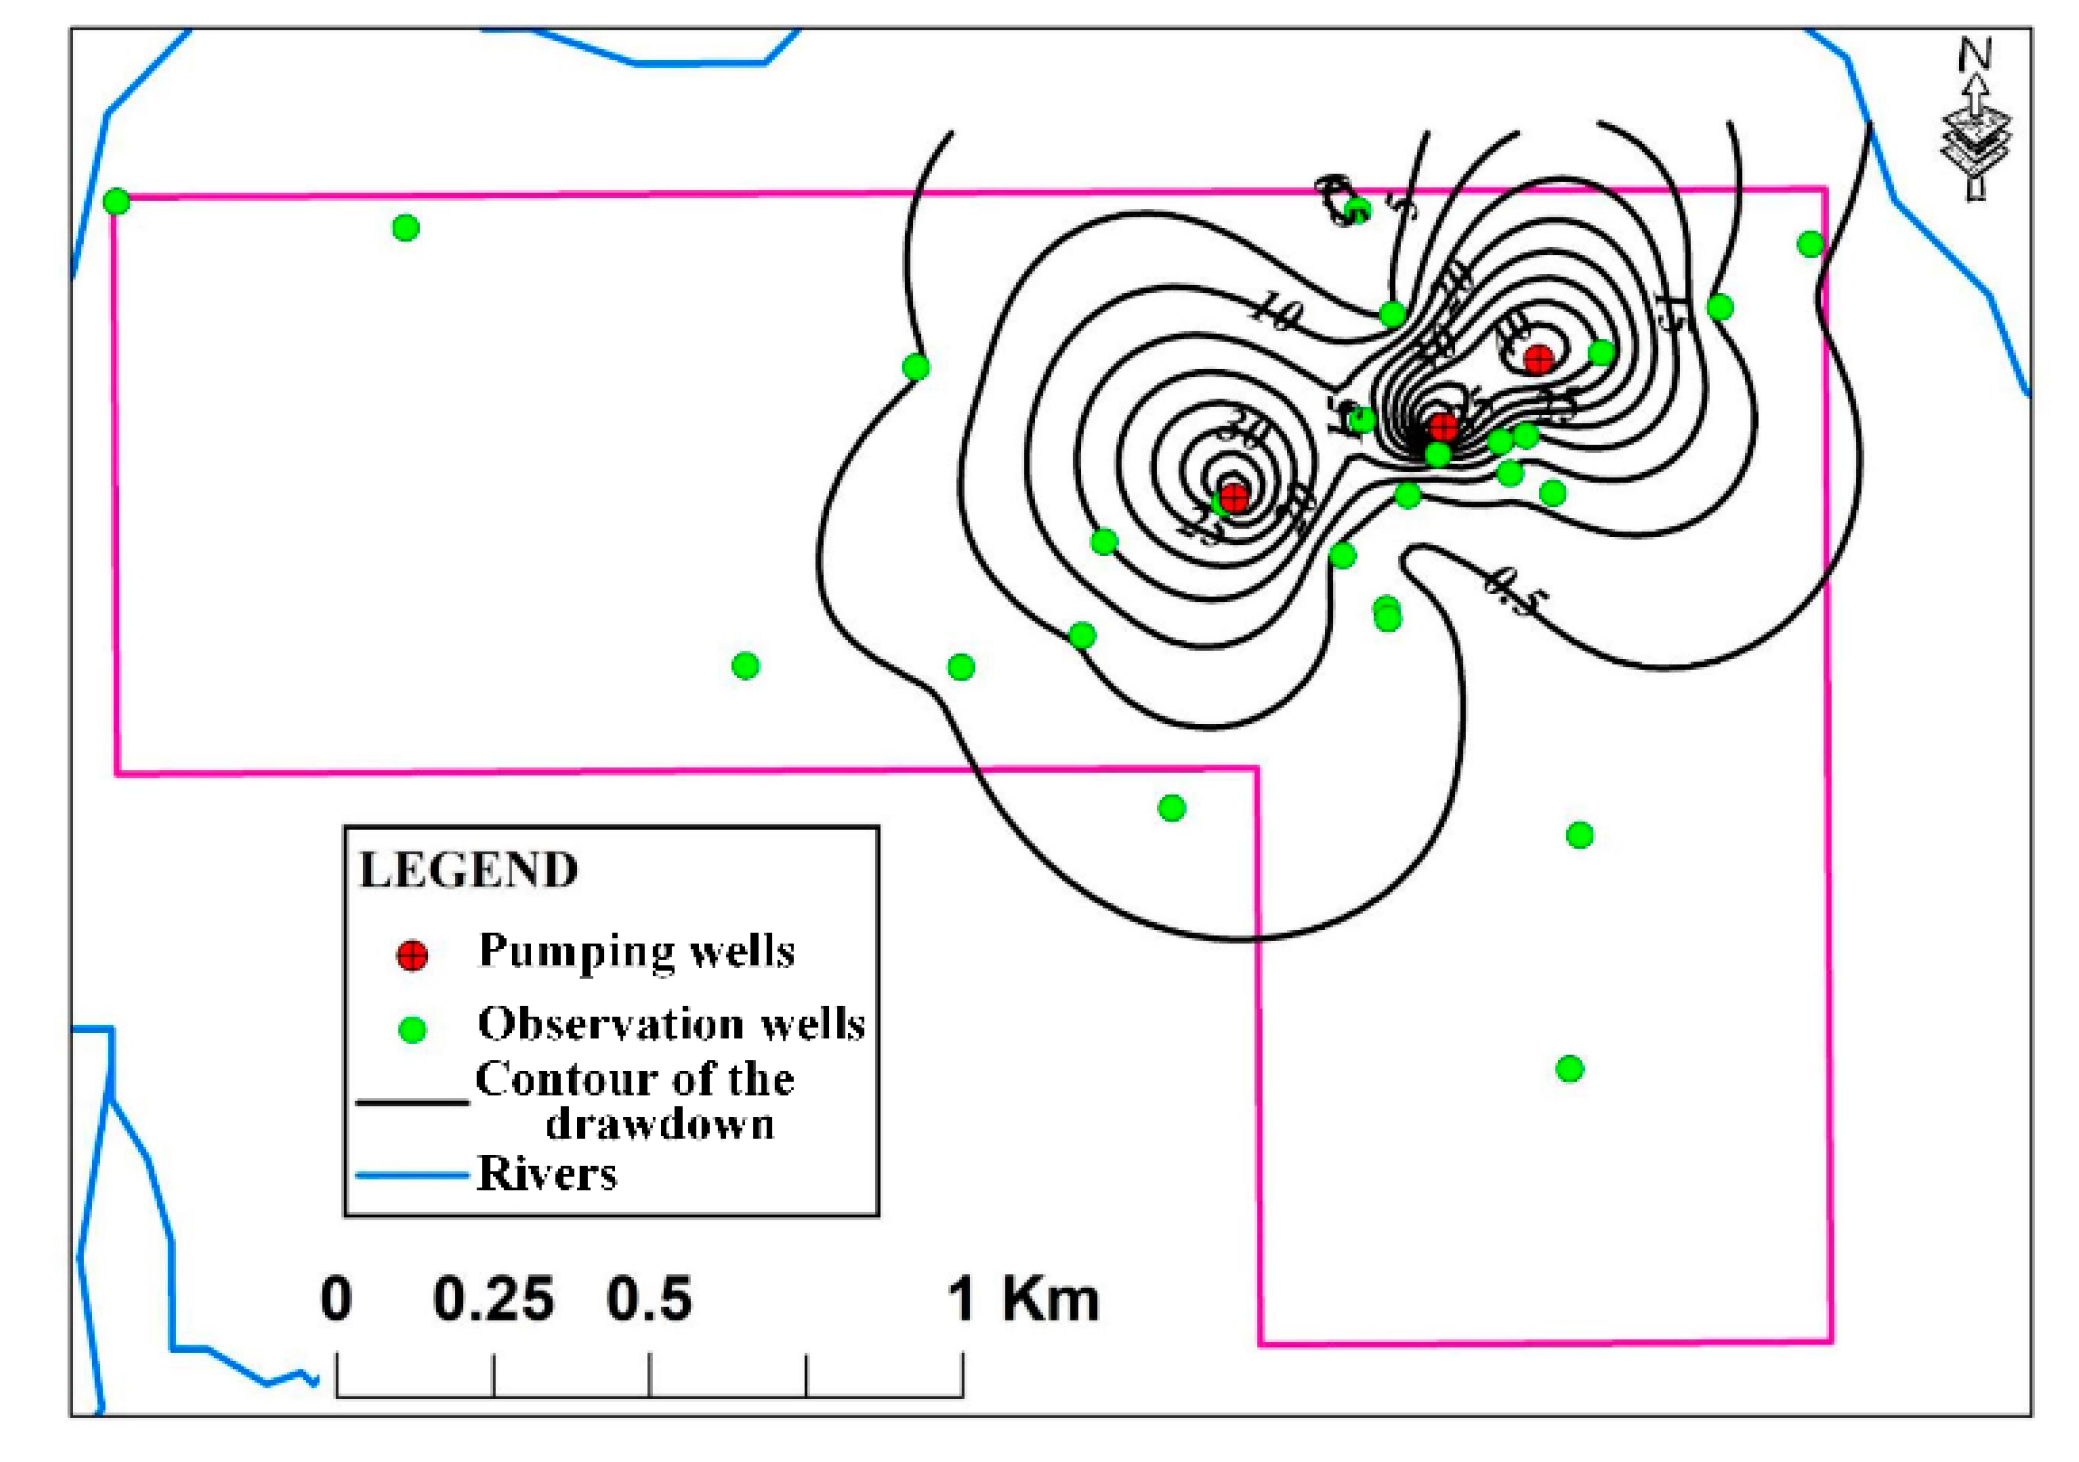
3.1. Distribution of Maximum Drawdown
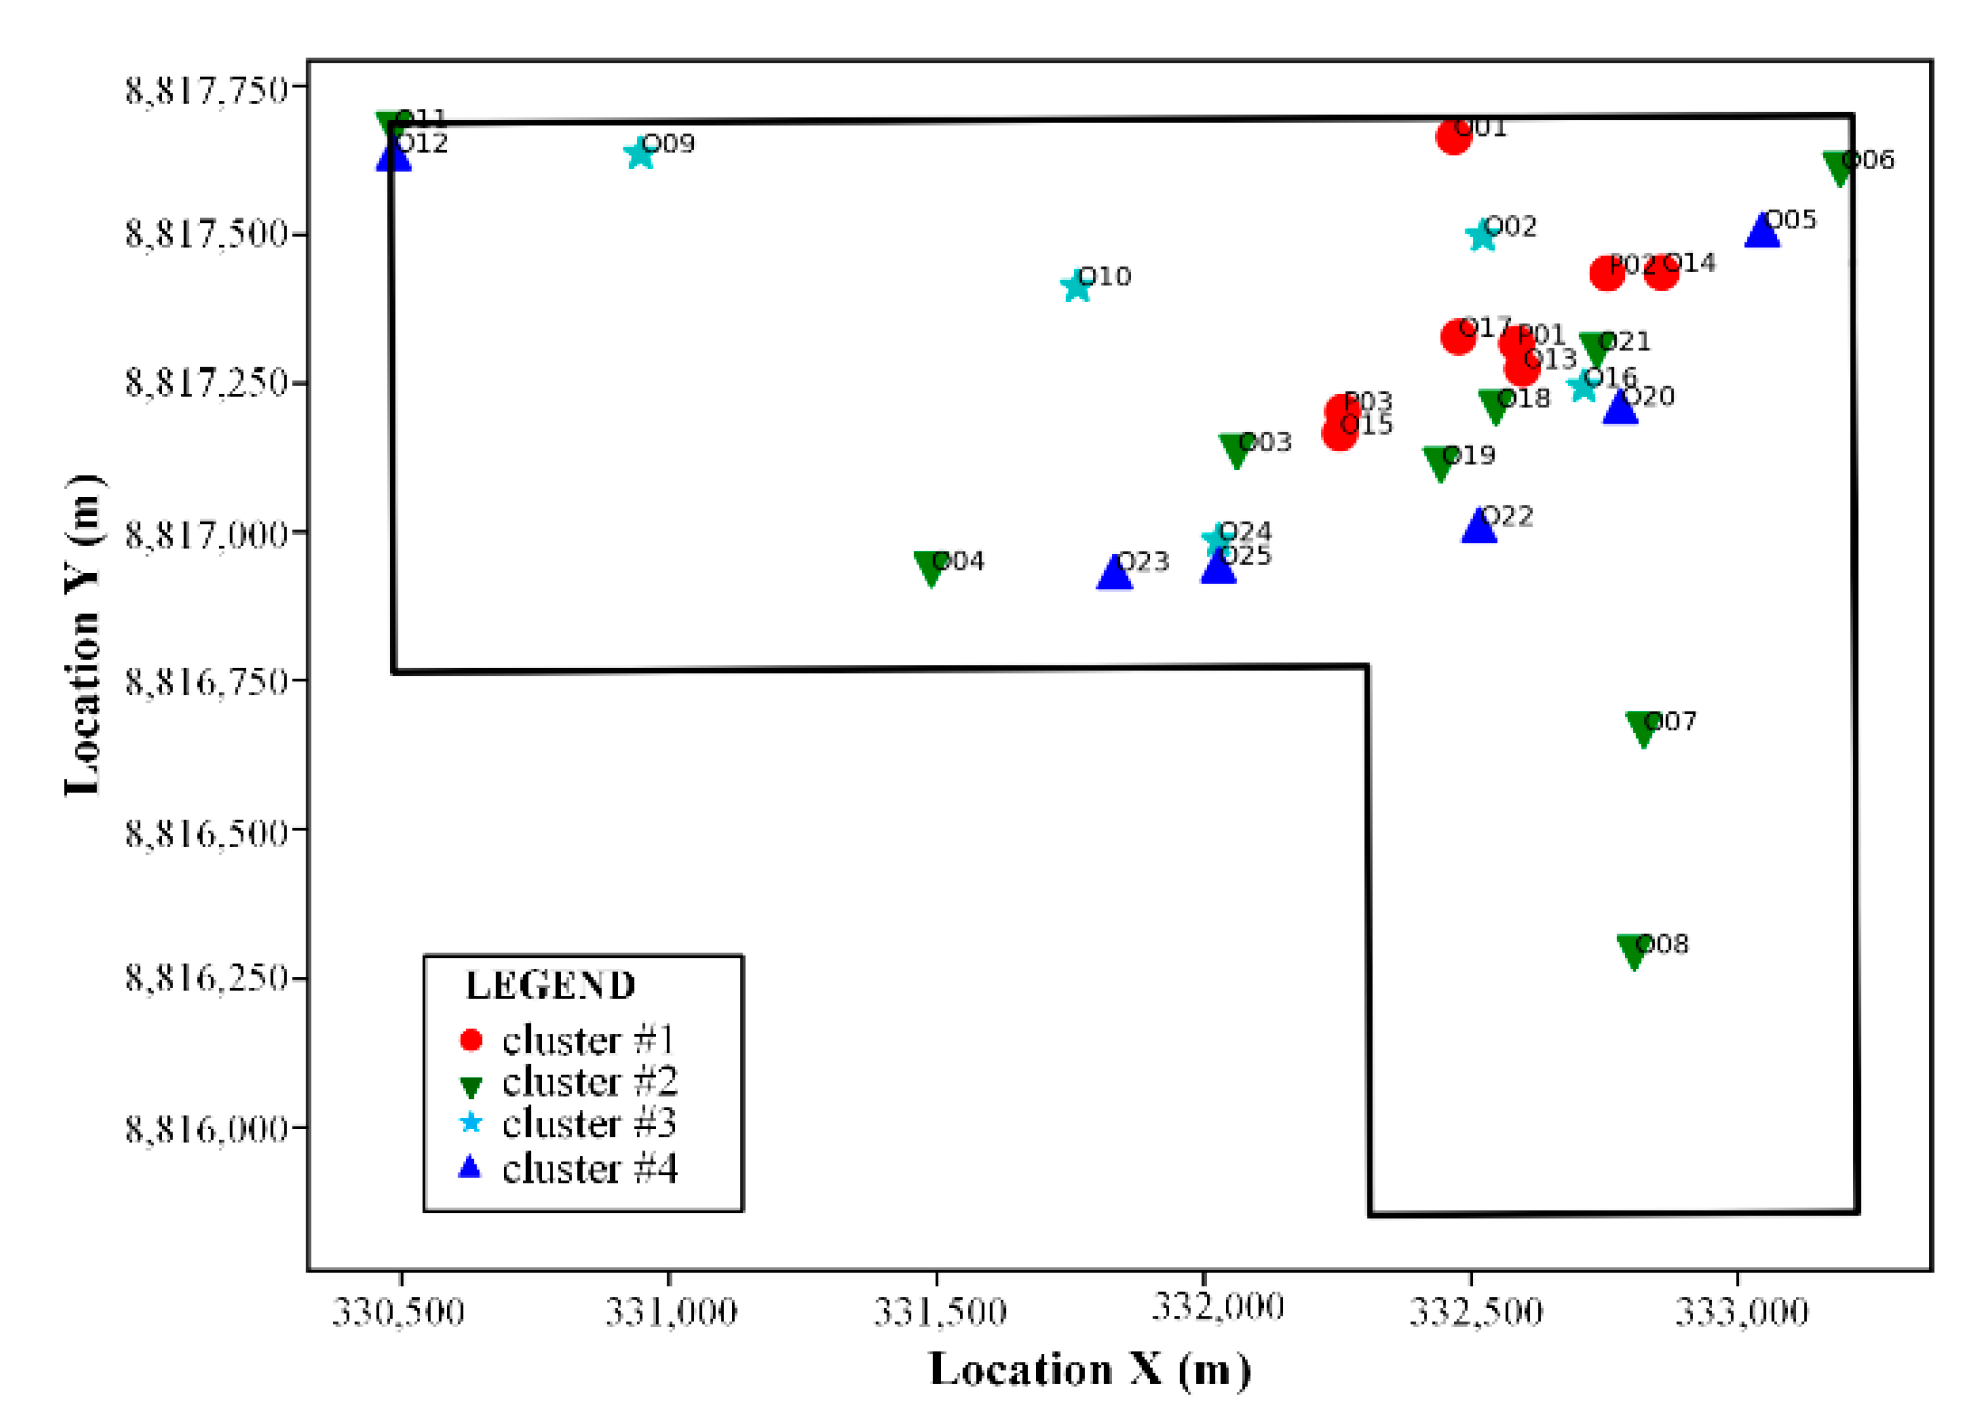
3.2. Relationship of Water Levels between Observation and Pumping Wells
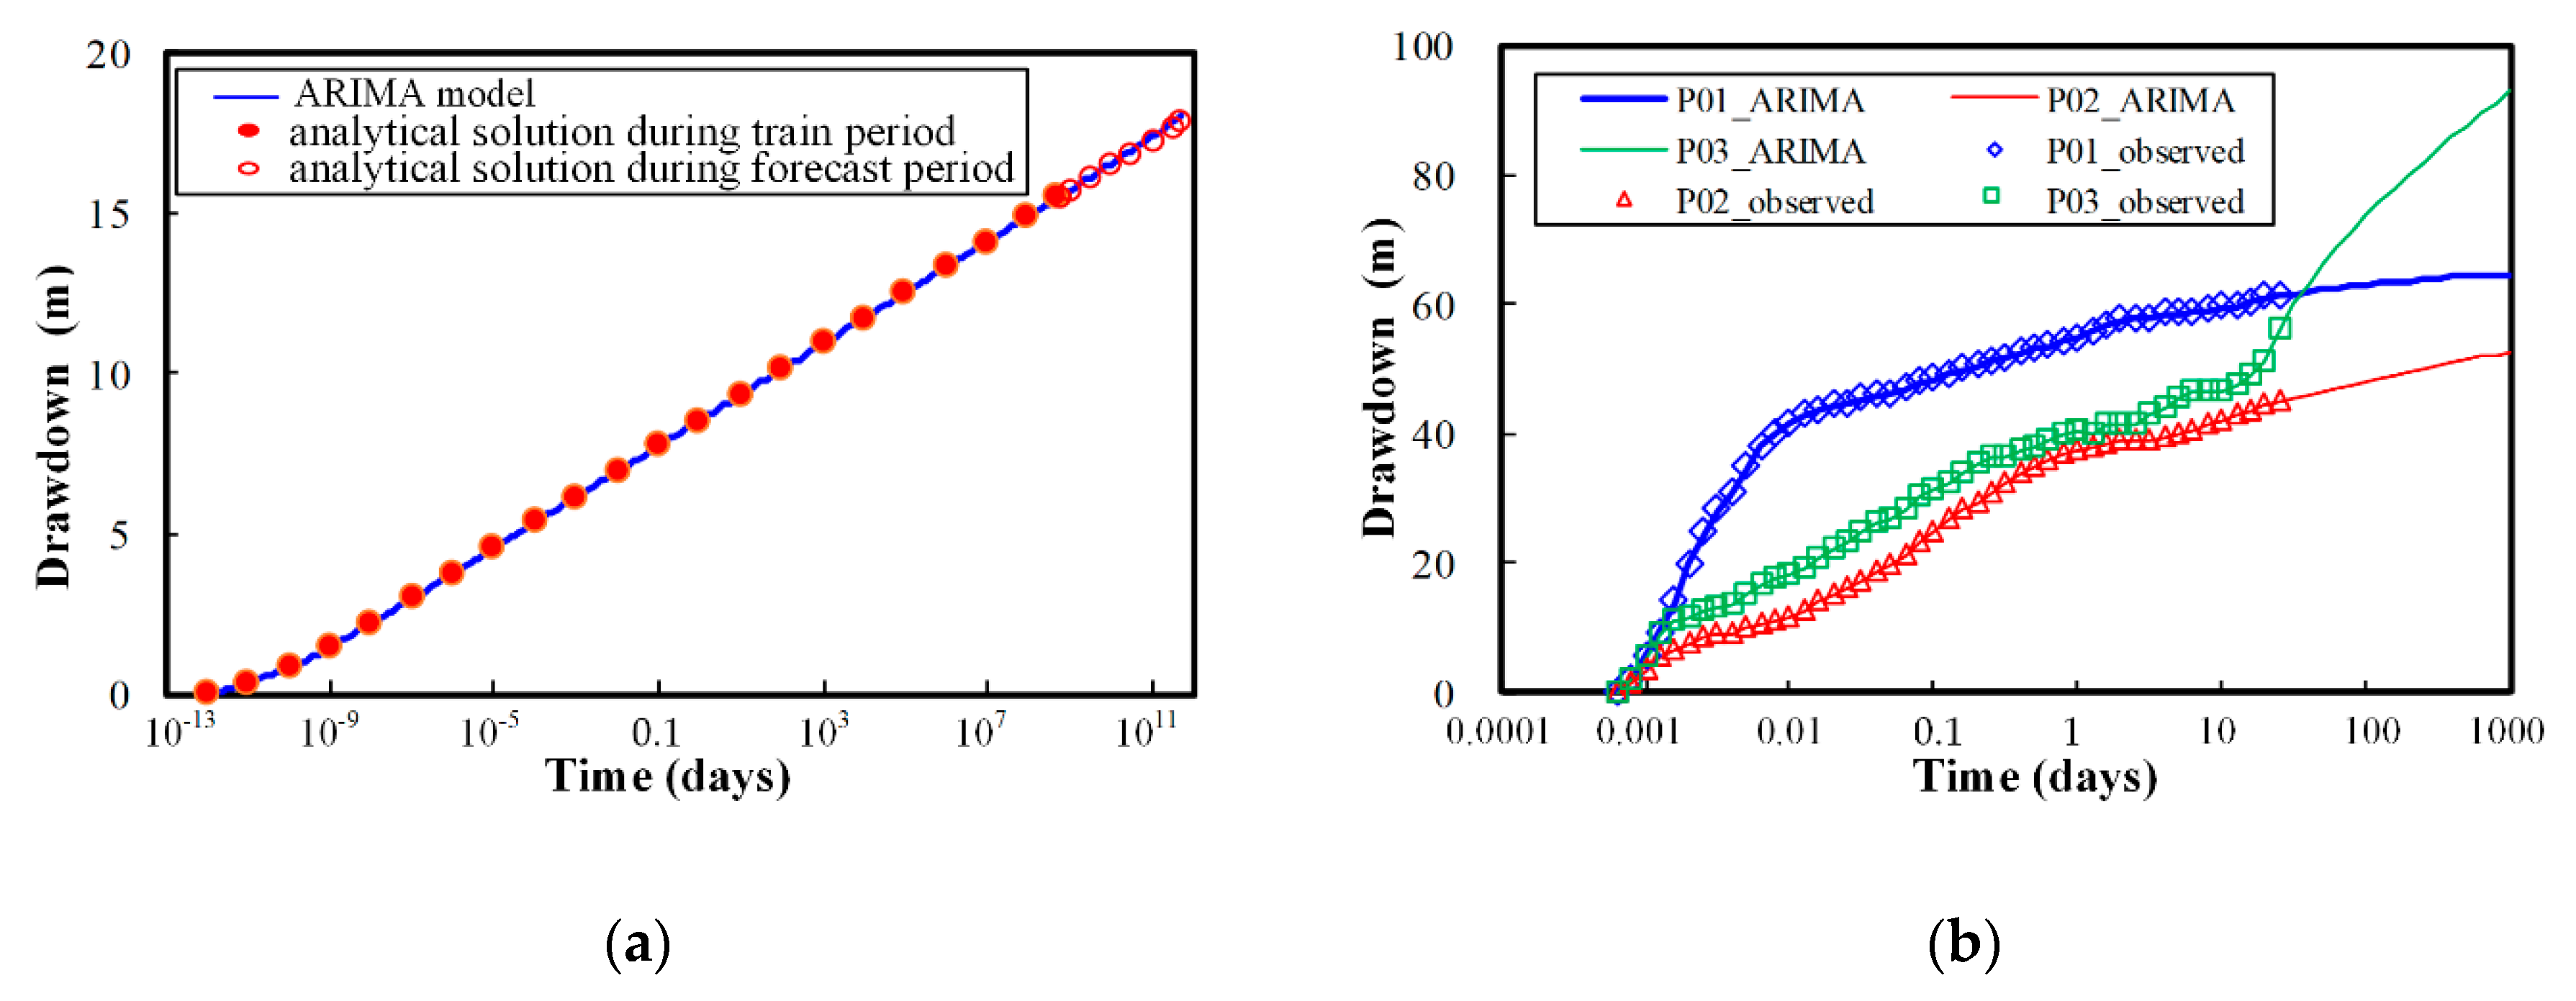
3.3. Predictions of Drawdowns within Pumping Wells
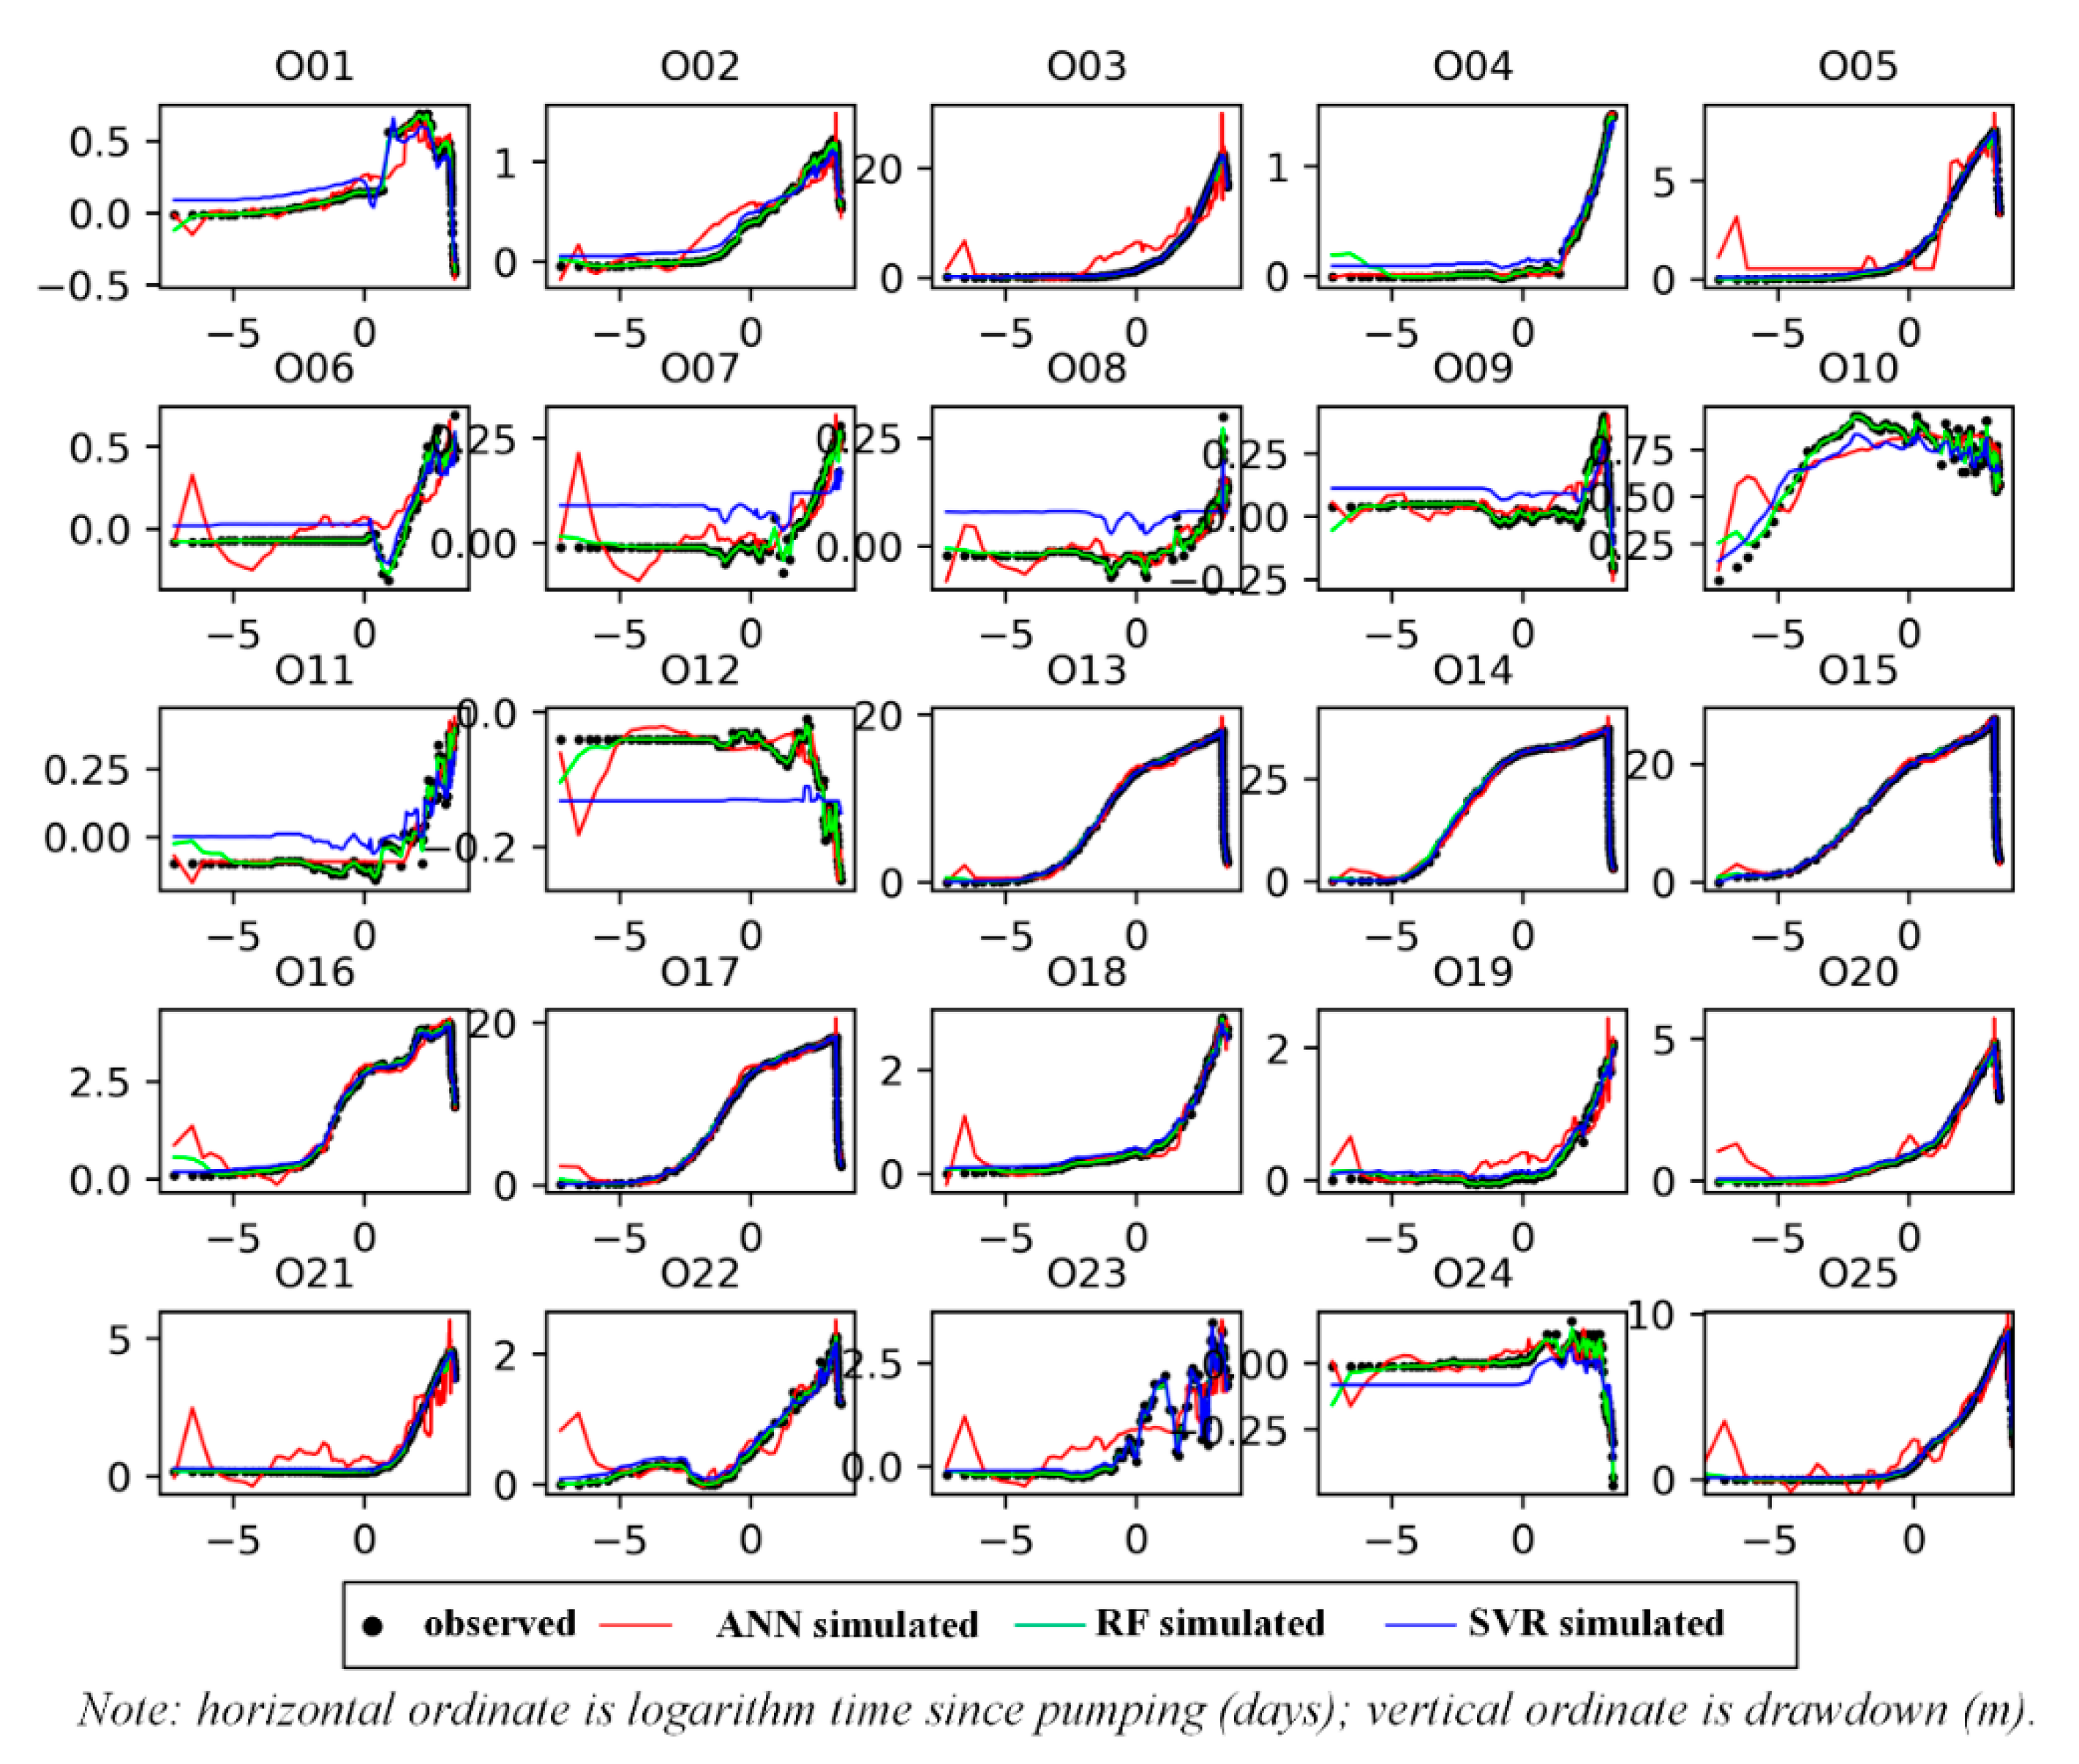
3.4. Predictions of Drawdowns in Observation Wells
4. Discussion
5. Conclusions
- (1)
- Rather than the mere contour map of the maximum drawdowns, the relationships of the drawdown over the period of pumping tests between wells provide a visual picture using ML methods, and the cluster of Pearson correlation coefficient shows the hydraulic connections between wells;
- (2)
- The ARIMA method can be used to effectively predict the time-series changes of drawdowns in three pumping wells. In the hypothetical Theis model, the relative error of drawdowns is only 0.86% after 1.37 × 10⁹ years. The predicted maximum drawdown in well P01, P02, and P03 after 3 years is 64.53 m, 52.50 m, and 92.88 m, respectively;
- (3)
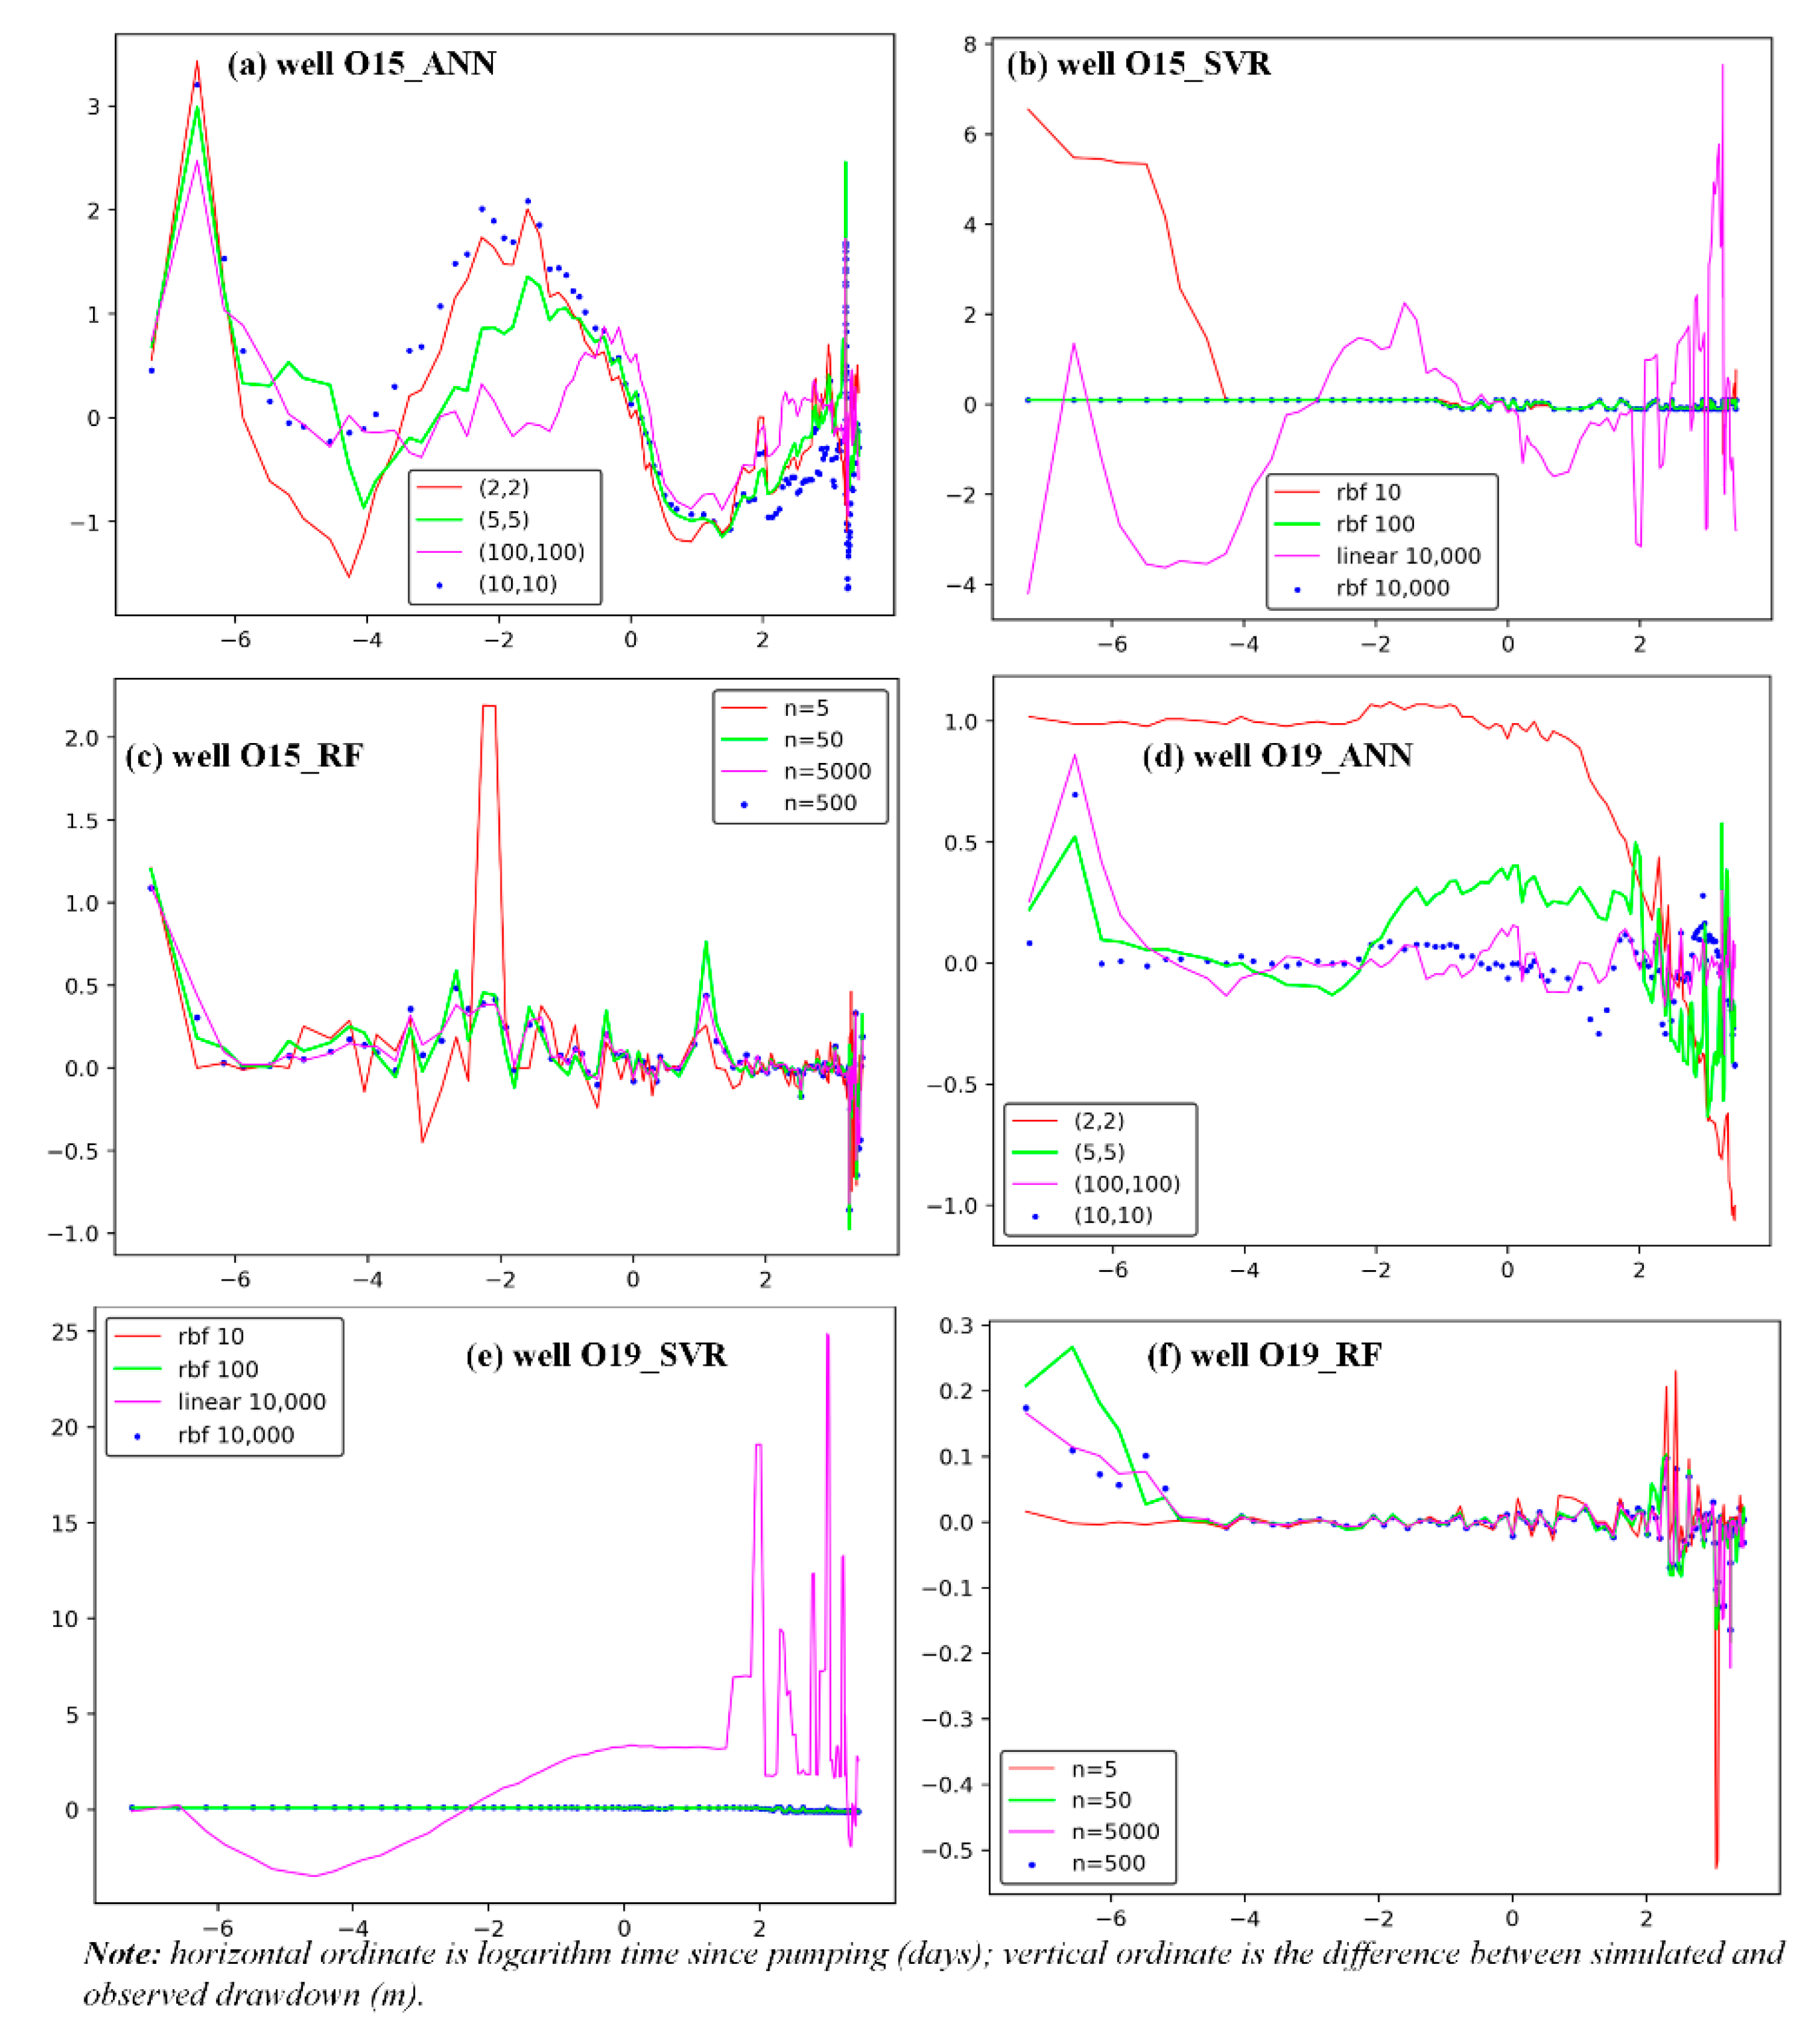
- Trained ANN, SVR, and RF models can reasonably capture the change of drawdowns in 25 observation wells induced by pumping; however, SVR and RF models provide better estimates, with average RMSE values for drawdowns of 0.13 m;
- (4)
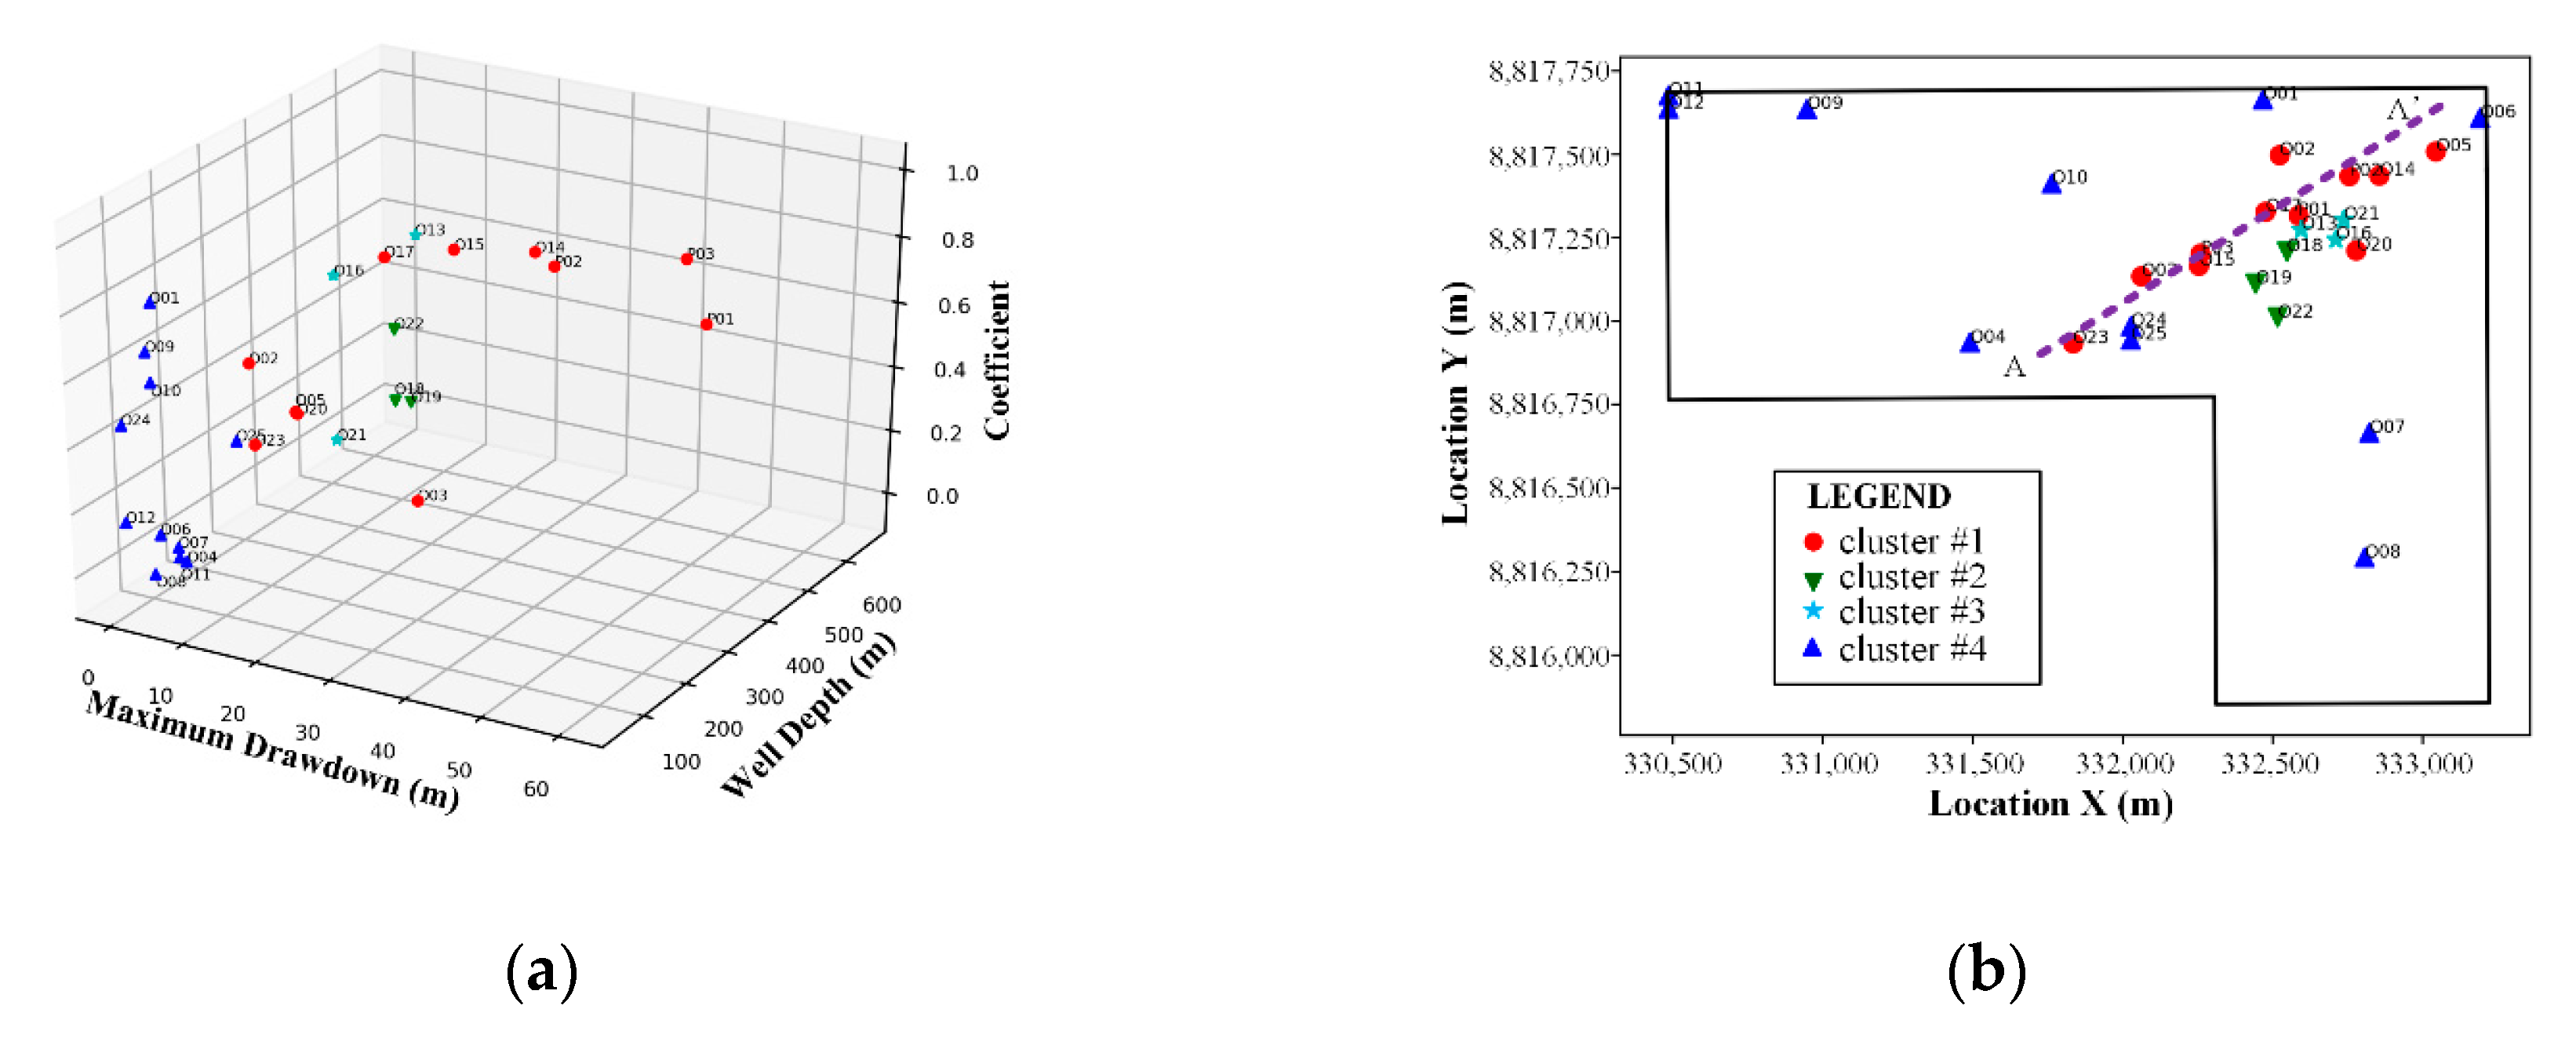
- K-means clustering using the Pearson correlation coefficient, the maximum drawdown, and well depth visually shows a preferable pathway, with the good permeability under depths ranging from 250 m to 350 m;
- (5)
- Model parameters have certain influences on the simulated drawdowns for ANN, SVR, and RF models, but the RF model shows the least sensitivity to the value of the parameters, and has the best performance when compared with observed results;
- (6)
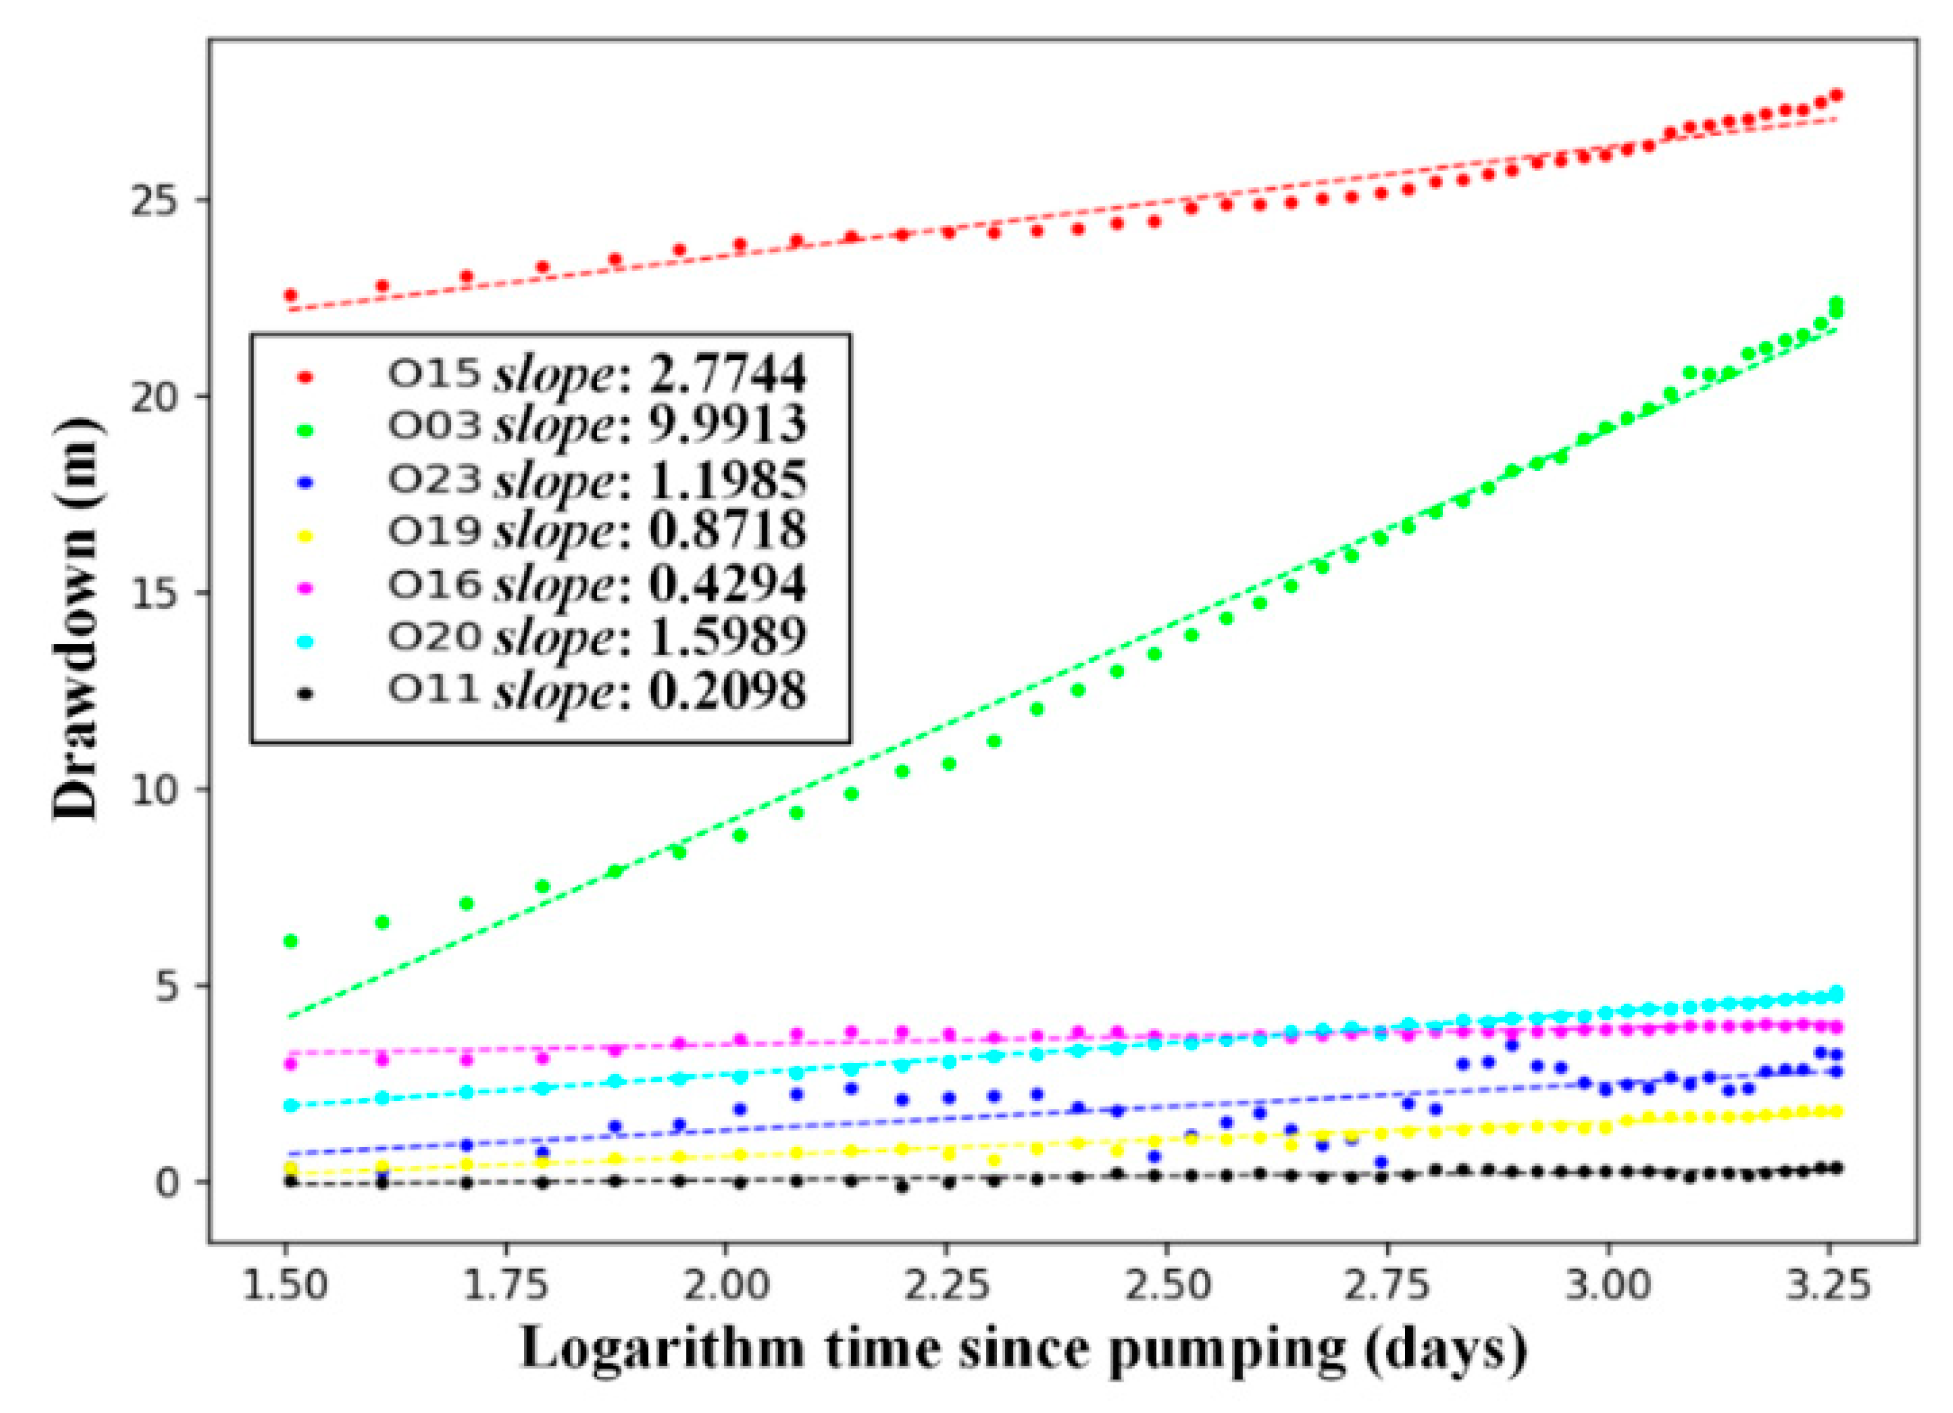
- With the assumption of the Theis model, the linear regressive method may be used to roughly estimate the value of hydraulic conductivity, and the results in this paper are consistent with the previous studies.
Author Contributions
Funding
Acknowledgments
Conflicts of Interest
References
- Nace, R.L. (Ed.) Scientific Framework of World Water Balance; UNESCO Technical Papers in Hydrology; UNESCO: Paris, France, 1971; pp. 7–27. [Google Scholar]
- Fetter, C.W. Applied Hydrogeology, 4th ed.; Prentice-Hall, Inc.: Upper Saddle River, NJ, USA, 2001. [Google Scholar]
- Rajaee, T.; Ebrahimi, H.; Nourani, V. A review of the artificial intelligence methods in groundwater level modeling. J. Hydrol. 2019, 572, 336–351. [Google Scholar] [CrossRef]
- Yoon, H.; Jun, S.C.; Hyun, Y.; Bae, G.O.; Lee, K.K. A comparative study of artificial neural networks and support vector machines for predicting groundwater levels in a coastal aquifer. J. Hydrol. 2011, 396, 128–138. [Google Scholar] [CrossRef]
- Emamgholizadeh, S.; Moslemi, K.; Karami, G. Prediction the groundwater level of bastam plain (Iran) by artificial neural network (ANN) and adaptive neuro-fuzzy inference system (ANFIS). Water Resour. Manag. 2014, 28, 5433–5446. [Google Scholar] [CrossRef]
- Ebrahimi, H.; Rajaee, T. Simulation of groundwater level variations using wavelet combined with neural network, linear regression and support vector machine. Glob. Planet. Chang. 2017, 148, 181–191. [Google Scholar] [CrossRef]
- Lee, S.H.; Lee, K.K.; Yoon, H. Using artificial neural network models for groundwater level forecasting and assessment of the relative impacts of influencing factors. Hydrogeol. J. 2019, 27, 567–579. [Google Scholar] [CrossRef]
- Xu, T.F.; Valocchi, A.J.; Choi, J.; Amir, E. Use of machine learning methods to reduce predictive error of groundwater models. Groundwater 2014, 52, 448–460. [Google Scholar] [CrossRef]
- Xu, T.F.; Valocchi, A.J. Data-driven methods to improve baseflow prediction of a regional groundwater model. Comput. Geosci. 2015, 85, 124–136. [Google Scholar] [CrossRef] [Green Version]
- Sameen, M.I.; Pradhan, B.; Lee, S. Self-learning random forests model for mapping groundwater yield in data-scarce areas. Nat. Resour. Res. 2019, 28. [Google Scholar] [CrossRef]
- Sun, A.Y.; Scanlon, B.R.; Zhang, Z.Z.; Walling, D.; Bhanja, S.N.; Mukherjee, A.; Zhong, Z. Combining physically based modeling and deep learning for fusing GRACE satellite data: Can we learn from mismatch? Water Resour. Res. 2019, 55, 1179–1195. [Google Scholar] [CrossRef] [Green Version]
- Safavi, H.R.; Esmikhani, M. Conjunctive use of surface water and groundwater: Application of support vector machines (SVMs) and genetic algorithms. Water Resour. Manag. 2013, 27, 2623–2644. [Google Scholar] [CrossRef]
- Gaur, S.; Dave, A.; Gupta, A.; Ohri, A.; Graillot, D.; Dwivedi, S.B. Application of artificial neural networks for identifying optimal groundwater pumping and piping network layout. Water Resour. Manag. 2018, 32, 5067–5079. [Google Scholar] [CrossRef]
- Seyoum, W.M.; Kwon, D.J.; Milewski, A.M. Downscaling GRACE TWSA data into high-resolution groundwater level anomaly using machine learning-based models in a glacial aquifer system. Remote Sens. 2019, 11, 824. [Google Scholar] [CrossRef] [Green Version]
- Lal, A.; Datta, B. Development and implementation of support vector machine regression surrogate models for predicting groundwater pumping-induced saltwater intrusion into coastal aquifers. Water Resour. Manag. 2018, 32, 2405–2419. [Google Scholar] [CrossRef]
- Sajehi-Hosseini, F.; Malekian, A.; Choubin, B.; Rahmati, O.; Cipullo, S.; Coulon, F.; Pradhan, B. A novel machine learning-based approach for the risk assessment of nitrate groundwater contamination. Sci. Total Environ. 2018, 644, 954–962. [Google Scholar] [CrossRef] [Green Version]
- Granda, J.M.; Donina, L.; Dragone, V.; Long, D.L.; Cronin, L. Controlling an organic synthesis robot with machine learning to search for new reactivity. Letter 2018, 559, 377–381. [Google Scholar] [CrossRef]
- Nwachukwu, A.; Jeong, H.; Pyrcz, M.; Lake, L.W. Fast evaluation of well placements in heterogeneous reservoir models using machine learning. J. Pet. Sci. Eng. 2018, 163, 463–475. [Google Scholar] [CrossRef]
- Mendelsohn, F. The Geology of the North Rhodesian Copperbelt; Macdonald: London, UK, 1961; pp. 351–405. [Google Scholar]
- François, A. L’extremité Occidentale Del’arc Cuprifère Shabien Etude Geologique; Bureau D’études Géologiques; Aulhenlie Investment Consulting (China) Lo. Ltd. Translation in 2006; Gécamines-Exploitation: Likasi, Zaïre, 1973. (In Chinese) [Google Scholar]
- Takafuji, E.H.M.; Rocha, M.M.; Manzione, R.L. Groundwater level prediction/forecasting and assessment of uncertainty using SGS and ARIMA models: A case study in the Bauru Aquifer System (Brazil). Nat. Resour. Res. 2019, 28. [Google Scholar] [CrossRef] [Green Version]
- Zhang, M.L.; Hu, L.T.; Yao, L.L.; Yin, W.J. Surrogate models for sub-region groundwater management in the Beijing plain, China. Water 2017, 9, 766. [Google Scholar] [CrossRef] [Green Version]
- Tyralis, H.; Papacharalampous, G.; Langousis, A. A brief review of Random Forests for water scientists and practitioners and their recent history in water resources. Water 2019, 11, 910. [Google Scholar] [CrossRef] [Green Version]
- Pedregosa, F.; Varoquaux, G.; Gramfort, A.; Michel, V.; Thirion, B.; Grisel, O.; Blondel, M.; Prettenhofer, P.; Weiss, R.; Dubourg, V.; et al. Scikit-learn: Machine learning in Python. J. Mach. Learn. Res. 2011, 12, 2825–2830. [Google Scholar] [CrossRef]
- Haroon, D. Python Machine Learning Case Studies: Five Case Studies for the Data Scientist; Apress: New York, NY, USA, 2017; Volume 1. [Google Scholar]
- Yihdego, Y.; Danis, C.; Paffard, A. Why is the groundwater level rising? A case study using HARTT to simulate groundwater level dynamics. J. Water Environ. Res. 2017, 89, 2142–2152. [Google Scholar] [CrossRef] [PubMed]
- Yihdego, Y.; Webb, J.A. Modeling of bore hydrograph to determine the impact of climate and land use change in a temperate subhumid region of south-eastern Australia. Hydrogeol. J. 2011, 19, 877–887. [Google Scholar] [CrossRef]
- Li, B.; Yang, G.S.; Wan, R.R.; Dai, X.; Zhang, Y.H. Comparison of random forests and other statistical methods for the prediction of lake water level: A case study of the Poyang Lake in China. Hydrol. Res. 2016, 47, 69–83. [Google Scholar] [CrossRef] [Green Version]
- Yihdego, Y. Engineering and enviro-management value of radius of influence estimate from mining excavation. J. Appl. Water Eng. Res. 2018, 6, 329–337. [Google Scholar] [CrossRef]



| Series (From Young to Old) | Formation | Local Name | Brief Description | Approximated Thickness (m) | |
|---|---|---|---|---|---|
| Kundelungu | Kundelungu | Ku | Sediments | 3000–5000 | |
| Nguba | Nguba | Ng | Sandstone, shale | 200–500 | |
| Upper Roan (R) | R4 | Mwashya | shale, siltstone, sandstone, dolomites | 50–100 | |
| R3-2 | Dipeta | Sandy shales | about 1000 | ||
| R3-1 | Roches Greseuse Superior (RGS) | Grey shales | 100–200 | ||
| Lower Roan | R2-3 | Mines Group | Calcaire á Minerals Noirs (CMN) | Black calcareous siltstone | 130 |
| R2-2 | Schistes Dolomitic Superior (SDS) | Dolomitic shales, black ore mineral zone (BOMZ) | 50–80 | ||
| R2-1 | Schistes de Base (SDB) | Dolomitic shales, black ore mineral zone (BOMZ) | 10–15 | ||
| Roches Silicieuses Cellulaire (RSC) | Siliceous, vuggy dolomite | 12–25 | |||
| Roches Silicieuses Feuilletees (RSF) | Bedded dolomitic siltstone | 5 | |||
| Dolomie Stratifiee (DSTRAT) | Grey talcose sandstone | 3 | |||
| Roches Argileuses Talceuse (RAT) GRISES | Grey talcose sandstone | 2–5 | |||
| R1 | Roches Argileuses Talceuse (RAT2) | Talcose sandstone | 190 | ||
| Roches Argileuses Talceuse (RAT1) | Talcose sandstone | 40 | |||
| ID | Well Name | X Coordinate (m) | Y Coordinate (m) | Well Depth (m) | Maximum Drawdown (m) |
|---|---|---|---|---|---|
| 1 | P01 | 332,585.13 | 8,817,317.16 | 310.20 | 61.21 |
| 2 | P02 | 332,754.99 | 8,817,435.06 | 251.51 | 45.08 |
| 3 | P03 | 332,259.70 | 8,817,203.31 | 325.00 | 57.70 |
| 4 | O01 | 332,466.69 | 8,817,664.79 | 110.39 | 0.42 |
| 5 | O02 | 332,522.15 | 8,817,498.36 | 300.20 | 1.22 |
| 6 | O03 | 332,061.84 | 8,817,135.65 | 330.19 | 22.35 |
| 7 | O04 | 331,489.21 | 8,816,936.91 | 150.56 | 1.39 |
| 8 | O05 | 333,045.08 | 8,817,509.79 | 300.05 | 7.55 |
| 9 | O06 | 333,190.69 | 8,817,610.82 | 110.03 | 0.59 |
| 10 | O07 | 332,821.69 | 8,816,666.56 | 150.95 | 0.27 |
| 11 | O08 | 332,805.85 | 8,816,292.67 | 102.25 | 0.15 |
| 12 | O09 | 330,946.09 | 8,817,636.84 | 100.25 | 0.13 |
| 13 | O10 | 331,761.74 | 8,817,414.28 | 100.42 | 0.68 |
| 14 | O11 | 330,483.97 | 8,817,678.42 | 150.00 | 0.48 |
| 15 | O12 | 330,483.97 | 8,817,678.42 | 50.00 | −0.13 |
| 16 | O13 | 332,594.98 | 8,817,275.07 | 400.07 | 18.16 |
| 17 | O14 | 332,856.15 | 8,817,437.12 | 344.13 | 37.27 |
| 18 | O15 | 332,253.28 | 8,817,166.53 | 324.75 | 27.81 |
| 19 | O16 | 332,709.88 | 8,817,245.02 | 450.20 | 3.84 |
| 20 | O17 | 332,475.42 | 8,817,329.49 | 330.51 | 18.20 |
| 21 | O18 | 332,546.68 | 8,817,209.31 | 602.00 | 2.94 |
| 22 | O19 | 332,442.94 | 8,817,113.78 | 658.00 | 1.81 |
| 23 | O20 | 332,778.77 | 8,817,213.32 | 346.00 | 4.86 |
| 24 | O21 | 332,735.77 | 8,817,305.28 | 442.00 | 4.38 |
| 25 | O22 | 332,515.40 | 8,817,012.31 | 612.00 | 2.26 |
| 26 | O23 | 331,833.07 | 8,816,934.75 | 281.05 | 3.01 |
| 27 | O24 | 332,026.27 | 8,816,985.75 | 50.00 | −0.17 |
| 28 | O25 | 332,026.27 | 8,816,985.75 | 150.00 | 8.95 |
| Models | Parameters | RMSE (m) | Average Relative Error (%) | |||
|---|---|---|---|---|---|---|
| Well O15 | Well O19 | Well O15 | Well O19 | |||
| ANN Model | number of the first and the second hidden layers | (2, 2) | 5.1972 | 0.3516 | 90.64 | 220.01 |
| (5, 5) | 0.8717 | 0.1834 | 9.66 | 195.83 | ||
| (10, 10) | 0.5844 | 0.1998 | 16.30 | 84.34 | ||
| (100, 100) | 0.5085 | 0.1237 | 10.56 | 89.60 | ||
| SVR Model | kernel function (the radial basis function (rbf) and linear) and parameter c | rbf, c = 10 | 1.1462 | 0.0941 | 76.40 | 96.87 |
| rbf, c = 100 | 0.0926 | 0.0941 | 1.90 | 96.87 | ||
| rbf, c = 1000 | 0.0926 | 0.0941 | 1.90 | 96.87 | ||
| linear, c = 1000 | 2.6271 | 5.4130 | 58.95 | 2443.24 | ||
| RF Model | number of trees (n) | n = 5 | 0.2429 | 0.0551 | 14.13 | 22.01 |
| n = 50 | 0.2071 | 0.0468 | 11.57 | 13.38 | ||
| n = 500 | 0.1842 | 0.0416 | 11.17 | 14.84 | ||
| n = 5000 | 0.1853 | 0.0394 | 10.91 | 15.17 | ||
© 2020 by the authors. Licensee MDPI, Basel, Switzerland. This article is an open access article distributed under the terms and conditions of the Creative Commons Attribution (CC BY) license (http://creativecommons.org/licenses/by/4.0/).
Share and Cite
Fan, Y.; Hu, L.; Wang, H.; Liu, X. Machine Learning Methods for Improved Understanding of a Pumping Test in Heterogeneous Aquifers. Water 2020, 12, 1342. https://doi.org/10.3390/w12051342
Fan Y, Hu L, Wang H, Liu X. Machine Learning Methods for Improved Understanding of a Pumping Test in Heterogeneous Aquifers. Water. 2020; 12(5):1342. https://doi.org/10.3390/w12051342
Chicago/Turabian StyleFan, Yong, Litang Hu, Hongliang Wang, and Xin Liu. 2020. "Machine Learning Methods for Improved Understanding of a Pumping Test in Heterogeneous Aquifers" Water 12, no. 5: 1342. https://doi.org/10.3390/w12051342


