In-Situ Monitoring and Characteristic Analysis of Freezing-Thawing Cycles in a Deep Vadose Zone
Abstract
:1. Introduction
2. Materials and Methods
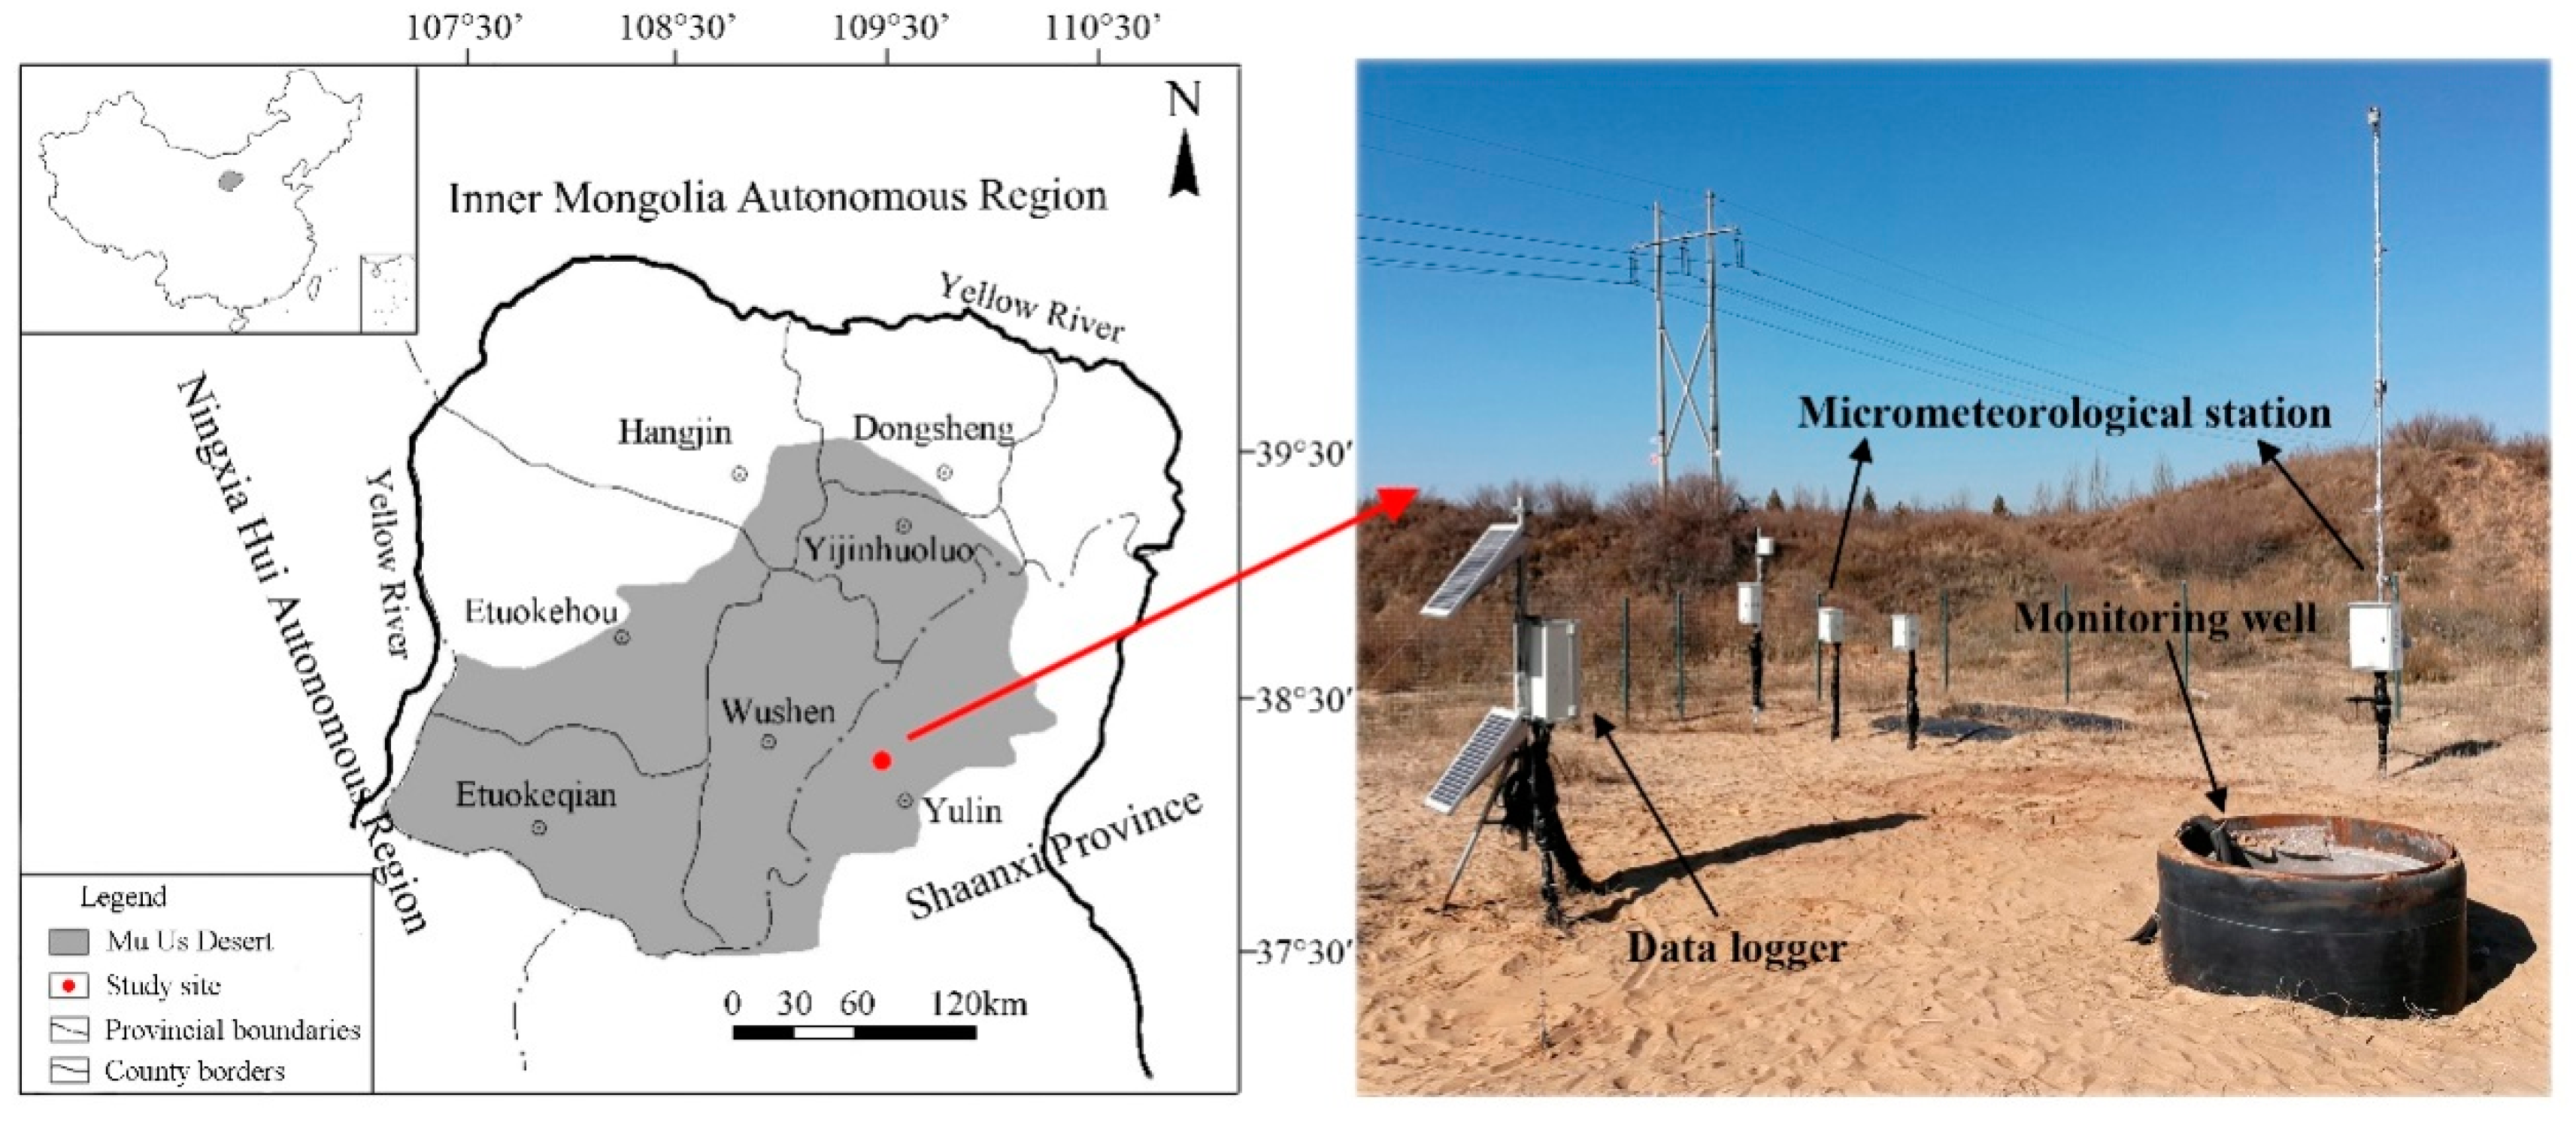
2.1. Study Site
2.2. In-Situ Observations
2.3. Mathematical Calculations
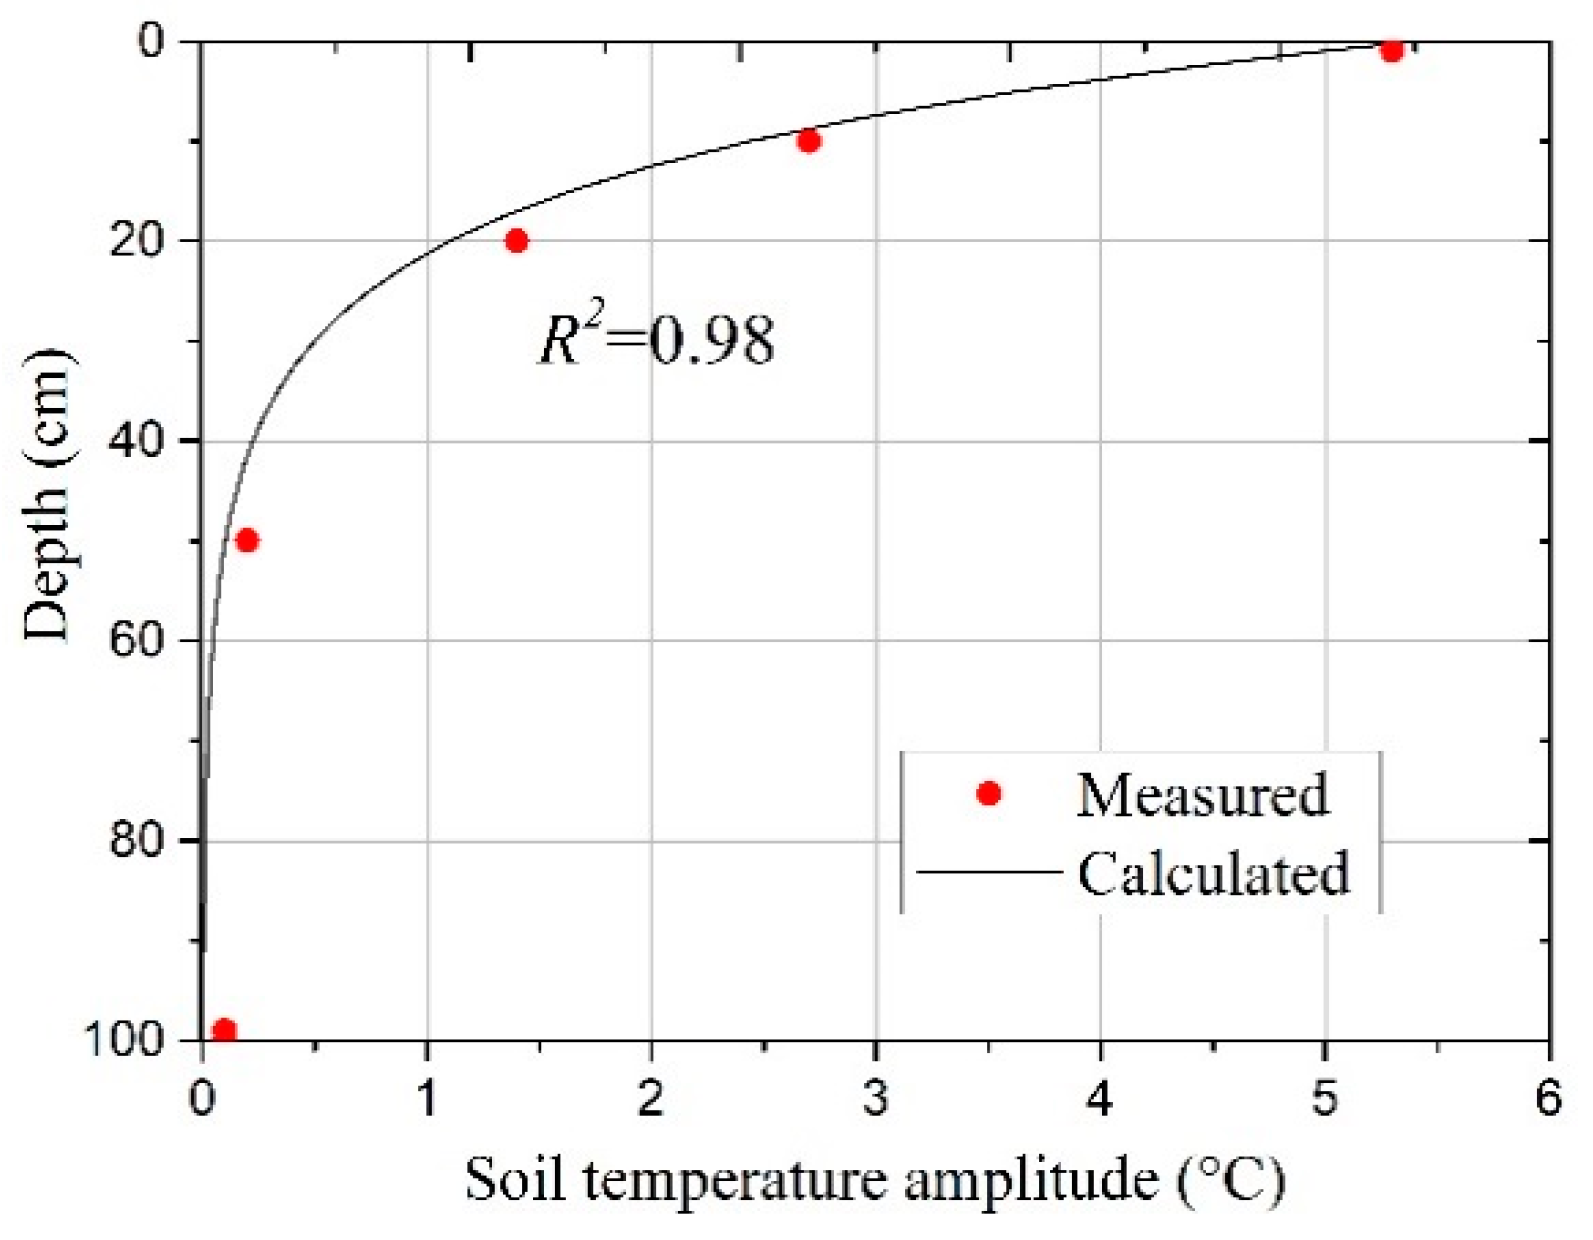
2.3.1. Soil Heat Transport
2.3.2. Unfrozen Water Content
2.3.3. Thermal Vapor Flux
3. Results
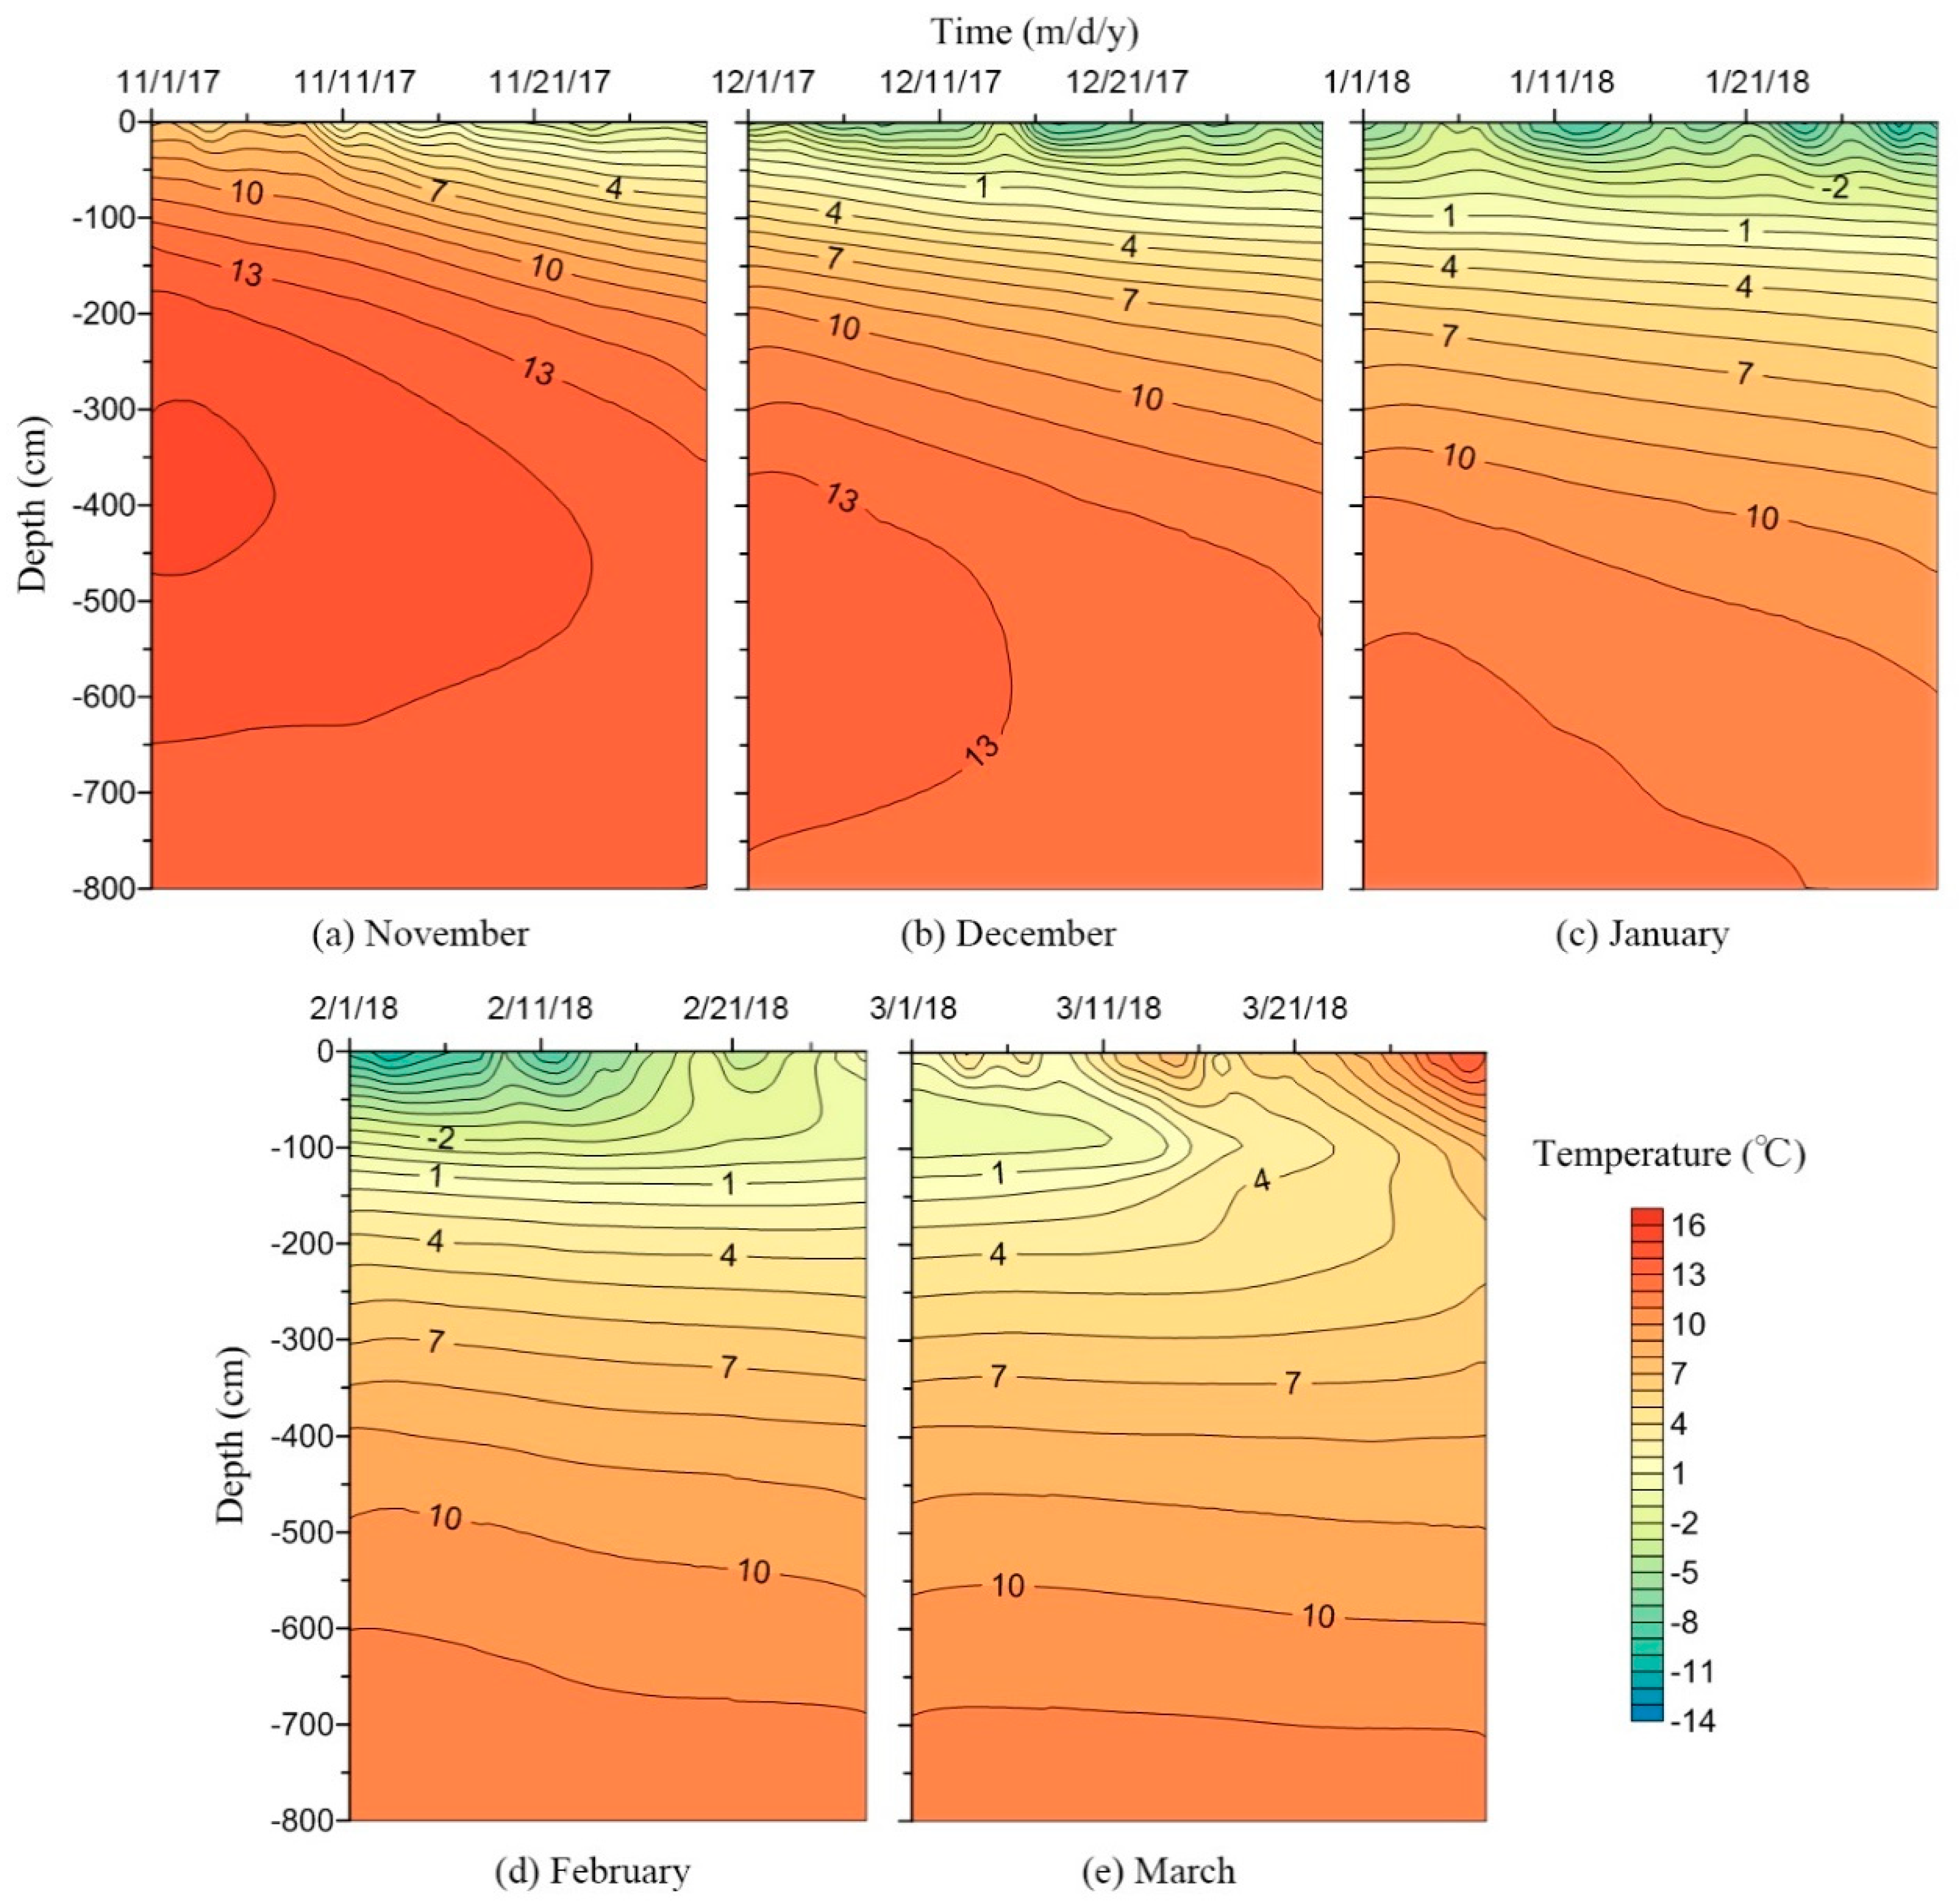
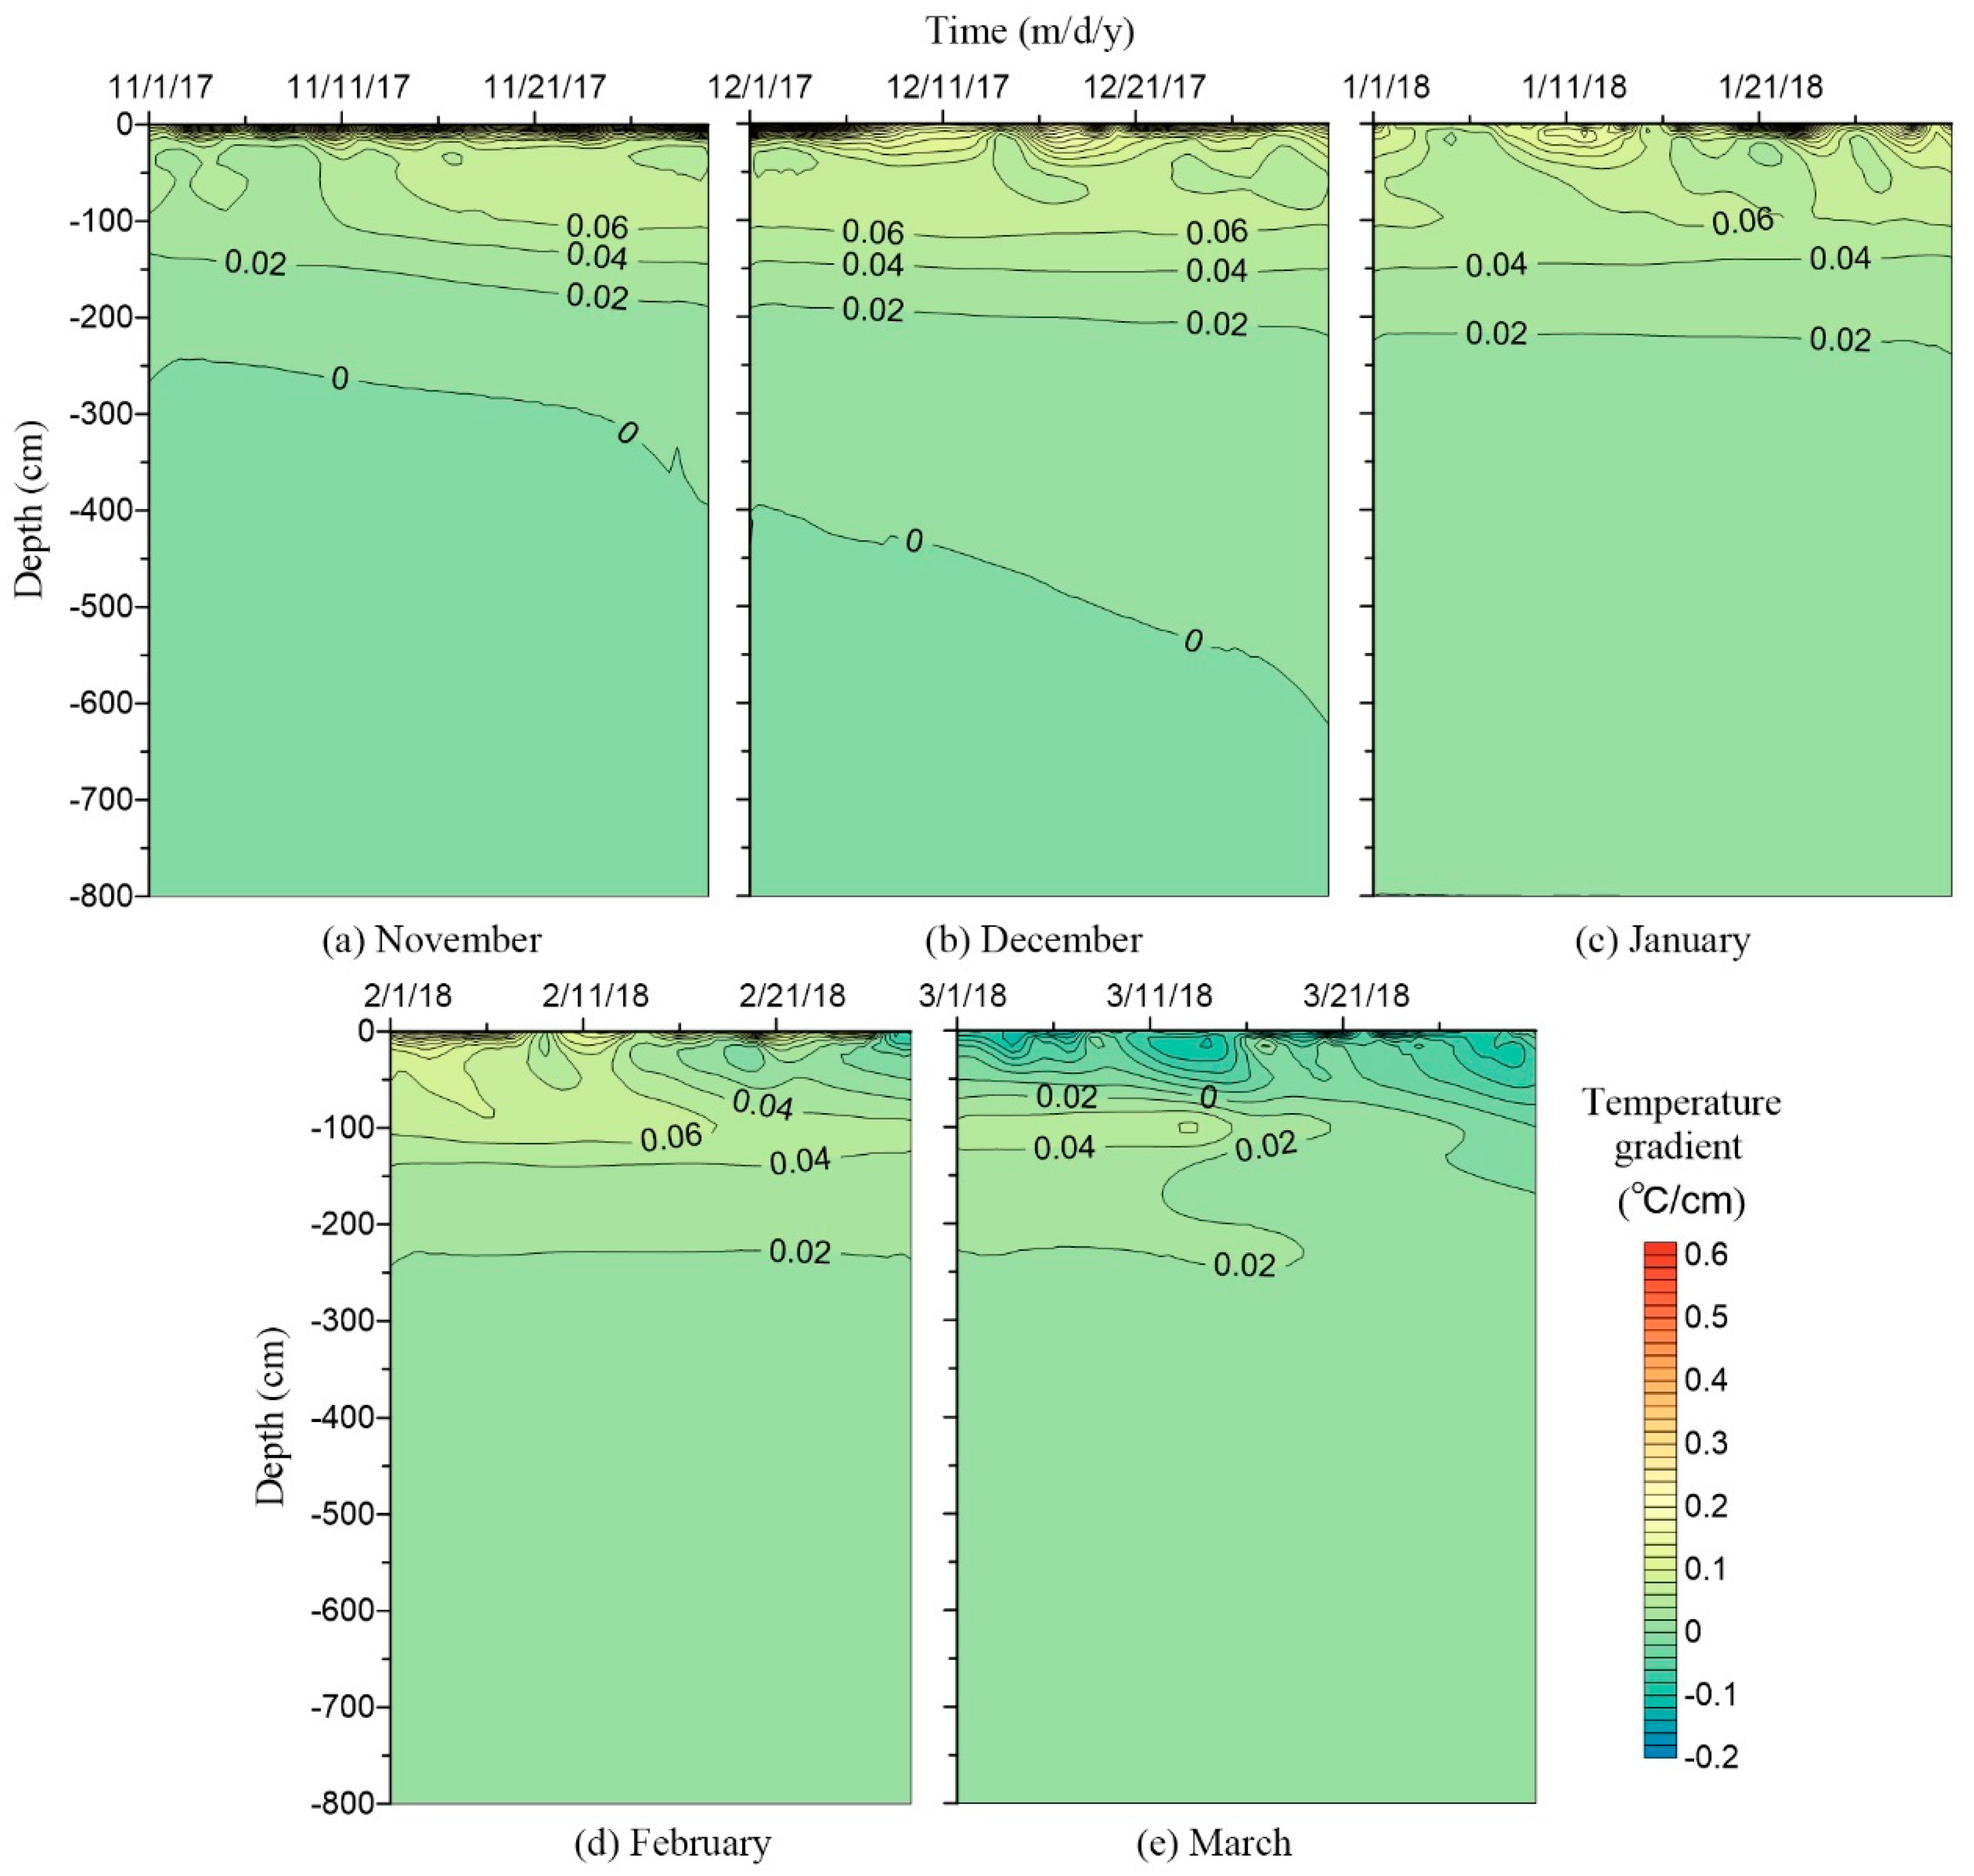
3.1. Measured Spatial-Temporal Distribution of Soil Temperature
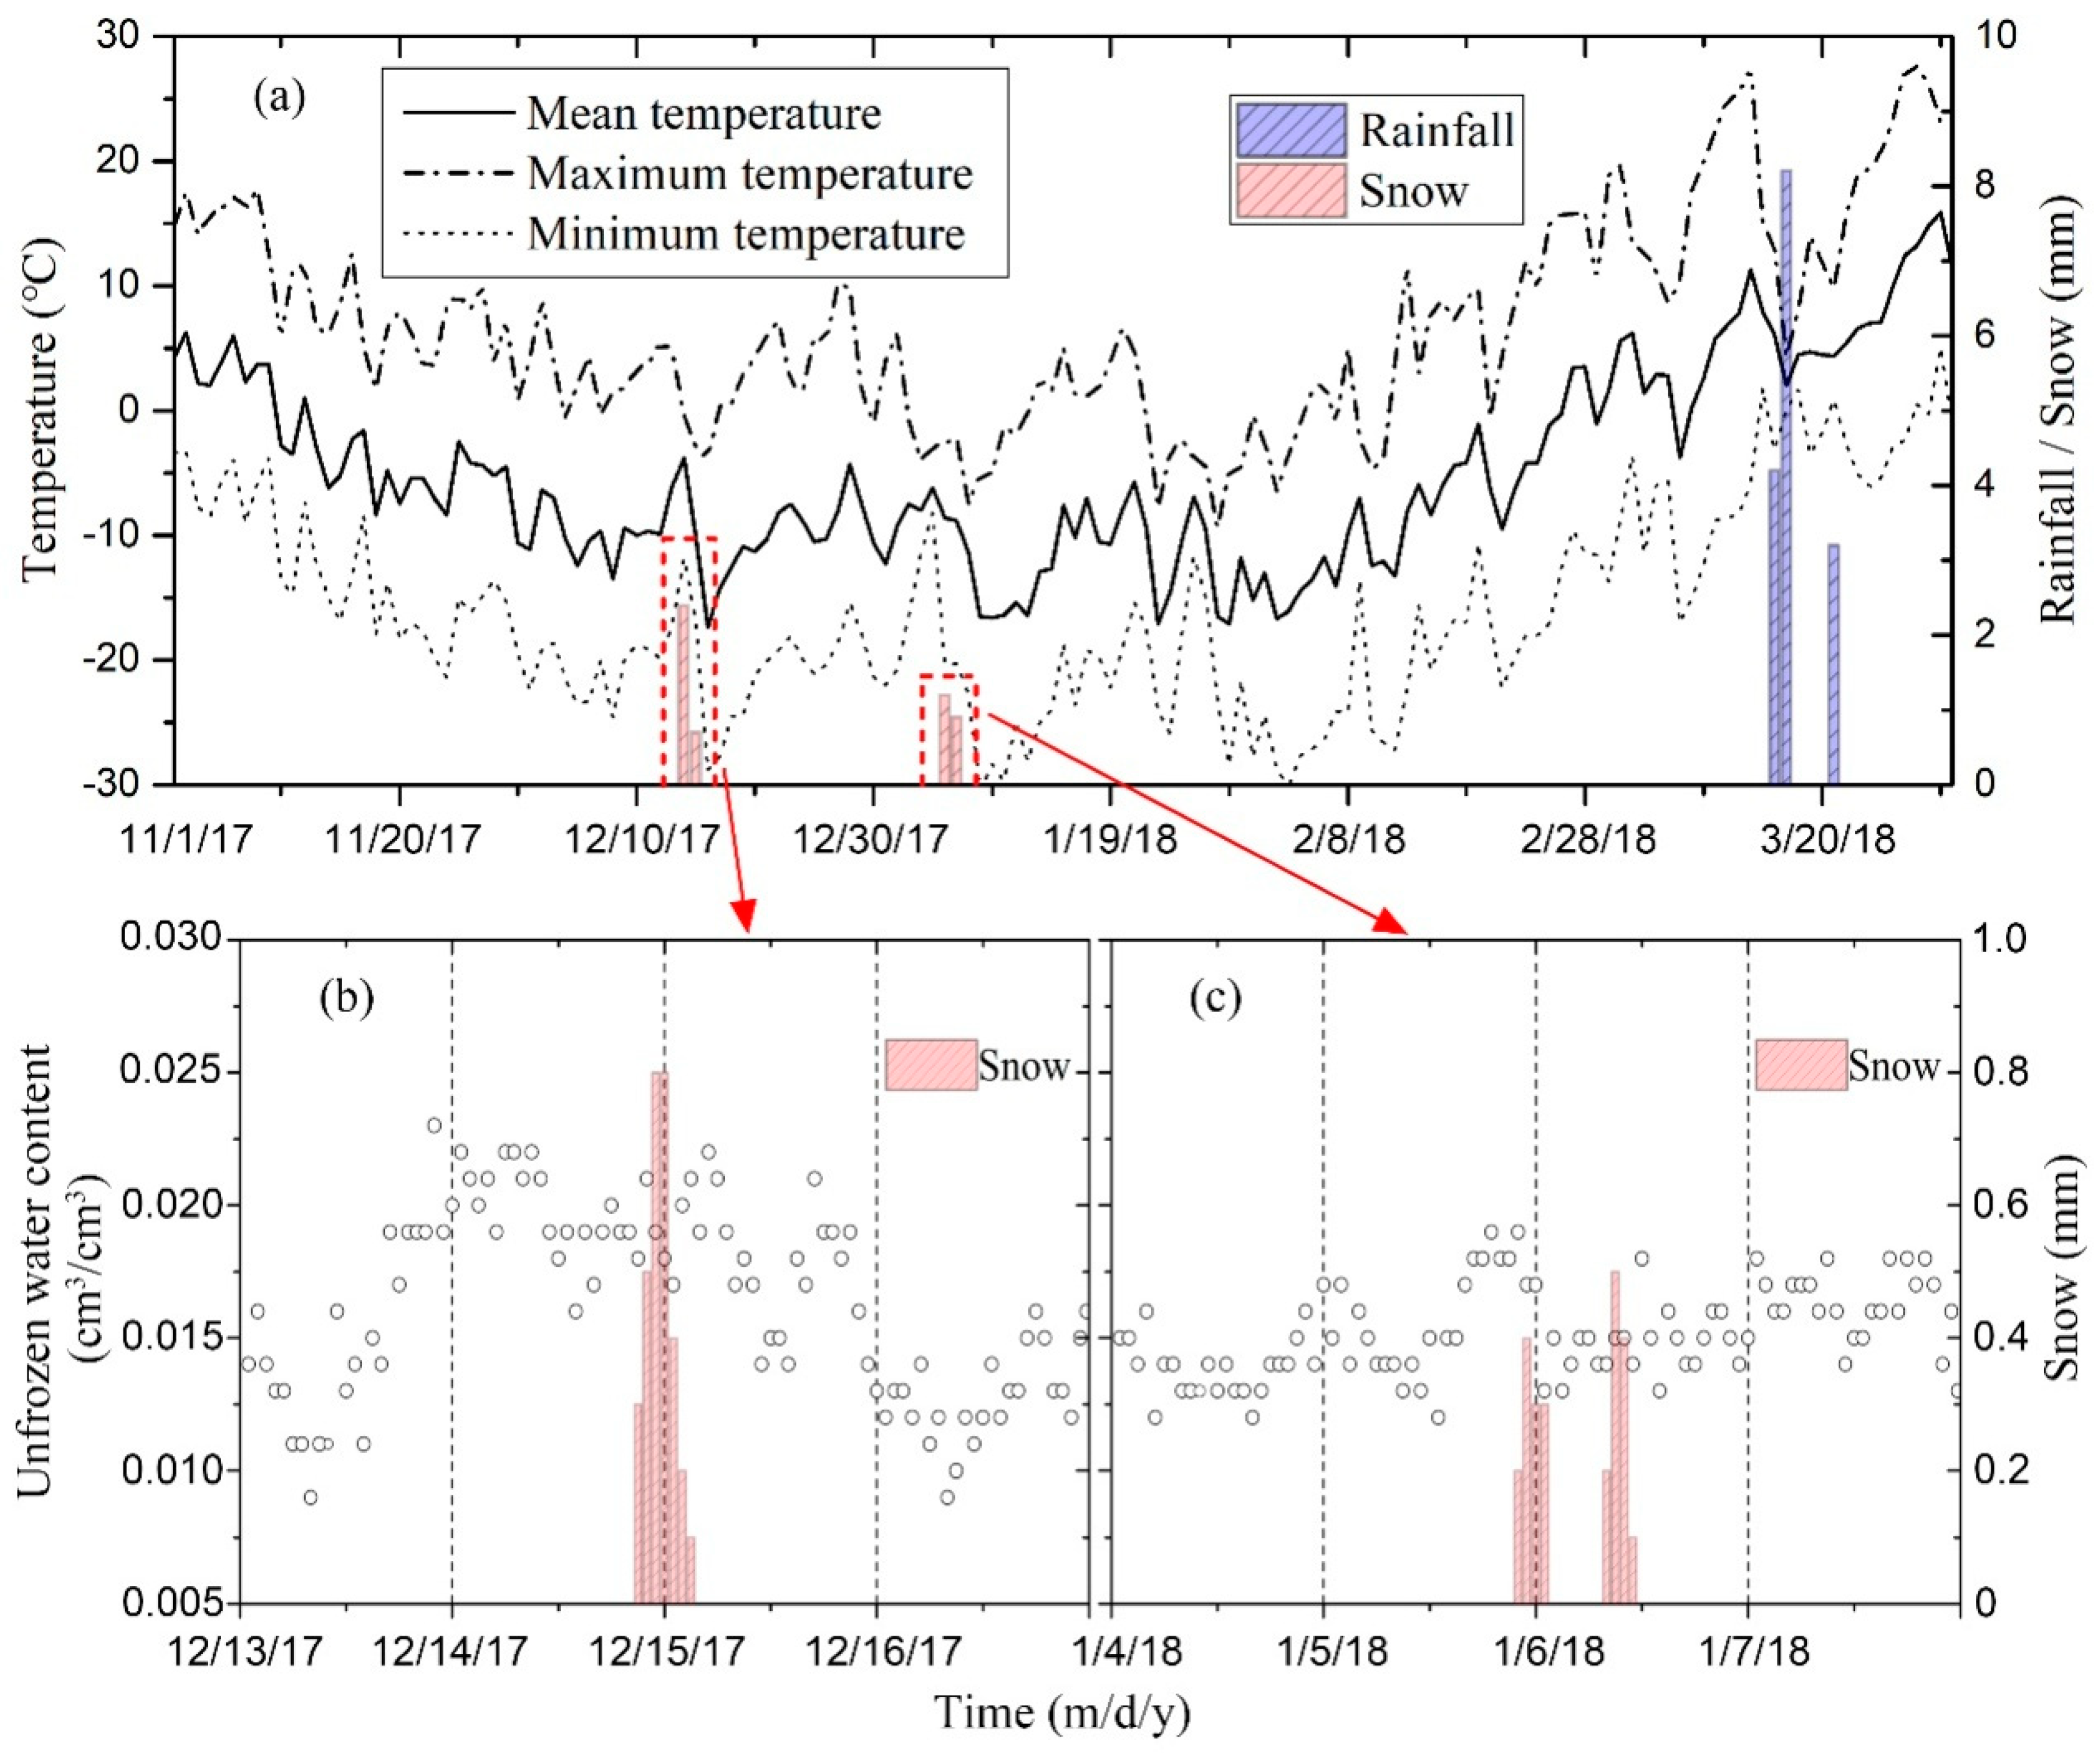
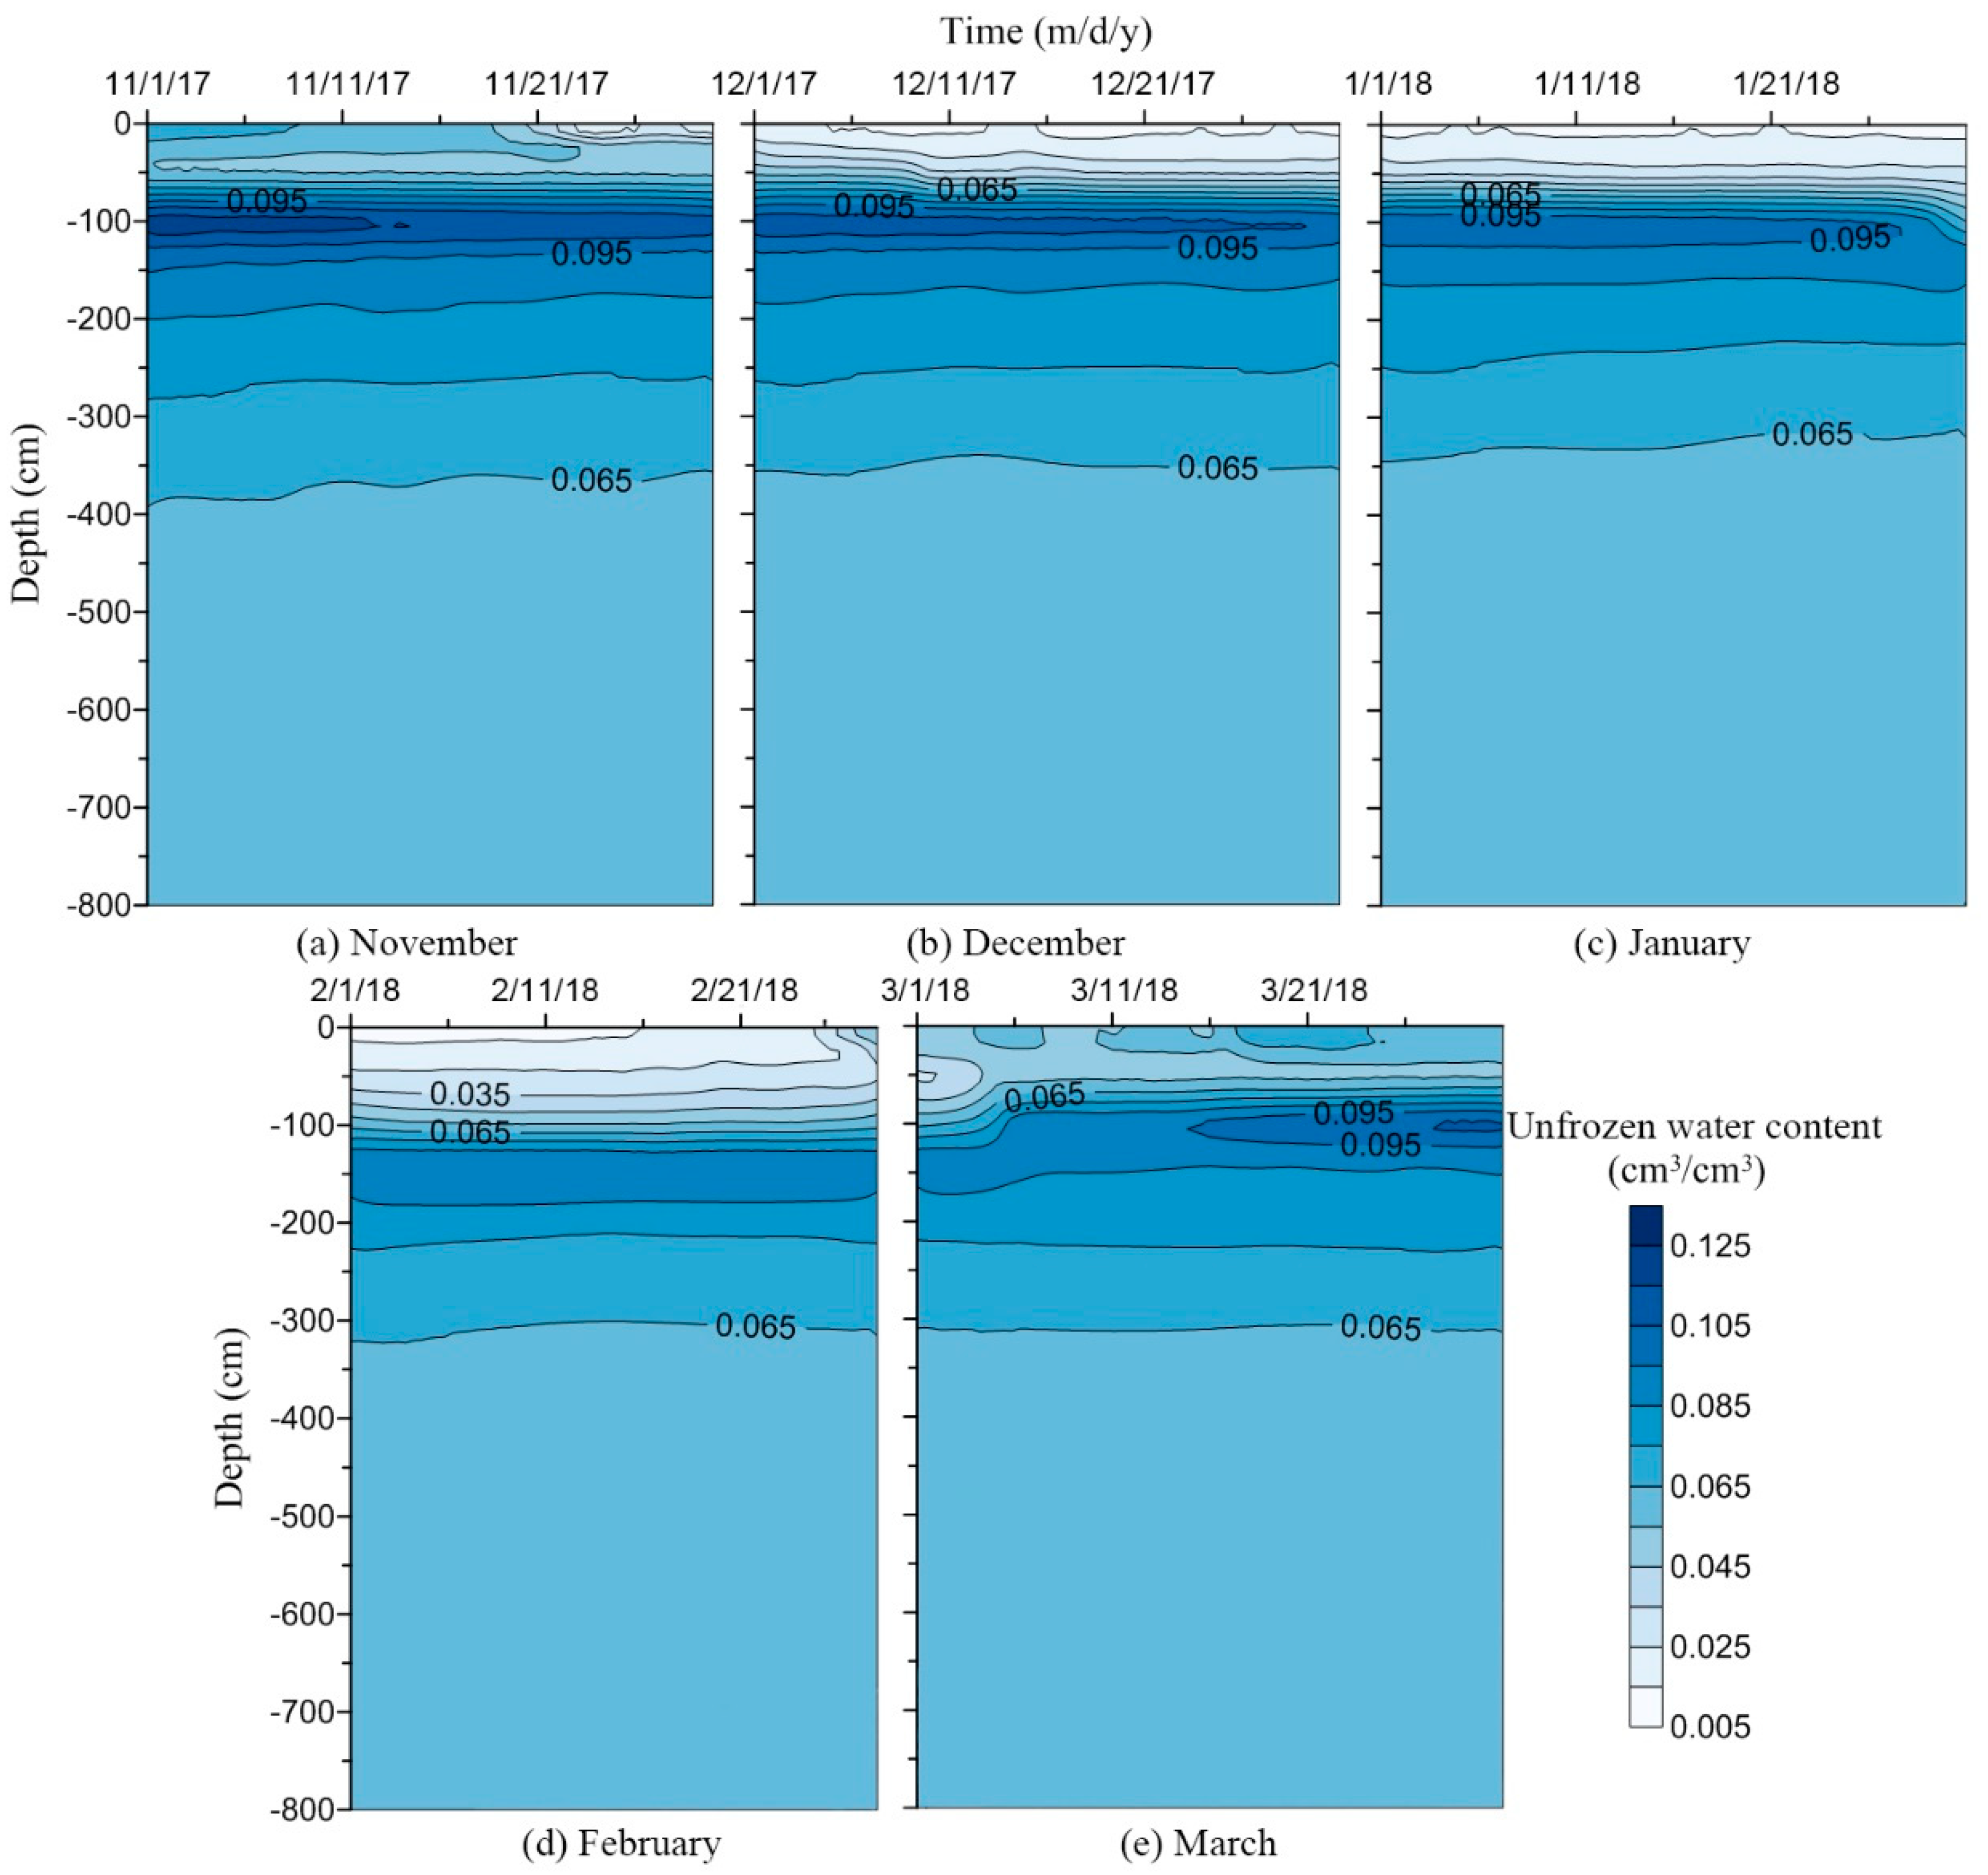
3.2. Measured Spatial-Temporal Distribution of Soil Water Content
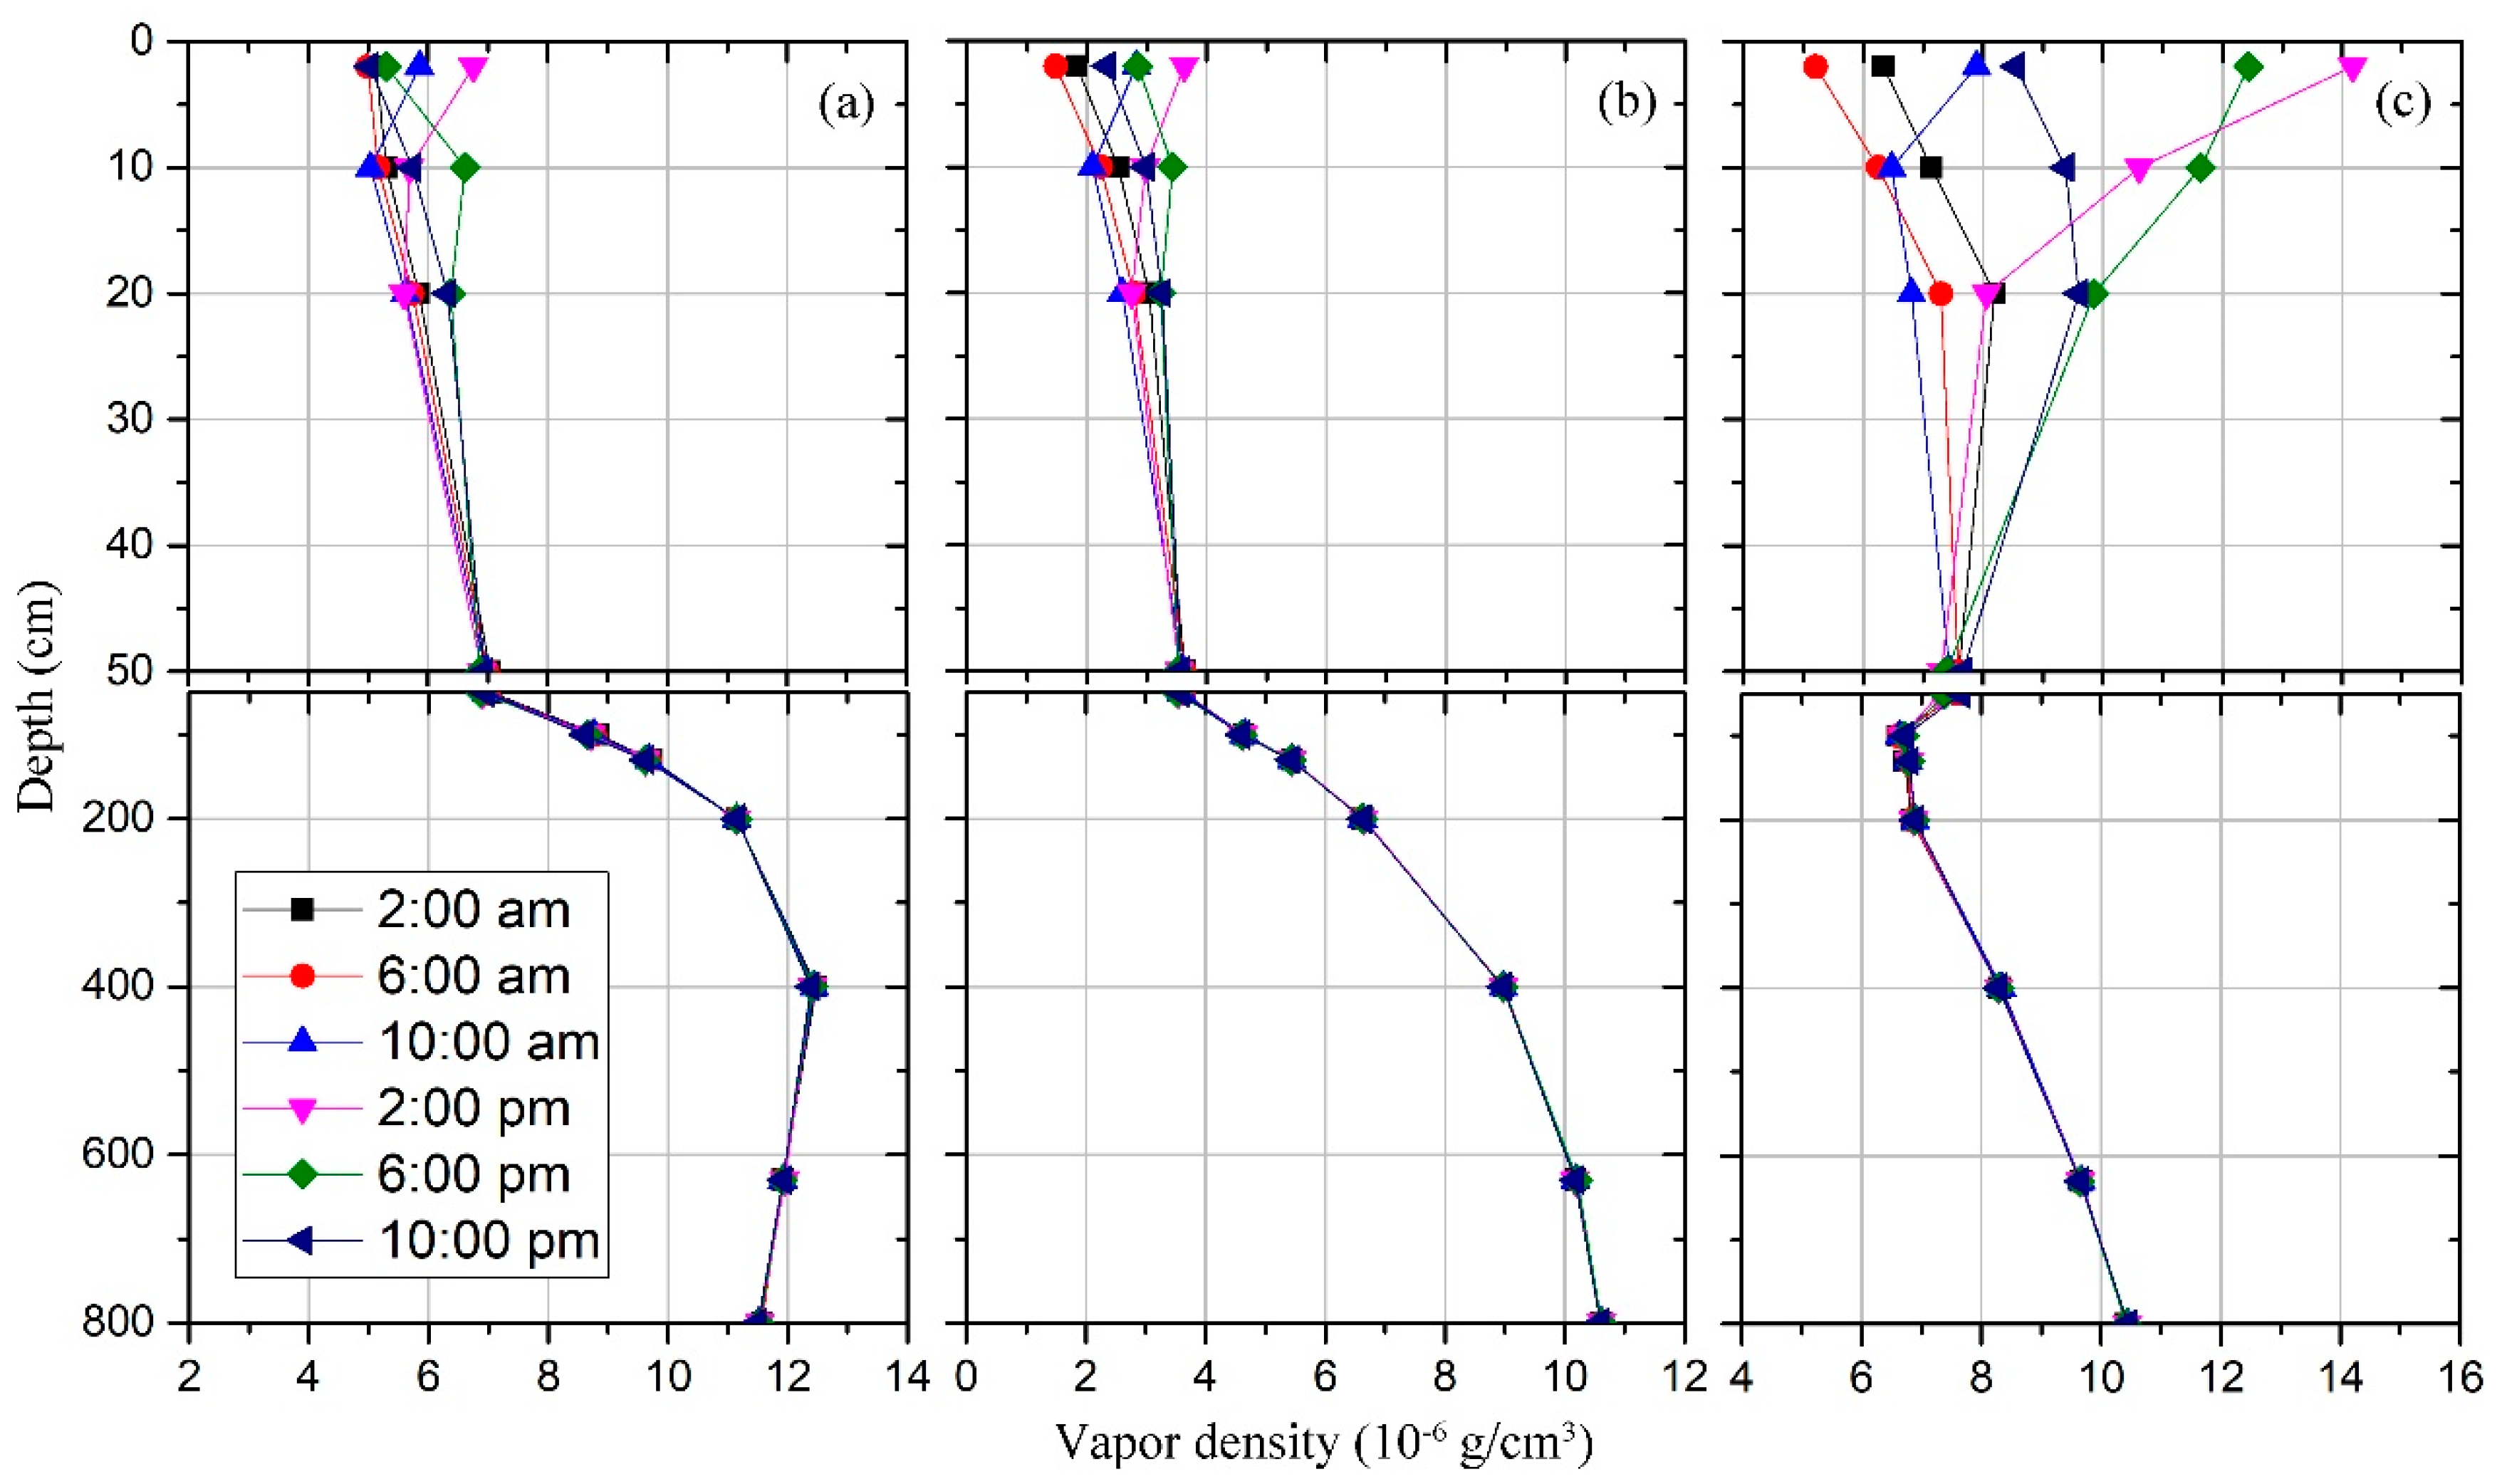
3.3. Water Vapor Flux
4. Discussion
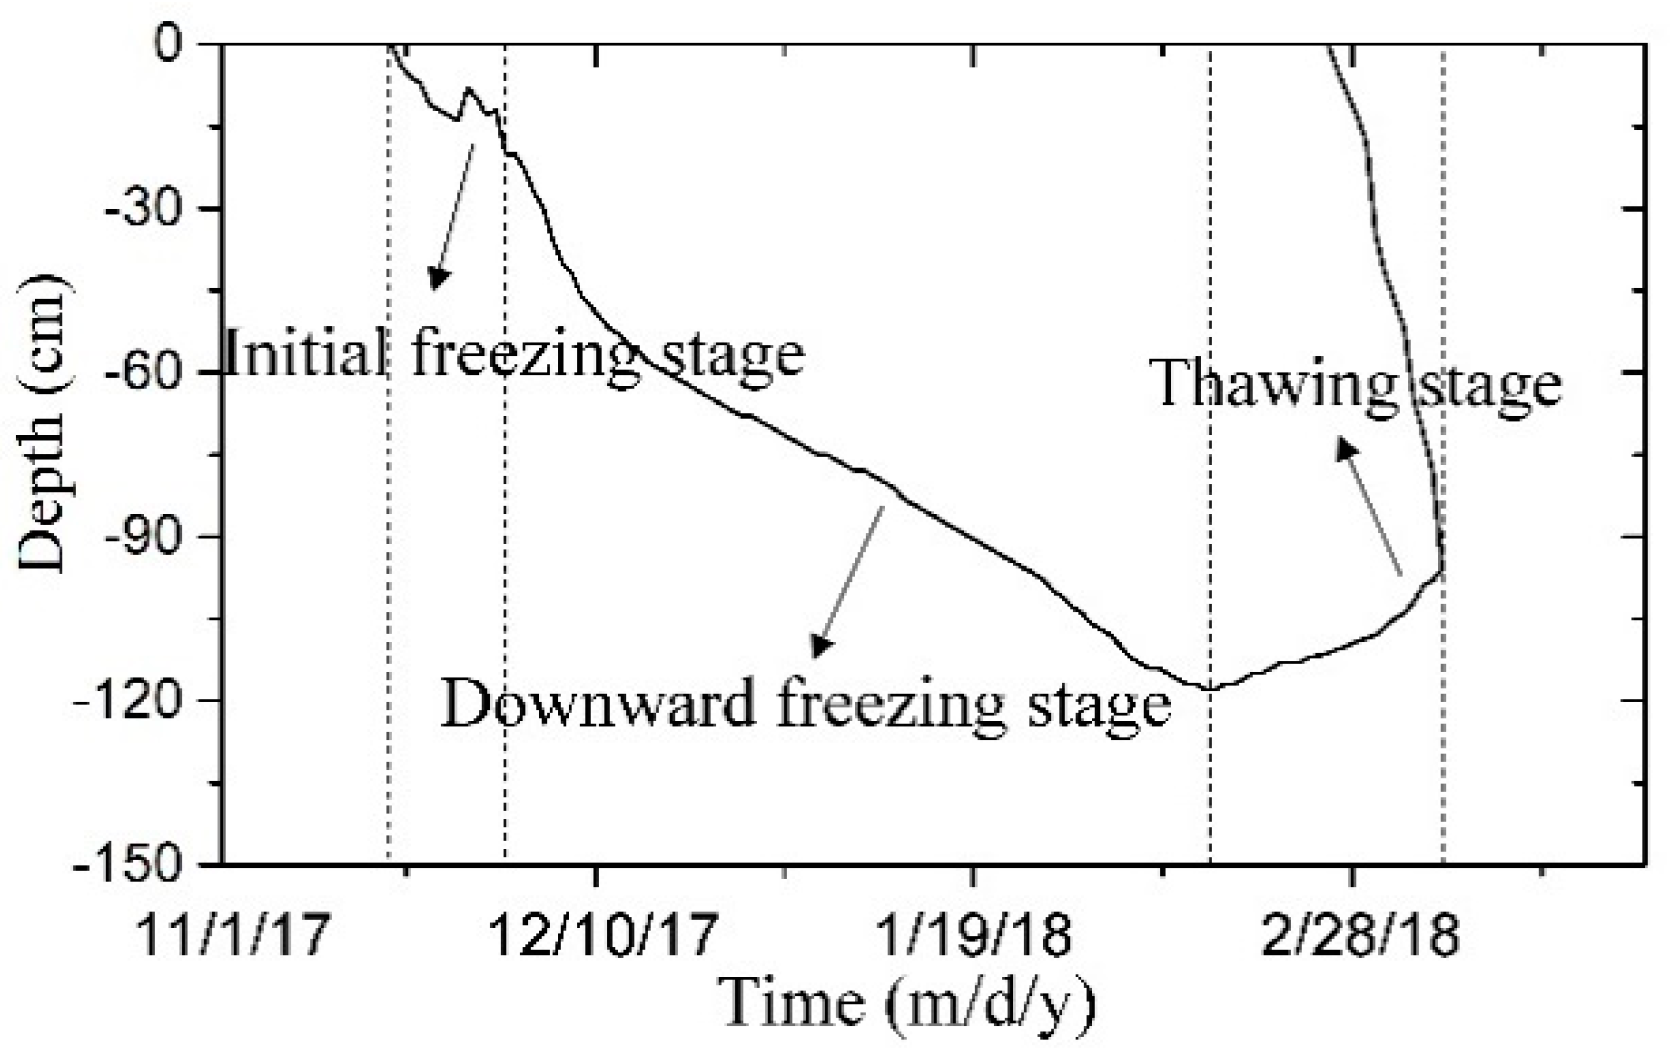
4.1. Characteristics of the Freeze-Thaw Process
4.2. Vapor Migration during the Freezing-Thawing Period
5. Conclusions
Author Contributions
Funding
Acknowledgments
Conflicts of Interest
References
- Chen, J.; Gao, X.; Zheng, X.; Miao, C.; Liu, P.; Du, Q.; Xu, Y. Transformation between phreatic water and soil Water during freeze–thaw periods. Water 2018, 10, 376. [Google Scholar] [CrossRef] [Green Version]
- Wen, Z.; Ma, W.; Feng, W.; Deng, Y.; Wang, D.; Fan, Z.; Zhou, C. Experimental study on unfrozen water content and soil matric potential of Qinghai-Tibetan silty clay. Environ. Earth Sci. 2012, 66, 1467–1476. [Google Scholar] [CrossRef]
- Cheng, Q.; Sun, Y.; Jones, S.B.; Vasilyev, V.I.; Popov, V.V.; Wang, G.; Zheng, L. In situ measured and simulated seasonal freeze-thaw cycle: A 2-year comparative study between layered and homogeneous field soil profiles. J. Hydrol. 2014, 519, 1466–1473. [Google Scholar] [CrossRef]
- Wang, W.; Li, H.; Wang, J.; Hao, X. Water vapor from western Eurasia promotes precipitation during the snow season in northern Xinjiang, a typical arid region in central Asia. Water 2020, 12, 141. [Google Scholar] [CrossRef] [Green Version]
- Zhang, Y.; Cheng, G.; Li, X.; Han, X.; Wang, L.; Li, H.; Chang, X.; Flerchinger, G.N. Coupling of a simultaneous heat and water model with a distributed hydrological model and evaluation of the combined model in a cold region watershed. Hydrol. Process. 2012, 27, 3762–3776. [Google Scholar] [CrossRef]
- Hayashi, M. The cold vadose zone: Hydrological and ecological significance of frozen-soil processes. Vadose Zone J. 2013, 12, 37–44. [Google Scholar] [CrossRef]
- Yin, X.; Liu, E.; Song, B.; Zhang, D. Numerical analysis of coupled liquid water, vapor, stress and heat transport in unsaturated freezing soil. Cold Reg. Sci. Technol. 2018, 155, 20–28. [Google Scholar] [CrossRef]
- Zheng, D.; Rogier, V.D.V.; Su, Z.; Wen, J.; Wang, X.; Yang, K. Impact of soil freeze-thaw mechanism on the runoff dynamics of two Tibetan rivers. J. Hydrol. 2018, 563, 382–394. [Google Scholar] [CrossRef]
- Monrabal-Martinez, C.; Scibilia, E.; Maus, S.; Muthanna, T.M. Infiltration response of adsorbent amended filters for stormwater management under freezing/thawing conditions. Water 2019, 11, 2619. [Google Scholar] [CrossRef] [Green Version]
- Steelman, C.M.; Endres, A.L.; Kruk, J.V.D. Field observations of shallow freeze and thaw processes using high-frequency ground-penetrating radar. Hydrol. Process. 2010, 24, 2022–2033. [Google Scholar] [CrossRef]
- Zhang, Y.; Ma, W.; Wang, T.; Cheng, B.; Wen, A. Characteristics of the liquid and vapor migration of coarse-grained soil in an open-system under constant-temperature freezing. Cold Reg. Sci. Technol. 2019, 165, 102793. [Google Scholar] [CrossRef]
- Guo, D.; Yang, M.; Wang, H. Characteristics of land surface heat and water exchange under different soil freeze/thaw conditions over the central Tibetan Plateau. Hydrol. Process. 2011, 25, 2531–2541. [Google Scholar] [CrossRef]
- Yi, J.; Zhao, Y.; Shao, M.; Zhang, J.; Cui, L.; Si, B. Soil freezing and thawing processes affected by the different landscape in the middle reaches of the Heihe River Basin, Gansu, China. J. Hydrol. 2014, 519, 1328–1338. [Google Scholar] [CrossRef]
- Romanovsky, V.E.; Osterkamp, T.E. Effects of unfrozen water on heat and mass transport processes in the active layer and permafrost. Permafr. Periglac. 2000, 11, 219–239. [Google Scholar] [CrossRef]
- Watanabe, K.; Wake, T. Measurement of unfrozen water content and relative permittivity of frozen unsaturated soil using NMR and TDR. Cold Reg. Sci. Technol. 2009, 59, 34–41. [Google Scholar] [CrossRef]
- Lu, C.; Qin, W.; Zhao, G.; Zhang, Y.; Wang, W. Better-fitted probability of hydraulic conductivity for a silty clay site and its effects on solute transport. Water 2017, 9, 466. [Google Scholar] [CrossRef] [Green Version]
- Zhao, X.; Xu, S.; Liu, T.; Qiu, P.; Qin, G. Moisture distribution in sloping black soil farmland during the freeze–thaw period in northeastern China. Water 2019, 11, 536. [Google Scholar] [CrossRef] [Green Version]
- Hansson, K.; Šimůnek, J.; Mizoguchi, M.; Lundin, L.C.; Th. van Genuchten, M. Water flow and heat transport in frozen soil: Numerical solution and freeze-thaw applications. Vadose Zone J. 2004, 3, 527–533. [Google Scholar] [CrossRef] [Green Version]
- Iwata, Y.; Hirota, T. Monitoring over-winter soil water dynamics in a freezing and snow-covered environment using a thermally insulated tensiometer. Hydrol. Process. 2005, 19, 3013–3019. [Google Scholar] [CrossRef]
- Iwata, Y.; Hirota, T.; Hayashi, M.; Suzuki, S.; Hasegawa, S. Effects of frozen soil and snow cover on cold-season soil water dynamics in Tokachi, Japan. Hydrol. Process. 2010, 24, 1755–1765. [Google Scholar] [CrossRef]
- Kozlowski, T.; Nartowska, E. The Unfrozen water content in representative bentonites of different origin subjected to cyclic freezing and thawing. Vadose Zone J. 2013, 12, 1196–1206. [Google Scholar] [CrossRef] [Green Version]
- Henry, H.A.L. Soil freeze-thaw cycle experiments: Trends methodological weaknesses and suggested improvements. Soil Biol. Biochem. 2007, 39, 977–986. [Google Scholar] [CrossRef]
- Kozlowski, T. Some factors affecting supercooling and the equilibrium freezing point in soil-water systems. Cold Reg. Sci. Technol. 2009, 59, 25–33. [Google Scholar] [CrossRef]
- Zeng, Y.; Su, Z.; Wan, L.; Yang, Z.; Zhang, T.; Tian, H.; Shi, X.; Wang, X.; Cao, W. Diurnal pattern of the drying front in desert and its application for determining the effective infiltration. Hydrol. Earth Syst. Sci. 2009, 13, 703–714. [Google Scholar] [CrossRef] [Green Version]
- Zhou, Y.; Wang, X.; Han, P. Depth-dependent seasonal variation of soil water in a thick vadose zone in the Badain Jaran Desert, China. Water 2018, 10, 1719. [Google Scholar] [CrossRef] [Green Version]
- Zeng, Y.; Su, Z.; Wan, L.; Wen, J. Numerical analysis of air-water-heat flow in the unsaturated soil: Is it necessary to consider air flow in land surface models? J. Geophys. Res. 2011, 116, D20107. [Google Scholar] [CrossRef] [Green Version]
- Zhang, S.; Teng, J.; He, Z.; Sheng, D. Importance of vapor flow in unsaturated freezing soil: A numerical study. Cold Reg. Sci. Technol. 2016, 126, 1–9. [Google Scholar] [CrossRef]
- Saito, H.; Šimůnek, J.; Mohanty, B. Numerical analyses of coupled water, vapor, and heat transport in the vadose zone. Vadose Zone J. 2006, 5, 784–800. [Google Scholar] [CrossRef] [Green Version]
- Zeng, Y.; Su, Z.; Wan, L.; Wen, J. A simulation analysis of the advective effect on evaporation using a two-phase heat and mass flow model. Water Resour. Res. 2011, 47, W10529. [Google Scholar] [CrossRef]
- Yu, L.; Zeng, Y.; Wen, J.; Su, Z. Liquid-vapor-air flow in the frozen soil. J. Geophys. Res. 2018, 123, 7393–7415. [Google Scholar] [CrossRef] [Green Version]
- Xiang, L.; Yu, Z.; Chen, L.; Mon, J.; Lu, H. Evaluating coupled water, vapor, and heat flows and their influence on moisture dynamics in arid regions. J. Hydrol. Eng. 2012, 17, 565–577. [Google Scholar] [CrossRef]
- Zhao, Y.; Huang, M.; Horton, R.; Liu, F.; Peth, S.; Horn, R. Influence of winter grazing on water and heat flow in seasonally frozen soil of Inner Mongolia. Vadose Zone J. 2013, 12, 105–115. [Google Scholar] [CrossRef]
- Bai, C.; He, X.; Tang, H.; Shan, B.; Zhao, L. Spatial distribution of arbuscular mycorrhizal fungi, glomalin and soil enzymes under the canopy of Astragalus adsurgens Pall. In the Mu Us sandland, China. Soil Biol. Biochem. 2009, 41, 941–947. [Google Scholar] [CrossRef]
- Cheng, D.; Li, Y.; Chen, X.; Wang, W.; Hou, G.; Wang, C. Estimation of groundwater evaportranspiration using diurnal water table fluctuations in the Mu Us Desert, northern China. J. Hydrol. 2013, 490, 106–113. [Google Scholar] [CrossRef]
- Li, H.; Lu, Y.; Zheng, C.; Yang, M.; Li, S. Groundwater level prediction for the arid oasis of northwest China based on the artificial bee colony algorithm and a back-propagation neural network with double hidden layers. Water 2019, 11, 860. [Google Scholar] [CrossRef] [Green Version]
- Liu, X.; Guo, C.; He, S.; Zhu, H.; Li, J.; Yu, Z.; Qi, Y.; He, J.; Zhang, J.; Muller, C. Divergent gross nitrogen transformation paths in the topsoil and subsoil between abandoned and agricultural cultivation land in irrigated areas. Sci. Total Environ. 2020, 716, 137148. [Google Scholar] [CrossRef]
- Zheng, C.; Lu, Y.; Guo, X.; Li, H.; Sai, J.; Liu, X. Application of HYDRUS-1D model for research on irrigation infiltration characteristics in arid oasis of northwest China. Environ. Earth Sci. 2017, 76, 785–794. [Google Scholar] [CrossRef]
- Zhang, M.; Wen, Z.; Xue, K.; Chen, L.; Li, D. A coupled model for liquid water, water vapor and heat transport of saturated–unsaturated soil in cold regions: Model formulation and verification. Environ. Earth Sci. 2016, 75, 701–719. [Google Scholar] [CrossRef]
- Cheng, Q.; Sun, Y.; Xue, X.; Guo, J. Characteristics for estimation of soil moisture characteristics using a dielectric tube sensor. Soil Sci. Soc. Am. J. 2014, 78, 133–138. [Google Scholar] [CrossRef]
- Sun, Y.; Cheng, Q.; Xue, X.; Fu, L.; Chai, J.; Meng, F.; Lammers, P.S.; Jones, S.B. Determining in-situ soil freeze-thaw cycle dynamics using an access tube-based dielectric sensor. Geoderma 2012, 189–190, 321–327. [Google Scholar] [CrossRef]
- Radcliffe, D.E.; Šimůnek, J. Soil Physics with HYDRUS: Modeling and Applications; CRC Press: Boca Raton, FL, USA, 2010; p. 373. [Google Scholar]
- Van Genuchten, M.T. A closed-form equation for predicting the hydraulic conductivity of unsaturated soils. Soil Sci. Soc. Am. J. 2010, 44, 892–898. [Google Scholar] [CrossRef] [Green Version]
- Šimůnek, J.; van Genuchten, M.T.; Šejna, M. Development and applications of the HYDRUS and STANMOD software packages and related codes. Vadose Zone J. 2008, 7, 587–600. [Google Scholar] [CrossRef] [Green Version]
- Xu, X.; Wang, J.; Zhang, L. Frozen Soil Physics; Science Press: Beijing, China, 2010; p. 43. [Google Scholar]
- Camillo, P.J.; Gurney, R.; Schmugge, T. A soil and atmospheric boundary layer model for evapotranspiration and soil moisture studies. Water Resour. Res. 1983, 19, 371–380. [Google Scholar] [CrossRef]
- Millington, R.J.; Quirk, J.P. Permeability of porous solids. Trans. Faraday Soc. 1961, 57, 1200–1207. [Google Scholar] [CrossRef]
- Cass, A.; Campbell, G.S.; Jones, T.L. Enhancement of thermal water vapor diffusion in soil. Soil Sci. Soc. Am. J. 1984, 48, 25–32. [Google Scholar] [CrossRef]


| Soil Layer (cm) | Soil Particle Composition (%) | Bulk Density | ||
|---|---|---|---|---|
| Sand | Silt | Clay | (g/cm3) | |
| 0–10 | 96.2 | 3.1 | 0.7 | 1.57 |
| 10–50 | 95.7 | 3.2 | 1.1 | 1.59 |
| 50–80 | 95.5 | 3.3 | 1.2 | 1.57 |
| 80–160 | 90.1 | 5.4 | 4.5 | 1.51 |
| 160–230 | 91.7 | 5.2 | 3.1 | 1.52 |
| 230–560 | 94.0 | 4.7 | 1.3 | 1.57 |
| 560–800 | 95.4 | 3.5 | 1.1 | 1.57 |
| Variables | Sensors | Manufacturers | Height/Depth (cm) |
|---|---|---|---|
| Wind speed (m/s) and wind direction | Davis Cup Anemometer | Decagon | 240 |
| Precipitation (mm) | ECRN-100 | Decagon | 200 |
| Air temperature (°C) and relative humidity | VP-3 | Decagon | 20 |
| Soil temperature (°C) and water content (cm3/cm3) | Hydra Probe II | Stevens | −2, −10, −20, −50, −100, −130, −200, −400, −630, −660 −800 |
| Soil matric potential (hPa) | TensioMark | Stevens | −2, −10, −20, −50, −100, −130, −200, −400, −630, −660 −800 |
| Soil heat flux (W/m2) | HFP01 | Hukseflux | −20, −200, −800 |
| Groundwater level (cm) | Submersible Depth Transmitter | Stevens | −880 |
| Depth (cm) | Average Temperature (°C) | Minimum Temperature (°C) | Maximum Temperature (°C) | Standard Deviation (°C) | Coefficient of Variation |
|---|---|---|---|---|---|
| 2 | −2.1 | −12.4 | 15.9 | 6.67 | 0.0246 |
| 10 | −1.5 | −10.1 | 14.0 | 5.90 | 0.0217 |
| 20 | −0.8 | −8.6 | 13.1 | 5.19 | 0.0191 |
| 50 | 0.7 | −5.3 | 10.6 | 4.03 | 0.0147 |
| 100 | 2.7 | −1.7 | 11.9 | 3.66 | 0.0133 |
| 130 | 4.3 | 0.6 | 13.0 | 3.48 | 0.0125 |
| 200 | 6.9 | 3.5 | 14.5 | 3.35 | 0.0120 |
| 400 | 10.7 | 7.9 | 15.4 | 2.43 | 0.0086 |
| 630 | 12 | 10.4 | 14.1 | 1.26 | 0.0044 |
| 660 | 12.1 | 10.7 | 13.8 | 1.06 | 0.0037 |
| 800 | 12.3 | 11.6 | 13.3 | 0.61 | 0.0021 |
| 0 cm | 10 cm | 20 cm | 50 cm | 100 cm | 130 cm | 200 cm | 410 cm | 630 cm | 660 cm | 800 cm |
|---|---|---|---|---|---|---|---|---|---|---|
| 0.907 | 0.918 | 0.906 | 0.887 | 0.754 | 0.912 | 0.957 | 0.919 | 0.914 | 0.915 | 0.906 |
| Depth (cm) | Van Genuchten Model | Empirical Model | |||||
|---|---|---|---|---|---|---|---|
| θr | θs | α | n | m | a | b | |
| 10 | 0.01 | 0.35 | 0.034 | 1.55 | 0.35 | 0.023 | −0.294 |
| 20 | 0.014 | 0.35 | 0.034 | 1.61 | 0.38 | 0.024 | −0.141 |
| Depth (cm) | 19 December 2017 | 9 January 2018 | 5 February 2018 | ||||||
|---|---|---|---|---|---|---|---|---|---|
| θt | θl | θl/θt | θt | θl | θl/θt | θt | θl | θl/θt | |
| 10 | 0.055 | 0.012 | 0.22 | 0.061 | 0.013 | 0.21 | 0.063 | 0.011 | 0.17 |
| 20 | 0.052 | 0.019 | 0.37 | 0.056 | 0.018 | 0.32 | 0.059 | 0.018 | 0.31 |
| 30 | 0.050 | - | - | 0.053 | - | - | 0.055 | - | - |
| 40 | 0.051 | - | - | 0.055 | - | - | 0.056 | - | - |
| 50 | 0.051 | 0.034 | 0.67 | 0.055 | 0.033 | 0.60 | 0.054 | 0.027 | 0.50 |
© 2020 by the authors. Licensee MDPI, Basel, Switzerland. This article is an open access article distributed under the terms and conditions of the Creative Commons Attribution (CC BY) license (http://creativecommons.org/licenses/by/4.0/).
Share and Cite
Zheng, C.; Lu, Y.; Liu, X.; Šimůnek, J.; Zeng, Y.; Shi, C.; Li, H. In-Situ Monitoring and Characteristic Analysis of Freezing-Thawing Cycles in a Deep Vadose Zone. Water 2020, 12, 1261. https://doi.org/10.3390/w12051261
Zheng C, Lu Y, Liu X, Šimůnek J, Zeng Y, Shi C, Li H. In-Situ Monitoring and Characteristic Analysis of Freezing-Thawing Cycles in a Deep Vadose Zone. Water. 2020; 12(5):1261. https://doi.org/10.3390/w12051261
Chicago/Turabian StyleZheng, Ce, Yudong Lu, Xiuhua Liu, Jiří Šimůnek, Yijian Zeng, Changchun Shi, and Huanhuan Li. 2020. "In-Situ Monitoring and Characteristic Analysis of Freezing-Thawing Cycles in a Deep Vadose Zone" Water 12, no. 5: 1261. https://doi.org/10.3390/w12051261
APA StyleZheng, C., Lu, Y., Liu, X., Šimůnek, J., Zeng, Y., Shi, C., & Li, H. (2020). In-Situ Monitoring and Characteristic Analysis of Freezing-Thawing Cycles in a Deep Vadose Zone. Water, 12(5), 1261. https://doi.org/10.3390/w12051261


